
Unraveling Debris-Enhanced Local Scour Patterns around Non-Cylindrical Bridge Piers: Experimental Insights and Innovative Modeling


Abstract
:1. Introduction
2. Experimental Characteristics and Setup Procedures
2.1. Flume Property
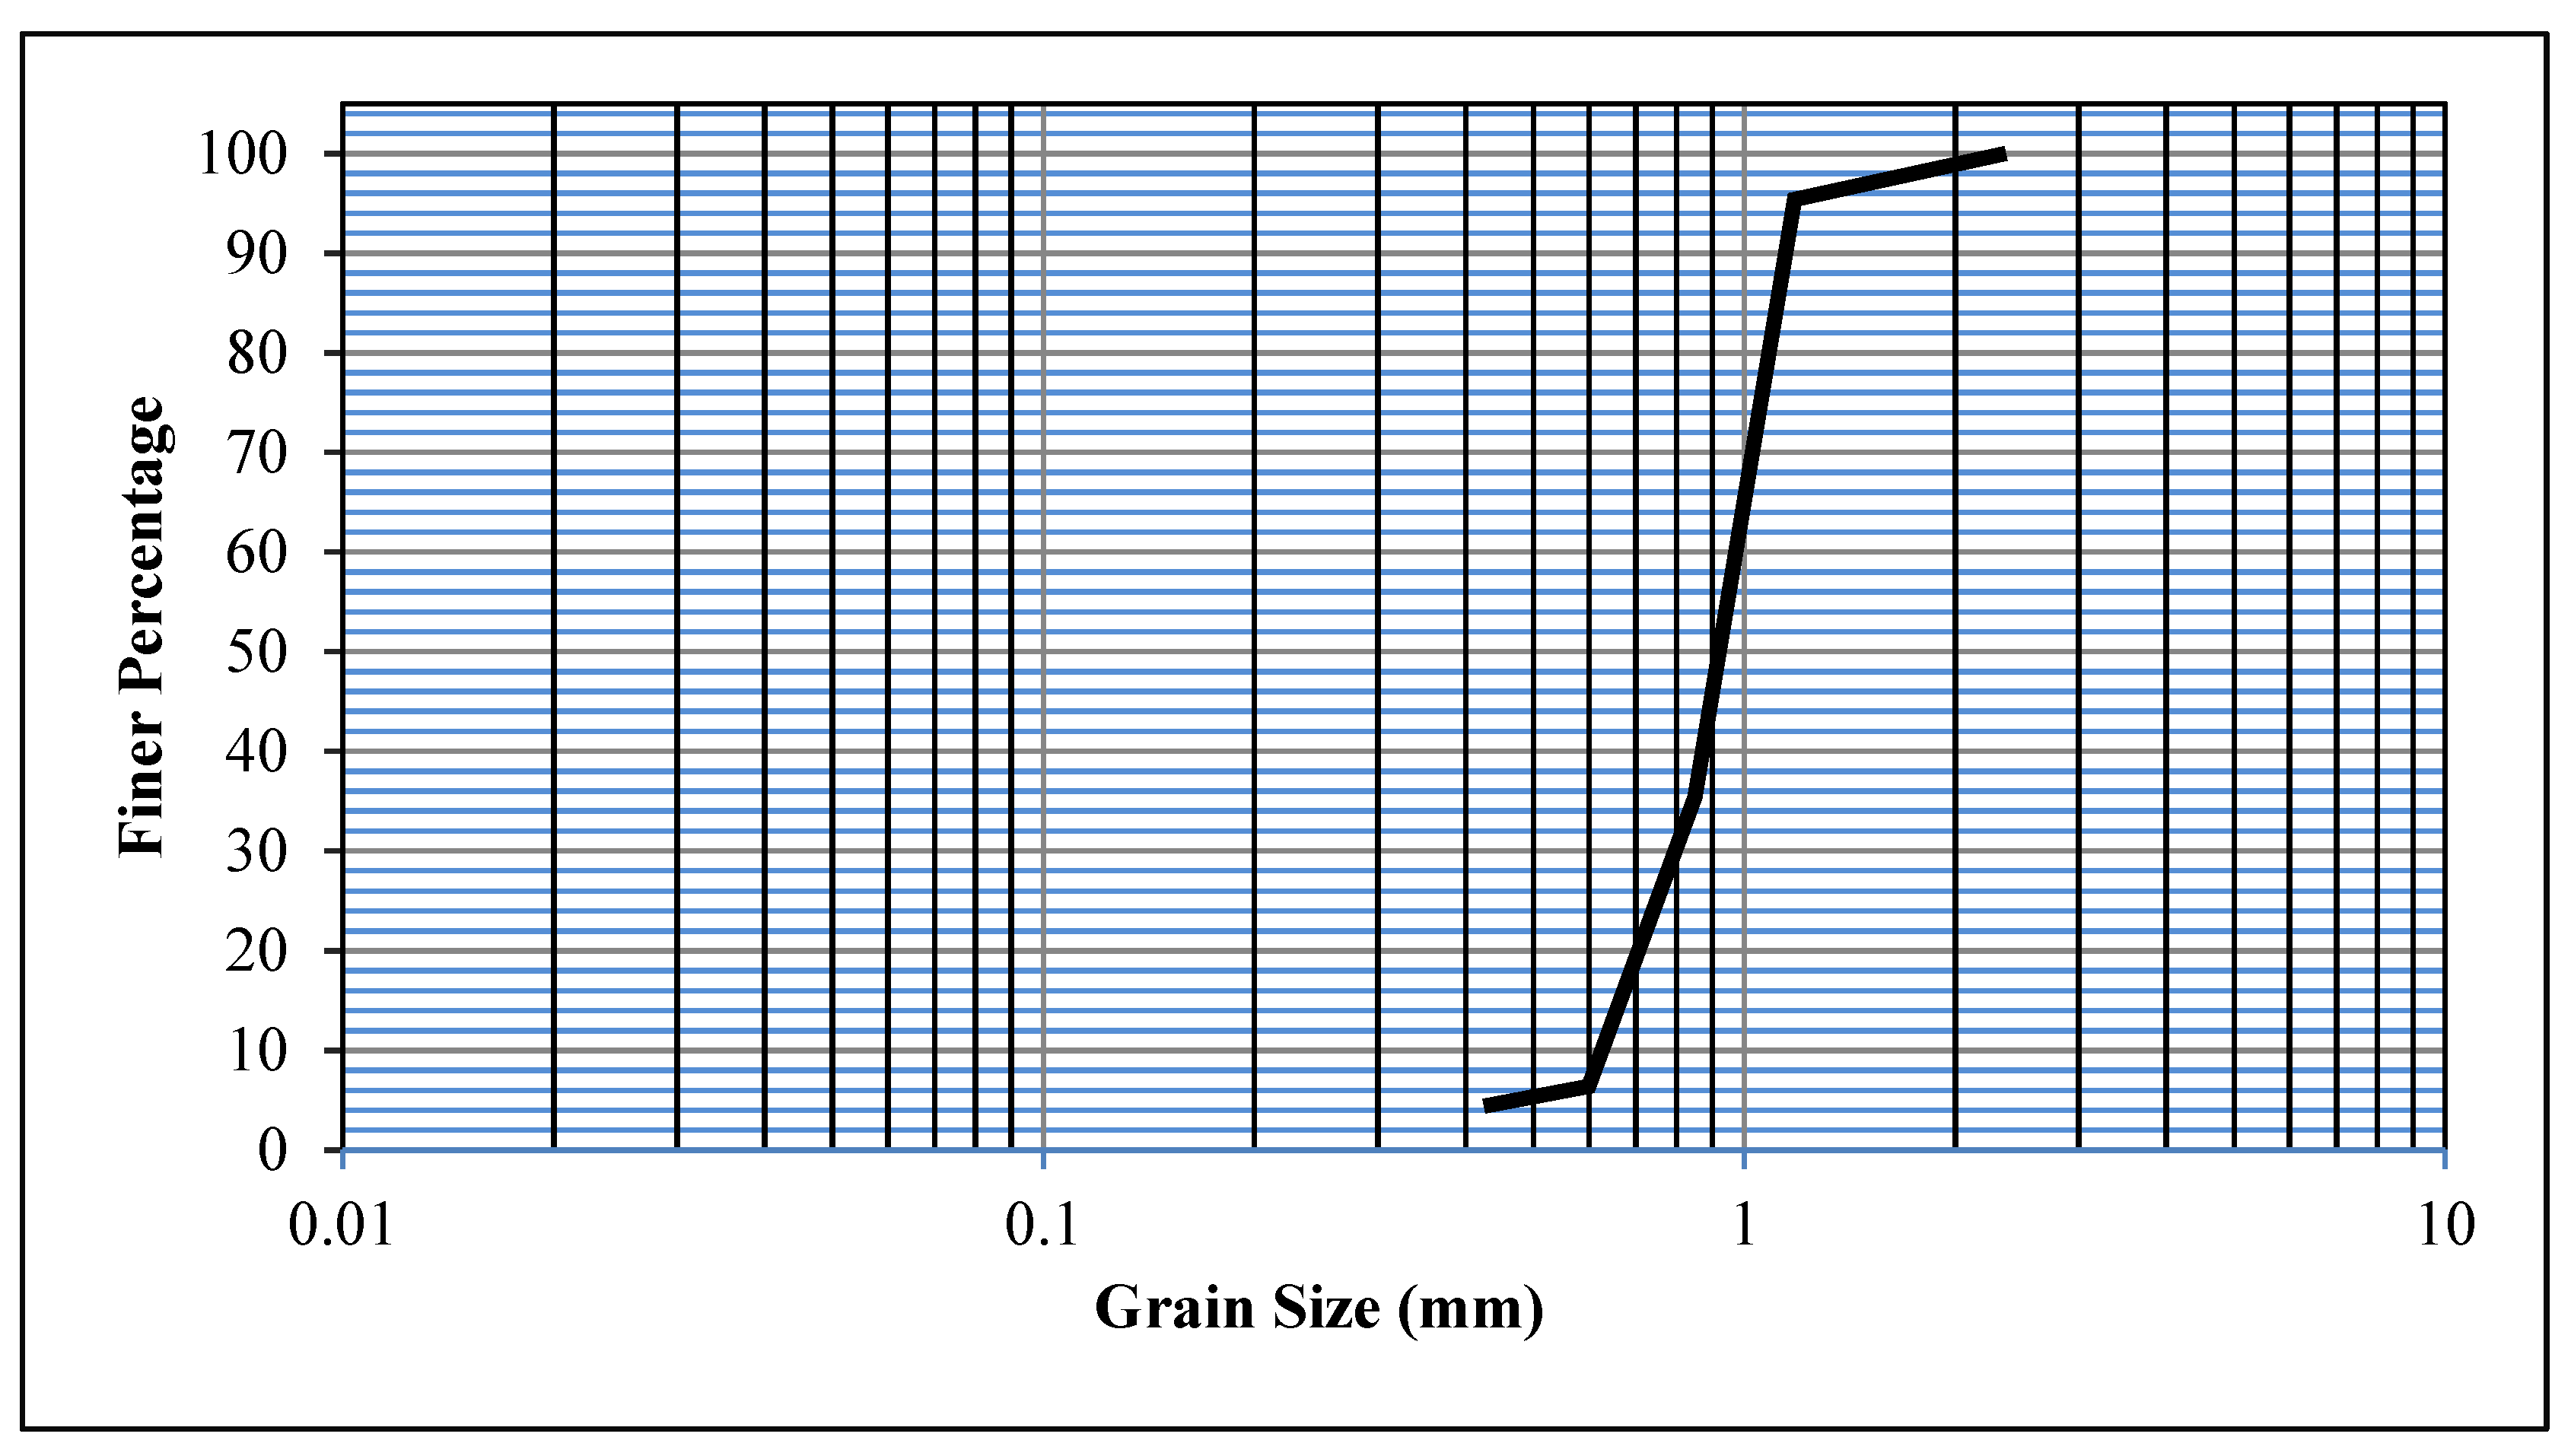
2.2. Sand
2.3. Pier and Debris
2.4. Flow Intensity
2.5. Experimental Procedure and Methodology
3. Results and Discussion
3.1. Scour Depth Correlation with Pier and Debris Geometries
- Elevated risk scenarios: These critical situations posed heightened risks, often occurring during initial flood stages. Concurrently with the flood’s onset, substantial debris transport took place, preceding significant water inflow into the river channel. This escalated the water depth and intensified the debris dispersion, causing particles to travel farther from the riverbed. Consequently, the most significant debris impact on the scour depth and shape was expected at the flood’s outset.
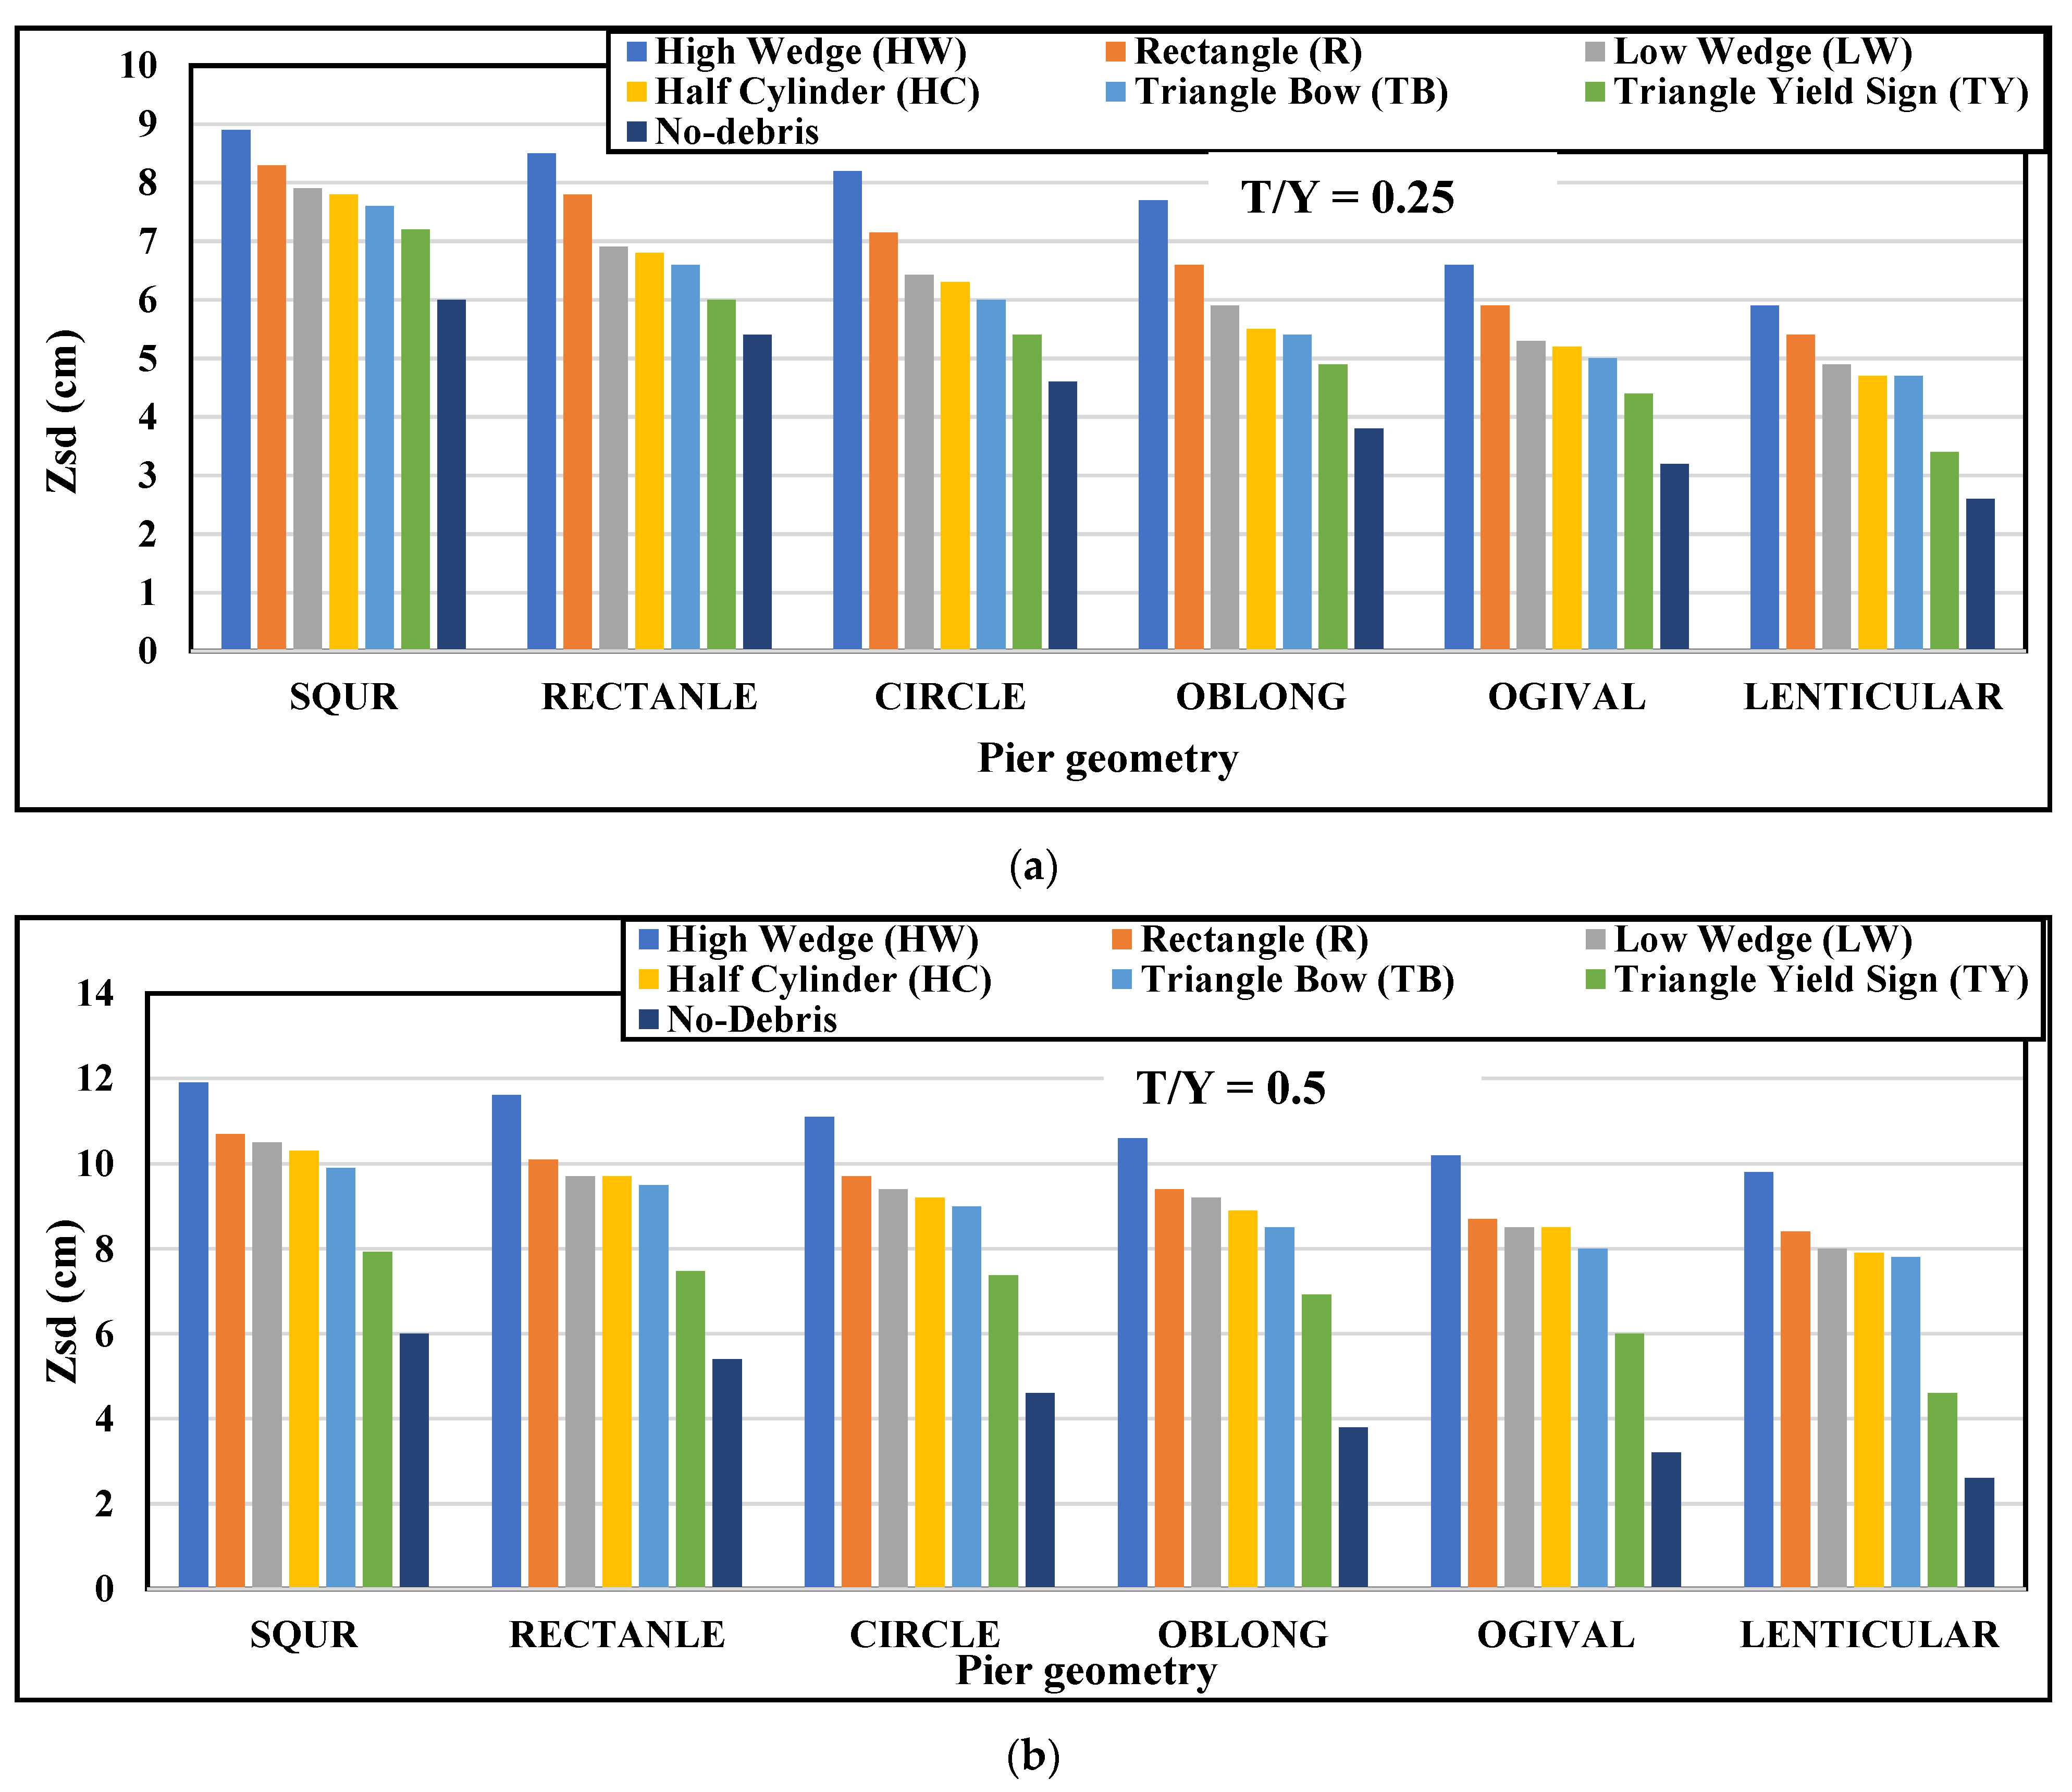
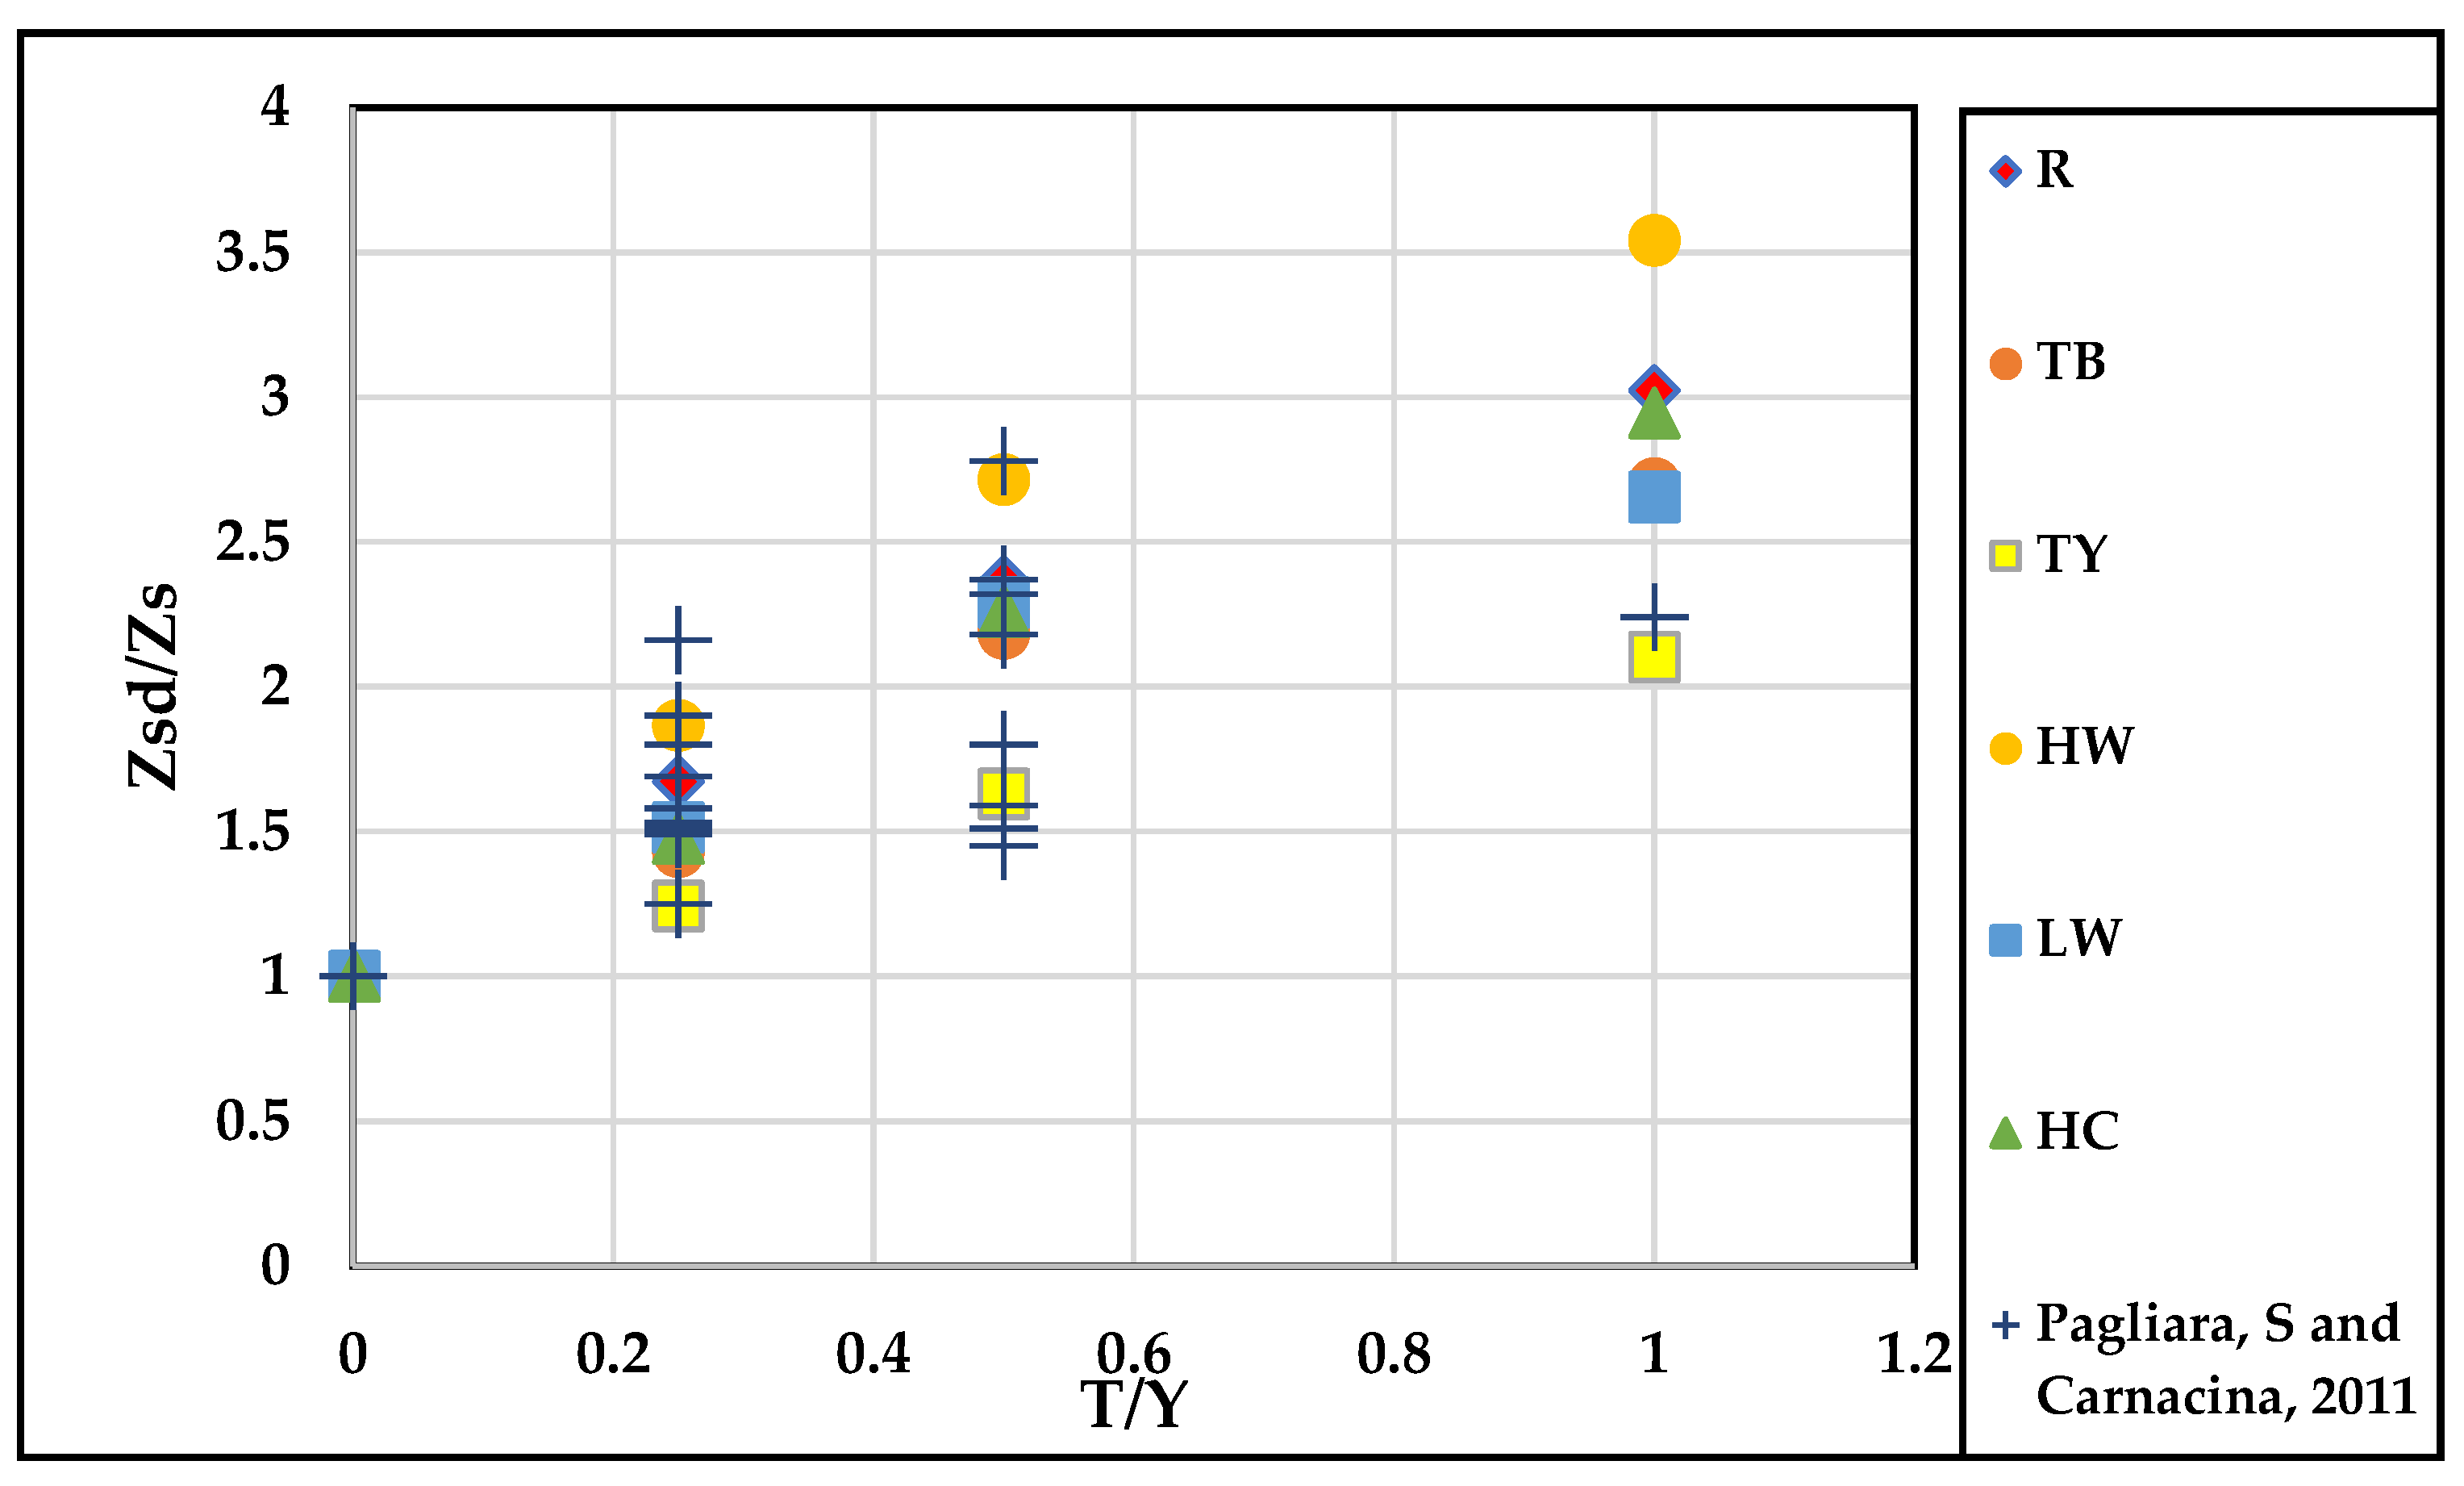
- Depth–scour relationship: A consistent trend emerged with more pronounced debris-induced scour reduction at shallower immersion depths (T/Y = 0.25) compared with greater immersion (T/Y = 0.5, 1). Swift debris accumulation under the flow surface redirected flow profiles toward the bed, intensifying the downward flow. This fostered sediment mobilization, suspension, and elevation.
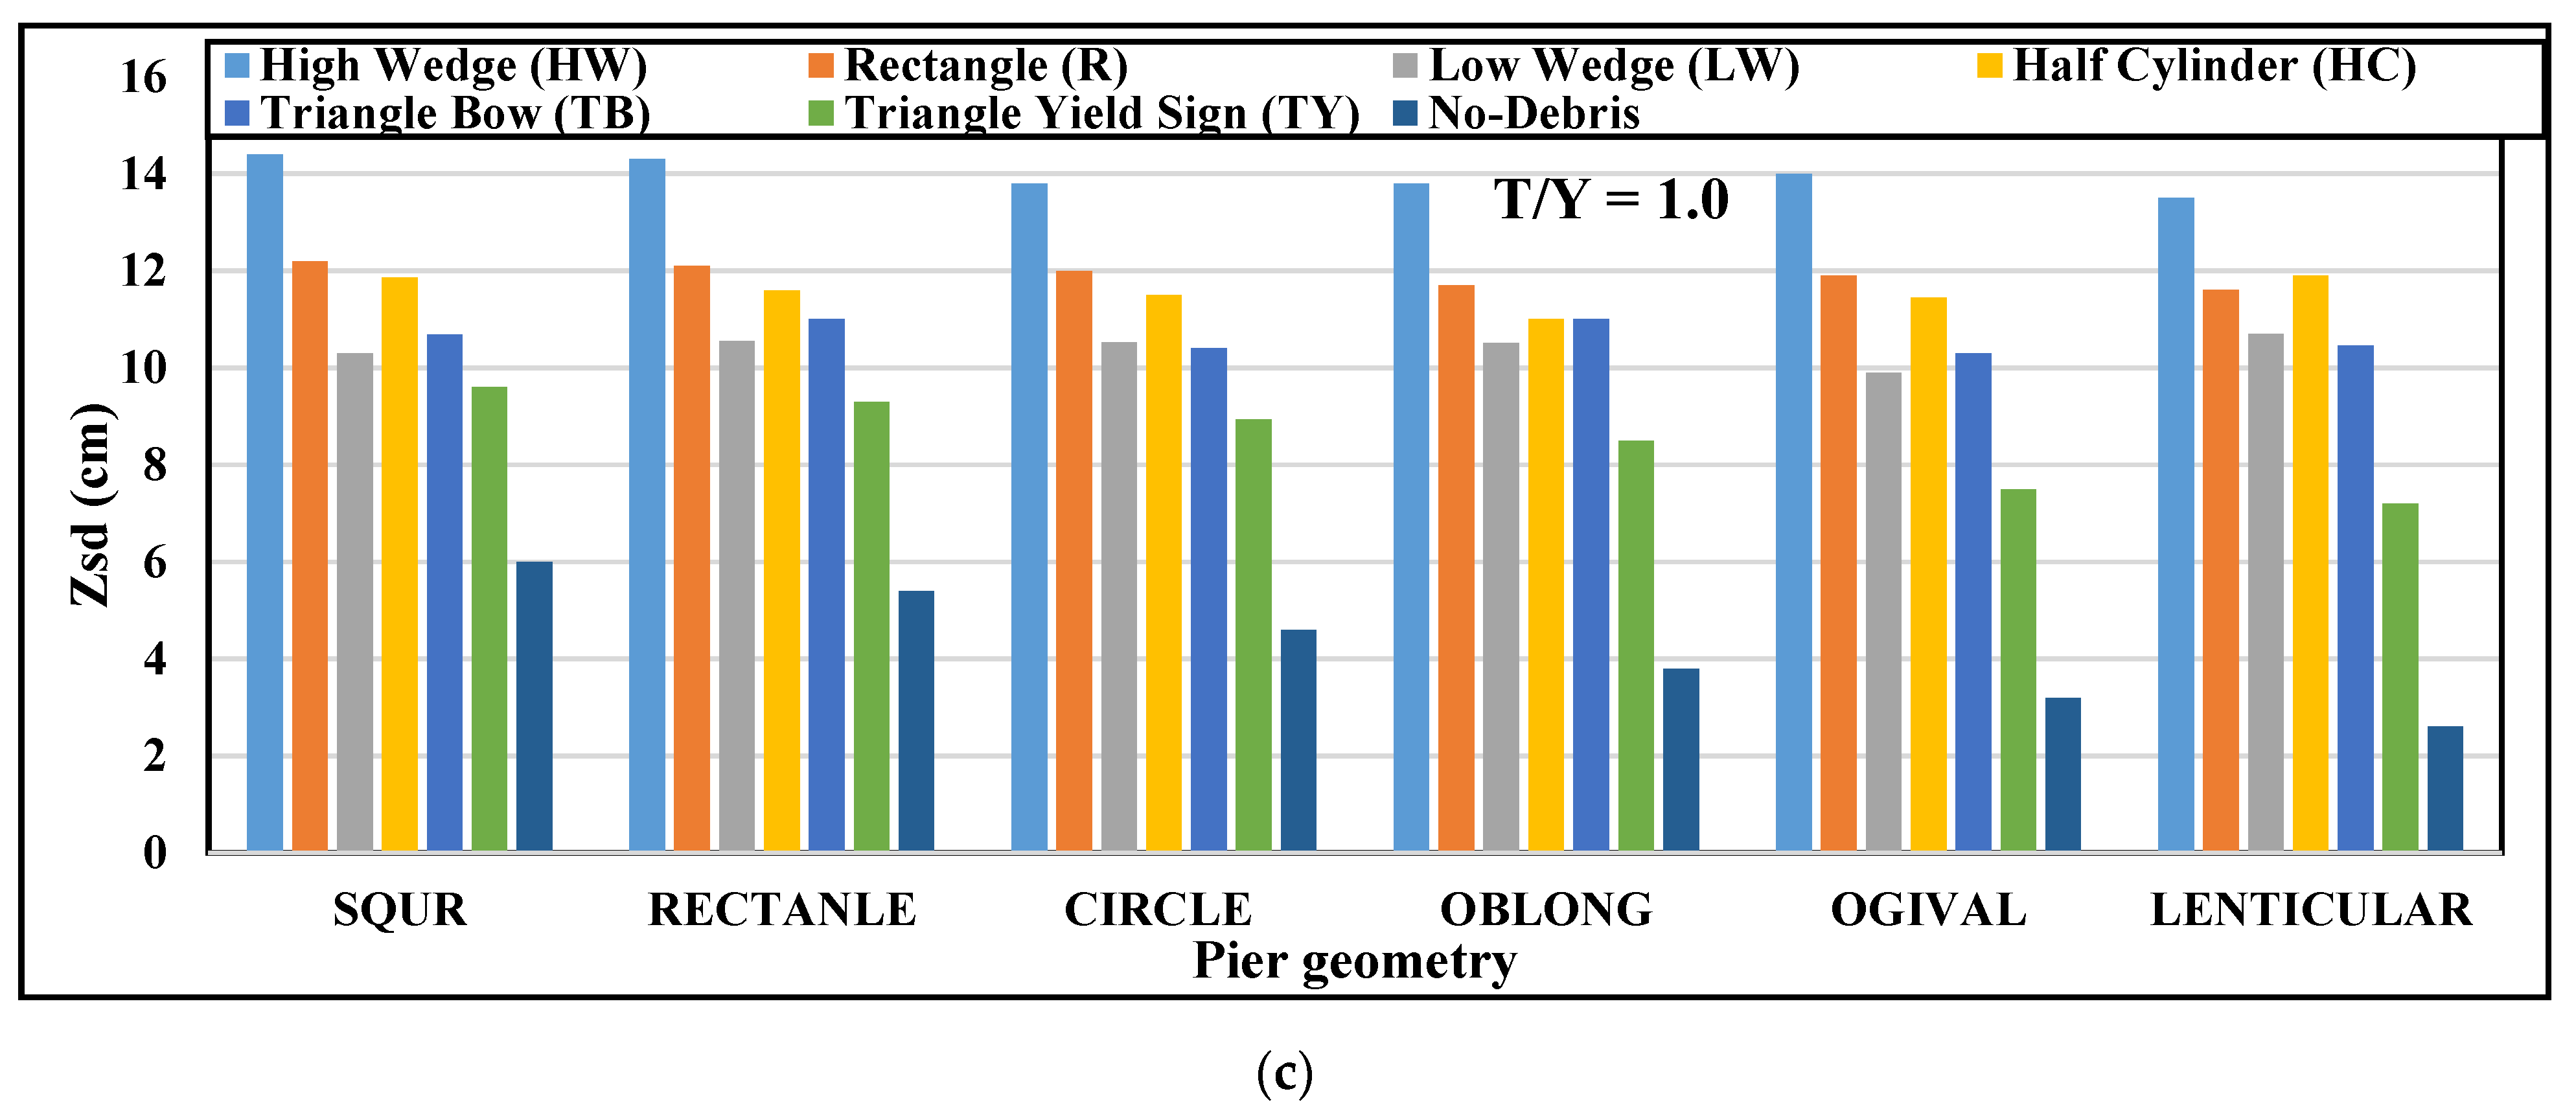
- Complete immersion effect: Outstandingly, complete immersion (T/Y = 1) exhibited heightened variability, particularly with the high wedge debris configuration. In contrast, the distinctions between T/Y = 0.5 and T/Y = 1 for different debris shapes remained relatively subtle. The high wedge’s inherent inclination, imparting a downward curvature to flow, led to increased velocities and horseshoe vortices near the sediment bed.
- Triangular yield configuration: Modest scour depths, irrespective of debris morphology, manifested when the triangular yield configuration was variably positioned at submerged depths. This effect arose from the configuration’s limited obstruction area (A%) and distinct shape. These findings aligned with observations in reference [20], highlighting the capacity of the triangular yield debris to obstruct the flow at shallower angles, thereby reducing the water velocities and bed shear stresses compared with debris shapes of similar thickness but distinct geometries.
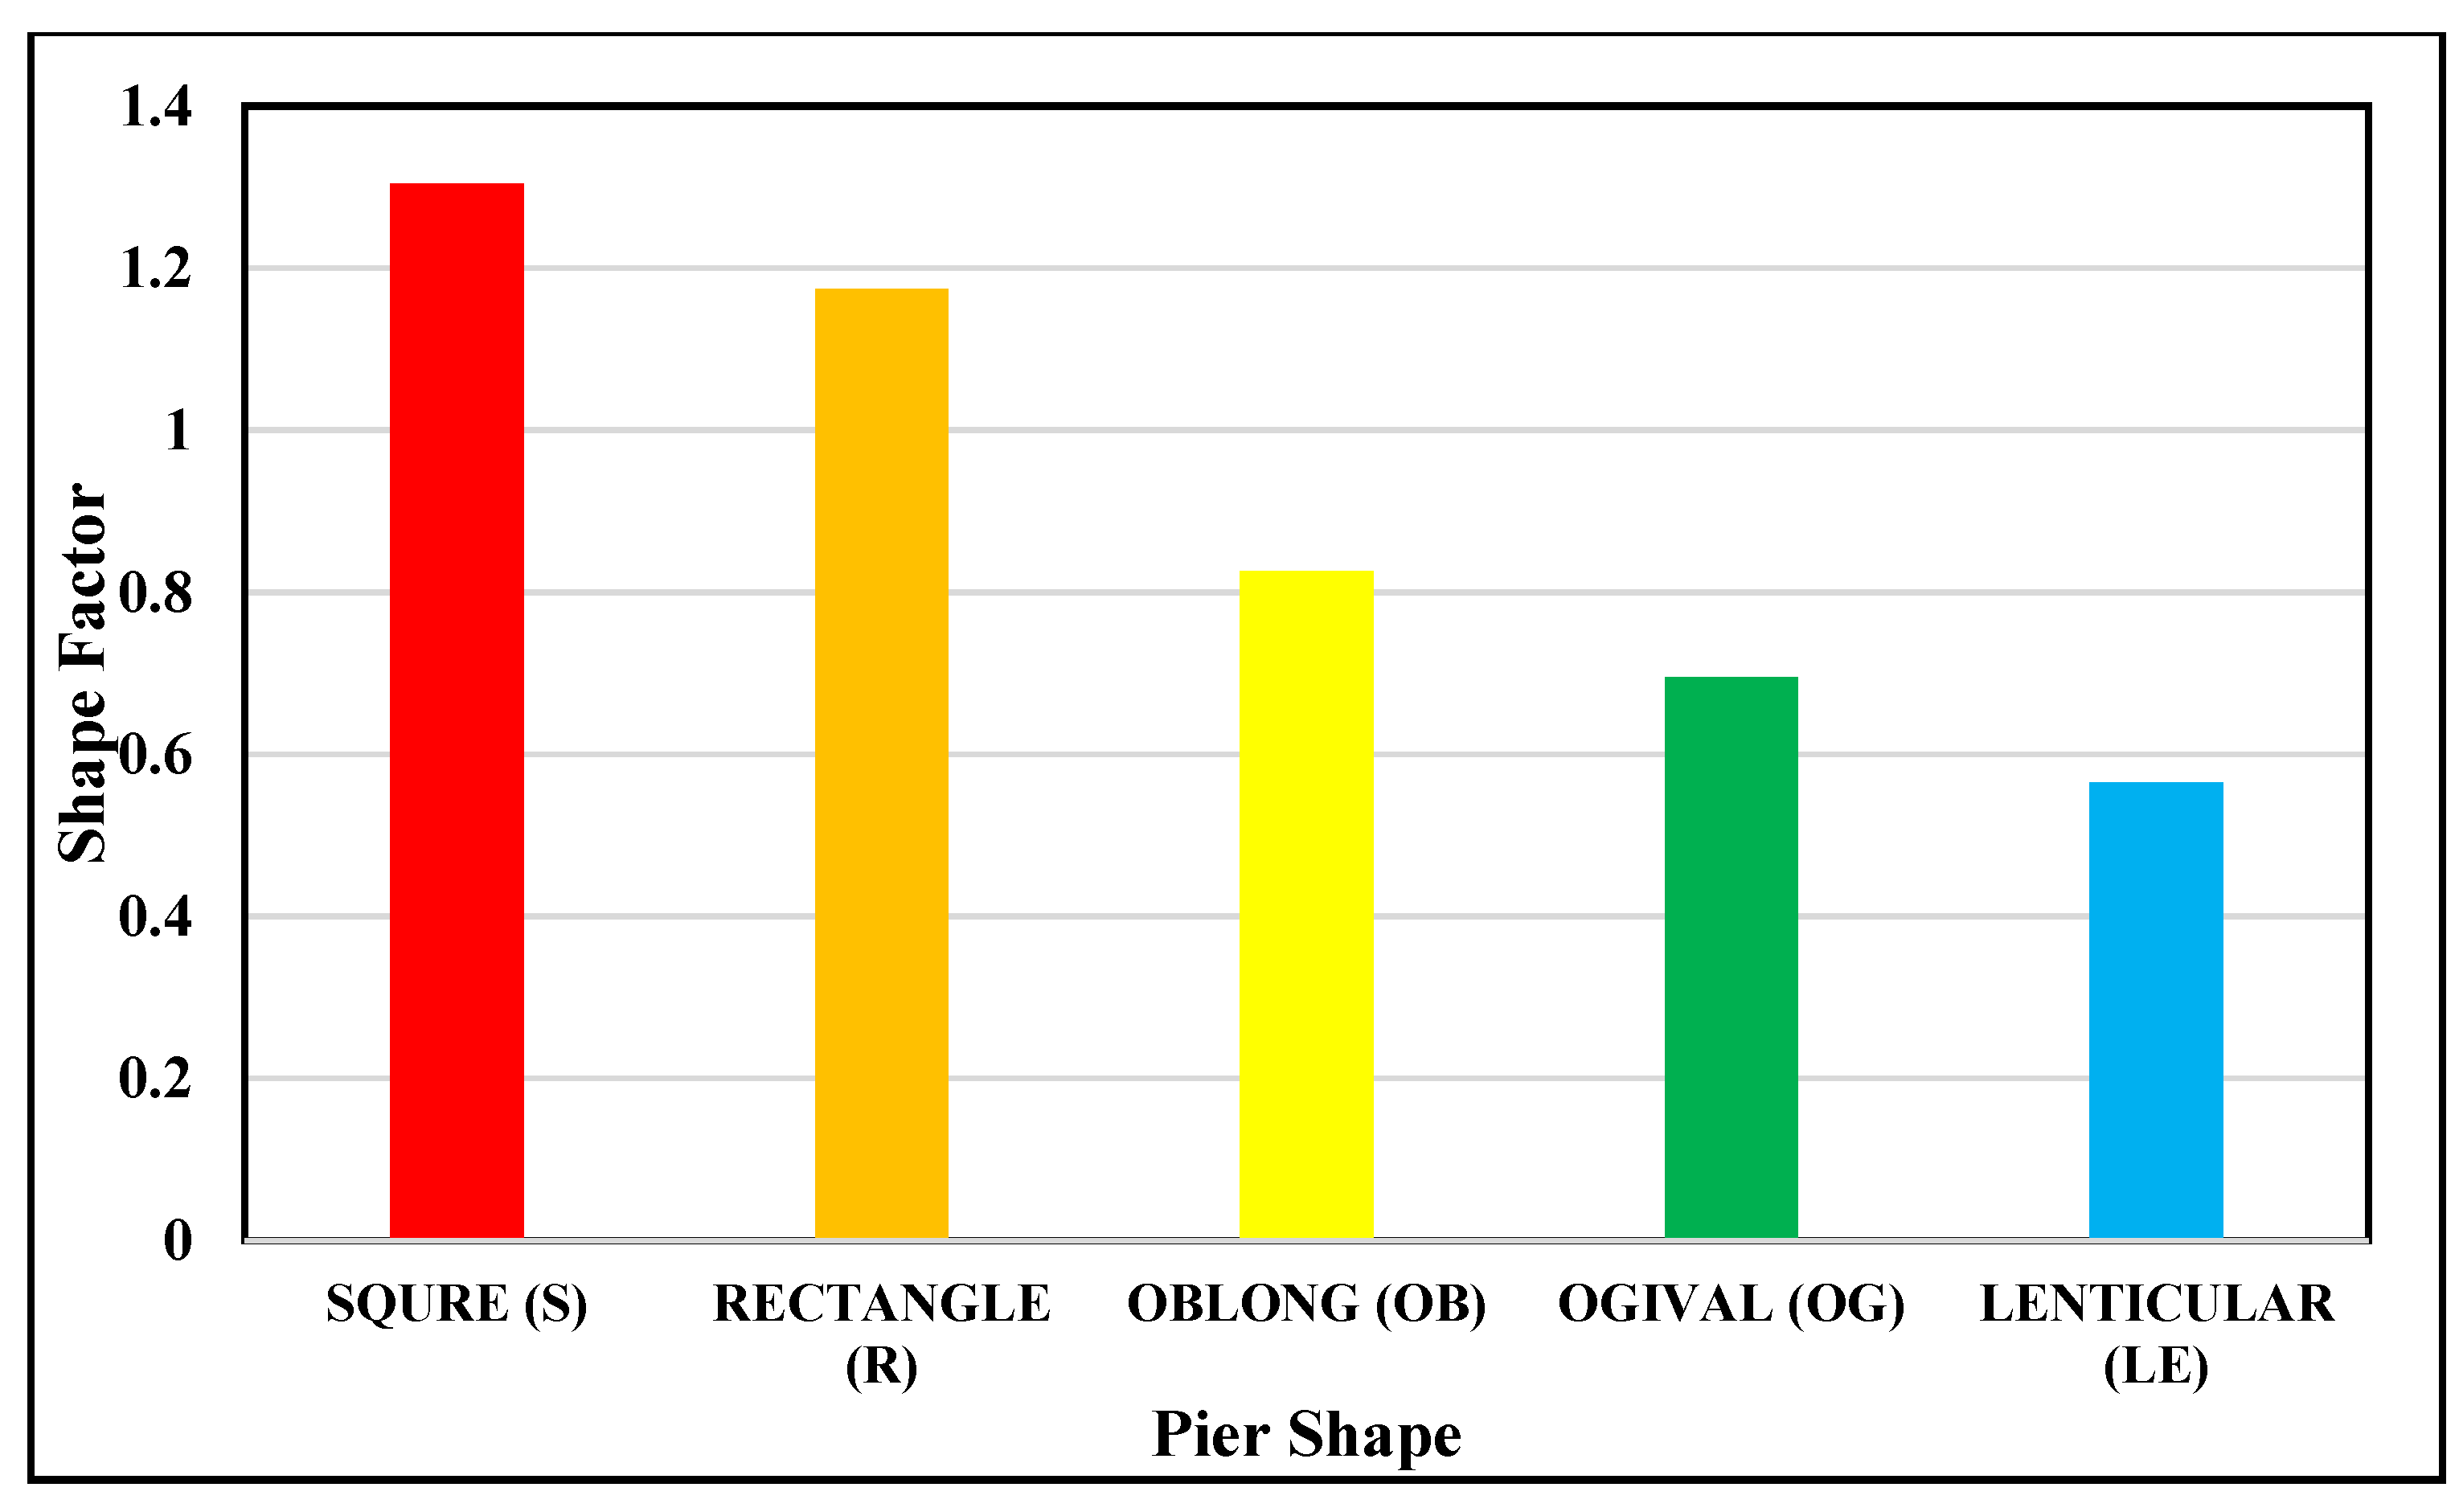
- Shape factor dynamics: Variability in shape factor disparities among different pier geometries diminished as the debris immersion depth increased from 0.25 to 1. This trend suggests the potential for the shape factor influence to decrease at maximum submersion levels. A comprehensive exploration of this phenomenon is deferred to forthcoming discussions, focusing on an in-depth examination of shape factors.
3.2. Debris Impact on Pier Shape Factor
3.3. Effect of Debris Thickness on the Maximum Scour Depth
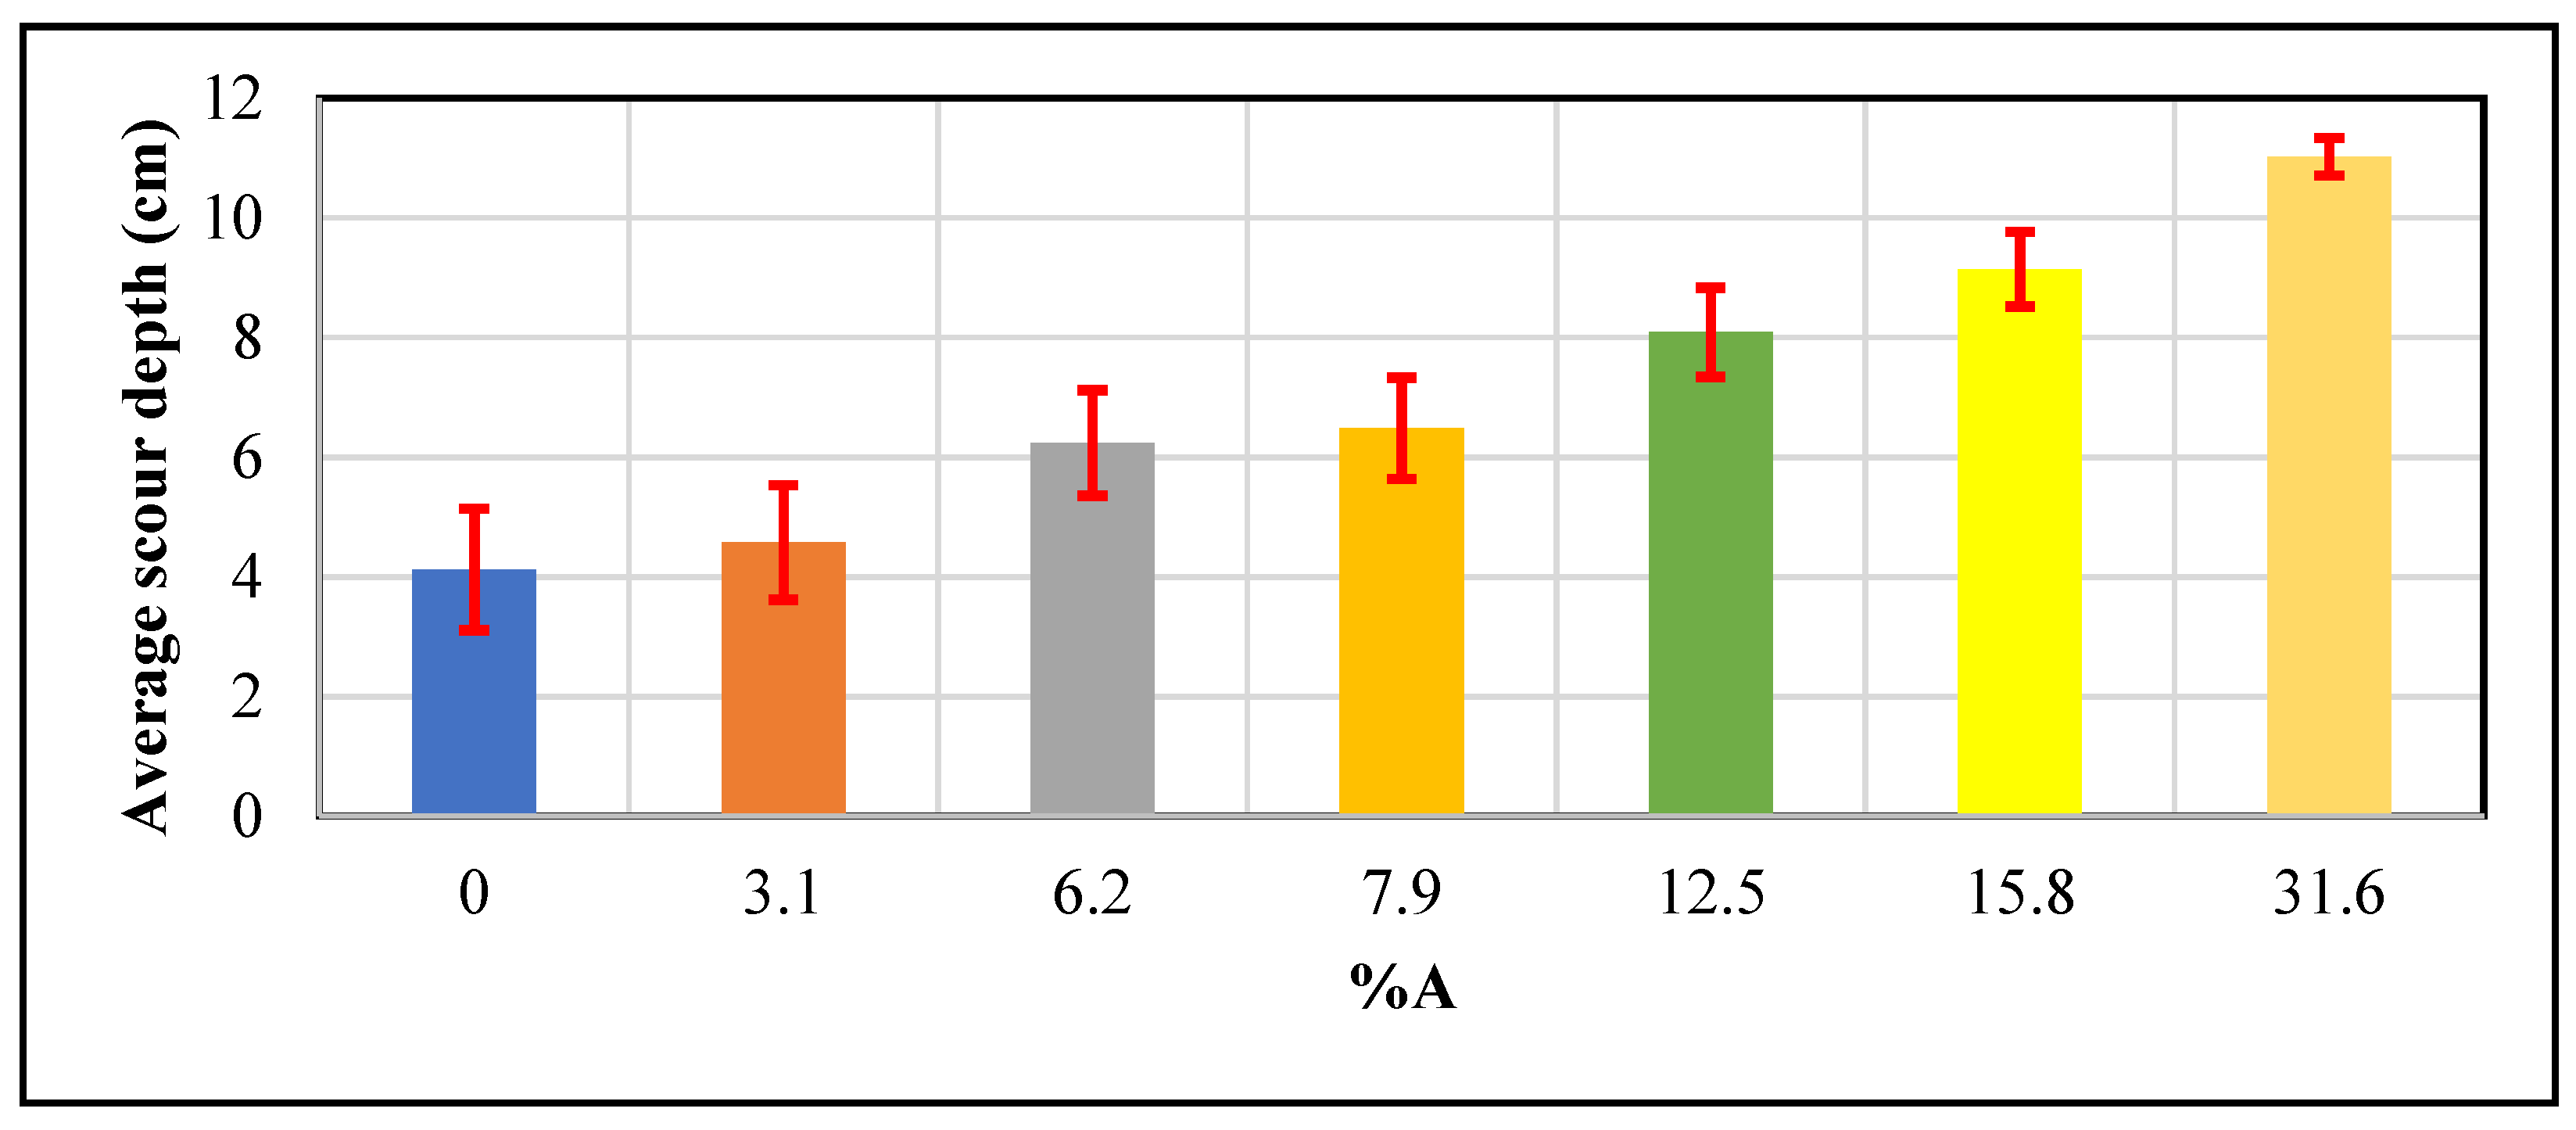
3.4. Effect of Debris Block Ratio (A%) on the Maximum Scour Depth
3.5. Validation of the New Equation
4. Conclusions
- The study explored various pier shapes’ influence on scour depth.
- The square pier exhibited the deepest scour depth, which was approximately 66.7% higher than that of the lenticular pier.
- Debris positioned closer to the bed bottom induced greater scour depths with an average 32.5% increase in scour depth.
- The block ratio parameter increased, and the differences in scour depth between various pier designs and debris configurations diminished gradually regardless of the pier and debris shapes, with only minor distinctions.
- A novel mathematical formulation was introduced for predicting scour depth.
- The equation considered shape factor parameters for diverse pier geometries and debris shapes with superior accuracy and predictive consistency (R2 = 88%).
- Asymmetrical bell curve clustering around the mean highlighted the role of stochastic elements in scour outcomes. The residual values ranged from 0 to 0.6, indicating mild overestimation. Statistical metrics confirmed Equation (4) accurately reproduced real-world scour behavior.
5. Limitation and Further Research
- Limited experimental data: The study’s findings were based on a relatively restricted dataset of pier shapes and debris types. While this dataset was utilized for evaluating the new equation, it is important to recognize that there may be additional variables and scenarios not accounted for in this study. Further research should consider a broader spectrum of data to enhance the comprehensiveness of predictive models.
- Inherent field study limitations: Despite employing sophisticated equipment and robust data-gathering techniques, it is essential to acknowledge that all field studies inherently possess certain limitations. Variability in environmental conditions, site-specific circumstances, and the inherent accuracy of measurement equipment can introduce uncertainties into the study. These uncertainties should be carefully considered when applying the research findings to practical scenarios.
- Measurement uncertainty: The measurements obtained during the experimental phase represent a significant source of uncertainty. Despite meticulous efforts to ensure precision, field instruments may inherently possess limitations in sensitivity and accuracy. These limitations may result in variations in the collected data, contributing to uncertainty in the analysis. It is crucial to recognize that measurements of the scour depth, flow velocity, sediment properties, and debris accumulation are all subject to potential errors.
- Stationary debris focus: The study primarily focused on stationary debris and did not account for dynamic debris responses to flow, which may limit the generalizability of the findings to real-world situations. However, it is important to emphasize that the research deliberately concentrated on worst-case scenarios, specifically scenarios involving pre-existing upstream debris. The study aimed to investigate the severe consequences of incrementally increasing debris submergence from 3 cm to 6 cm to 12 cm, with the intention of exploring extreme conditions rather than encompassing the full spectrum of dynamic debris scenarios.
Author Contributions
Funding
Institutional Review Board Statement
Informed Consent Statement
Data Availability Statement
Conflicts of Interest
References
- Melville, B.W. Local Scour at Bridge Sites; Researchspace: Auckland, New Zealand, 1975. [Google Scholar]
- Melville, B.W.; Raudkivi, A.J. Flow characteristics in local scour at bridge piers. J. Hydraul. Res. 1977, 15, 373–380. [Google Scholar] [CrossRef]
- Ettema, R.; Melville, B.W.; Barkdoll, B. Scale effect in pier-scour experiments. J. Hydraul. Eng. 1998, 124, 639–642. [Google Scholar] [CrossRef]
- Melville, B.W.; Coleman, S.E. Bridge Scour; Water Resources Publication: Littleton, CO, USA, 2000. [Google Scholar]
- Muzzammil, M.; Gangadhariah, T. The mean characteristics of horseshoe vortex at a cylindrical pier. J. Hydraul. Res. 2003, 41, 285–297. [Google Scholar] [CrossRef]
- Oliveto, G.; Hager, W.H. Further results to time-dependent local scour at bridge elements. J. Hydraul. Eng. 2005, 131, 97–105. [Google Scholar] [CrossRef]
- Elsebaie, I.H. An experimental study of local scour around circular bridge pier in sand soil. Int. J. Civ. Environ. Eng. IJCEE-IJENS 2013, 13, 23–28. [Google Scholar]
- Chang, F.F.M.; Shen, H.W. Debris problems in the river environment. Federal Highway Administration Engineering Research and Development Bureau. 1979. Available online: https://trid.trb.org/view/149584 (accessed on 3 October 2023).
- Diehl, T.H. Potential Drift Accumulation at Bridges, Report FHWA-RD-97-028; U.S. Department of Transportation, Federal Highway Administration: Washington DC, USA, 1997.
- Parola, A.C.; Apelt, C.J.; Jempson, M.A. Debris Forces on Highway Bridges; no. 445; Transportation Research Board: Washington, DC, USA, 2000. [Google Scholar]
- May, R.W.P.; Ackers, J.C.; Kirby, A.M. Manual on Scour at Bridges and Other Hydraulic Structures; Ciria: London, UK, 2002; Volume 551. [Google Scholar]
- Melbourne, C.; McKibbins, L.D.; Sawar, N.; Gaillard, C.S. Masonry Arch Bridges: Condition Appraisal and Remedial Treatment; Ciria: London, UK, 2006. [Google Scholar]
- Arneson, L.A. Evaluating Scour at Bridges; United States Federal Highway Administration: Washington, DC, USA, 2013.
- Tison, L.J. Local scour in rivers. J. Geophys. Res. 1961, 66, 4227–4232. [Google Scholar] [CrossRef]
- Breusers, H.N.C.; Nicollet, G.; Shen, H.W. Local scour around cylindrical piers. J. Hydraul. Res. 1977, 15, 211–252. [Google Scholar] [CrossRef]
- Fael, C.; Lança, R.; Cardoso, A. Pier shape and alignment effects on local scour. In Proceedings of the SHF Conference: Small Scale Morphological Evolution of Costal, Estuarine and River Systems; Societe Hydrotecnique de France: Paris, France, 2014; pp. 1–4. [Google Scholar]
- Panici, D.; Kripakaran, P.; Djordjević, S.; Dentith, K. A practical method to assess risks from large wood debris accumulations at bridge piers. Sci. Total Environ. 2020, 728, 138575. [Google Scholar] [CrossRef]
- Panici, D.; de Almeida, G.A.M. Influence of pier geometry and debris characteristics on wood debris accumulations at bridge piers. J. Hydraul. Eng. 2020, 146, 4020041. [Google Scholar] [CrossRef]
- Melville, B.W.; Dongol, D.M. Bridge pier scour with debris accumulation. J. Hydraul. Eng. 1992, 118, 1306–1310. [Google Scholar] [CrossRef]
- Pagliara, S.; Carnacina, I. Influence of wood debris accumulation on bridge pier scour. J. Hydraul. Eng. 2011, 137, 254–261. [Google Scholar] [CrossRef]
- Palermo, M.; Pagliara, S.; Roy, D. Effect of debris accumulation on scour evolution at bridge pier in bank proximity. J. Hydrol. Hydromech. 2021, 69, 108–118. [Google Scholar] [CrossRef]
- Lagasse, P.F.; Zevenbergen, L.W.; Clopper, P.E. Impacts of debris on bridge pier scour. Scour Eros. 2010, 854–863. [Google Scholar] [CrossRef]
- Ebrahimi, M.; Kripakaran, P.; Prodanović, D.M.; Kahraman, R.; Riella, M.; Tabor, G. Experimental study on scour at a sharp-nose bridge pier with debris blockage. J. Hydraul. Eng. 2018, 144, 4018071. [Google Scholar] [CrossRef]
- Rahimi, E.; Qaderi, K.; Rahimpour, M.; Ahmadi, M.M. Effect of debris on piers group scour: An experimental study. KSCE J. Civ. Eng. 2018, 22, 1496–1505. [Google Scholar] [CrossRef]
- Pagliara, S.; Carnacina, I. Influence of large woody debris on sediment scour at bridge piers. Int. J. Sediment Res. 2011, 26, 121–136. [Google Scholar] [CrossRef]
- Oliveto, G.; Hager, W.H. Temporal evolution of clear-water pier and abutment scour. J. Hydraul. Eng. 2002, 128, 811–820. [Google Scholar] [CrossRef]
- Raudkivi, A.J. Functional trends of scour at bridge piers. J. Hydraul. Eng. 1986, 112, 1–13. [Google Scholar] [CrossRef]
- Lee, S.O.; Sturm, T.W. Effect of sediment size scaling on physical modeling of bridge pier scour. J. Hydraul. Eng. 2009, 135, 793–802. [Google Scholar] [CrossRef]
- Bonakdari, H.; Lipeme-Kouyi, G.; Asawa, G.L. Developing turbulent flows in rectangular channels: A parametric study. J. Appl. Res. Water Wastewater 2014, 1, 51–56. [Google Scholar]
- Kirkil, G.; Constantinescu, S.G.; Ettema, R. Coherent structures in the flow field around a circular cylinder with scour hole. J. Hydraul. Eng. 2008, 134, 572–587. [Google Scholar] [CrossRef]
- Richardson, E.V.; Davis, S.R. Evaluating Scour at Bridges; United States Federal Highway Administration, Office of Technology Applications: Washington, DC, USA, 1995.
- Raikar, R.V.; Dey, S. Maximum scour depth at piers in armor-beds. KSCE J. Civ. Eng. 2009, 13, 137–142. [Google Scholar] [CrossRef]
- Yalin, M.S. 1977: Mechanics of Sediment Transport; Pergamon Press: New York, NY, USA, 1972. [Google Scholar]
- Zevenbergen, L.W.; Lagasse, P.F.; Clopper, P.E. Effects of Debris on Bridge Pier Scour; The National Academies Press: Washington, DC, USA, 2010; pp. 1–10. [Google Scholar]
- Sheppard, D.M.; Melville, B.; Demir, H. Evaluation of existing equations for local scour at bridge piers. J. Hydraul. Eng. 2014, 140, 14–23. [Google Scholar] [CrossRef]
- Neill, C.R. Mean-velocity criterion for scour of coarse uniform bed-material. In Proceedings of the 12th Congress of the International Association of Hydraulics Research, Tokyo, Japan, 11–14 September 1967; Volume 3, pp. 46–54. [Google Scholar]
- Van Rijn, L.C.; Nieuwjaar, M.W.C.; van der Kaay, T.; Nap, E.; van Kampen, A. Transport of fine sands by currents and waves. J. Waterw. Port Coast. Ocean Eng. 1993, 119, 123–143. [Google Scholar] [CrossRef]
- Ting, F.C.K.; Briaud, J.-L.; Chen, H.C.; Gudavalli, R.; Perugu, S.; Wei, G. Flume tests for scour in clay at circular piers. J. Hydraul. Eng. 2001, 127, 969–978. [Google Scholar] [CrossRef]
- Sarker, M.A. Flow measurement around scoured bridge piers using Acoustic-Doppler Velocimeter (ADV). Flow Meas. Instrum. 1998, 9, 217–227. [Google Scholar] [CrossRef]
- Breusers, H.N.C.; Raudkivi, A.J. Scouring; Balkema Rotterdam: Rotterdam, The Netherlands, 1991. [Google Scholar]
- Melville, B.W.; Chiew, Y.-M. Time scale for local scour at bridge piers. J. Hydraul. Eng. 1999, 125, 59–65. [Google Scholar] [CrossRef]
- Zhao, M.; Cheng, L.; Zang, Z. Experimental Investigation of Local Scour Around a Submerged Vertical Circular Cylinder in Steady Currents. In Proceedings of the International Conference on Offshore Mechanics and Arctic Engineering, Honolulu, HI, USA, 31 May–6 June 2009; pp. 139–145. [Google Scholar]
- Melville, B.W. Pier and abutment scour: Integrated approach. J. Hydraul. Eng. 1997, 123, 125–136. [Google Scholar] [CrossRef]
- Laursen, E.M.; Toch, A. Scour around Bridge Piers and Abutments; Iowa Highway Research Board Ames: Ames, IA, USA, 1956; Volume 4. [Google Scholar]
- Hoffmans, G.J.C.M.; Verheij, H.J. Scour Manual; CRC Press: Boca Raton, FL, USA, 1997; Volume 96. [Google Scholar]
- Richardson, E.V.; Davies, S.R. Evaluating Scour at Bridge Pier; FHWA NHI: Washington, DC, USA, 2001; p. 1. [Google Scholar]
- Melville, B.W.; Sutherland, A.J. Design method for local scour at bridge piers. J. Hydraul. Eng. 1988, 114, 1210–1226. [Google Scholar] [CrossRef]


| Pier Shape | Debris Shape | Symbol | T/Y | A% |
|---|---|---|---|---|
| Cylindrical (C) | Rectangular (R) | C-R-1 | 0.25 | 7.9 |
| C-R-2 | 0.5 | 15.8 | ||
| C-R-3 | 1 | 31.6 | ||
| Triangle bow (TB) | C-TB-1 | 0.25 | 7.9 | |
| C-TB-2 | 0.5 | 15.8 | ||
| C-TB-3 | 1 | 31.6 | ||
| High wedge (HW) | C-HW-1 | 0.25 | 7.9 | |
| C-HW-2 | 0.5 | 15.8 | ||
| C-HW-3 | 1 | 31.6 | ||
| Low wedge (LW) | C-LW-1 | 0.25 | 7.9 | |
| C-LW-2 | 0.5 | 15.8 | ||
| C-LW-3 | 1 | 31.6 | ||
| Half cylinder (HC) | C-HC-1 | 0.25 | 7.9 | |
| C-HC-2 | 0.5 | 15.8 | ||
| C-HC-3 | 1 | 31.6 | ||
| Triangle yield sign (TY) | C-TY-1 | 0.25 | 3.1 | |
| C-TY-2 | 0.5 | 6.2 | ||
| C-TY-3 | 1 | 12.5 |
| Q (m3/s) | Y (m) | V (m/s) | Vc (m/s) | V/Vc (m/s) | Re | Fr | u* (m/s) | Re* |
|---|---|---|---|---|---|---|---|---|
| 0.012 | 0.12 | 0.29 | 0.32 | 0.91 | 626400 | 0.27 | 0.022 | 87 |
Disclaimer/Publisher’s Note: The statements, opinions and data contained in all publications are solely those of the individual author(s) and contributor(s) and not of MDPI and/or the editor(s). MDPI and/or the editor(s) disclaim responsibility for any injury to people or property resulting from any ideas, methods, instructions or products referred to in the content. |
© 2023 by the authors. Licensee MDPI, Basel, Switzerland. This article is an open access article distributed under the terms and conditions of the Creative Commons Attribution (CC BY) license (https://creativecommons.org/licenses/by/4.0/).
Share and Cite
Al-Jubouri, M.; Ray, R.P.; Al-Khafaji, M.S. Unraveling Debris-Enhanced Local Scour Patterns around Non-Cylindrical Bridge Piers: Experimental Insights and Innovative Modeling. Sustainability 2023, 15, 15910. https://doi.org/10.3390/su152215910
Al-Jubouri M, Ray RP, Al-Khafaji MS. Unraveling Debris-Enhanced Local Scour Patterns around Non-Cylindrical Bridge Piers: Experimental Insights and Innovative Modeling. Sustainability. 2023; 15(22):15910. https://doi.org/10.3390/su152215910
Chicago/Turabian StyleAl-Jubouri, Muhanad, Richard P. Ray, and Mahmoud Saleh Al-Khafaji. 2023. "Unraveling Debris-Enhanced Local Scour Patterns around Non-Cylindrical Bridge Piers: Experimental Insights and Innovative Modeling" Sustainability 15, no. 22: 15910. https://doi.org/10.3390/su152215910
APA StyleAl-Jubouri, M., Ray, R. P., & Al-Khafaji, M. S. (2023). Unraveling Debris-Enhanced Local Scour Patterns around Non-Cylindrical Bridge Piers: Experimental Insights and Innovative Modeling. Sustainability, 15(22), 15910. https://doi.org/10.3390/su152215910