Abstract
Green supply chain management is a crucial way to balance economic benefits and environmental impacts. As an important economic aquatic product in China, sea cucumber (Apostichopus japonicus) is facing the dual challenges of economic benefits (profit) and environmental sustainability (material input and emission output). Currently, the sea cucumber industry in China lacks a green supplier screening system, resulting in a fragmented pattern of cooperation among enterprises. Core enterprises in the supply chain cannot assume social responsibility to help and guide upstream and downstream enterprises to jointly improve environmental performance. This study focuses on the selection and evaluation of green suppliers for sea cucumber processing enterprises. Firstly, a green supplier assessment indicator system for sea cucumber processing enterprises was established, and the indicator weights were determined by the analytic hierarchy process (AHP) method. Next taking a large sea cucumber processing enterprise in Dalian, China, as an example, the importance level of each index was evaluated by fuzzy comprehensive evaluation (FCE), and the score and ranking of existing suppliers were determined. The validity and practicality of the method were verified. The results show that Supplier 1 (S1) has the highest score, and the price of sea cucumber farming, the cleaner production level of sea cucumber farming, environmental awareness, and long-term cooperation willingness were the most important factors in the selection of green suppliers for sea cucumber processing enterprises, which provides useful clues on the best practice of making sustainable development decisions. With an in-depth understanding of the key factors, suppliers can formulate different prices according to the differences in sales channels to improve the economic deficiencies. Environmental pollution can also be reduced by using clean energy, establishing a recirculating aquaculture system, and using micro-ecological preparations. The conclusions of this study can provide technical support and decision-making suggestions for the application of green supply chain management in China’s aquaculture industry.
1. Introduction
Sea cucumber (Apostichopus japonicus) has high nutritional value and is rich in active substances such as acidic mucopolysaccharides, saponins, and peptides. It is a traditional seafood and an important economic aquatic product in China. The sea cucumber industry has formed a complete supply chain system including seed breeding, aquaculture, processing, warehousing, transport, and sales. Seed breeding enterprises, as suppliers, mainly provide high-quality seedlings for sea cucumber breeding enterprises, which is the prerequisite for breeding enterprises to achieve normal breeding production. Farming enterprises, as producers, culture fresh sea cucumbers that can be supplied to sea cucumber processing enterprises to improve the economic value of sea cucumbers through deep processing. Processing enterprises, as processors, mainly carry out simple treatment, deep processing, and storage of sea cucumber products, using methods such as spiral freezing and pickling, to prolong the shelf life of the products and explore their added value [1,2]. In the storage stage, due to the perishable nature of sea cucumber products, the controllability of circulation and processing is not high, which requires a good storage environment and product quality control through monitoring equipment at any time [3,4]. During transportation, cold chain transport is employed to connect all links of the supply chain. It is important to ensure the quality and quantity of aquatic products and prevent issues like water seepage, deterioration, damage, and loss [5]. The sellers of sea cucumber products in the consumption stage include large supermarkets, farmers’ markets, boutique shops, and foreign trade exports. They serve as the terminal link of the entire supply chain, directly selling aquatic products to consumers and generating income for the entire supply chain.
Presently, China is the country with the largest sea cucumber farming production in the whole world, producing 222,707 tons in 2021 [6]. It accounts for about 99% of the world’s total output. The global market for sea cucumbers is primarily concentrated in Asia, with a significant consumer base in China, Japan, and Southeast Asian countries. Asia holds the largest share of the dry sea cucumber market, accounting for over 70% in 2018 [7]. Due to the characteristics of “self-melting”, sea cucumbers need to be processed before entering the market for circulation and consumption, which makes processing a key link in the sea cucumber industry chain. In 2018, the proportion of frozen, dried, pickled, salted, or smoked sea cucumbers in China’s export sea cucumbers reached more than half [7]. With the rapid development of China’s sea cucumber industry, resource and environmental problems such as resource and energy consumption, waste discharge, quality risk, and supplier selection in the farming process have gradually become prominent, threatening the long-term sustainability of the industry.
As a new management method, green supply chain management is one of the effective ways for enterprises to balance environmental impact and economic benefit. The green supply chain concept originated from the concept of green procurement proposed in 1994 [8] and was first formally proposed by the Manufacturing Research Association of Michigan State University in 1996 in the course of “environmentally responsible manufacturing” research. A green supply chain prioritizes a reduction in environmental impact in product delivery while also providing excellent customer achievement to achieve a win–win situation for the environment and the economy [9]. Green supply chain management is developed based on traditional supply chain management. Its purpose is to reduce environmental impact and improve resource utilization efficiency through compliance with environmental protection regulations at all stages of the supply chain, from the acquisition of the product to its final disposal after use [10]. As a result, there is a need to implement green supply chain management to improve resource and environmental issues.
In implementing green supply chain management and achieving integrated economic, environmental, and social development, improving the sustainability of financial inputs and suppliers is seen as a strategic responsibility. Green suppliers are in an important position in the upstream of the supply chain. Selecting suitable suppliers as partners is one of the key activities of green supply chain management [11,12] and helps to improve the quality of product production, reduce unnecessary resource loss, and reduce supply chain costs [13]. It plays a vital role in the implementation of green supply chain management and the long-term sustainable development of enterprises [14]. Sarwar et al. [15] propose that green supplier selection is an essential operational function for establishing sustainable partnerships and improving supply chain performance. Tseng [16] pointed out that selecting a suitable green supplier according to green supply chain management criteria is essential for the sustainable development of manufacturing firms. Zhu et al. [17] increasingly focus on the selection of partners in the supply chain in order to promote companies’ environmental management practices. Lima Junior et al. [18] argue that supplier selection has become very critical to the performance of organizations and supply chains. Lakshmanpriya et al. [19] state that selecting the right supplier can be one of the most critical decisions for manufacturing firms and that various companies prioritize green suppliers in their selection process. Verma et al. [20] show that green supplier selection will help in increasing the environmental sustainability of a company. Kang et al. [21] found that the evaluation and selection of green suppliers play a vital role in successful green supply chain management. Segura et al. [22] also argued that suppliers play a key role in supply chain management which involves evaluation for supplier selection problems, as well as other complex issues that companies should take into account.
Determining the criteria for supplier selection and evaluation has always been one of the main hotspots in green supply chain management research. Early supplier selection was based on the ability of suppliers to meet economic criteria such as quality, cost, and price, and then core enterprises gradually began to consider factors such as cycle time and customer responsiveness. However, with the enhancement of environmental awareness, sustainability has become an important requirement of the supply chain [23]. In general, a multi-criteria modeling approach is used for green supplier screening. Gurel et al. [24] used the AHP to assess each determinant of supplier selection, helping core businesses integrate multi-criteria decision analysis. Giannakis et al. [25] developed a sustainability performance measurement framework for supplier evaluation and selection using the analytic network process (ANP) method, which takes into account the interrelationships between quantifiable and sustainability-related evaluation metrics, in response to limitations in supplier evaluation and selection models. Ghamari et al. [26] address the problem of selecting a supplier bound by sustainability and resilience criteria; the technique for order preference by similarity to ideal solution (TOPSIS) is applied to ranking the suppliers. Izadikhah et al. [27] propose a data envelopment analysis (DEA) algorithm to cluster suppliers that allows the clustering of suppliers based on sustainability factors. Majumdar et al. [28] used interpretive structural modeling (ISM) techniques to explain the relationship between key barriers to green supply chain management, enabling companies to achieve environmental sustainability. Kumar et al. [29] assess supplier performance based on green practices, using the fuzzy extended elimination (FEE) to incorporate the linguistic decision of the decision-makers and convert it into quantitative metrics to eliminate underperforming suppliers. Yazdani et al. [30] determine the inter-relationships between each pair of supplier selection criteria and customer requirements by considering various environmental performance requirements and criteria with the aid of the decision-making trial and evaluation laboratory (DEMATEL) method. In addition to the above single multi-criteria modeling methods, the trend of using hybrid multi-criteria modeling approaches is quite common currently [31]. For example, Yang et al. [32] applied grey relational analysis (GRA) and ISM to analyze the factors that play crucial roles in sustainable supply chains and explored their joint effects. Peng et al. [33], in an effort to rationalize material selection in green design, found that a combination of generalized DEA and TOPSIS provides a more rational and evidentiary basis for material selection in green design. Qu et al. [34] aimed to screen appropriate green supply chain suppliers based on a framework using fuzzy TOPSIS and ELECTRE for a Chinese internet company to achieve effective and efficient green supply chain management.
In the early studies, it was found that green supplier screening usually considers both qualitative and quantitative criteria. Therefore, this study combines the AHP and FCE methods to solve the problem of green supplier selection. The AHP was used to determine the evaluation factors and factors of weight value, and then the fuzzy synthesis method was used for multi-level fuzzy comprehensive evaluation [35]. Organically combining the analysis of qualitative indicators and quantitative indicators can not only fully reflect the ambiguity of evaluation factors and the evaluation process, but also reduce the drawbacks of personal subjective judgment, which is more in line with objective reality than general evaluation methods. The AHP is a practical multi-criteria decision-making method. It decomposes a complex system into various components, based on which qualitative and quantitative analysis is carried out. The relative importance of each factor in the hierarchy is determined by pairwise comparison, and then the overall ranking of the relative importance of decision schemes is determined by synthesizing the judgment of decision-makers [36]. The FCE method is a comprehensive evaluation method based on fuzzy mathematics; it can transform qualitative evaluation into quantitative evaluation and perform an overall evaluation of things or objects that are subject to multiple factors. It has the characteristics of clear results and strong systematicness, which can better solve vague and difficult-to-quantify problems, and is suitable for various non-deterministic problems [37,38]. At present, this coupling method has been widely used in various industries. Zhang et al. [39] propose combining the two methods of the AHP and fuzzy evaluation to construct an assessment indicator system and a fuzzy-level evaluation model in order to obtain the optimal site selection for shared vehicle charging stations. Practice has proved that this method has a high degree of accuracy. Li et al. [40], in order to determine the bearing capacity of an existing bridge condition, used the fuzzy evaluation method to evaluate the material damage degree of the bridge structure based on the AHP. The method is evident and useful; it can reflect a prestressed concrete bridge in service effectively, improve the existing structure model, and optimize the bearing capacity of synthetic evaluation. Liu [41] used the AHP and FCE for quantitative analysis of the functional indicators of building green public buildings to achieve sustainable economic and social development. This method has an easy-to-implement procedural law and a very good value and is intuitive, easy to operate, and a worthy method for the comprehensive evaluation of green public buildings.
For the aquaculture industry, Wang et al. [42], by studying food losses throughout the animal product supply chain in China, found that the rate of losses was significantly higher for aquaculture products than for other animal products. The quality and safety of aquatic products have always been a major concern for the industry. However, the current research on green supplier screening of aquatic products mainly focuses on fish, and research related to green supplier screening of sea cucumber processing enterprises has not been conducted. The selection of suppliers mainly relies on the subjective judgment of enterprise managers or follows the principle of “economic efficiency first” [43]. The upstream and downstream enterprises in the supply chain show fragmented and scattered cooperative relationships, with a weak level of cooperation, and have not established a partner screening method based on environmental performance from the perspective of the enterprise, and there is no complete standard partner screening system. At the same time, it is difficult to regulate the supply chain of sea cucumber products, and quality and safety problems occur from time to time [44]. Therefore, sea cucumber processing enterprises were selected as the research object in this study, which discusses the problems of supplier selection under the condition of sustainable development and aims to establish a green supplier assessment indicator system for sea cucumber processing enterprises, to solve the problems of the low degree of integrated development of the whole industrial chain of sea cucumber and the imperfect traceability system for sea cucumber products. Sea cucumber processing enterprises are urged to give full play to the role of the core enterprises in guiding and helping the upstream and downstream enterprises in the supply chain and jointly integrate environmental, economic, and social factors to achieve sustainable development. To this end, traditional standards and sustainable development standards are combined, and their interrelationships are considered in the green supplier assessment process.
2. Material and Methods
A sea cucumber processing enterprise in Dalian, Liaoning, China, was selected as a case study for this study to reflect the complex green supplier selection environment. Three research phases were designed to describe the overall research approach. The first stage was the creation of a questionnaire. Through a literature search, the factors influencing green supplier screening in China were summarized. Therefore, a targeted screening of sea cucumber processing enterprises’ indicators was carried out based on the triple baseline theory, and an expert questionnaire survey was designed and distributed to determine the screening criteria for green suppliers. This resulted in a green supplier screening framework with 3 levels and 23 influencing factors. In the next stage, the analysis model was determined. The AHP was used to calculate the weight of the screening indicator of green supply chain providers, and the influence degree of each index in the overall screening of suppliers was determined. On this basis, the FCE method was used to derive the overall evaluation results of the enterprise. The fuzzy comprehensive evaluation method can comprehensively consider the information of multiple indicators, and the evaluation results of each indicator can be reasonably weighted and aggregated to produce a comprehensive evaluation result. This enables decision-makers to comprehensively and objectively evaluate all aspects of the subject under evaluation. Finally, the supplier selection criteria and ranking methods were incorporated into real-life cases to rate the upstream suppliers of sea cucumber processing enterprises, identify the best partners, and give suggestions for improvement. The research ideas and steps of this paper are shown in Figure 1.
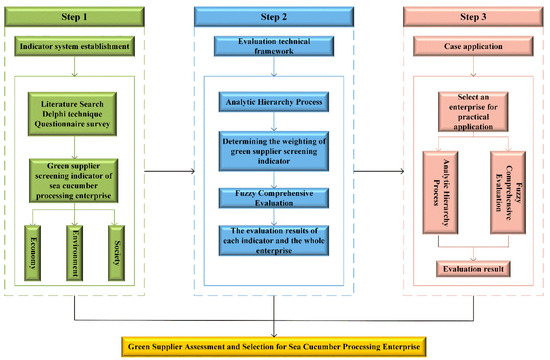
Figure 1.
Green supplier screening process for sea cucumber processing enterprise.
2.1. Determination of the Indicators
First, a literature search was conducted to summarize the factors influencing the selection of green suppliers, and from these, to find the supplier selection criteria commonly used in other industries. On this basis, a selection indicator for sea cucumber processing enterprises was constructed based on the triple baseline theory of economy, environment, and society, and ten environmental and aquatic experts were invited to fill out an expert questionnaire survey to determine the screening criteria for green suppliers. The final result was a green supplier assessment indicator system for sea cucumber processing enterprises, which was composed of 3 levels (environment, economy, and society) and 23 influencing factors and their explanations, as shown in Table 1.

Table 1.
Indicator description.
2.2. Analytic Hierarchy Process
The analytic hierarchy process makes decision problems more tractable and understandable by breaking down complex decision problems into multiple levels and criteria. The basic idea is to determine the optimal decision solution by comparing the relative importance of the criteria [45]. The procedures of the AHP method are summarized as follows:
Step 1: Establish a hierarchical structure model. Establish a multi-level hierarchical structure; according to the different objectives, the realization of functional differences, the system is divided into several levels.
Step 2: Compose a judgment matrix. When comparing two factors with one another, relative scales are used to reduce the difficulty of comparing various factors of different natures with one another, and the grade is evaluated according to its importance. The matrix formed by the result of a two-by-two comparison is called a judgment matrix. The judgment matrix has the following properties:
where aij is the result of comparing the importance of element i with that of element j.
The method for determining the scale of the matrix element aij is presented in Table 2.
Table 2.
The 1–9 scalar method.
Step 3: Consistency check. The judgment matrix is tested by consistency calculation. If the test result does not pass, it is necessary to sort out the judgment results and re-invite experts to score the pros and cons so that the opinions tend to be consistent until the consistency test is passed. The consistency indicator (CI) is defined as follows:
where CI is the consistency indicator of the judgment matrix, is the maximum eigenvalue of the judgment matrix, and n is the order of the judgment matrix.
When CI is equal to 0, there is complete consistency; when CI is close to 0, there is satisfactory consistency; the larger the CI, the more serious the inconsistency.
Considering that the deviation of consistency may be caused by random reasons, when testing whether the judgment matrix has satisfactory consistency, it is also necessary to compare the CI with the random consistency indicator RI and obtain the tested coefficient CR. The formula is as follows:
where CR is the random consistency ratio, CI is the consistency indicator of the judgment matrix, and RI is the average random consistency indicator. Values of RI are listed in Table 3.
Table 3.
Average random indicator values according to matrix size.
If CR < 0.1, the comparison matrix can be considered consistent with the requirements of logical consistency; otherwise, it does not have satisfactory consistency.
Step 4: Calculation of weighting results. Calculating the weight of the relative importance of all factors at a certain level for the highest level is called hierarchical total ranking. This process is carried out sequentially from the highest level to the lowest level.
2.3. Fuzzy Comprehensive Evaluation Method
The FCE method has been widely used in the calculation of qualitative evaluation results and has been proven to be a scientific and reasonable evaluation method for quantifying qualitative indices, so the fuzzy comprehensive evaluation method is used to calculate the results of the evaluation of the suppliers of sea cucumber processing enterprises. In 1965, Professor Chard proposed the concept of fuzzy set theory to express the uncertainty in the evaluation process [46]. The FCE method, based on the principle of fuzzy relationship synthesis, allows for comprehensive quantitative evaluation of factors that are difficult to analyze quantitatively. It is characterized by clear and systematic results, and it provides a better way to address various uncertainty problems. The procedures of the FCE method are summarized as follows:
Step 1: Determining the domain of factors to be evaluated. When determining the factor thesis domain of the content being assessed, assuming that the object being assessed contains n factors, the indicator of the evaluated object can be expressed as follows:
where n represents the number of evaluation indicators.
Step 2: Determine the comment level domain. The set of comments is a collection of the total possible results of the evaluator’s assessment of the evaluated object. The assessment grades are classified into m levels by linguistics; therefore, the grade set is as follows:
where m represents the number of levels of comments.
The specific level can be described in appropriate language depending on the content of the evaluation. For example, the evaluation supplier can use L = .
Step 3: Construct the fuzzy relationship matrix. After constructing the fuzzy subsets, it is necessary to quantify the evaluated objects one by one, that is, to determine the membership degree of the evaluated objects in each level of fuzzy subsets from a single factor, and thus obtain the fuzzy relationship matrix:
where rnm denotes the membership degree of the nth indicator in the mth level.
Step 4: Fuzzy comprehensive evaluation. After obtaining the fuzzy relationship judgment matrix, the matrix is multiplied by the weight results of each first-grade indicator and second-grade indicator to obtain the fuzzy comprehensive evaluation vector P. This step can be expressed as follows:
where R is the fuzzy relationship judgment matrix and W is the indicator weight.
Step 5: Interpretation of evaluation results. The maximum membership degree principle is the most commonly used method in the interpretation of fuzzy comprehensive evaluation results. However, this principle can only be applied to the qualitative analysis of the results, and it is not possible to compare the variability between different factors and perform specific quantitative evaluation and analysis. Using the single-value result of the fuzzy vector to explain the calculation method can solve the above problems well. The specific method is to multiply the membership score of the corresponding grade in the fuzzy evaluation vector P by the normalized weight assignment, so as to obtain a single result [47].
Assuming that the normalized weights are assigned to m evaluation levels, the set of assignments Q can be expressed as follows:
Therefore, the normalized calculation result V of the fuzzy comprehensive evaluation vector can be described as follows:
where p is a fuzzy comprehensive evaluation vector and q is an assignment set.
Finally, by comparing and analyzing the normalized results of the fuzzy comprehensive evaluation vector, the evaluation results of each index and the enterprise as a whole are derived, and the corresponding improvement measures are put forward according to the results.
3. Results
3.1. Case Enterprise Information
In recent years, the sea cucumber farming industry has developed rapidly in China’s coastal areas and has gradually become the mainstay of the fishing industry in these areas. This study selected a large–scale, commercial sea cucumber processing enterprise in Dalian as a research sample. The enterprise was founded in February 2009 with a registered capital of USD 9.18 million. Its main products are sea cucumbers, and its main technique is spiral freezing. The enterprise has 12,000 m3 of nursery water and 1000 hectares of bottom-seeded and multiplied sea area. The enterprise has been awarded the title of leading agricultural industrialization enterprise in China and represents the leading level in China’s sea cucumber processing industry. We used a combination of the hierarchical analysis method and the fuzzy comprehensive evaluation method to select the best green supplier for this enterprise. Five green suppliers were identified, and the construction of the whole screening system is very representative and can represent the actual local situation to a certain extent. In order to protect commercially sensitive information, the involved suppliers were named S1, S2, S3, S4, and S5 to represent the supplier members. Table 4 summarizes some important information about the shortlisted suppliers.
Table 4.
Shortlisted suppliers’ information.
3.2. Weight Calculation Results
In this study, 10 experts involved in aquatic and environmental professions were invited to judge the importance of each of the first-grade indicators and second-grade indicators in the green supplier assessment indicator system for sea cucumber processing enterprises. Taking the weight calculation of eight second-grade indicators in the economic level indicators as an example, the judgment matrix of the important relationship between each indicator and the normalized results of the indicators constructed according to the results of expert scoring are shown in Table 5.
Table 5.
Judgment matrix and normalization results for each second-grade economic indicator.
Then, the consistency test of the judgment matrix results was carried out. According to the calculation, = 8.16505, and checking Table 3 shows that RI = 1.41. According to Equations (2) and (3), CI = 0.02358 and CR = 0.01672 < 0.1, indicating that the judgment matrix has acceptable consistency, so the weight values of the eight second-grade economic indicators can be expressed as follows:
WEconomy = (0.33 0.14 0.22 0.03 0.14 0.06 0.02 0.06)
The weights of other indicators were calculated according to the above method, and all the results passed the consistency test. Based on the above analysis and calculation, it was finally determined that the green supplier assessment indicator system for sea cucumber processing enterprises includes 3 first-grade indicators and 23 second-grade indicators. The benchmark values of each second-grade indicator and the calculation results of the weight of each indicator are shown in Figure 2. From the economic point of view, respondents are widely concerned about indicator A1, “sea cucumber farming price”, so the indicator weight of A1 is the highest (0.33); from the perspective of the environment, the interviewees believed that the main factors affecting the environment were indicator B1, “clean production level of sea cucumber farming” (0.33), and indicator B3, “environmental awareness” (0.33). On the social level, the respondents pay more attention to whether the enterprise has a long-term cooperation willingness, so indicator C5, “long-term cooperation” (0.38), accounts for the highest proportion.
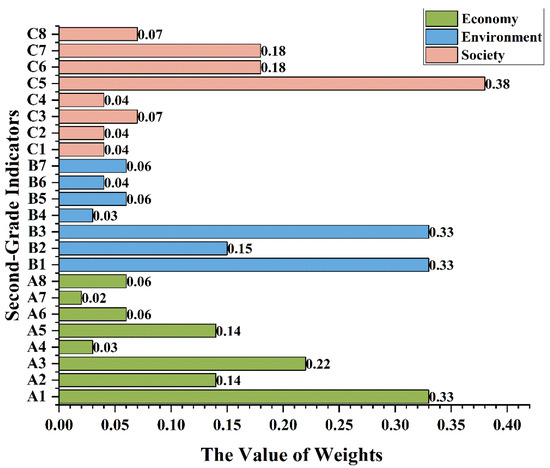
Figure 2.
Sea cucumber processing enterprise green supplier screening indicator score results. Note: A1 = sea cucumber farming price; A2 = size of sea cucumber farming enterprises; A3 = quality of fresh sea cucumber; A4 = sea cucumber transportation cost; A5 = qualified rate of transport quality; A6 = order fulfillment rate; A7 = sea cucumber inventory cost; A8 = sea cucumber traceability; B1 = clean production level of sea cucumber farming; B2 = green supply chain management commitment for sea cucumber farming enterprises; B3 = environmental awareness; B4 = geographical location; B5 = environmental management system; B6 = food safety management system certification; B7 = mastery of new environmental technology; C1 = cooperation with green seed enterprises; C2 = protection of employee rights; C3 = green technology talent; C4 = employee training; C5 = long-term cooperation; C6 = green image of farming enterprises; C7 = social responsibility of farming enterprises; C8 = brand effect.
3.3. Green Supplier Assessment and Selection Results
Using a questionnaire survey, experts in the relevant fields were invited to score the membership degree of each second-grade indicator on the three-level rubric scale. Finally, the scores of the experts were calculated and normalized to determine the affiliation of each second-grade indicator on the rubric scale and establish a fuzzy relationship judgment matrix. The results are shown in Table 6.
Table 6.
The normalized results of the second-grade indicators’ membership of the case supplier.
According to the results of Table 6 and Equation (6), the first-grade indicator fuzzy relation judgment matrix of S1, S2, S3, S4, and S5 can be obtained. Taking the economic first-grade indicators of S1 as an example, the fuzzy relationship judgment matrix can be expressed as follows:
The fuzzy relation judgment matrix of each first-grade indicator obtained is multiplied by the indicator weight. Taking the first-level economic indicators as an example, the weight of the second-grade indicators can be expressed as a vector:
WEconomy = (0.33 0.14 0.22 0.03 0.14 0.06 0.02 0.06)
According to Equation (7), the first-grade indicators’ fuzzy comprehensive evaluation vector of suppliers S1, S2, S3, S4, and S5 can be obtained. Taking the economic indicators of S1 as an example, the fuzzy comprehensive evaluation vectors are as follows:
PS1-Economy = (0.488 0.432 0.08)
The results of the fuzzy comprehensive evaluation of the first-grade indicators of the five sea cucumber farming suppliers are shown in Table 7.
Table 7.
Results of the fuzzy comprehensive evaluation of the first-grade indicators for the case suppliers.
Based on the results in Table 7, the fuzzy comprehensive evaluation vectors for each of the five sea cucumber farming suppliers were calculated by applying Equation (7) as follows:
PS1 = (0.47 0.43 0.10)
PS2 = (0.36 0.46 0.18)
PS3 = (0.22 0.45 0.33)
PS4 = (0.48 0.38 0.14)
PS5 = (0.42 0.34 0.24)
The results in Figure 3 show that among all the impact categories, S1 focuses more attention to economic benefits and strives to achieve the unity of economic and environmental benefits, but the emphasis on social benefits is not high; S2 pays more attention to environmental benefits intending to reduce the environmental load of pollution generated during production; S3 pays more attention to environmental benefits and, unlike other enterprises, it pays more attention to the social level than to the economic level; S4 pursues more economic benefits and pays less attention to environmental and social benefits; and S5 pays more attention to economic benefits but also devotes some energy to the environmental and social levels. Therefore, it is still necessary to comprehensively consider the indicators on three levels to comprehensively evaluate the five alternative suppliers.
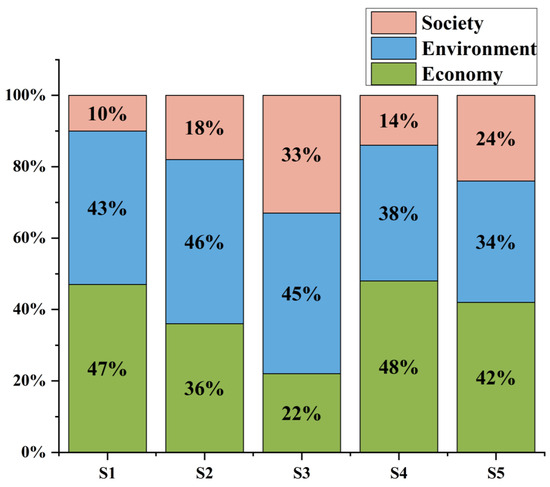
Figure 3.
The economic, environmental, and social factors of five sea cucumber farming suppliers.
The fuzzy vector single-valued weight assignments are of three levels, q1: high level, q2: mid level, and q3: low level, and according to Equation (8), the set of assignments Q can be expressed as follows:
The weights of the three levels are assigned as q1 = 3, q2 = 2, q3 = 1. Therefore, the intervals of the fuzzy vector uniformization results can be obtained in [1,2,3]. According to this interval, the range of the single-valued scores for the three-level evaluation results is divided equally. The assignment and score evaluation range of the three-level evaluation results are shown in Table 8.
Table 8.
Interval of uniformization results for each assessment level.
According to Equation (9), the comprehensive evaluation results of the five sea cucumber farming suppliers are as follows:
VS1 = 2.37
VS2 = 2.19
VS3 = 1.87
VS4 = 2.33
VS5 = 2.18
According to the assessment results (Table 9), the five sea cucumber suppliers are ranked S1, S4, S2, S5, and S3 in that order. Only S1 reached L1: high level, and the other four were in L2: mid level. According to the ranking results, S1 is considered to be the most suitable supplier for cooperation. S1 is the preferred choice for carrying out cooperation. Under the premise of ensuring supply, S4, S2, S5, and S3 are selected.
Table 9.
Case supplier ranking.
4. Discussion
4.1. Key Factor Analysis
This study constructed a green supplier assessment indicator system for sea cucumber processing enterprises and determined the indicator weight using the AHP. Taking a large sea cucumber processing enterprise in Dalian as an example, the FCE method was used to evaluate five suppliers of the case company and determine the rating and ranking of the existing suppliers.
The results (Figure 4) show that A1, “sea cucumber farming price”; B1, “clean production level of sea cucumber farming”; B3, “environmental awareness”; and C5, “long-term cooperation” are the influential factors in the selection of green suppliers for sea cucumber processing enterprises. Among them, A1 is the most influential factor on the economic level because enterprises provide products and services with the ultimate goal of profitability. B1 and B3 are the most influential factors on the environmental level because the clean production of sea cucumber farming is an important means to achieve pollution reduction and carbon reduction and synergies. The sustainability management of a supply chain typically starts with upstream procurement [32]. The standardization of production requirements for sea cucumber farming enterprises will help to ensure the green level of suppliers from the source. At the same time, environmental awareness has gradually become a prerequisite for promoting the green development of suppliers. Suppliers closely related to core enterprises should establish environmental awareness and promote the development of a green supply chain. C5 is the most influential factor on the social level, and most processing enterprises tend to regard suppliers with a long-term willingness to cooperate as partners and establish strategic alliances with them [48].
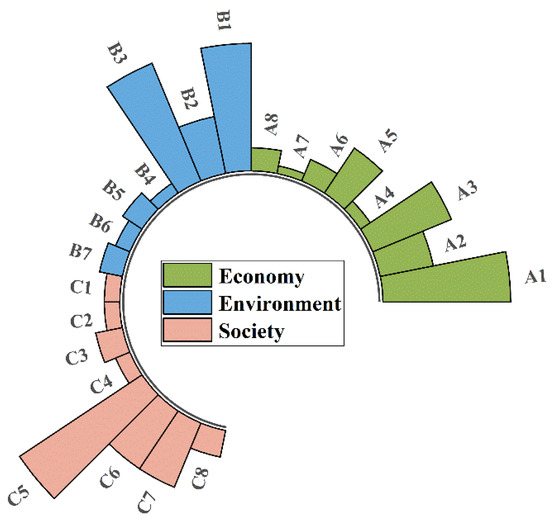
Figure 4.
Indicator comparison radial bar chart. Note: A1 = sea cucumber farming price; A2 = size of sea cucumber farming enterprises; A3 = quality of fresh sea cucumber; A4 = sea cucumber transportation cost; A5 = qualified rate of transport quality; A6 = order fulfillment rate; A7 = sea cucumber inventory cost; A8 = sea cucumber traceability; B1 = clean production level of sea cucumber farming; B2 = green supply chain management commitment for sea cucumber farming enterprises; B3 = environmental awareness; B4 = geographical location; B5 = environmental management system; B6 = food safety management system certification; B7 = mastery of new environmental technology; C1 = cooperation with green seed enterprises; C2 = protection of employee rights; C3 = green technology talent; C4 = employee training; C5 = long-term cooperation; C6 = green image of farming enterprises; C7 = social responsibility of farming enterprises; C8 = brand effect.
According to the results of Table 7, the fuzzy comprehensive evaluation vector of the first-grade indicators of the five sea cucumber suppliers was calculated as a single value; the comment levels of the first-grade indicators were determined in comparison to Table 8, and the calculation results and evaluation results are shown in Table 10.
Table 10.
Case supplier first-grade indicators’ single-value results and comment grade comparison.
Among the five case suppliers, S5 is outstanding in A1, “sea cucumber farming price”, so the economic performance of S5 is better than that of other suppliers; the environmental performance of S1 is superior to that of other suppliers because S1 attaches great importance to the cultivation of B3, “environmental awareness”; although S4’s performance in C5, “long-term cooperation”, is general, S4’s social performance is still superior to that of other suppliers. The analysis found that although S4 is not dominant in C5, “long-term cooperation”, it is prominent in C6, “green image of farming enterprises”, and C7, “social responsibility of farming enterprises”, which are second only to C5, “long-term cooperation”, so S4’s social performance is better than that of other suppliers. The above results show that the performance results of the more heavily weighted indicators directly influence the final green supplier evaluation results.
Although S4 and S5 are not the preferred suppliers for sea cucumber processing enterprises, they still have advantages in certain areas. S4 has the highest score on the social level because S4 attaches great importance to the training of employees and the establishment of a green image of the enterprise, which undoubtedly wins more opportunities for enterprises, but from the overall perspective, S4 needs to improve in the economic dimension. The analysis found that S4’s adjustment for sea cucumber farming prices was the focus for improvement. S5 has the highest score on the economic level, mainly because the price of sea cucumber breeding is low, but there is still much room for improvement in the environmental dimension. The analysis found that S5 was deficient in areas such as the level of clean production in sea cucumber farming.
4.2. Improvement Measures and Recommendations
The adoption of sustainable practices has become an important consideration for business organizations with regard to their supply chains [49]. Memari et al. [50] found that manufacturers consider environmental efficiency, green image, pollution reduction, green competencies, safety and health, and employment practices, in addition to conventional criteria such as costs, quality, and service performance. For seafood supply chains, the scope extends beyond traditional economics to include transparency, forced labor, equity, food safety, and other issues [51].
To address the problem of supplier screening in the sea cucumber industry, this study proposes corresponding solutions. The lower-ranking suppliers also need to improve some weightier indicators, that is, the issues of concern to sea cucumber processing enterprises, before they can become potential partners. For example, regarding the price of sea cucumber farming, different prices can be set for different sales channels [52]. The supplier can first screen the quality of fresh sea cucumbers, select different grades of sea cucumbers according to the size and shape integrity of sea cucumbers, and then price and sell different grades of sea cucumbers. On the issue of cleaner production levels of sea cucumber farming, the first step is to reduce the use of fossil energy in the process of sea cucumber farming and use cleaner energy sources to reduce pollutant emissions [53]. Secondly, the large amount of seawater demand during sea cucumber farming has a great impact on the environment. Micro-ecological preparations can be used to reduce nitrogen and phosphorus content and reduce seawater pollution [54]. Finally, a recirculating aquaculture system can be established to avoid the direct discharge of aquaculture tailwater and solid waste into the ocean.
In addition, supplier screening for sea cucumber processors requires the joint efforts and promotion of the government, core enterprises, and the industry as a whole. The government plays a key role in promoting the implementation of a supplier screening system. In order to achieve this goal, the government can introduce relevant policies and regulations to guide enterprises to operate according to the green supplier screening system and provide support and encouragement. The government can also strengthen regulations to ensure the quality and safety of the supply chain. Core enterprises must fully play their leading role, change the past situation of focusing only on economic benefits without adopting a screening system, and encourage other enterprises to jointly participate in and implement a supplier screening system. Such a cooperative mechanism can ensure the stability and long-term nature of supplier selection, thereby improving the efficiency and quality of the entire supply chain. The sustainable development of the sea cucumber industrial chain can only be achieved by establishing a cooperative mechanism promoted by the government, led by core enterprises, and involving the whole industry.
In this study, the AHP and FCE were used to select the most effective sustainable supplier among alternatives. The necessary computations were performed by taking experts’ inputs into consideration. Hence, it is suggested to perform these computations in a careful manner. The findings of this study are based on a single case study; thus, the findings cannot be generalized. The fuzziness in the data has also not been considered in this work; therefore, a fuzzy-based decision approach may be applied in future work. TOPSIS and Fermatean fuzzy sets can also be used to select sustainable providers in future studies, and these results can be compared with those of the present study [55,56].
5. Conclusions
Based on literature research and expert opinions, this study established a green supplier assessment indicator system for sea cucumber processing enterprises and established a hierarchical structure of supplier selection using the AHP to obtain the relative importance weights of quantitative and qualitative criteria. In order to illustrate the applicability of the proposed model, taking a large sea cucumber processing enterprise in Dalian as a case study, the FCE method was used to evaluate and analyze five suppliers, and the scores and rankings of existing suppliers were determined. The results show that S1 is the most suitable supplier for cooperation, and the price of sea cucumber farming, the cleaner production level of sea cucumber farming, environmental awareness, and long-term cooperation willingness are the most important factors in the selection of green suppliers for sea cucumber processing enterprises. The evaluation results are basically consistent with the actual production situation of the enterprise, which proves that the green supplier assessment indicator system for sea cucumber processing enterprises constructed in this paper has certain applicability. Suppliers with excellent environmental and economic performance can be selected for core enterprises. At the same time, a cooperation mechanism driven by the government, led by core enterprises, and involving the whole industry will be formed to achieve the sustainable development of the sea cucumber industry chain.
Other suppliers with lower rankings can also become potential partners by improving in the areas of concern for sea cucumber processing enterprises. For example, with regard to the price of sea cucumber aquaculture, different prices can be set according to the differences in sales channels to improve the competitiveness of suppliers. Regarding the clean production level of sea cucumber aquaculture, clean energy can be adopted to gradually replace the use of fossil energy and reduce atmospheric environmental pollution, and marine environmental pollution can also be reduced by establishing a recirculating aquaculture system and using micro-ecological preparations. With regard to the issue of environmental awareness, the government can introduce relevant policies and regulations, strengthen supervision, and promote the core enterprises’ need to give full play to their leading role in promoting the formation of environmental protection concepts across the industry. On the issue of willingness to cooperate in the long term, it is necessary to promote the participation of other enterprises and the implementation of a supplier screening system, in order to ensure stability and long-term supplier selection.
This study also has some limitations. Future research should be conducted through a more extensive questionnaire survey to ensure the comprehensiveness of the study. At present, this study has only established a supplier screening system for sea cucumber processing enterprises, but there are relatively few studies on the screening of green suppliers in China’s aquatic industry, and a completed evaluation technology system has not been formed. Future research should focus on the characteristics of different aquatic products to carry out the construction of a green supplier assessment indicator system, and other green supply chain management research, such as network design and green optimization, should be carried out to provide technical support and decision-making suggestions for the application of green supply chain management in China’s aquatic industry.
Author Contributions
A.R.: Writing—Original Draft, Writing—Review and Editing, Formal Analysis. X.Z.: Data Curation, Resources. Q.L.: Data Curation, Resources. L.Y.: Investigation. F.H.: Visualization. F.J.: Visualization. H.H.: Conceptualization, Writing—Review and Editing, Funding Acquisition. Y.L.: Supervision, Funding Acquisition. All authors have read and agreed to the published version of the manuscript.
Funding
1. The project of Youth Foundation of Department of Education of Liaoning Province (LJKQZ2021123). 2. The earmarked fund for Modern Agro-industry Technology Research System (CARS-49). 3. Innovation and Entrepreneurship Project for High-Level Talents of Dalian (2020RQ109).
Institutional Review Board Statement
Not applicable.
Informed Consent Statement
This manuscript does not report on or involve the use of any animal or human data or tissues, and therefore, ethics problems are not applicable.
Data Availability Statement
Data sharing is not applicable to this article as no datasets were generated or analyzed during the current study.
Acknowledgments
We are grateful to Yanqiang Wu for technical support.
Conflicts of Interest
The authors have no relevant financial or non-financial interests to disclose.
References
- Ekonomou, S.I.; Boziaris, I.S. Non-Thermal Methods for Ensuring the Microbiological Quality and Safety of Seafood. Appl. Sci. 2021, 11, 833. [Google Scholar] [CrossRef]
- Duan, X.; Zhang, M.; Li, X.; Mujumdar, A. Ultrasonically Enhanced Osmotic Pretreatment of Sea Cucumber Prior to Microwave Freeze Drying. Dry. Technol. 2008, 26, 420–426. [Google Scholar] [CrossRef]
- Liang, Z.X. Exploring Safety Issues and Traceability in the Fish Supply Chain Line. Mod. Agric. Mach. 2022, 1, 103–104. [Google Scholar]
- Tang, Q.; Sun, X.Z. Analysis and Improvement of Supply Chain Inventory Management Strategies in the Aquatic Industry. China Storage Transp. 2021, 7, 173–174. [Google Scholar] [CrossRef]
- Wang, W.P. Study on Depletion Control in Cold Chain Logistics of Fresh Agricultural Products. China J. Commer. 2021, 24, 77–79. [Google Scholar] [CrossRef]
- Wang, D.; Wu, F.X. China Fishery Statistical Yearbook; China Agriculture Press: Beijing, China, 2022. [Google Scholar]
- Xu, X. Study on China’s Virtual Water Trade of Aquatic Products—Measurements, Influencing Factors and Choices of Development Path. Ph.D. Thesis, Shanghai Ocean University, Shanghai, China, 2022. [Google Scholar]
- Webb, L. Green purchasing: Forging a new link in the supply chain. Pulp Pap. Int. 1994, 36, 52–59. [Google Scholar]
- Nguyen, N.B.T.; Lin, G.H.; Dang, T.T. A Two Phase Integrated Fuzzy Decision-Making Framework for Green Supplier Selection in the Coffee Bean Supply Chain. Mathematics 2021, 9, 1923. [Google Scholar] [CrossRef]
- Song, H.H.; Gao, X.X. Green supply chain game model and analysis under revenue-sharing contract. J. Clean. Prod. 2018, 170, 183–192. [Google Scholar] [CrossRef]
- Bai, C.G.; Sarkis, J. Integrating sustainability into supplier selection with grey system and rough set methodologies. Int. J. Prod. Econ. 2009, 124, 252–264. [Google Scholar] [CrossRef]
- Alshammari, I.; Parimala, M.; Ozel, C.; Riaz, M. Spherical Linear Diophantine Fuzzy TOPSIS Algorithm for Green Supply Chain Management System. J. Funct. Spaces 2022, 2022, 3136462. [Google Scholar] [CrossRef]
- Amarasinghe, U.A.; Hoanh, C.T.; D’haeze, D.; Hung, T.Q. Toward sustainable coffee production in Vietnam: More coffee with less water. Agric. Syst. 2015, 136, 96–105. [Google Scholar] [CrossRef]
- Stević, Ž.; Pamučar, D.; Vasiljević, M.; Stojić, G.; Korica, S. Novel Integrated Multi-Criteria Model for Supplier Selection: Case Study Construction Company. Symmetry 2017, 9, 279. [Google Scholar] [CrossRef]
- Sarwar, A.; Xu, J.P.; Zeng, Z.Q.; Hashim, M. Ahp And Fuzzy Topsis Methods for Green Supplier Selection And Evaluation. Int. J. Adv. Res. 2017, 5, 625–635. [Google Scholar] [CrossRef]
- Tseng, M.L. Green supply chain management with linguistic preferences and incomplete information. Appl. Soft Comput. 2011, 11, 4894–4903. [Google Scholar] [CrossRef]
- Zhu, Q.H.; Feng, Y.T.; Choi, S.B. The role of customer relational governance in environmental and economic performance improvement through green supply chain management. J. Clean. Prod. 2016, 155, 46–53. [Google Scholar] [CrossRef]
- Lima Junior, F.R.; Osiro, L.; Carpinetti, L.C.R. A comparison between Fuzzy AHP and Fuzzy TOPSIS methods to supplier selection. Appl. Soft Comput. 2014, 21, 194–209. [Google Scholar] [CrossRef]
- Lakshmanpriya, C.; Kumaravel, A.; Saravanan, M.; Kumar, P.M. Selecting the Optimal Green Supplier and Order Allocation under Linear Discount. Math. Probl. Eng. 2022, 2022, 2453703. [Google Scholar] [CrossRef]
- Verma, M.; Prem, P.R.; Ren, P.J.; Liao, H.C.; Xu, Z.S. Green supplier selection with a multiple criteria decision-making method based on thermodynamic features. Environ. Dev. Sustain. 2022, 2022, 1–33. [Google Scholar] [CrossRef]
- Kang, X.; Xu, X.J.; Yang, Z.L. Evaluation and selection of green suppliers for papermaking enterprises using the interval basic probability assignment-based intuitionistic fuzzy set. Complex Intell. Syst. 2022, 8, 4187–4203. [Google Scholar] [CrossRef]
- Segura, M.; Maroto, C. A multiple criteria supplier segmentation using outranking and value function methods. Expert Syst. Appl. 2017, 69, 87–100. [Google Scholar] [CrossRef]
- Kannan, D.; Khodaverdi, R.; Olfat, L.; Jafarian, A.; Diabat, A. Integrated fuzzy multi criteria decision making method and multi-objective programming approach for supplier selection and order allocation in a green supply chain. J. Clean. Prod. 2013, 47, 355–367. [Google Scholar] [CrossRef]
- Gurel, O.; Acar, A.Z.; Onden, I.; Gumus, I. Determinants of the Green Supplier Selection. Procedia—Soc. Behav. Sci. 2015, 181, 131–139. [Google Scholar] [CrossRef]
- Giannakis, M.; Dubey, R.; Vlachos, I.; Ju, Y.B. Supplier sustainability performance evaluation using the analytic network process. J. Clean. Prod. 2018, 247, 119439. [Google Scholar] [CrossRef]
- Ghamari, R.; Mahdavi, M.M.; Ghannadpour, S.F. Resilient and sustainable supplier selection via a new framework: A case study from the steel industry. Environ. Dev. Sustain. 2021, 24, 10403–10441. [Google Scholar] [CrossRef]
- Izadikhah, M.; Saen, R.F.; Ahmadi, K.; Shamsi, M. How to use fuzzy screening system and data envelopment analysis for clustering sustainable suppliers? A case study in Iran. J. Enterp. Inf. Manag. 2020, 34, 199–229. [Google Scholar] [CrossRef]
- Majumdar, A.; Sinha, S. Modeling the barriers of green supply chain management in small and medium enterprises: A case of Indian clothing industry. Manag. Environ. Qual. 2018, 29, 1110–1122. [Google Scholar] [CrossRef]
- Kumar, P.; Singh, R.K.; Vaish, A. Suppliers’ green performance evaluation using fuzzy extended ELECTRE approach. Clean Technol. Environ. Policy 2018, 19, 809–821. [Google Scholar] [CrossRef]
- Yazdani, M.; Chatterjee, P.; Zavadskas, E.K.; Hashemkhani Zolfani, S. Integrated QFD-MCDM framework for green supplier selection. J. Clean. Prod. 2017, 142, 3728–3740. [Google Scholar] [CrossRef]
- Liang, R.; Chong, H.Y. A hybrid group decision model for green supplier selection: A case study of megaprojects. Eng. Constr. Archit. Manag. 2019, 26, 1712–1734. [Google Scholar] [CrossRef]
- Yang, Z.J.; Guo, X.T.; Sun, J.; Zhang, Y.L. Contextual and organizational factors in sustainable supply chain decision making: Grey relational analysis and interpretative structural modeling. Environ. Dev. Sustain. 2021, 23, 12056–12076. [Google Scholar] [CrossRef]
- Peng, C.; Feng, D.Z.; Guo, S.D. Material Selection in Green Design: A Method Combining DEA and TOPSIS. Sustainability 2021, 13, 5497. [Google Scholar] [CrossRef]
- Qu, G.H.; Zhang, Z.J.; Qu, W.H.; Xu, Z.S. Green Supplier Selection Based on Green Practices Evaluated Using Fuzzy Approaches of TOPSIS and ELECTRE with a Case Study in a Chinese Internet Company. Int. J. Environ. Res. Public Health 2020, 17, 3268. [Google Scholar] [CrossRef] [PubMed]
- Li, Y. Quality Evaluation of Environmental Accounting Information Disclosure of Y Nonferrous Metal Company Based on AHP-FCE Model. Discret. Dyn. Nat. Soc. 2022, 2022, 1549611. [Google Scholar] [CrossRef]
- Yan, G. Research on Green Suppliers’ Evaluation Based on AHP & Genetic Algorithm. In Proceedings of the International Conference on Signal Processing Systems, Singapore, 15–17 May 2009. [Google Scholar] [CrossRef]
- Wang, Y.; Yang, W.F.; Li, M.; Liu, X. Risk assessment of floor water inrush in coal mines based on secondary fuzzy comprehensive evaluation. Int. J. Rock Mech. Min. Sci. 2012, 52, 50–55. [Google Scholar] [CrossRef]
- Wang, X.C.; Zhang, H.S.; Li, M.; Li, Y. Research on Interference Optimization Mechanism of Wireless Routing Signal Transmission Based on Fuzzy Comprehensive Evaluation Method. Int. J. Online Biomed. Eng. 2017, 13, 136–148. [Google Scholar] [CrossRef][Green Version]
- Zhang, R.X.; Zhao, B. Research on Location Selection of Shared Vehicle Charging Station Based on Analytic Hierarchy Process and Fuzzy Evaluation Method. Open Access Libr. J. 2018, 5, 87593. [Google Scholar] [CrossRef]
- Li, Y.W.; Sun, Z.W.; Song, W.W. Prestressed Concrete Bridge Bearing Capacity Evaluation Based on Analytic Hierarchy Process and Fuzzy Evaluation Method. Adv. Mater. Res. 2011, 368–373, 2006–2010. [Google Scholar] [CrossRef]
- Liu, Q. Research on Investment Decision of Green Public Building Based on Analytic Hierarchy Process and Fussy Evaluation. Open Cybern. Syst. J. 2015, 9, 909–914. [Google Scholar] [CrossRef]
- Wang, R.G.; Liu, G.; Zhou, L.; Yang, Z.N.; Tang, Z.C.; Lu, S.J.; Zhao, M.J.; Sun, H.W.; Ma, C.; Cheng, G.Y. Quantifying food loss along the animal products supply chain in China with large-scale field-survey based primary data. Resour. Conserv. Recycl. 2023, 188, 106685. [Google Scholar] [CrossRef]
- Ren, A.Q.; Hou, H.C.; Wang, H.H.; Ma, Z.; Zhang, Y.; Liu, Y. Review on aquaculture green supply chain management in China. Environ. Pollut. Control 2023, 45, 1164–1168. [Google Scholar] [CrossRef]
- Liu, M.L.; Yang, B.C. Study on Cold Chain Technology Investment Decision of Dual Channel Aquatic Supply Chain Under the Background of Hayes Road. Eur. Bus. Manag. 2018, 4, 80. [Google Scholar] [CrossRef]
- Kwong, C.K.; Bai, H. A fuzzy AHP approach to the determination of importance weights of customer requirements in quality function deployment. J. Intell. Manuf. 2002, 13, 367–377. [Google Scholar] [CrossRef]
- Zhang, K.; Si, B.F. The Application of Fuzzy Comprehensive Evaluation Method Based on AHP on the Distribution of Rail Transport. Appl. Mech. Mater. 2014, 2916, 1379–1382. [Google Scholar] [CrossRef]
- Hou, H.C. Study on Evaluation and Application of Cleaner Production in Sea Cucumber Industry Based on Life Cycle Assessment. Ph.D. Thesis, Dalian University of Technology, Dalian, China, 2020. [Google Scholar]
- Li, P.; Chen, H.Z. Evaluation of green building suppliers based on IVPLTS-CBR decision-making method. Int. J. Intell. Comput. Cybern. 2021, 15, 17–40. [Google Scholar] [CrossRef]
- Luthra, S.; Govindan, K.; Kannan, D.; Mangla, S.K.; Garg, C.P. An integrated framework for sustainable supplier selection and evaluation in supply chains. J. Clean. Prod. 2017, 140, 1686–1698. [Google Scholar] [CrossRef]
- Memari, A.; Dargi, A.; Jokar, M.R.A.; Ahmad, R.; Rahim, A.R.A. Sustainable supplier selection: A multi-criteria intuitionistic fuzzy TOPSIS method. J. Manuf. Syst. 2019, 50, 9–24. [Google Scholar] [CrossRef]
- Olson, J.; Clay, P.M.; Silva, P.P.D. Putting the seafood in sustainable food systems. Mar. Policy 2014, 43, 104–111. [Google Scholar] [CrossRef]
- Hewawitharana, S.C.; Webb, K.L.; Strochlic, R.; Gosliner, W. Comparison of Fruit and Vegetable Prices between Farmers’ Markets and Supermarkets: Implications for Fruit and Vegetable Incentive Programs for Food Assistance Program Participants. Nutrients 2022, 14, 1842. [Google Scholar] [CrossRef]
- Hou, H.C.; Shao, S.; Zhang, Y.; Sun, D.L.; Yang, Q.Y.; Qin, C.L.; Sun, X.Y. Cleaner Production assessment for sea cucumber aquaculture: Methodology and case studies in Dalian, China. Clean Technol. Environ. Policy 2019, 21, 1751–1763. [Google Scholar] [CrossRef]
- Heng, X. The Development of Microecologics for Industrialized Mariculture. Ph.D. Thesis, Dalian University of Technology, Dalian, China, 2017. [Google Scholar]
- Senapati, T.; Yager, R.R. Fermatean fuzzy sets. J. Ambient Intell. Humaniz. Comput. 2020, 11, 663–674. [Google Scholar] [CrossRef]
- Senapati, T.; Yager, R.R. Fermatean fuzzy weighted averaging/geometric operators and its application in multi-criteria decision-making methods. Eng. Appl. Artif. Intell. 2019, 85, 112–121. [Google Scholar] [CrossRef]


Disclaimer/Publisher’s Note: The statements, opinions and data contained in all publications are solely those of the individual author(s) and contributor(s) and not of MDPI and/or the editor(s). MDPI and/or the editor(s) disclaim responsibility for any injury to people or property resulting from any ideas, methods, instructions or products referred to in the content. |
© 2023 by the authors. Licensee MDPI, Basel, Switzerland. This article is an open access article distributed under the terms and conditions of the Creative Commons Attribution (CC BY) license (https://creativecommons.org/licenses/by/4.0/).