Article

Wave Energy in Brittany (France)—Resource Assessment and WEC Performances

1
Cerema, Direction Risques, Eau et Mer, Hydraulique et Aménagement, 155 rue Pierre Bouguer, Technopôle Brest-Iroise, BP 5, 29280 Plouzané, France
2
Faculty of Civil Engineering and Geosciences, Delft University of Technology, Stevinweg 1, 2628 CN Delft, The Netherlands
3
Department of Civil and Environmental Engineering, University of Strathclyde, Glasgow G11XJ, UK
*
Author to whom correspondence should be addressed.
Sustainability 2023, 15(2), 1725; https://doi.org/10.3390/su15021725
Submission received: 9 December 2022 / Revised: 6 January 2023 / Accepted: 9 January 2023 / Published: 16 January 2023
(This article belongs to the Special Issue Sustainability of Wave Energy Resources in the Sea)

Abstract

:
Refined numerical wave energy resource assessments are required to reduce uncertainties in the evaluation of available power and energy production. However, to restrict the computational cost, a great part of wave hindcast simulations cover a limited time range (below ten years) or rely on coarse spatial resolutions while routinely ignoring tide-induced modulations in wave conditions. Complementing resource assessments conducted in the North-West European shelf seas, we here exploited a 27-year hindcast database (1994–2020) set up at a spatial resolution of 200 m along the coast of France and integrating the effects of tidal currents on waves. This evaluation was conducted in three water depths from offshore to nearshore (60, 40 and 20 m) around Brittany, one of the most energetic regions along the coast of France. We investigated the performances of a series of thirteen state-of-the-art wave energy converters with respect to installation depth range. Beyond confirming the interest of western Brittany in energy exploitation, the results exhibited the first ranking between devices, thus promoting the interests of Oceantec in offshore waters (60 m), Wave Dragon in intermediate waters (40 m), and Oyster and WaveStar C6 in shallow waters (20 m).

1. Introduction

Exploiting the wave energy resources of coastal locations may form an additional path to developing a renewable energy mix to help restrict industrial countries’ dependence on polluting and declining fossil fuel resources. These aspects are particularly important in European countries that experience depleted industrial age resources despite an abundance of marine renewable energy in bordering seas. Thus, the North-West (NW) European shelf seas are characterised by one of the most significant wave energy resources in the world, with an offshore mean wave power estimated at 60 kW m−1 [1,2]. As waves also show a high power density in nearshore waters [3], particular interest has therefore accrued to developing technical solutions, tested and deployed in real sea conditions, to capture this available energy and convert it into electricity [4].
However, despite these technological developments, resource exploitation still shows high economic uncertainties associated with the reduced lifespan and performances of devices, which has led to the failure of a series of leading projects in the coastal seas of Europe [5]. Reducing these uncertainties appears therefore to be one of the top priorities for securing the key steps in wave energy projects and paving the way to reliable energy exploitation. Among the different methods and tools proposed in the early stages of a wave project, particular attention must be dedicated to refined assessments of the available resource and technically exploitable power. These aspects are particularly important to (i) help identify the most promising locations for energy exploitation with respect to the performances of wave energy converters (WECs) and/or (ii) optimise the design and construction costs of devices.
In European shelf seas, numerous investigations based on hindcast numerical simulations were therefore conducted to characterise the wave energy climate (see Table 1 for a non-exhaustive review). Particular attention was dedicated to resource temporal variability at annual and seasonal scales. However, reducing the uncertainties in wave energy resource assessments requires covering extended periods of time. Thus, a minimum period of ten years is necessary to obtain a first estimate of the inter-annual and inter-seasonal variabilities of the available wave energy flux [6]. Recent investigations even suggested extending the time intervals to 20, 30, or even 100 years to include the effects of climate change [7,8,9]. In coastal locations, refined spatial resolutions are also needed for approaching the processes of refraction induced by a varying bathymetry and/or wave energy dissipation by bottom friction from offshore opened ocean to nearshore regions [10]. These two constraints imposed on temporal and spatial scales dramatically increase the computational costs of numerical simulations. Thus, apart from only a few studies [11,12], the great part of wave energy resource assessments has been restricted to periods of less than 10 years and/or has relied on coarse spatial resolutions exceeding several kilometres in locations of interest. As the NW European shelf seas are characterised by large tidal ranges and associated strong tidal flows [13], particular attention should also be paid to the effects of tidal currents on the available wave energy resource in shallow waters. Moreover, these processes are important to consider as they may lead to variations in the wave energy flux of up to 60% in locations with strong tidal currents [14,15]. However, apart from a few exceptions (see [5] for a review), these effects have been routinely ignored in wave energy resource assessments.
Moreover, given the wide range of WEC power systems developed and deployed in real sea conditions [4], refined evaluations of the expected generated power may help to optimise the selection and implementation of these devices. However, whereas different investigations considered a wide range of performance indicators [31,32,33], the evaluations conducted in the NW European shelf seas from hindcast simulations were mainly restricted to the capacity factor, thus exhibiting the full power operation of devices. An advanced assessment based on an extended range of energy metrics and performance indicators may therefore help to refine the ranking of the different technologies.
The present investigation complements the assessments of the wave energy resource and technically exploitable power conducted in the NW European shelf seas by exploiting a 27-year hindcast database (1994–2020) set up at a spatial resolution of 200 m in nearshore locations [34]. In comparison with previous hindcast databases and numerical models (Table 1), the database considered includes a series of up-to-date physical processes implied in wave propagation in coastal regions and, in particular, the effects of tidal currents on waves (e.g., flattening/steepening, refraction, blocking or breaking mechanisms, etc.). Furthermore, this evaluation considered an extended range of WEC power systems with 13 state-of-the-art devices disseminated in coastal locations with respect to the installation depth range, from offshore to shallow waters. The generated technical power was computed by combining wave hindcast results with devices’ power matrices derived from publicly available technical data.
The application was conducted in western Brittany (France), one of the most energetic areas along the coast of France (Figure 1, Section 2.1). After a description of the wave hindcast database, WEC power systems, performance indicators and resource metrics considered (Section 2.2, Section 2.3, Section 2.4), particular attention was dedicated to evaluating the hindcast database around Brittany (Section 3.1). Thus, complementing the global evaluation of this database, output parameters of significant wave height and wave periods were compared with observations from a series of eight wave buoys in water depths between 30 and 110 m. The assessment of wave energy and technically exploitable power was conducted at three water depths (60, 40 and 20 m) around Brittany. Hence, this study considers a series of locations evenly distributed along these three water depths. In these locations, we (i) exhibited the spatial distribution of energetic patterns based on averaged values of the significant wave height and available wave energy flux and (ii) characterised the temporal variability of available wave power at annual and monthly scales (Section 3.2). WEC performances were finally evaluated and compared at the three water depths considered identifying the most promising locations with respect to a given technology while exhibiting the temporal variability in energy production (Section 3.3).

2. Materials and Methods

2.1. Study Area

Located at the western extent of north-western Europe between the Celtic Sea and the Bay of Biscay, the surrounding seas of the Brittany Peninsula (Figure 1) are among the most energetic areas along the coast of France, with offshore significant wave height liable to exceed 10 m [21,28]. The continental shelf extends several hundred kilometres from the coast and shows, in nearshore areas, a highly variable bathymetry with a series of islands and emerged rocks. The coastline is also very irregular, evolving from coastal bays and basins to headlands and capes. This is particularly the case on the exposed western extent of Brittany, which includes, offshore, the island of Sein and the Ushant-Molène archipelago and, nearshore, the two prominent bays of Brest and Douarnenez, separated by the Crozon peninsula. This results in a highly variable exposure of coastal locations with shadow areas behind islands and increased wave energy off headlands [27,29]. These marine environments are furthermore characterised by strong tidal regimes with peak velocities expected to exceed 4 m s−1 near the sea surface within straits separating islands from the landmass [13,35,36]. Coastal seas around western Brittany show therefore strong interactions between tidal currents and waves leading, in particular, to pronounced currents-induced refraction with (i) changes of the wave direction towards areas with the lowest propagation speed of the crest and (ii) associated modulations of the significant wave height. In these environments, such effects resulted in modulations of the significant wave height liable to exceed 30% between high and low tides during storm conditions [15,37,38]. Further effects were naturally expected on the wave energy flux as a function of the squared significant wave height. Thus, it was suggested to include the effects of the tide (especially tidal currents) in numerical wave energy resource assessments conducted in western Brittany.
Different investigations, relying on numerical modelling tools, were conducted to characterise the available wave energy resource and the technically exploitable power on the western extent of Brittany. Thus, Guillou and Chapalain [28] and Guillou [29] performed an eight-year evaluation (between 2004 and 2011) of the available resource by relying on phase-averaged spectral wave models with spatial resolutions of 300 m in the nearshore areas. The mean offshore wave energy flux was estimated at 40 kWm−1 decreasing below 15 kWm−1 in coastal areas. The region also exhibited strong inter-annual and inter-seasonal variabilities in the resource, particularly noticeable during the winter periods. The exploitation of numerical simulations provided further information about the effects of tidal currents on the available wave energy, revealing a resource increase of over 100% at the entrance of the tidal straits of north-western Brittany [15]. These coastal simulations were finally exploited to assess the performances of WECs in offshore (>60 m) and intermediate (30–40 m) water depths focusing on three well-known technologies: Pelamis, AquaBuOY and Wave Dragon [30]. This detailed investigation identified locations of interest for WEC implementation in western Brittany while exhibiting important temporal variabilities in devices’ performances, particularly noticeable during the winter period. The monthly-averaged capacity factors were thus found to vary by more than 50% between winter months with values liable to exceed 40% for specific wave conditions. However, no further evaluation of devices’ performances was conducted within this energetic area along the coast of France.

2.2. Hindcast Database and Exploitation

The present investigation relied on the 27-year wave hindcast database (1994–2020) developed as part of the ResourceCODE Marine Data Toolbox designed to provide a full suite of tools to support investigations in the field of ocean energy (https://resourcecode.ifremer.fr/, accessed on 1 September 2022) [34]. The database was established from hindcast predictions of the spectral phase-averaged wave model Wavewatch III (WW3) setup on an unstructured computational grid extending (i) from the south of Spain to the Faroe Islands and (ii) from the western Irish continental shelf to the Baltic Sea, between longitudes −12° W and 13.5° W and latitudes 36° N and 63° N. Thus, the spatial resolution evolves from around 10 km in offshore waters to less than 200 m in shallow coastal areas. Open boundary conditions were derived from a global WW3 model set up at a spatial resolution of 0.5° [34]. Beyond traditional parametrisation and forcings for such large-scale wave models (including the bathymetry, surface wind fields and seabed roughness), particular attention was devoted to including currents and water levels. Thus, tidal components integrated at the scale of the computational grid were derived from two different sources: (i) the Tidal Atlas developed and validated at Ifremer (France) based on hydrodynamic simulations from the depth-averaged MARS2D model [39], and (ii) the FES2014 database developed with the Finite Element Solution tide model [40]. Tidal forcing fields were included in WW3 simulation at a time step of 30 min. Further details about wave model setup, parametrisation and validation are available in [34] and [41].
Model performances were initially evaluated by comparing predictions with remote sensing data and observations in a series of wave buoys disseminated along the coast of France [34]. At the scale of the large-scale computational domain, good consistency and agreement were obtained for the approach of the significant wave height between model and altimeter data with a normalised bias of 0.26% and a normalized root mean square error of 10.3% for the merged satellite product over the period 1994–2018. However, data from altimeters were disregarded within a band of 50 km from the coast. Thus, in situ observations were exploited to complement the assessment of model performances in the coastal area. However, the comparison with in situ data was restricted to five locations [34]. In Brittany, two locations were considered, the first one off western Brittany and the second one in the south-eastern area near the SEM-REV French Atlantic test site (wave buoys W4 and W8 in Figure 1, respectively). In the present investigation, we complemented this assessment of the wave hindcast database by including coastal observations disseminated in eight locations around Brittany (Figure 1). In situ data were extracted from the French CANDHIS database (“Centre d’Archivage National de Données de Houle In Situ”, Cerema, France) in locations with water depths ranging from 30 to 105 m (Table 2). These observations furthermore covered different periods of time extending from one month to a year. Further details about this complementary assessment of the wave hindcast database are shown and discussed in Section 3.1.
The output of the hindcast database consists finally of a series of 39 global parameters including the significant wave height Hm0, the wave energy period Te, the peak period Tp and the wave energy flux Pw, available at a time step of one hour at each of the 328,030 nodes of the computational grid. In the present investigation, the available wave energy resource and the performances of WECs were assessed at three different water depths in coastal waters around Brittany: typically 60, 40 and 20 m with respect to the lowest astronomical tides (Figure 2). Water depths were taken from the database developed as part of the HOMONIM project (“Historique, Observation, Modélisation des NIveaux Marins”, SHOM, Météo-France) and covering the NW European shelf seas with a spatial resolution of around 100 m [42]. Locations considered along these isolines were spaced every 25 km. However, computational nodes below 200 m from the coastlines were ignored to be consistent with the spatial resolutions of the wave hindcast database in these areas. Locations were furthermore disregarded in the bay of Brest, characterised by a low exposure to wave conditions [43]. The three isolines with water depths of 60, 40 and 20 m were thus discretised with 45, 55 and 75 points, respectively. These isolines were particularly tightened in the south-eastern and northern parts of Brittany, as well as around islands in relation to an increased slope of the sea bed in these locations. However, the slope was reduced off western Brittany and in the north-eastern part, thus increasing the distance between the isolines.

2.3. Wave Energy Converter Systems

Predictions from the wave hindcast database were exploited to assess the performances of a series of WEC power systems disseminated in water depths of 60, 40 and 20 m around Brittany. Following a great number of resource assessments in coastal shelf seas, the energy output was computed by coupling wave hindcast data with devices’ power matrices that provided the distribution of expected power for different classes of significant wave height and wave period [5]. Thus, we considered WEC technologies whose power matrices were publicly available. We therefore retained a series of 13 devices classified according to the prescribed installation depth including (i) offshore locations between 50 and 100 m, (ii) points in intermediate water depths between 25 and 50 m and (iii) nearshore areas between 10 and 25 m (Table 3). A brief description of these WEC power systems is provided in the following sub-sections with the objective of drawing the line between basic operating principles. Indeed, further details about these different technologies, including the design, the Power-Take-Off (PTO) system or the experimental and test site deployments, are available in references included in Table 3. Given the method retained for the evaluation of WEC energy output, however, particular attention is devoted to the description of power matrices’ characteristics by exhibiting the optimum range wave conditions leading to rated power and maximum production.

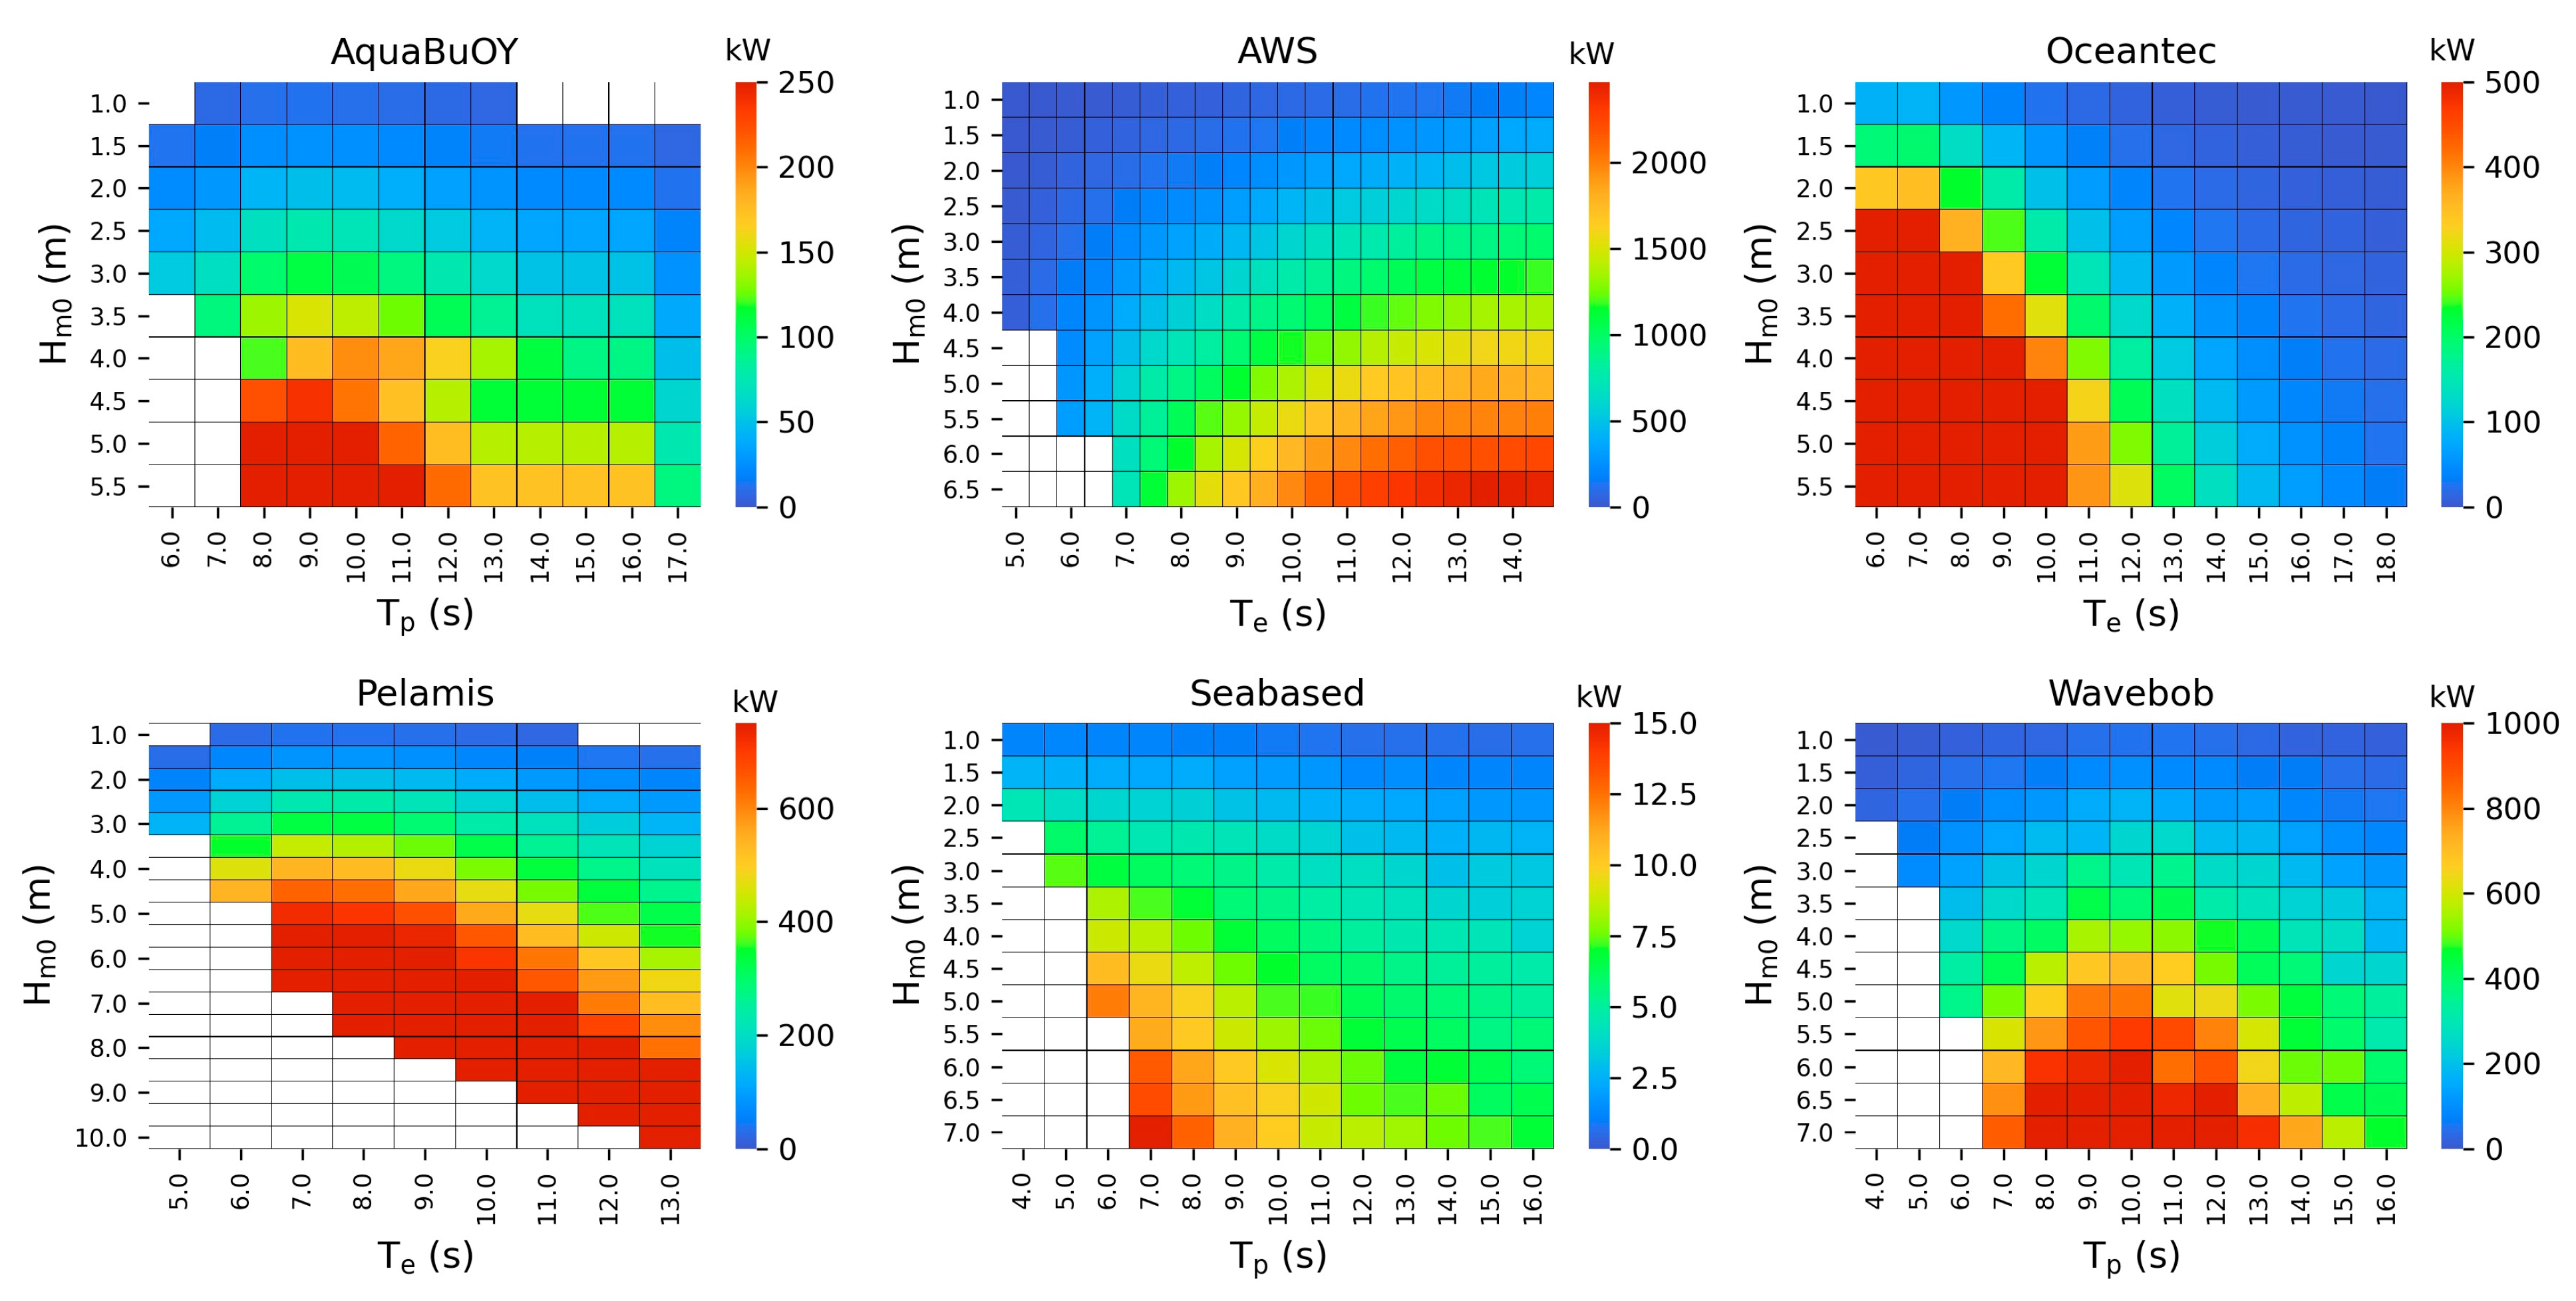
2.3.1. WEC in Offshore Locations

In offshore locations (water depths of 60 m), WEC power systems consist of six floating buoys including two devices attached to the seabed (Archimedes Wave Swing-AWS and Seabased) (Table 3). The first WEC is the AquaBuoy system, a floating buoy with a rated power of 250 kW. The buoy is connected to a piston integrated within a cylinder, opened at both ends below the sea surface and with a hose pump attached to each end [45]. As waves pass the WEC, the buoy oscillates and the hose pump is stretched and compressed, thus discharging a flow of pressurised water to a Pelton turbine connected to an electricity generator. The second device is the Archimedes Wave Swing (AWS) with a rated power of 2.4 MW [46]. Unlike AquaBuoy, this WEC is submerged. It is composed of two concentric and interconnected cylinders: the inner one is fixed to the seabed whereas the exterior one acts as a floater. Electricity is generated through a linear generator via the relative movement between both cylinders. The third WEC is Oceantec, a floating device with a rated power of 500 kW, designed as a vessel to be orientated along the incident wave front, thus optimising the directional wave energy absorption [51]. The device extracts energy from ocean waves by exploiting the relative inertial motion caused in a gyroscopic device (typically a flywheel that rotates continuously under the action of a motor) which, in turn, feeds an electricity generator. The fourth WEC, Pelamis, is a floating device with a rated power of 750 kW, composed of four semi-submerged cylinders linked by hinged joints and orientated along the wave propagation direction [48]. As waves pass along the length of the WEC, the different sections bend and move relative to one another, inducing mechanical energy that is converted into electricity with PTO control systems inside the joints. The fifth device is Seabased, a floating buoy with a rated power of 15 kW connected through a wire to a machinery unit standing at the sea bottom including the electricity generator [44]. The movements of the buoy under the action of the waves pull the wire, which drives the generator. The last WEC, Wavebob, is a self-reacting two-body system with a rated power of 1 MW operating in the heave mode. It is composed of a low-draft torus sliding along a high-draft float [44]. The relative motion between these two bodies drives a hydraulic PTO system which generates electricity.
The different technologies of devices naturally impact the performances and the optimal range of energy conversion with respect to classes of significant wave height and wave period. They result in contrasting variations between WEC power matrices (Figure 3). Thus, AquabuOY, Seabased and Oceantec show higher electricity production for waves with reduced periods, typically below 10 s, whereas AWS and Wavebob tend to show higher performances for increased wave periods. This is especially the case for AWS, which reaches its rated power for wave energy periods greater than 13 s. Whereas Pelamis shows good performances over an extended range of wave periods, the device enters safety mode for high significant wave heights and low wave periods to guarantee the protection of the structure, thus restricting the energy extraction to a reduced power band. However, with the exceptions of AquabuOY and Oceantec, these different devices are characterised by higher performances for significant wave heights over 5.5 m, typically energetic conditions of offshore waters.

2.3.2. WEC in Intermediate Water Depths

The attention was here dedicated to locations in intermediate water depths, typically around 40 m with respect to the lowest astronomical tides. As a significant number of WEC power systems were developed for the energetic conditions of offshore waters, there exists a reduced number of technologies in lower installation depth ranges. Thus, in water depths of 40 m around Brittany, the investigation was here restricted to three state-of-the-art technologies (Table 3). This includes one floating structure (Wave Dragon) and two power systems standing on the seabed (Oyster 2 and Wavestar). The first device, Oyster 2, with a rated power of 3.3 MW, consists of oscillating flaps with an axis placed close to the sea bottom [52]. These flaps are linked to a pump station that moves pressurized oil to a shoreline station, where the energy is transformed into electricity. Whereas the device employs the same basic technology as the original Oyster power system (next Section 2.3.3), the design relies on a different shape to maximise the amount of wave energy captured. The second system, Wave Dragon, with a rated power of 7.0 MW, is based on the principle of overtopping. It consists of two symmetrical reflecting wings that focus waves towards a ramp to maximise overtopping [30,46,52]. Behind overtopping, water is collected and driven to a series of Kaplan turbines, thus converting the difference in potential wave energy into electricity. The last WEC, WaveStar, has a rated power of 2.7 MW and consists of a single platform standing on the seabed and linked by arms to a series of floats which take the form of submerged hemispheres [44]. The relative motion between the floats and the structure is transferred via hydraulics into the PTO system to produce energy.
Power matrices also exhibit different responses to surrounding wave conditions (Figure 4). Indeed, whereas the three WEC power systems operate with high performances over a wide range of wave periods extending from 7 to 14 s, increased differences are obtained with respect to the significant wave height. Thus, Wave Dragon reaches its rated power for Hm0 between 4.5 and 7.5 m, whereas Oyster 2 and WaveStar maximise energy production within a restricted range of Hm0 between 6.0 and 7.5 m. In intermediate water depths, varying performances of devices were therefore expected for these three power matrices.

2.3.3. WEC in Nearshore Waters

Nearshore waters refer here to water depths of 20 m with respect to the lowest astronomical tides. In nearshore waters, the investigation considered a series of four WEC power systems, including two oscillating flaps lying on the seabed (Oyster and WaveRoller), a submerged buoy (CETO) and a structure standing on the sea bottom and connected to a series of floats at the surface (WaveStar C6). The first device is the original Oyster power system with a rated power of 290 kW [53]. The technology is the same as the Oyster 2 device, thus exploiting the oscillating movement of a pitching flap implemented at the sea bottom. The second WEC power system is the CETO, with a rated power of 260 kW. The device consists of a submerged buoy whose working principle is close to that of Seabased AB (Section 2.3.1) [44]. Thus, the PTO system is hydraulic, placed on the sea bottom and connected to a buoy via a tether. The third WEC is the WaveRoller system, with a rated power of 1 MW. The device comprises an oscillating flap attached via a pivot to a basement structure that lies on the seabed [49]. The pitching motion of the flap is exploited to convert wave power to electrical power. The last device is the WaveStar C6, with a rated power of 600 kW [50]. This WEC is designed following the same principle as WaveStar (Section 2.3.2). Thus, the system is equipped with 20 floats which are hinged by individual 12 m steel arms to a main tube. Ten floats are placed on each side of the tube. The relative movement of the floats is transferred by a hydraulic cylinder to the PTO, thus producing electricity.
As for the other devices, power matrices exhibit varying responses to incoming waves conditions (Figure 5). Thus, in energetic sea states, Oyster and WaveRoller show higher performances for wave periods between 9 to 13 s whereas CETO is characterised by increased performances for restricted conditions with peak periods between 7 and 8 s. In comparison, WaveStar C6 reaches its rated power over an extended range of wave periods from 3 to 14 s. These WEC power systems operate furthermore for varying significant wave heights restricted to 4 m for WaveStar C6 and extended to more than 5 m for Oyster and CETO. On the one hand, increasing the range of Hm0 for power conversion clearly impacts the operating time of devices, thus extending wave conditions exploited to produce electricity. On the other hand, higher energetic wave conditions are required to reach the rated power, thus impacting the performance of devices, especially in nearshore waters where waves may experience significant energy dissipation by bottom friction [54]. For these reasons, a detailed investigation of WEC performances with a refined wave hindcast database is requested.

2.4. Performance Indicators and Resource Metrics

The wave hindcast database and WEC performances were evaluated using a series of statistical indicators and scoring metrics, briefly detailed hereafter. These different indexes and metrics refer to (i) the assessment of wave model predictions in in-situ locations considered around Brittany, (ii) the evaluation of the available resource focusing on its temporal variability (pre-production metrics) and (iii) the performances of WEC power systems (post-production metrics).

2.4.1. Model Performance Indicators

Thus, the wave hindcast database was assessed by focusing on predictions of the significant wave height Hm0 and the wave energy period Te at the eight measurement locations considered around Brittany. Following a series of advanced wave model evaluations [55,56,57], we considered (i) the mean absolute error
M A E = i = 1 N S i O i / N
(ii) the normalised bias
N B I = i = 1 N S i O i / i = 1 N O i
and (iii) the symmetrically normalised root mean square error
H H = i = 1 N S i O i 2 / i = 1 N S i O i
with N the number of data in the discretised time series considered, and (Si) and (Oi) the two sets of simulated and observed values, respectively. The NBI index complements the MAE by providing further information about the average relative error. By combining information about the average component of the error and the scatter component, the HH index enables a refined evaluation of performances of numerical wave models in comparison to traditional indexes such as the root mean squared error (RMSE), its normalised form (NRMSE) or the scatter index (SI) [58,59].

2.4.2. Pre-Production Metrics

Beyond the spatial distribution of averaged quantities such as the mean significant wave height or the available wave energy flux, particular interest must be devoted to resource temporal variability. Indeed, a location may show high annual wave energy resources, whereas it is characterised by pronounced variations in the wave climate liable to impact the intermittency in electricity production or devices’ ability to survive external constraints. Such complementary evaluation is, therefore, fundamental to the preliminary stages of a wave energy project. Following a series of investigations exploiting numerical simulations [22,38,60,61,62,63], we considered two pre-production metrics, including the annual variability index
A V I = P A 1 P A 2 / P y e a r
and the monthly variability index
M V I = P M 1 P M 2 / P y e a r
with Pyear the annual mean wave power over the period of interest, and PA1 and PA2 the mean available wave powers for the most and the least energetic years, respectively. PM1 and PM2 are, in the same way, the mean powers for the most and the least energetic months, respectively. The stronger the indexes AVI or MVI are, the more important the associated temporal variability is. Thus, increased (reduced) AVI indexes characterise important (weak) variations in the mean available wave power between years. The MVI index characterises, in a similar manner, variations in the monthly wave power, and a part of the inter-seasonal variability.

2.4.3. Post-Production Metrics

According to a significant number of wave energy resource assessments [5], the energy output from WECs was estimated by coupling numerical wave predictions of the significant wave heights and wave periods with the distribution of expected energy output for the corresponding classes of Hm0 and Tp/Te provided by power matrices (Section 2.3). Thus, the energy output evaluated with this method depends on the technological characteristics, performances and operating modes of the devices’ power systems. We considered, therefore, a series of post-production metrics to evaluate and compare WEC performances. Following Majidi et al. [31,32], this includes (i) the capacity factor, (ii) the rated capacity factor and (iii) the efficiency index.
The capacity factor is a widely-used parameter equivalent to the amount of device full capacity exploited during a given time period (typically several years). It takes the form of
C f = P o u t / P r a t e d × 100 %
where Prated is the rated power and Pout is the averaged power produced by the device defined as Pout = Eout/ΔT with Eout the WEC energy output over a time interval ΔT.
As Gao et al. [64] exhibited, comparing WECs’ performances based solely on the capacity factor may ignore further properties of energy production, leading to partial results or quite an unjust ranking between devices. Thus, the analysis has to integrate additional indicators exhibiting the number of hours that power production is below or over a minimum level. For this purpose, we considered the rated capacity factor defined as
R f = k / n × 100 %
with k the number of hours for the device operating at over 90% of its rated power and n the total number of hours during the period considered.
Following Diaconu and Rusu [65], the efficiency index Ei was finally considered to evaluate the maximum power production capacity of a given WEC power system. It is defined as
E i = P o u t / P o u t , m a x × 100 %
with Pout,max the maximum power produced by the device during the time interval considered for energy production. By exhibiting differences with respect to the maximum power produced, Ei thus reports the variability and stability degree of power production.
These resource metrics were finally complemented by two indicators exhibiting annual and monthly variabilities in energy production. Following the two pre-production metrics considered for the available resource, we retained similar indexes for energy productions, the annual and monthly variability indexes of energy output
A V I o u t = P o u t , A 1 P o u t , A 2 / P o u t , y e a r
and
M V I o u t = P o u t , M 1 P o u t , M 2 / P o u t , y e a r
with Pout,year the mean annual wave power produced by the device over the time period considered (27 years in the present investigation), and Pout,A1 and Pout,A2 the mean annual wave power outputs for the years with the most and the least energy productions, respectively. Pout,M1 and Pout,M2 are, in the same way, the mean power outputs for the months with the highest and the lowest energy productions, respectively. In comparison with metrics AVI and MVI, these indexes were computed in the different locations with water depths of 60, 40 and 20 m for the thirteen WEC power systems considered; this was also the case for post-production metrics Cf, Rf and Ei.

3. Results and Discussion

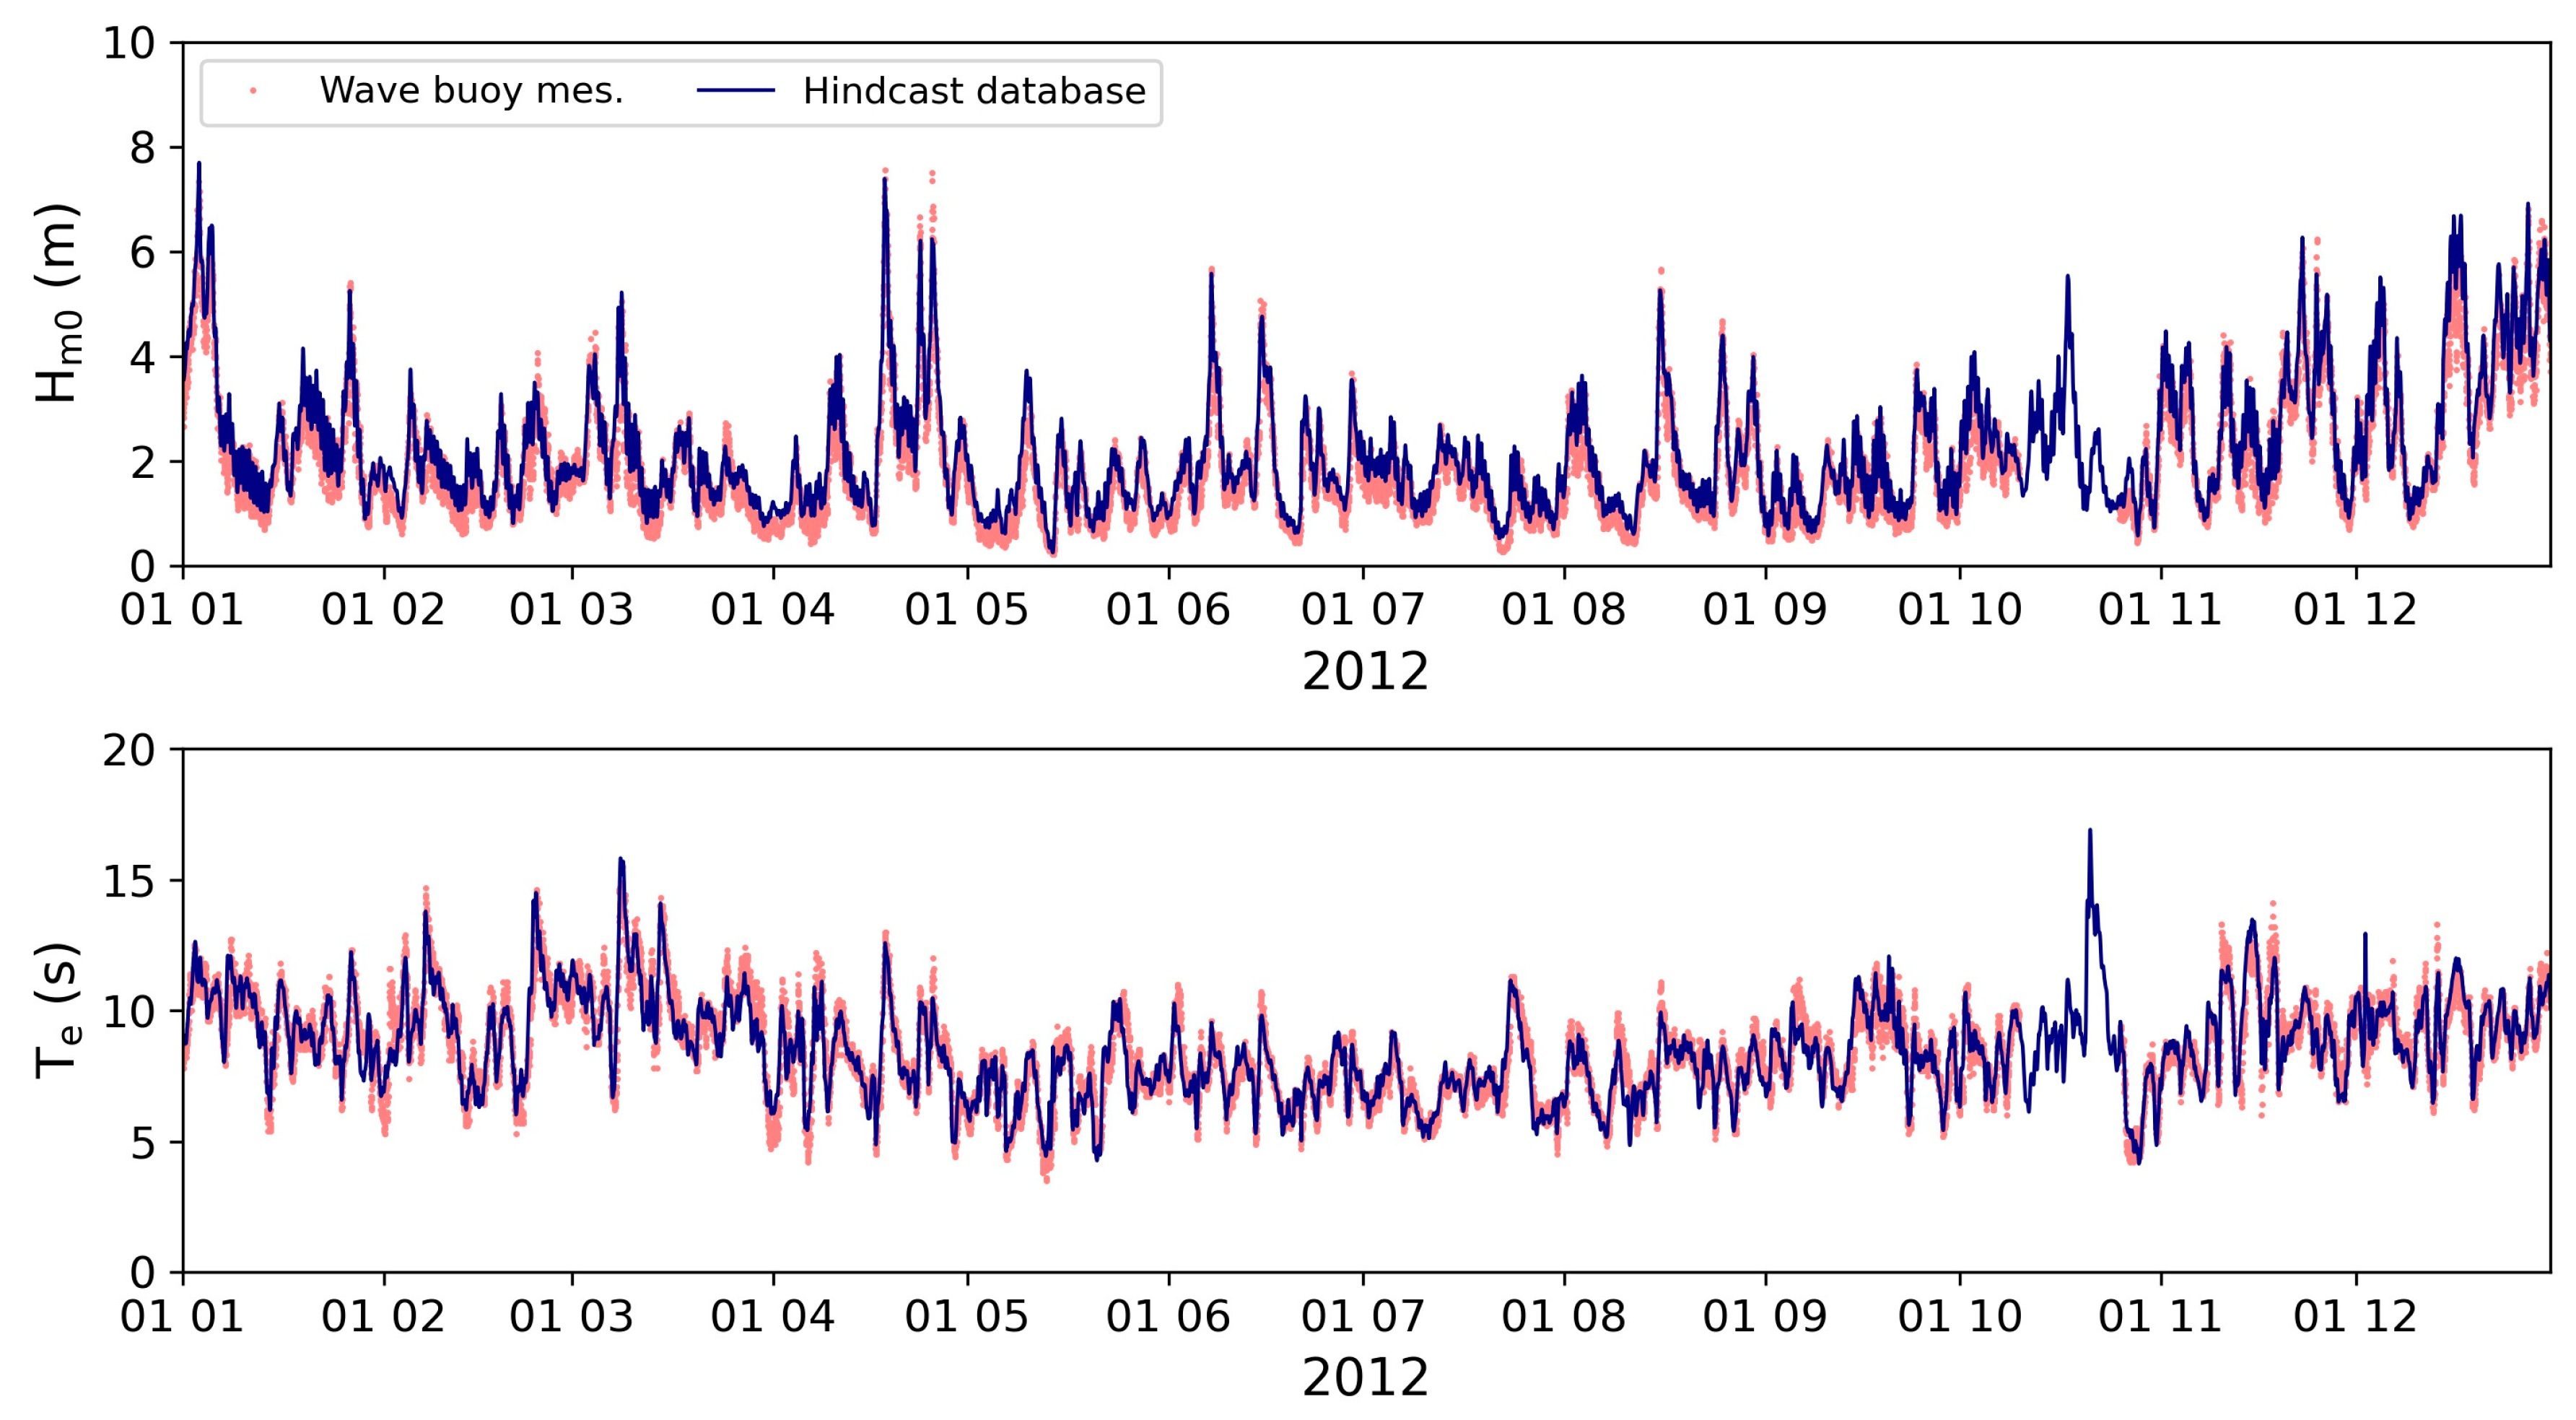
3.1. Evaluation of the Wave Hindcast Database

Predictions extracted from the wave hindcast database were evaluated in a series of in situ wave buoys disseminated in water depths between 30 and 100 m around Brittany (Figure 1 and Table 2). The comparison focused on the significant wave height Hm0 and the wave energy period Te.
For the significant wave height, we obtained a good correlation between observations and model predictions at the eight locations considered (Figure 6). Thus, despite a tendency to overestimate Hm0 confirmed by positive NBI values, this comparison resulted in low HH indexes below 0.2 consistent with estimations derived from spectral phase-averaged wave models in coastal waters [38,55,57] (Table 4). Observed and predicted time series at wave buoy W4, located off western Brittany, confirmed furthermore the reliability of the wave hindcast database for approaching the seasonal evolution of the wave climate characterised here by a pronounced variability in energetic conditions during the winter period [28,29] (Figure 7).
For the wave energy period, predictions also appeared consistent with observations (Figure 8). Unlike estimations of Hm0, however, there was not a clear tendency for over- or under-estimations of observed Te. At the eight locations considered, the normalised bias NBI was thus found to vary between −0.02 and 0.03. Nevertheless, we obtained reduced values of the symmetrically normalised root mean square error HH, below 0.12 at the eight wave buoys, which appeared consistent with predictions established in coastal waters [38,55,57]. Thus, Mentaschi et al. [57] obtained minimum HH indexes of 0.13 for approaching the observed mean wave period in the Mediterranean Sea. Similar minimum estimations were also obtained by Kalourazi et al. [55] in the Gulf of Mexico.
Therefore, this complementary assessment of the wave hindcast database ResourceCODE showed no particular bias in the approach of wave conditions in coastal waters around Brittany. This confirmed the interest of this hindcast database for a refined evaluation of the available wave energy resource and WEC performances in this environment.

3.2. Spatio-Temporal Variability of Available Wave Energy

3.2.1. Spatial Distribution of Energetic Patterns

Figure 9 shows the spatial distribution of the averaged significant wave height and available wave energy flux over the 27-year period (between 1994 and 2020) in water depths of 60, 40 and 20 m around Brittany. Offshore locations were naturally characterised by increased exposure to incoming waves with mean values of Hm0 and Pw exceeding 1.5 m and 20 kW m−1, respectively. However, these two parameters experienced a significant decrease in intermediate and shallow waters. These effects were particularly noticeable in the north-eastern and south-eastern regions of Brittany characterised by an extension of its continental shelf to several tens of kilometres from the coastline (Figure 1). Thus, in these areas, the averaged significant wave height was nearly halved between offshore (60 m here) and shallow water (20 m) locations decreasing from values exceeding 1.8 m to less than 1.0 m. This resulted in an increased spatial variability in coastal mean wave power, with values extending from more than 20 kW m−1 in the exposed regions of western Brittany to less than 5 kW m−1 along the north-eastern and south-eastern areas, as well as behind islands or headlands. These evolutions may be attributed to depth- and current-induced refraction redistributing the offshore incoming wave energy along the coastline [66]. However, a number of these variations may also result from increased dissipation of wave energy by bottom friction. Thus, in the English Channel, the significant wave height was found to decrease by more than 20% during storm conditions under the effects of bottom friction [54].
Directly exposed to North-Atlantic incoming waves and characterised by a reduced continental shelf, the western extent of Brittany was the area with the highest energetic wave conditions. Thus, the mean significant wave height and wave energy flux exceeded 2.0 m and 40 kW m−1, respectively. These offshore estimations appeared consistent with the evaluations conducted by Guillou and Chapalain [28] by exploiting predictions of coastal phase-averaged spectral wave models during an eight-year period (2004–2011). However, it remained (i) lower than the evaluation of 50 kW m−1 conducted by Mattarolo et al. [2] from regional predictions at the scale of the European continental shelf during a 23-year period (1979–2001) and (ii) over the estimation of 28 kW m−1 performed by Gonçalves et al. [27] from coastal predictions during three years (1998–2000). Beyond differences in wave simulations, including model types, spatial and temporal resolutions or parametrisations, these various estimations may also be attributed to the temporal variability of the wave climate off Brittany. Thus, as exhibited in Figure 10, we obtained different evaluations of the mean available wave energy flux for the time period considered. In the present investigation, uncertainties in evaluating the available resource reached 10% if the time period was restricted to five years and still showed differences exceeding 5% for a ten-year period. This confirmed that a minimum period of 20 years was required to obtain refined resource characterisations [7,67].

3.2.2. Wave Energy Variation during 1994–2020

As exhibited in the previous section, a refined evaluation of the available wave energy resource requires an advanced assessment of the temporal variability of the wave climate. Indeed, beyond averaged quantities of significant wave height and available wave power, potential WEC developers need to characterise temporal resource variations as they may impact the energy production and performances of devices [30]. Particular attention was therefore dedicated to the annual and seasonal variabilities of the available resource.
The wave energy resource of Brittany was characterised by increased inter-annual variations, particularly noticeable in offshore locations with water depths of 60 m (Figure 11). The yearly available wave power averaged over these different offshore locations was thus found to vary from 36.0 kW m−1 in 2014 to 17.6 kW m−1 in 2010. This increased inter-annual variability was exhibited by the spatial distribution of the pre-production metric AVI (Figure 12). We therefore obtained AVI indexes up to 0.8 in offshore waters characterising, over the 27-year period (1994–2020) considered, variations of the yearly available wave power by 80% with respect to the mean energy flux. These inter-annual variations appeared, however, to decrease below 0.4 in shallow waters in the north-eastern region of Brittany, thus characterising reduced differences in the amount of available wave energy flux between years.
In the south-eastern part of Brittany, values obtained for the pre-production metric MVI appeared consistent with the evaluation conducted by Goncalves et al. [22] with indexes varying between 1.8 and 2.0 in intermediate and shallow waters (Figure 12). However, this investigation was restricted to a local area centred around the SEM-REV French Atlantic test site. Additionally, at Brittany’s scale, we exhibited here a contrasting spatial distribution of MVI between (i) the northern region and (ii) the western and southern areas. Thus, we obtained lower values of the pre-production metric MVI off the northern coast of Brittany than off the southern coast, which characterised reduced monthly and seasonal variations of the available wave power in the entrance of the English Channel. Confirming the investigation performed by Kamranzad et al. [68] in the Gulf of Persia, the monthly variability was furthermore found to decrease approaching the coast reaching values below 1.4 in the north-eastern part of Brittany and decreasing below 1.6 behind islands or at the background of bays. This spatial distribution may also explain the reduced annual differentiations previously exhibited in shallow waters.

3.3. WEC Performances

3.3.1. Averaged Performances

The performances of WEC power systems in water depths of 60, 40 and 20 m were successively investigated with respect to the spatial distributions of the capacity factor Cf, the rated capacity factor Rf and the efficiency index Ei. These distributions were placed towards the evolution of the averaged significant wave height Hs,mean and available wave energy flux Pw,mean shown in Figure 9, so as to identify the associated locations along the three isolines.
In offshore waters (60 m), the spatial distribution of Hs,mean clearly exhibited the increased exposition of western Brittany between the locations numbered #14 and #30 from the bay of Audierne to the area north of the isle of Ushant (Figure 13). Thus, these locations were characterised by energetic wave conditions with Hs,mean over 2.0 m with an exception behind the isle of Ushant where Hs,mean decreased below 1.4 m. The performances of the six WEC power systems considered followed similar trends with increased capacity factors in energetic locations in western Brittany. For these different devices, the best performances were obtained at point #26, off the isle of Ushant (Figure 2). The capacity factor’s ranking remained the same between offshore locations. However, resource metrics exhibited a clear contrast between performances from Oceantec and performances from the five other devices. Thus, off western Brittany, the capacity factor of this converter was found to exceed 40% against less than 26% for the five other WECs. These increased performances were also reported by Majidi et al. [31] in the Black Sea. The detailed investigation of the rated capacity factors Rf provided further insights about these increased values (Figure 13). Thus, in energetic locations in western Brittany, Oceantec was found to operate at over 90% of its rated power during more than 10% of the time. In contrast, this proportion decreased below 4% for the other WECs. These increased performances may be explained by the shape of the associated power matrix (Figure 3). Indeed, among the six offshore devices, Oceantec reaches its rated power within a wide range of reduced significant wave heights (from 2.5 to 5.5 m) and wave energy periods (from 6 to 10 s). This device appears therefore particularly suited to the wave climate of Brittany, which may show, in offshore locations, (i) an increased variability of wave events between the winter and the summer periods and (ii) contrasting conditions with swell-dominated events and combined swell and locally-generated wind sea [28,30]. Thus, as other devices stopped or reduced the energy exploitation for wave periods below 8/9 s, we obtained reduced performances for these WEC power systems. The efficiency index Ei finally showed a graduated distribution between devices. Indeed, this metric reported a number of time variations in energy output via differences with maximum power produced. Thus, whereas the rated power may not be reached, the device may show high energy efficiency. This is especially the case in locations with low wave energy resources characterised by a reduced variability in wave power [31]. Furthermore, in comparison with Cf and Rf, results obtained with this parameter reported increased performances for the Seabased device. Indeed, for this device, the rated power is reached for significant wave height over 6.5 m and peak period of 7 s (Figure 3). As this condition was not reached in offshore waters, differences between metrics Cf and Ei were exhibited for this device. This confirmed the interest in exploiting additional metrics to the capacity factor for investigating WEC performances. For the three post-production metrics considered, we obtained the lowest performances for AWS. Indeed, unlike Oceantec, the power matrix of this WEC power system reaches its rated power and high power production for increased wave periods, typically swell conditions.
In intermediate water depths (40 m), best performances were obtained for Wave Dragon, with the capacity factor and efficiency index exceeding 25% in energetic locations in western Brittany against less than 18% for Oyster 2 and WaveStar (Figure 14). Such a discrepancy was also obtained for the two other post-production metrics Rf and Ei. These increased performances from Wave Dragon appeared consistent with the investigations conducted by Guillou and Chapalain [30] in western Brittany and Sierra et al. [20] along the south-western Atlantic coast of France. Indeed, this device reaches its rated power over an extended range of significant wave heights over 4 m, thus capturing a greater part of the varying available wave energy resource (Figure 4). In energetic locations, Wave Dragon was, therefore, able to operate over 90% of its rated capacity for more than 5% of the time. This contrasted with the operating modes of Oyster 2 and WaveStar characterised by negligible values of the rated capacity factor Rf. Indeed, in comparison to Wave Dragon, these two devices operated for wave periods over 7 s and reached the rated power for energetic wave conditions with significant wave heights over 6 m. This naturally restricted the performances of these two wave power systems in intermediate water depths characterised by a significant attenuation of the available wave energy flux compared to offshore waters [28,29].
In nearshore waters (20 m), we obtained a heterogeneous spatial distribution of wave conditions associated with the varying bathymetry and irregularity of the coastline (Figure 15). The best performances were obtained for Oyster and WaveStar C6, which reached capacity factors over 44% near the isles of Sein and Ushant. These two devices exhibited nearly the same distribution of performance indicators in water depths of 20 m. However, for Oyster, post-production metrics appeared (i) slightly lower than WaveStar C6 along the southern and northern coasts of Brittany and (ii) slightly greater than WaveStarC6 in energetic locations in western Brittany. Thus, near the isle of Ushant (location #45), we obtained a rated capacity factor of 18% for Oyster against 15% for WaveStar C6. This ranking was modified near the isle of Belle-Ile-en-Mer (location #15), where Rf reached 3% for Oyster and 5% for WaveStar C6. For the two other devices, the ranking of performance indicators remained nearly the same, exhibiting greater capacity factor and efficiency index for WaveRoller than CETO. The investigation of WEC power matrices also provided further insights about these different performances (Figure 5). Thus, in comparison with CETO and to a lesser extent WaveRoller, Oyster and WaveStar C6 reach their rated power over a wide range of wave periods extending from around 6 to 13 s and from around 3 to 13 s, respectively. Maximum energy production was furthermore obtained over a wide range of significant wave heights starting from around 2.5/3 m. As for the other WECs considered in water depths of 40 and 60 m, this confirms that the shape of power matrices clearly influences devices’ performances.

3.3.2. Annual and Monthly Variabilities in WEC Performances

In the previous section, WEC performances were assessed by relying on post-production metrics established from averaged or maximum quantities while ignoring the temporal variability in power production. However, as exhibited in a series of resource characterisations [20,30,69], these aspects may be necessary to consider. Indeed, a device may show high performances from averaged quantities whereas the energy output experiences strong seasonal intermittency with contrasting variations between the winter and the summer periods. Beyond the optimisation of WEC design to the local wave climate, the resulting increased intermittency may lead to problems for its integration into the grid. These aspects were investigated with the two post-production metrics AVIout and MVIout here proposed (Section 2.4.3), exhibiting the annual and monthly variabilities of energy output for the 13 devices in water depths of 60, 40 and 20 m around Brittany. The spatial distributions of these two metrics were shown with respect to the distribution of the two pre-production metrics AVI and MVI referring to the temporal variabilities of the available resource.
In offshore waters (60 m), a clear correlation was exhibited between the performances of WEC power systems and the temporal variability in energy output (Figure 16). Thus, a device with high (low) values of AVIout and MVIout showed low (high) values of performances indicators Cf, Rf and Ei (Figure 13). With reduced temporal variabilities at annual and monthly scales, Oceantec and Seabased showed, therefore, the highest performances among the six devices considered in offshore waters. Conversely, we obtained reduced performances for AWS characterised by increased temporal variabilities. Whereas the available resource showed noticeable spatial variability in metric MVI between the northern and southern parts of Brittany (Section 3.2.2), these differences were smoothed for the metric MVIout. This confirmed the investigation conducted by Guillou and Chapalain [30] about the annual and seasonal variabilities of WEC energy output in western Brittany. Thus, the generated technical power exhibited reduced temporal variations compared to the available resource, restricting differences obtained from metrics AVIout and MVIout in offshore locations. However, behind the isle of Ushant (locations #27 and #28), the temporal variability in energy output was found to increase, whereas the temporal variability in the available resource was found to decrease. Indeed, these two locations showed reduced wave energetic conditions with Hs,mean estimated around 1.3 m against more than 2.4 m in the surrounding exposed locations (Figure 9). Thus, for these conditions, the device operated farther from maximum power production, which increased the range of energy output and restricted the rated capacity factor. For the different devices, therefore, we obtained a drop in the evolution of Rf behind the isle of Ushant (Figure 16). This evolution was particularly noticeable for Oceantec, characterised by the highest rated capacity factor in offshore waters. Furthermore, as for the WEC performances discussed in the previous section, devices showed nearly the same ranking between metrics AVIout and MVIout in offshore locations. Thus, compared to the other WEC power systems, a device with low temporal variability in energy output maintained this reduced intermittency in offshore locations considered around Brittany.
In intermediate waters (40 m), reduced differences were obtained between post-production metrics AVIout and MVIout, in spite of pronounced differences in WEC performances from Cf, Rf and Ei (Figure 14 and Figure 17). Furthermore, the results obtained exhibited the smoothing effect of energy production on the spatial distribution of these two pre-production metrics with variations in AVIout and MVIout restricted between 0.3 and 0.6 and between 0.9 and 1.6, respectively. The reduced differences obtained in temporal variabilities in energy output may also be explained by the wide range of wave periods for the operation of the three WECs extending from 7 to 14 s (Figure 4). As exhibited in the previous section, however, Wave Dragon showed increased performances as it was operating at its rated power over a wide range of significant wave heights including moderate storm conditions with Hm0 between 3.5 and 6.0 m.
With respect to performance indicators in nearshore waters (20 m) (Section 3.3.1), we obtained an increased spatial variability in the distribution of post-production metrics AVIout and MVIout, despite the smoothing effect induced by energy production (Figure 18). These advanced investigations also provided further insights into the adaptability of WECs to the wave climate in nearshore waters around Brittany. Thus, whereas performance indicators (Cf, Rf and Ei) of Oyster and WaveStar C6 were very close, post-production metrics AVIout and MVIout exhibited increased differences. In the north-western part of Brittany (location #40), Oyster was thus characterised by increased temporal variability, reaching AVIout of 0.4 and MVIout of 1.3 against 0.2 and 0.7 for WaveStar C6. Concerning these indicators, WaveStar C6 appeared, therefore, to be the WEC with the best performances in nearshore waters, reaching increased capacity factor and efficiency while restricting intermittency in energy outputs at annual and monthly scales. Finally, the spatial distribution of AVIout and MVIout exhibited different evolutions between WEC power systems, impacting the ranking for the location considered in nearshore waters. This increased heterogeneity was partly associated with the increased heterogeneity in wave conditions between exposed and protected locations. Indeed, as exhibited in offshore waters, the temporal variability in energy output may be increased in locations with reduced wave energy conditions (and reduced temporal variability in the available resource), and this influence varied with the WEC power systems considered. Thus, whereas CETO showed reduced temporal variability in the energy output in the exposed north-western part of Brittany (between locations #50 and #60), more increased variations were obtained in the north-eastern part (between locations #65 and #75), particularly noticeable at the annual scale.

4. Conclusions

Predictions derived from a 27-year wave hindcast database were first processed to produce a series of cartographies characterising wave energy patterns in the coastal seas of Brittany (France). Particular attention was dedicated to the temporal variability of the available wave energy resource at annual and monthly scales. Predictions were then exploited to assess the performances of a series of 13 state-of-the-art WEC power systems in water depths of 60, 40 and 20 m around Brittany. With respect to previous investigations, the main outcomes of the present study are as follows:
  • With great exposure to North-Atlantic incoming waves, the western extent of Brittany showed increased values of the available wave energy resource, which contrasted with the reduced resource both in the north-eastern region at the entrance of the English Channel and in the south-eastern area. We exhibited furthermore a decrease in the wave resource between offshore and nearshore waters with respect to depth- and current-induced refraction, and energy dissipation by bottom friction. This contributed to pronounced spatial variability in the wave energy flux in shallow waters with values of up to 20 kW m−1 in the exposed locations to less than 5 kW m−1 behind islands or headlands.
  • We exhibited increased temporal variability in the available wave power in energetic offshore locations, resulting in pronounced evolutions of the yearly averaged resource. Our investigation revealed furthermore a contrasting spatial distribution between (i) the northern region with slightly reduced monthly variability and (ii) the western and southern areas with slightly increased variations in the monthly available wave power.
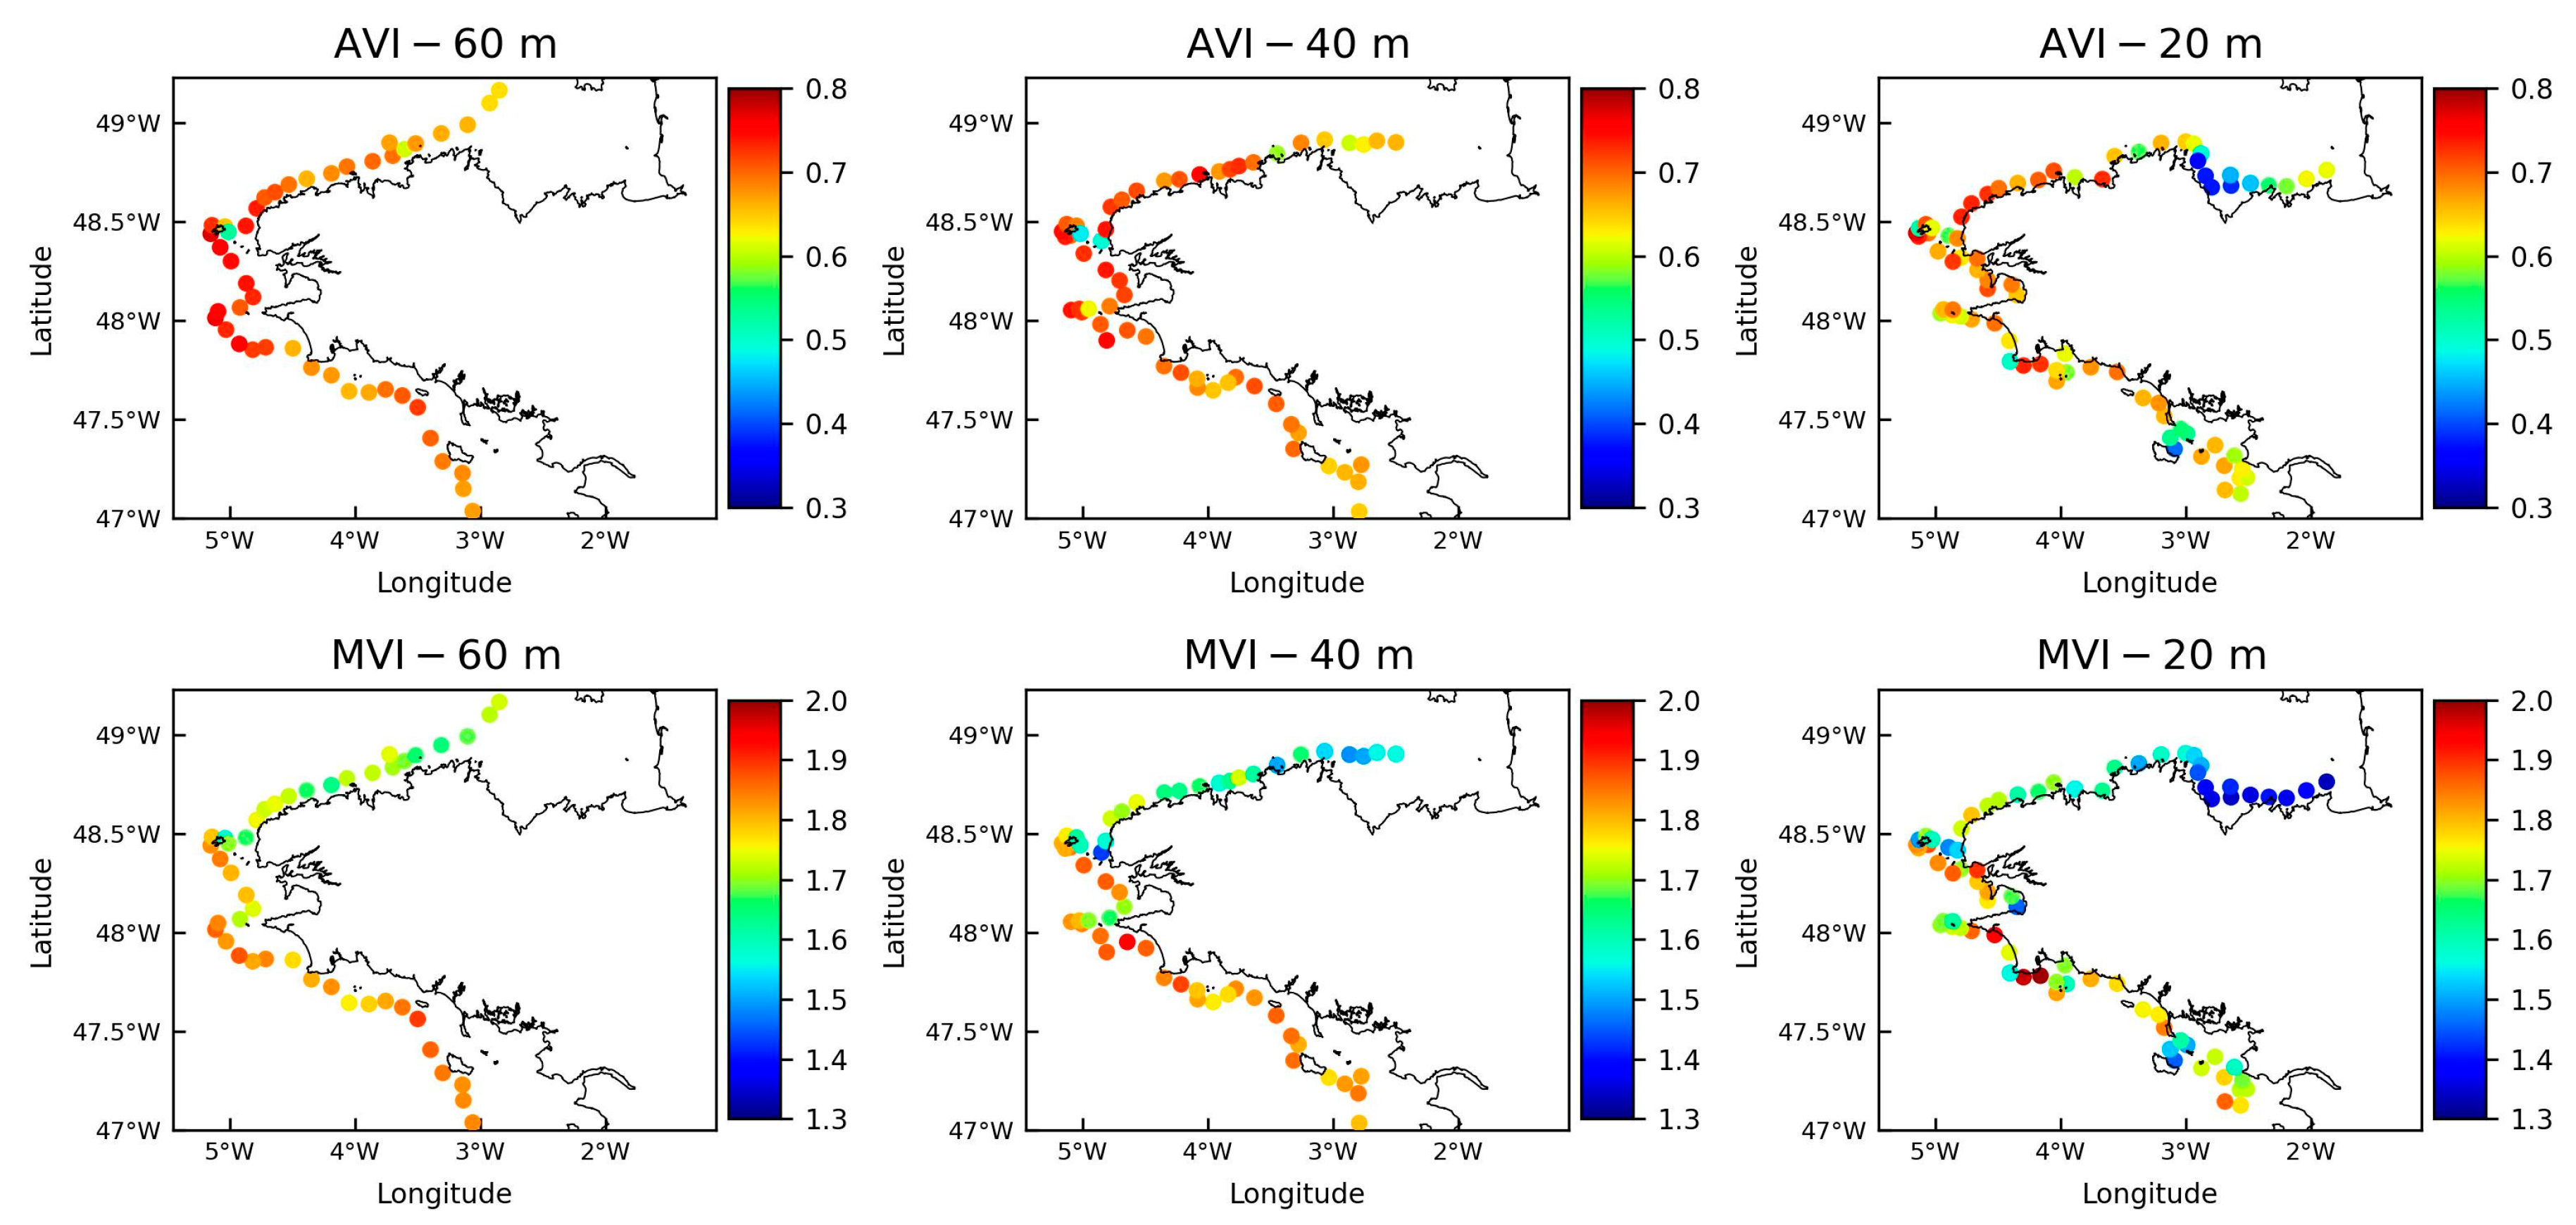
  • We identified the most promising sites for the implementation of WEC power systems, confirming the interest in western Brittany for offshore exploitation near the isles of Ushant and Sein and off the Crozon Peninsula. In water depths of 40 and 20 m, complementary locations were also exhibited (i) in the bay of Audierne, (ii) along the northern coast of western Brittany, and (iii) south of the SEM-REV site in the south-eastern areas of Brittany.
  • We obtained the first ranking of WEC performances from a series of post-production metrics. The results obtained exhibited the effectiveness of Oceantec in water depths of 60 m. Wave Dragon appeared to be the device with the highest performances in water depths of 40 m, whereas Oyster and WaveStar C6 showed the highest scorings in water depths of 20 m. We analysed the correlation between devices’ performances and the shape of the associated power matrices. The results obtained revealed finally that the ranking between WEC power systems remained nearly the same at the different locations considered around Brittany, especially in offshore waters.
  • Complementing the evaluation based on averaged quantities, we characterised the temporal variability of energy output. Thus, in offshore locations with water depths of 60 m, a clear correlation was exhibited between reduced intermittency in energy production and increased values of the capacity factor. We noticed, however, that a reduced variability in the available resource may be correlated with an increased variability in energy production, especially in areas characterised by reduced wave conditions. This complementary evaluation finally provided further insights about the selection of WEC power systems, thus confirming the interest of WaveStar C6 for an implementation in water depths of 20 m.
This advanced evaluation of the available and technically exploitable resource may therefore be exploited by potential developers and government authorities to optimise the selection of sites, projects and WEC technologies within one of the most exposed regions of north-western Europe. Thus, the exploitation of the high-spatial resolution wave hindcast database with power matrices from devices exhibited increased performances in the coastal seas around Brittany. However, more detailed investigations may be required to introduce the directionality of the available resource. Moreover, whereas this investigation neglected practical, political or environmental issues and marine activities, we may also consider additional physical constraints associated with the ability of WEC structures to survive extreme storm events and/or the moorings of devices. These additional investigations will help to identify the best technology and implementation for wave energy conversion around Brittany.

Author Contributions

N.G.: Conceptualization, Methodology, Software, Validation, Formal analysis, Investigation, Writing—original draft, Writing—review & editing, Visualization, Supervision, Project administration. G.L.: Writing—review & editing, Investigation. B.K.: Writing—review & editing, Investigation. All authors have read and agreed to the published version of the manuscript.

Funding

This research received no external funding.

Institutional Review Board Statement

Not applicable.

Informed Consent Statement

Not applicable.

Data Availability Statement

Not applicable.

Acknowledgments

The present investigation was conducted as part of an exploratory project following a research study conducted for the Region Brittany (France). A part of treatment and analysis of data was conducted on computer facilities DATARMOR of “Pôle de Calcul et de Données pour la Mer” (PCDM) (https://pcdm.ifremer.fr/).

Conflicts of Interest

The authors declare no conflict of interest.

References

  1. Gunn, K.; Stock-Williams, C. Quantifying the Global Wave Power Resource. Renew. Energy 2012, 44, 296–304. [Google Scholar] [CrossRef]
  2. Mattarolo, G.; Lafon, F.; Benoit, M. Wave Energy Resource off the French Coasts: The ANEMOC Database Applied to the Energy Yield Evaluation of Wave Energy Converters. In Proceedings of the 8th European Wave and Tidal Energy Conference, Uppsala, Sweden, 7–10 September 2009; p. 9. [Google Scholar]
  3. Clément, A.; McCullen, P.; Falcão, A.; Fiorentino, A.; Gardner, F.; Hammarlund, K.; Lemonis, G.; Lewis, T.; Nielsen, K.; Petroncini, S.; et al. Wave Energy in Europe: Current Status and Perspectives. Renew. Sustain. Energy Rev. 2002, 6, 405–431. [Google Scholar] [CrossRef]
  4. Falcão, A.F.d.O. Wave Energy Utilization: A Review of the Technologies. Renew. Sustain. Energy Rev. 2010, 14, 899–918. [Google Scholar] [CrossRef]
  5. Guillou, N.; Lavidas, G.; Chapalain, G. Wave Energy Resource Assessment for Exploitation—A Review. J. Mar. Sci. Eng. 2020, 8, 705. [Google Scholar] [CrossRef]
  6. IEC. Marine Energy—Wave, Tidal and Other Water Current Converters—Part 101: Wave Energy Resource Assessment and Characterization; International Electrotechnical Commission/Technical Specification: Geneva, Switzerland, 2014. [Google Scholar]
  7. IMAREST. Metocean Procedures Guide for Offshore Renewables; Institute of Marine Engineering, Science & Technology (Offshore Renewables Special Interest Group): London, UK, 2018. [Google Scholar]
  8. Reguero, B.G.; Losada, I.J.; Méndez, F.J. A Recent Increase in Global Wave Power as a Consequence of Oceanic Warming. Nat. Commun. 2019, 10, 205. [Google Scholar] [CrossRef] [PubMed] [Green Version]
  9. Zheng, C.W.; Li, C.Y. Variation of the Wave Energy and Significant Wave Height in the China Sea and Adjacent Waters. Renew. Sustain. Energy Rev. 2015, 43, 381–387. [Google Scholar] [CrossRef]
  10. Holthuijsen, L.H. Waves in Oceanic and Coastal Waters, 1st ed.; Cambridge University Press: Cambridge, UK, 2007; ISBN 978-0-521-86028-4. [Google Scholar]
  11. Atan, R.; Goggins, J.; Nash, S. Galway Bay—The 1/4 Scale Wave Energy Test Site? A Detailed Wave Energy Resource Assessment and Investigation of Scaling Factors. Renew. Energy 2018, 119, 217–234. [Google Scholar] [CrossRef]
  12. Gallagher, S.; Tiron, R.; Whelan, E.; Gleeson, E.; Dias, F.; McGrath, R. The Nearshore Wind and Wave Energy Potential of Ireland: A High Resolution Assessment of Availability and Accessibility. Renew. Energy 2016, 88, 494–516. [Google Scholar] [CrossRef]
  13. Guillou, N.; Neill, S.P.; Thiébot, J. Spatio-Temporal Variability of Tidal-Stream Energy in North-Western Europe. Phil. Trans. R. Soc. A. 2020, 378, 20190493. [Google Scholar] [CrossRef]
  14. Saruwatari, A.; Ingram, D.M.; Cradden, L. Wave–Current Interaction Effects on Marine Energy Converters. Ocean. Eng. 2013, 73, 106–118. [Google Scholar] [CrossRef]
  15. Guillou, N. Modelling Effects of Tidal Currents on Waves at a Tidal Stream Energy Site. Renew. Energy 2017, 114, 180–190. [Google Scholar] [CrossRef] [Green Version]
  16. Pontes, M.T.; Athanassoulis, G.A.; Barstow, S.; Cavaleri, L.; Holmes, B.; Mollison, D.; Oliveira-Pires, H. An Atlas of the Wave-Energy Resource in Europe. J. Offshore Mech. Arct. Eng. 1996, 118, 307–309. [Google Scholar] [CrossRef]
  17. Rusu, L.; Onea, F. Assessment of the Performances of Various Wave Energy Converters along the European Continental Coasts. Energy 2015, 82, 889–904. [Google Scholar] [CrossRef]
  18. Silva, D.; Rusu, E.; Soares, C. Evaluation of Various Technologies for Wave Energy Conversion in the Portuguese Nearshore. Energies 2013, 6, 1344–1364. [Google Scholar] [CrossRef] [Green Version]
  19. Mota, P.; Pinto, J.P. Wave Energy Potential along the Western Portuguese Coast. Renew. Energy 2014, 71, 8–17. [Google Scholar] [CrossRef]
  20. Sierra, J.P.; White, A.; Mösso, C.; Mestres, M. Assessment of the Intra-Annual and Inter-Annual Variability of the Wave Energy Resource in the Bay of Biscay (France). Energy 2017, 141, 853–868. [Google Scholar] [CrossRef] [Green Version]
  21. Kalogeri, C.; Galanis, G.; Spyrou, C.; Diamantis, D.; Baladima, F.; Koukoula, M.; Kallos, G. Assessing the European Offshore Wind and Wave Energy Resource for Combined Exploitation. Renew. Energy 2017, 101, 244–264. [Google Scholar] [CrossRef]
  22. Gonçalves, M.; Martinho, P.; Guedes Soares, C. A 33-Year Hindcast on Wave Energy Assessment in the Western French Coast. Energy 2018, 165, 790–801. [Google Scholar] [CrossRef]
  23. Neill, S.P.; Hashemi, M.R. Wave Power Variability over the Northwest European Shelf Seas. Appl. Energy 2013, 106, 31–46. [Google Scholar] [CrossRef]
  24. Lavidas, G.; Venugopal, V.; Friedrich, D. Wave Energy Extraction in Scotland through an Improved Nearshore Wave Atlas. Int. J. Mar. Energy 2017, 17, 64–83. [Google Scholar] [CrossRef]
  25. Lavidas, G. Selection Index for Wave Energy Deployments (SIWED): A near-Deterministic Index for Wave Energy Converters. Energy 2020, 196, 117131. [Google Scholar] [CrossRef]
  26. Fairley, I.; Smith, H.C.M.; Robertson, B.; Abusara, M.; Masters, I. Spatio-Temporal Variation in Wave Power and Implications for Electricity Supply. Renew. Energy 2017, 114, 154–165. [Google Scholar] [CrossRef] [Green Version]
  27. Gonçalves, M.; Martinho, P.; Guedes Soares, C. Wave Energy Conditions in the Western French Coast. Renew. Energy 2014, 62, 155–163. [Google Scholar] [CrossRef]
  28. Guillou, N.; Chapalain, G. Numerical Modelling of Nearshore Wave Energy Resource in the Sea of Iroise. Renew. Energy 2015, 83, 942–953. [Google Scholar] [CrossRef] [Green Version]
  29. Guillou, N. Evaluation of Wave Energy Potential in the Sea of Iroise with Two Spectral Models. Ocean. Eng. 2015, 106, 141–151. [Google Scholar] [CrossRef]
  30. Guillou, N.; Chapalain, G. Annual and Seasonal Variabilities in the Performances of Wave Energy Converters. Energy 2018, 165, 812–823. [Google Scholar] [CrossRef] [Green Version]
  31. Majidi, A.G.; Bingölbali, B.; Akpınar, A.; Rusu, E. Wave Power Performance of Wave Energy Converters at High-Energy Areas of a Semi-Enclosed Sea. Energy 2021, 220, 119705. [Google Scholar] [CrossRef]
  32. Majidi, A.; Bingölbali, B.; Akpınar, A.; Iglesias, G.; Jafali, H. Downscaling Wave Energy Converters for Optimum Performance in Low-Energy Seas. Renew. Energy 2021, 168, 705–722. [Google Scholar] [CrossRef]
  33. Majidi Nezhad, M.; Groppi, D.; Rosa, F.; Piras, G.; Cumo, F.; Garcia, D.A. Nearshore Wave Energy Converters Comparison and Mediterranean Small Island Grid Integration. Sustain. Energy Technol. Assess. 2018, 30, 68–76. [Google Scholar] [CrossRef]
  34. Accensi, M.; Alday Gonzalez, M.F.; Maisondieu, C.; Raillard, N.; Darbynian, D.; Old, C.; Sellar, B.; Thilleul, O.; Perignon, Y.; Payne, G.; et al. ResourceCODE Framework: A High-Resolution Wave Parameter Dataset for the European Shelf and Analysis Toolbox. In Proceedings of the EWTEC 2021—14th European Wave and Tidal Energy Conference, Plymouth, UK, 5–9 September 2021. [Google Scholar]
  35. SHOM. Courants de Marée—Mer d’Iroise de l’île Vierge à La Pointe de Penmarc’h; Service Hydrographique et Océanographique de la Marine: Paris, France, 2016. [Google Scholar]
  36. Guillou, N.; Neill, S.P.; Robins, P.E. Characterising the Tidal Stream Power Resource around France Using a High-Resolution Harmonic Database. Renew. Energy 2018, 123, 706–718. [Google Scholar] [CrossRef]
  37. Ardhuin, F.; Roland, A.; Dumas, F.; Bennis, A.-C.; Sentchev, A.; Forget, P.; Wolf, J.; Girard, F.; Osuna, P.; Benoit, M. Numerical Wave Modeling in Conditions with Strong Currents: Dissipation, Refraction, and Relative Wind. J. Phys. Oceanogr. 2012, 42, 2101–2120. [Google Scholar] [CrossRef]
  38. Guillou, N.; Chapalain, G.; Sergent, P. Wave Energy Resource Assessment for Small-Scale WEC near a Harbour. JMSE 2022, 10, 1081. [Google Scholar] [CrossRef]
  39. Pineau-Guillou, L. Validation des Atlas de Composantes Harmoniques de Hauteurs et Courants de Marée; MARC: Paris, France, 2013; p. 89. [Google Scholar]
  40. Carrere, L.; Lyard, F.; Cancet, M.; Guillot, A. FES 2014, a New Tidal Model on the Global Ocean with Enhanced Accuracy in Shallow Seas and in the Arctic Region. In Proceedings of the EGU General Assembly Conference, Vienna, Austria, 12–17 April 2015; p. 5481. [Google Scholar]
  41. Accensi, M.; Alday, M.; Maisondieu, C. RESOURCECODE—Resource Characterization to Reduce the Cost of Energy through Coordinated Data Enterprise—Wave Hindcast Database User Manual; ResourceCode: Montreal, QC, Canada, 2022; p. 46. [Google Scholar]
  42. SHOM. MNT Bathymétrique de Façade; Service Hydrographique et Océanographique de la Marine: Paris, France, 2015. [Google Scholar]
  43. Guillou, N. Rôles de l’hétérogénéité Des Sédiments de Fond et Des Interactions Houle-Courant Sur L’hydrodynamique et La Dynamique Sédimentaire En Zone Subtidale—Applications En Manche Orientale et à La Pointe de La Bretagne; Université de Bretagne Occidentale: Brest, France, 2007. [Google Scholar]
  44. Babarit, A.; Hals, J.; Muliawan, M.J.; Kurniawan, A.; Moan, T.; Krokstad, J. Numerical Benchmarking Study of a Selection of Wave Energy Converters. Renew. Energy 2012, 41, 44–63. [Google Scholar] [CrossRef]
  45. Bozzi, S.; Besio, G.; Passoni, G. Wave Power Technologies for the Mediterranean Offshore: Scaling and Performance Analysis. Coast. Eng. 2018, 136, 130–146. [Google Scholar] [CrossRef]
  46. Veigas, M.; López, M.; Romillo, P.; Carballo, R.; Castro, A.; Iglesias, G. A Proposed Wave Farm on the Galician Coast. Energy Convers. Manag. 2015, 99, 102–111. [Google Scholar] [CrossRef]
  47. Patel, R.P.; Nagababu, G.; Kachhwaha, S.S.; Kumar, S.V.A.; Seemanth, M. Combined Wind and Wave Resource Assessment and Energy Extraction along the Indian Coast. Renew. Energy 2022, 195, 931–945. [Google Scholar] [CrossRef]
  48. Dalton, G.J.; Alcorn, R.; Lewis, T. Case Study Feasibility Analysis of the Pelamis Wave Energy Convertor in Ireland, Portugal and North America. Renew. Energy 2010, 35, 443–455. [Google Scholar] [CrossRef]
  49. Maki, T.; Vuorinen, M.; Mucha, T. WaveRoller—One of the Leading Technologies for Wave Energy Conversion. In Proceedings of the 4th International Conference on Ocean Energy (ICOE), Halifax, NS, Canada, 6 November 2014. [Google Scholar]
  50. Marquis, L.; Kramer, M.; Kringelum, J.; Chozas, J.F.; Helstrup, N.E. Introduction of Wavestar Wave Energy Converters at the Danish Offshore Wind Power Plant Horns Rev 2. In Proceedings of the ICOE Conference, Dublin, Ireland, 17–19 October 2012. [Google Scholar]
  51. Salcedo, F.; Ruiz-Minguela, P.; Rodriguez, R.; Ricci, P.; Santos, M. OCEANTEC: Sea Trials of a Quarter Scale Prototype. In Proceedings of the 8th European Wave and Tidal Energy Conference, Uppsala, Sweden, 7–10 September 2009; p. 6. [Google Scholar]
  52. Lo Re, C.; Manno, G.; Basile, M.; Ciraolo, G. The Opportunity of Using Wave Energy Converters in a Mediterranean Hot Spot. Renew. Energy 2022, 196, 1095–1114. [Google Scholar] [CrossRef]
  53. Cameron, L.; Doherty, K.; Doherty, R.; Henry, A.; Van’t Hoff, J.; Kaye, D.; Naylor, D.; Bourdier, S.; Whittaker, T. Design of the Next Generation of the Oyster Wave Energy Converter. In Proceedings of the 3rd International Conference on Ocean Energy, Bilbao, Spain, 6–8 October 2010. [Google Scholar]
  54. Guillou, N. Wave-Energy Dissipation by Bottom Friction in the English Channel. Ocean. Eng. 2014, 82, 29. [Google Scholar] [CrossRef]
  55. Kalourazi, M.Y.; Siadatmousavi, S.M.; Yeganeh-Bakhtiary, A.; Jose, F. WAVEWATCH-III Source Terms Evaluation for Optimizing Hurricane Wave Modeling: A Case Study of Hurricane Ivan. Oceanologia 2021, 63, 194–213. [Google Scholar] [CrossRef]
  56. Umesh, P.A.; Behera, M.R. Performance Evaluation of Input-Dissipation Parameterizations in WAVEWATCH III and Comparison of Wave Hindcast with Nested WAVEWATCH III-SWAN in the Indian Seas. Ocean. Eng. 2020, 202, 106959. [Google Scholar] [CrossRef]
  57. Mentaschi, L.; Besio, G.; Cassola, F.; Mazzino, A. Performance Evaluation of Wavewatch III in the Mediterranean Sea. Ocean. Model. 2015, 90, 82–94. [Google Scholar] [CrossRef]
  58. Hanna, S.R.; Heinold, D. Development and Application of a Simple Method for Evaluating Air Quality; American Petroleum Institute, Health and Environmental Affairs Dept.: Washington, DC, USA, 1985. [Google Scholar]
  59. Mentaschi, L.; Besio, G.; Cassola, F.; Mazzino, A. Problems in RMSE-Based Wave Model Validations. Ocean. Model. 2013, 72, 53–58. [Google Scholar] [CrossRef]
  60. Akpınar, A.; Bingölbali, B.; Van Vledder, G.P. Long-Term Analysis of Wave Power Potential in the Black Sea, Based on 31-Year SWAN Simulations. Ocean. Eng. 2017, 130, 482–497. [Google Scholar] [CrossRef]
  61. Cornett, A. A Global Wave Energy Resource Assessment. In Proceedings of the International Offshore and Polar Engineering Conference, Vancouver, BC, Canada, 6 July 2008. [Google Scholar]
  62. Guillou, N.; Chapalain, G. Assessment of Wave Power Variability and Exploitation with a Long-Term Hindcast Database. Renew. Energy 2020, 154, 1272–1282. [Google Scholar] [CrossRef]
  63. Zheng, C.W.; Wang, Q.; Li, C.Y. An Overview of Medium- to Long-Term Predictions of Global Wave Energy Resources. Renew. Sustain. Energy Rev. 2017, 79, 1492–1502. [Google Scholar] [CrossRef]
  64. Gao, Q.; Khan, S.S.; Sergiienko, N.; Ertugrul, N.; Hemer, M.; Negnevitsky, M.; Ding, B. Assessment of Wind and Wave Power Characteristic and Potential for Hybrid Exploration in Australia. Renew. Sustain. Energy Rev. 2022, 168, 112747. [Google Scholar] [CrossRef]
  65. Diaconu, S.; Rusu, E. Evaluation of Various WEC Devices in the Romanian Nearshore. In Proceedings of the International Conference on Energy and Environment Technologies and Equipement (EEETE’13), Brasov, Romania, 1–3 June 2013. [Google Scholar]
  66. Folley, M.; Whittaker, T.J.T. Analysis of the Nearshore Wave Energy Resource. Renew. Energy 2009, 34, 1709–1715. [Google Scholar] [CrossRef]
  67. ISO. Petroleum and Natural Gas Industries—Specific Requirements for Offshore Structures—Part 1: Metocean Design and Operating Considerations; International Organization for Standardization: Geneva, Switzerland, 2015. [Google Scholar]
  68. Kamranzad, B.; Etemad-Shahidi, A.; Chegini, V. Developing an Optimum Hotspot Identifier for Wave Energy Extracting in the Northern Persian Gulf. Renew. Energy 2017, 114, 59–71. [Google Scholar] [CrossRef]
  69. Carballo, R.; Sánchez, M.; Ramos, V.; Fraguela, J.A.; Iglesias, G. The Intra-Annual Variability in the Performance of Wave Energy Converters: A Comparative Study in N Galicia (Spain). Energy 2015, 82, 138–146. [Google Scholar] [CrossRef]
Figure 1. (a) Location of western Brittany in north-western Europe. The red box shows the extent of the marine areas considered around western Brittany. (b) Spatial distribution of water depth in coastal seas around western Brittany. Wave buoys considered for the evaluation of the hindcast database are shown with red circles and numbered from W1 to W8 (Table 2). Please note also that points W4 and W8 correspond to the locations considered in the initial evaluation of the wave hindcast database.
Sustainability 15 01725 g001
Figure 2. Locations of points retained, around Brittany, at water depths of 60, 40 and 20 m with respect to the lowest astronomical tides. Color lines show the isolines corresponding to these three water depths. Points were numbered with bigger circles every five points.
Sustainability 15 01725 g002
Figure 3. Power matrices of WEC power systems considered in offshore waters (typically for water depths of 60 m with respect to the lowest astronomical tides) around Brittany. Please note also that the resolution of power matrices in Hm0 and Tp/Te is indicated by the different color cells.
Sustainability 15 01725 g003
Figure 4. Power matrices of WEC power systems considered in intermediate water depths (typically 40 m with respect to the lowest astronomical tides) around Brittany.
Sustainability 15 01725 g004
Figure 5. Power matrices of WEC power systems considered in nearshore water depths (typically 20 m with respect to the lowest astronomical tides) around Brittany.
Sustainability 15 01725 g005
Figure 6. Correlation diagram for the evaluation of the significant wave height Hm0 at the eight wave buoys considered around Brittany. The colourbar refers to the probability density function based on a representation of a kernel density estimate using Gaussian kernels.
Sustainability 15 01725 g006
Figure 7. Time Series of measured and predicted significant wave height Hm0 and wave energy period Te at wave buoy W4 off western Brittany in 2012.
Sustainability 15 01725 g007
Figure 8. Correlation diagram for the evaluation of the wave energy period Te at the eight wave buoys considered around Brittany.
Sustainability 15 01725 g008
Figure 9. Spatial distribution of the averaged (top) significant wave height Hs,mean and (bottom) available wave energy flux Pw,mean over the 27-year period (1994–2020) at the locations considered in water depths of 60, 40 and 20 m around Brittany.
Sustainability 15 01725 g009
Figure 10. Relative differences in the estimation of Pmean,27, the mean available wave energy flux estimated over the 27-year period (1994–2020) with respect to the number of years n retained for these estimations. Thus, the relative difference is estimated at the different locations disseminated in water depths of 20, 40 and 60 m around Brittany as Diffn = (Pmean,n − Pmean,27)/Pmean,27 with n in [1,27] the number of years considered for this estimation and Pmean,n the mean available wave energy flux estimated from hindcast predictions over the n years between 2020-n + 1 and 2020. The dotted lines show the minimum and maximum values of Diffn computed in the three water depths while the continuous bold line shows the averaged values of Diffn.
Sustainability 15 01725 g010
Figure 11. Time series of the yearly available wave power averaged along the isolines at water depths of 60, 40 and 20 m around Brittany.
Sustainability 15 01725 g011
Figure 12. Spatial distribution of the energy metrics (top) AVI and (bottom) MVI at the locations considered in water depths of 60, 40 and 20 m around Brittany.
Sustainability 15 01725 g012
Figure 13. Spatial distribution of the averaged significant wave height Hs,mean and the mean available wave energy flux Pw,mean with the capacity factors Cf, the rated capacity factor Rf and the efficiency index Ei for the WEC power systems AquaBuOY, AWS, Oceantec, Seabased and Wavebob in locations with water depths of 60 m around Brittany.
Sustainability 15 01725 g013
Figure 14. Spatial distribution of the averaged significant wave height Hs,mean and the mean available wave energy flux Pw,mean with the capacity factors Cf, the rated capacity factor Rf and the efficiency index Ei for the three WEC power systems Oyster 2, Wave Dragon and WaveStar in locations with water depths of 40 m around Brittany.
Sustainability 15 01725 g014
Figure 15. Spatial distribution of the averaged significant wave height Hs,mean and the mean available wave energy flux Pw,mean with the capacity factors Cf, the rated capacity factor Rf and the efficiency index Ei for the four WEC power systems Oyster, CETO, WaveRoller and WaveStar C6 in locations with water depths of 20 m around Brittany.
Sustainability 15 01725 g015
Figure 16. Spatial distribution of metrics AVI, MVI, AVIout and MVIout for WEC power systems Pelamis, Seabased, Wavebob, AquaBuOY, AWS and Oceantec in water depths of 60 m around Brittany. Please note that the low points in the top figure correspond to locations with reduced available wave energy resource behind the isle of Ushant (Figure 9 and Figure 12).
Sustainability 15 01725 g016
Figure 17. Spatial distribution of metrics AVI, MVI, AVIout and MVIout for WEC power systems Oyster 2, Wave Dragon and WaveStar in water depths of 40 m around Brittany. Please note that the low points in top figure correspond to locations with reduced available wave energy resource behind the isle of Ushant (Figure 9 and Figure 12).
Sustainability 15 01725 g017
Figure 18. Spatial distribution of metrics AVI, MVI, AVIout and MVIout for WEC power systems Oyster, CETO, WaveRoller and WaveStar C6 in water depths of 20 m around Brittany.
Sustainability 15 01725 g018
Table 1. Non-exhaustive review of wave energy resource assessments conducted in the NW European coastal shelf seas from the exploitation of hindcast database and numerical simulations.
Database/ModelApplication AreaTime Period
Considered
Spatial
Resolution
Output Time StepWEC
Performance
References
WAMNW European seas7 years (1987–1994)6 hno[16]
ERA interimNW European seas11 years (2003–2013)0.75°6 hyes[17]
ERAS 5Northern Portugal71 years (1950–2020)0.5°3 hno[18]
WW3Portugal15 years (1995–2010)0.5°6 hyes[19]
WAM (HIPOCAS)Bay of Biscay (France)58 years (1958–2015)0.25°3 hyes[20]
WAM (MARINA)NW European seas10 years (2001–2010)5 km1 hno[21]
SWANWestern French coast33 years (1979–2011)0.05/0.1° (~5 km)-no[22]
SWANNW European seas7 years (2005–2011)1/24° (~4.5 km)3 hno[23]
SWANScotland (UK)11 years (2004–2014)0.025° (~2.8 km)3 hyes[24]
SWANNorth Sea38 years (1980–2017)0.025°1 hyes[25]
SWANSouthwestern UK10 years (1998–2007)1 km-yes[26]
SWANWestern French coast3 years (1998–2000)880 m-no[27]
SWANPortugal3 years (2009–2011)880 m-yes[18]
SWAN/TOMAWACWestern Brittany (France)8 years (2004–2011)300 m3 hno[28,29]
SWANWestern Brittany (France)8 years (2004–2011)300 m3 hyes[30]
SWANEastern Ireland12 years (2004–2015)300 m-no[11]
WW3Coast of Ireland14 years (2000–2013)225 m-no[12]
Table 2. Characteristics of wave buoys considered for evaluating the wave hindcast database around Brittany. The number between parentheses in the first column corresponds to the name of the wave buoy in the CANDHIS database.
Wave BuoysLongitudeLatitudeWater DepthsMeasurement Periods Considered
W1 (02202)2.443° W48.892° N38 m30/11/2005 → 31/12/2005
W2 (02204)2.889° W49.026° N50 m10/01/2019 → 30/12/2019
W3 (02922)4.072° W48.728° N30 m01/01/2020 → 31/12/2020
W4 (02911)4.968° W48.290° N60 m01/01/2012 → 31/12/2012
W5 (02915)4.920° W48.006° N45 m02/10/2012 → 31/12/2012
W6 (02914)4.450° W47.650° N105 m20/01/2010 → 27/02/2010
W7 (05602)3.285° W47.285° N45 m01/01/2016 → 31/12/2016
W8 (04403)2.787° W47.239° N30 m01/01/2017 → 31/12/2017
Table 3. Main features of WEC power systems considered in western Brittany. The last column on the left specifies the references exploited for the formulation of devices’ power matrices. Please note also that a part of these power matrices was taken from the investigation conducted by Babarit et al. [44] adopting a generic typology for state-of-the-art technologies. This typology is recalled in parentheses in the first column.
WEC SystemRated Power (kW)DescriptionInstallation Depth (m)Characteristics of Power MatrixReferences
Offshore waters
(60 m)
AquaBuOY250absorber50–70Hm0 × Tp[45]
AWS2470absorber>50Hm0 × Te[46]
Oceantec500absorber50–100Hm0 × Te[47]
Pelamis750attenuator50–70Hm0 × Te[48]
Seabased AB (Bref-HB)15absorber40–100Hm0 × Tp[44]
WaveBob (F-2HB)1000absorber>50Hm0 × Tp[44]
Intermediate waters (40 m)Oyster 2 (B-OF)3332oscillating converter<50Hm0 × Tp[44]
Wave Dragon7000terminator25–40Hm0 × Tp[18]
WaveStar (B-HBA)2709oscillating converter30–50Hm0 × Tp[44]
Nearshore waters
(20 m)
Oyster290oscillating converter10–25Hm0 × Te[18]
CETO (Bref-SHB)260attenuator20Hm0 × Tp[44]
WaveRoller1000oscillating10–25Hm0 × Te[49]
WaveStar C6600attenuator<20Hm0 × Tp[50]
Table 4. Statistics for evaluating the significant wave height Hm0 and the wave energy period Te at the eight wave buoys considered: MAE for the mean absolute error, NBI for the normalised bias and HH for the symmetrically normalised root mean square error. Further details about the mathematical formulations of these metrics are available in Section 2.4.1.
Wave BuoyHm0Te
MAENBIHHMAENBIHH
W1 (02202)0.19 m0.110.160.6 s0.0020.10
W2 (02204)0.20 m0.060.120.6 s−0.0030.10
W3 (02922)0.21 m0.100.150.6 s−0.0180.09
W4 (02911)0.29 m0.130.150.5 s0.0010.07
W5 (02915)0.45 m0.160.190.6 s0.0270.08
W6 (02914)0.29 m0.100.130.6 s0.0190.08
W7 (05602)0.19 m0.030.110.5 s0.0120.08
W8 (04403)0.17 m0.090.170.6 s0.0240.12
Disclaimer/Publisher’s Note: The statements, opinions and data contained in all publications are solely those of the individual author(s) and contributor(s) and not of MDPI and/or the editor(s). MDPI and/or the editor(s) disclaim responsibility for any injury to people or property resulting from any ideas, methods, instructions or products referred to in the content.

