Abstract
Wastewater treatment plants play a critical role in reducing point source pollution in watersheds; however, in taking on the task of reducing pollutants such as COD and NH3-N, they also consume energy intensively, which can result in additional greenhouse gas (GHG) emissions and operating (OAM) costs. Therefore, appropriate effluent targets should be implemented to achieve a balance between pollution load reduction, greenhouse gas emissions and operating costs, depending on the field conditions of the wastewater plant. In this study, four different wastewater treatment technologies, namely, A2/O, CASS, MBR and A/O-MBR, which are mainly operated in the Liaohe River Basin of Jilin Province, were selected using the coupled AHP and fuzzy TOPSIS models, and the appropriate effluent standards were preferred according to the characteristics of these technologies. Firstly, the AHP model is used to determine the criteria layer (environmental, economic and social benefits) of the four treatment technologies and the weights of each indicator, and then the fuzzy TOPSIS model is used to determine the indicator values of the different alternatives (effluent standards) of the four treatment technologies, and finally the optimal value of the effluent standard is determined, in terms of COD, 30 mg/L for A2/O and CASS process and 50 mg/L for MBR and A/O-MBR.
1. Introduction
1.1. Background
Wastewater treatment plants are not only the main bearers of the task of reducing COD and NH3-N pollution load, but also one of the most energy-intensive and high-energy industries [1], Although a higher effluent standard will effectively reduce the pollution load, it will also consume more energy and require higher operation and maintenance (OAM) costs, and produce more indirect and direct carbon emissions than a lower effluent standard, so the pursuit of a higher effluent standard will have a negative effect on carbon reduction and economic efficiency [2,3].
As the economies and populations of countries continue to develop, climate change and environmental damage are becoming increasingly prominent, and there is now a global consensus on low-carbon, green and sustainable development. From the Kyoto Protocol in 1997 to the Paris Agreement in 2015, the number of parties has grown to 178, and the Paris Agreement for the first time introduced a “carbon-neutral” emissions reduction target. To meet the challenges that come with it, nearly 200 countries are discussing how to uphold the Paris Agreement during the UN Climate Change Conference in 2021. Under the Paris Agreement, the European Council approved a binding target to reduce economy-wide greenhouse gas emissions by at least 40% by 2030 compared with 1990 (Council Decision (Eu) 2016/1841). In September 2020, China solemnly announced to the world its “double carbon” target, i.e., to reach peak CO2 emissions by 2030 and work towards carbon neutrality by 2060.
The main cause of climate change is influenced by the large increase in emissions of greenhouse gases, which refer to gases in the atmosphere that have the ability to absorb energy from atmospheric long-wave radiation, and in global warming, CO2 contributes 49%, CH4 contributes 15–20%, and N2O contributes 6%, which is about twice as much as other greenhouse gases [4]. The GHG emissions from the operation of wastewater treatment plants, on the other hand, are dominated by these three gases.
The total GHG emissions from wastewater treatment plants are not significantly influenced by the mode of wastewater treatment [5]. The Greenhouse Gas Accounting System (GHG Protocol), jointly established by the environmental NGO World Resources Institute (WRI) and the World Business Council for Sustainable Development (WBCSD) since 1998, stipulates that the total emissions of an enterprise are divided into direct and indirect emissions. Direct emissions are called Scope 1 and indirect emissions are divided into Scope 2 and Scope 3, where Scope 1 is emissions from sources directly controlled or owned by the company, Scope 2 is indirect emissions from electricity, steam, heating and cooling used by the company, and Scope 3 is all indirect emissions except Scope 2. The greenhouse gases generated from the biochemical wastewater treatment link is an important source of direct greenhouse gas emissions [6,7], and is a direct carbon emission, range 1, in which the removal rate of COD is positively correlated with the emission of CO2 [8]. Indirect carbon emissions in Scope 2 are emissions from energy consumption, including energy consumption from maintaining the operation of wastewater plants, and energy consumption is an important factor affecting the carbon emissions of urban wastewater treatment systems, of which electricity accounts for about 55% of the total energy [9,10,11,12]. Scope 3 is the energy consumption generated from the treatment of activated sludge, which is a by-product of wastewater treatment [13,14,15], sludge contains a variety of toxic substances that can cause serious environmental pollution [16,17,18], and sludge disposal and recycling are of great concern because of its serious negative ecological impact [18,19], and studies have shown that activated sludge production and COD removal show a positive correlation [20,21,22]. Therefore, the effluent standard of wastewater plants should be based on the actual situation and a balanced analysis of the economic and social benefits of the operation process, so as to obtain a suitable effluent standard, and at present, there is a great potential to reduce the operating costs of wastewater plants through technical and economic methods [23].
1.2. Development of Coupled Multi-Criteria Decision Models (MCDM)
In recent years, coupled multicriteria decision models have received increasing attention, and after Churhman et al. first used the simple weighting method to solve the problem of choosing a business investment strategy, MCDM methods have been continuously developed and expanded in various fields such as economics, management, military, and environmental science, and are now maturing [24].The study of MCDM models has basically used two methods: the AHP and TOPSIS method, and with the development of the times, MCDM has chosen to incorporate more different models and methods to solve decision problems.
Bognár F. et al. [25] combined AHP–PRISM with the TOPSIS method and used it to test it on data related to strategic event sets for incoming logistics business processes at a nuclear power plant, and the results demonstrated that the novel method supports ideal best and worst analysis of alternatives without losing its ability to focus on identifying hidden risks. Mathew, M. et al. [26] adopted a new IT2F multi-criteria decision-making approach based on AHP and TOPSIS that can effectively handle the degree of uncertainty in group decision making and assist in selecting the most feasible and optimal industrial asset maintenance strategy. The results demonstrate the additional advantage of IT2F–AHP–TOPSIS over the traditional AHP–TOPSIS and type 1 fuzzy AHP in that it allows decision makers to define membership functions more flexibly and is able to handle uncertainty in the decision-making process. Du, Y.M. et al. [27] applied fuzzy AHP and AHP–TOPSIS to determine damage assessment levels for 18 soil sites selected from Qinghai Province. The results showed that AHP–TOPSIS was closer to the real damage situation than the single fuzzy AHP method, and the method proved to be more suitable for damage assessment of earthen sites in Qinghai Province. Liu B. et al. [28] combined FST, AHP and TOPSIS to form the MCDM model to optimize wastewater treatment technologies in urban areas of the Liaohe River Basin, and later, Liu B. et al. [29] combined GIS, AHP and remote sensing (RS) technologies to perform site suitability analysis of wastewater treatment plants and applied them for the first time in the Liaohe River Basin of Jilin Province, China. Dai C. et al. [30] verified the rationality of the indicator system of the AHP–TOPSIS model by taking the evaluation of water resources development and utilization level in Jingyu County from 2009 to 2018 as an example, and filtered out the indicators that have a greater impact on the evaluation results by changing the sensitivity analysis method of indicator weights to reduce the uncertainty of too many indicators and low correlation.
Assessing suitable water discharge criteria involves a large number of indicators, and the fuzzy TOPSIS method in the MDCM model, as an important method for multi-attribute decision making, has been applied by more scholars to decision making in the environmental field, and has achieved good research results [31,32,33]. Due to the complexity of the evaluation index system in this study, it is more difficult to solve the index weights, and the TOPSIS method can only rank the water discharge criteria scheme, but not the index weights. To solve the indicator weight ranking problem, this paper introduces the AHP method coupled with the fuzzy TOPSIS method to form the AHP–TOPSIS coupling model, and uses the AHP method to solve the weights and rank the indicators according to their weight sizes. The method can, to a certain extent, solve the problem that the weights are not reasonable enough due to the lack of subjective judgment ability of evaluation experts or differences in experience.
1.3. Main Contributions of This Paper
Firstly, in this study, the authors coupled AHP with the fuzzy TOPSIS method to constitute a scientific and effective decision model. After that, considering the economic, social and environmental needs of the study area, the coupled model was run to calculate the preferred effluent standards for all wastewater plants in the area, which provides a decision basis and reference for the local environmental protection authorities.
1.4. The Next Main Structure of This Article
The rest of the paper is organized as follows. Section 2, Materials and Methods, presents the arithmetic process of the AHP–TOPSIS model in this paper. In Section 3, a case study is presented, starting with an overview of the study area and a complete description of the operation of the coupled model. Section 4 concludes the paper with a summary of the study.
2. Materials and Methods
2.1. AHP and Fuzzy TOPSIS Coupling Model
In this study, the coupled AHP and fuzzy TOPSIS model was used to analyze the decision of suitable effluent indexes of each wastewater plant in the study area. The AHP method was selected to determine the weights of each index, and the fuzzy TOPSIS method was used to quantitatively analyze the distance between each alternative and the optimal solution. Firstly, the most suitable water discharge index is divided into the criterion layer and the indicator layer using the AHP method, and the weights of each layer are found out, then combined with fuzzy TOPSIS method, the weighted standardized decision matrix and comprehensive superiority of each index under the criterion layer are found out, and then the optimal ranking of each alternative is derived. The model operation and calculation process are shown in Figure 1.
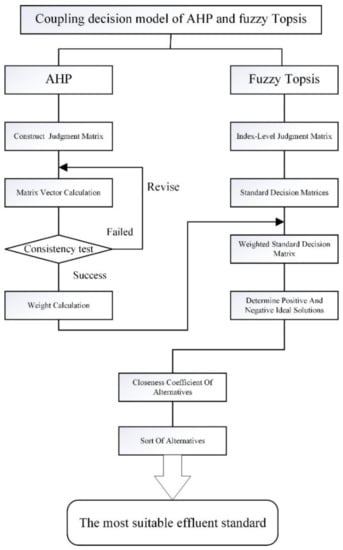
Figure 1.
Comprehensive evaluation model of the most suitable water discharge criteria.
2.1.1. AHP Calculation Procedure
Analytic Hierarchy Process (AHP) is a hierarchical weighting decision analysis method proposed by American operations researcher Saaty in the early 1970s when he applied the network system theory and multi-objective comprehensive evaluation methods to the study of “power allocation based on the contribution of each industrial sector to national welfare” for the U.S. Department of Defense [34,35].
AHP is a combined qualitative and quantitative decision analysis method for solving complex problems with multiple objectives. The method combines quantitative analysis with qualitative analysis, uses the experience of decision makers to judge the relative importance between the criteria that measure whether the objectives can be achieved among them, and reasonably gives the weight of each criterion for each decision option, and uses the weights to find out the order of advantages and disadvantages of each option, which is more effectively applied to those topics that are difficult to be solved by quantitative methods, and this subject uses post-AHP to obtain the weights of each The weights of the indicators, in this study AHP is calculated in the following steps.
- (1)
- Build the hierarchical model
A three-level criterion decision model is built according to the relationship between decision objective, criterion and alternative, where the decision objective is the highest level, the criterion is placed in the second level as an intermediate element, and the alternative is placed in the third level.
- (2)
- Construction of judgment matrix
The method of constructing judgment matrix in AHP is the consistent matrix method, according to the opinions of different experts under the scenario of the research content, constructing a two-by-two comparison matrix, and the comparison matrix after establishment is as in Equation (1), where is the result of comparison between element i and j, and the specific rules of taking values are as in Table 1.

Table 1.
Significance of judgment matrix scale.
- (3)
- Hierarchical single ranking and its consistency test
The feature vector corresponding to the maximum feature root λmax of the judgment matrix is normalized (so that the sum of the elements in the vector is 1) and then recorded as w. The elements of w are the ranking weights of the same hierarchical element with respect to the relative importance of a factor in the upper level, and this process is called hierarchical single ranking. The consistency metric can be defined as , where indicates perfect agreement; additionally, the closer the value is to 0 the better the consistency is, and the further it is from 0 the worse the consistency is. In order to evaluate , AHP introduces the random consistency index , defining the consistency ratio: , when the value of CR does not exceed 0.1, the consistency of the matrix is considered to be in the allowed interval and passes the consistency test, otherwise the value of needs to be adjusted, and the value of is taken as shown in Table 2.
Table 2.
Random consistency index RI values.
2.1.2. Calculation Process of Fuzzy TOPSIS Method
TOPSIS (Technique for Order Preference by Similarity to an Ideal Solution) method was first proposed by C.L. Hwang and K. Yoon in 1981 and is also known as the superior-inferior solution distance method [36]. This method is a multi-attribute decision making method that evaluates and ranks alternatives based on proximity to the ideal solution and distance from the negative ideal solution by calculating the proximity between several alternatives and the ideal solution. However, the actual problem is continuously complicated, and many times the attribute values of the alternatives cannot be obtained, and the traditional TOPSIS can no longer meet the needs of solving the decision problem, so the triangular fuzzy numbers are introduced into the role model of this study to solve the complex decision problem [37].
- 1.
- Construct a decision matrix
First, the standard decision matrix is constructed, and the matrix is composed of alternatives AO = {AO1, AO2, …, AOn} and indicators I = {I1, I2, …, Im}, where AOn is the fuzzy triangular number, AOn = {…,}.
where is the triangular fuzzy number of the m scheme at the n index, denoted as ].
- 2.
- Calculate the weighted normalization matrix
According to the weights wj of each index determined by the previous AHP, the above decision matrix is weighted and the corresponding matrix is established, and the established matrix is expressed as:
- 3.
- Determine the fuzzy PIS and NIS of each index
The optimal value vector and the worst value vector are obtained according to the array, i.e., the optimal and worst solutions in a finite scheme are:
Among them, ,,
- 4.
- Calculate the distance between the evaluation object and the optimal and inferior solutions
Based on the previously obtained optimal vector and the worst vector , the distances and are calculated between them and each indicator of all alternatives.
where and denote the distance of the n evaluation object from the optimal solution and the worst solution, respectively.
- 5.
- Calculate the proximity of each evaluation object to the optimal solution
takes a value between 0 and 1. the value of close to 1 means that the evaluation object is closer to the optimal level; conversely, the closer to 0 means that the evaluation object is closer to the worst level.
- 6.
- Rank each evaluation object according to the degree of proximity and determine the evaluation effect.
The evaluation objects are ranked according to the size of , and the larger the value of , the better the overall benefit.
2.2. GHG Generation Calculation
In this study, the amount of activated sludge generated, GHG emissions and sludge treatment cost from the treatment of activated sludge, electricity consumption, electricity cost and CO2 emissions from the consumption of electricity are calculated for wastewater treatment plants according to different emission targets, where the amount of sludge generated and sludge treatment cost are calculated with reference to the empirical data obtained during field research, and the electricity cost is calculated according to the existing electricity tariff in Jilin Province. The electricity cost is calculated according to the existing electricity price in Jilin Province. Some of the formulas are as follows.
- (1)
- Amount of methane generated from COD removal
E1—Annual emissions of CH4 converted to CO2 equivalent from COD removal in wastewater, tCO2eq/a
—Annual COD removal from wastewater treatment plant, tCOD/a
SG—Annual generation of dry matter of sludge from wastewater treatment plant, t/a
—Organic matter content in dry matter of sewage treatment plant, tCOD/a
—global warming potential value, take 21
Among them
MCF—CH4 correction factor, take 1
B0—Maximum CH4 GWP value, taken as 0.25t CH4/t COD
- (2)
- GHG emissions from sludge treatment
E2—Annual emissions of CH4 converted to CO2 equivalent from sludge removal, tCO2 eq/a
SR—sludge dry matter removal, t/a
—Organic matter content in sludge dry matter of wastewater treatment plant, obtained by actual measurement method, tC/a
—Degradable organic carbon ratio in sludge dry matter, taken as 50%
F—Ratio of degradable organic carbon that can produce C in CH4, taken as 50%
—ratio of molecular weight, taken as 16/12
- (3)
- CO2 emissions from electricity consumption in wastewater treatment plants
E3—CO2 equivalent from the annual electricity consumption of the wastewater treatment plant equipment operation, tCO2eq/a
EH—Electricity consumption from the operation of wastewater treatment plant equipment per year, MWh/a
—Power CO2 emission factor, tCO2/MWh
—CO2 global warming potential (GWP) value, taken as 1
- (4)
- Electricity calculation for wastewater plants
PCOD—Power consumption per unit of COD reduction, kW·h
CODin—Feedwater COD concentration, mg/L
CODeff—Effluent COD concentration, mg/L.
3. Case Study
3.1. Study Area Overview
The Liaohe River Basin of Jilin Province (later referred to as the Liaohe River Basin) is located in the southwestern part of Jilin Province, China. The geographical location is in 123°42′~125°31′ E, 42°34′~44°08′ N. The area of the region is 11,293 km2, accounting for 6.55% of the total land area of Jilin Province, and the geographical location is shown in Figure 2.
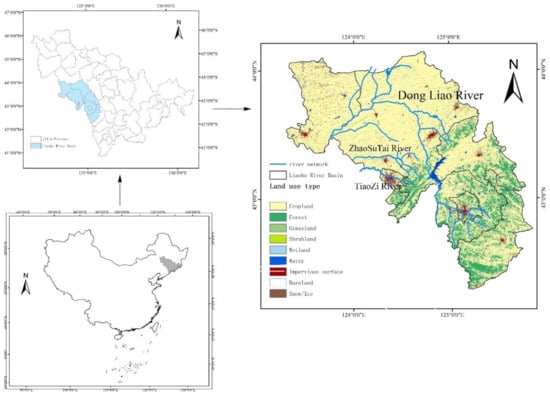
Figure 2.
Overview of study area.
The main rivers in the territory include three major trunk (tributaries) rivers, namely Dongliao River, Zhaosutai River and Tiaozi River. The Dongliao River is 321 km long in Jilin, accounting for more than 80% of the total river length, controlling a watershed area of 10,136 km2. The Zhaosutai River is a tributary of the Liao River, originating in Tumenling of Wangxiangtun in Lishu County and flowing westward through Lishu County to the mouth of Tongjiang River in Changtu County, Liaoning Province. Zhaosutai River is 103 km long in Jilin, with a controlled watershed area of 1147 km2. The Jiaozi River originates in Lanjiagou, Shiling Town, Lishu County, and flows westward to Qujiadian Township, Changtu County, Liaoning Province, where it joins the Zhaosutai River. The Jiaozi River in Jilin is 58.3 km long and controls a watershed area of 463 km2.
Water functional zones (WFZ) are unique to China and are artificially divided into different areas according to different functions. It is based on the economic development plan and comprehensive utilization plan of water resources in the basin, combined with the current situation of regional water resources development and utilization and social needs, in the corresponding watershed delineated with specific functions, to meet the requirements of rational development and utilization of water resources and protection and can play the best benefit of the zone (i.e., WFZ). China’s WFZ are divided into a two-tier system: the first-tier zone is water source protection zone, buffer zone, development and utilization zone and its reservation zone; the second-tier zone is drinking water source zone, industrial water use zone, agricultural water use zone, fishery water use zone, landscape recreation water use zone, transition zone and sewage control zone. Each WFZ has different water quality requirements according to the previous functional division. There are 38 primary WFZ and 34 secondary WFZ in the watershed of Liaohe River in Jilin Province. According to the different functions, there are different requirements on the water quality discharged into the water bodies by sewage plants. All sewage treatment plants in the Liaohe River Basin are mainly located in three cities and counties, with 10 urban sewage treatment plants in Gongzhuling District of Changchun City, 32 in Siping City, and 11 in Liaoyuan City. Most wastewater treatment plants currently running with four processes: A2/O, CASS, MBR and A/O-MBR. China currently has a variety of effluent standards, the most widely used standard is GB 18918-2002 “urban wastewater treatment plant pollutant discharge standards” Class A discharge standards, but there is also the implementation of the more stringent DB11/890-2012 “Beijing local standards” Class A discharge standards. At present, most of the wastewater plants in Liaohe River Basin implement the standard GB 18918-2002 Class A, and a few implement the latter.
3.2. AHP Construction of Index System
- (1)
- Environmental benefits
In the more polluted Liaohe River Basin, in order for the wastewater treatment plant to operate stably, its contribution to the discharged water bodies and the surrounding environment should be ensured and the GHG emissions generated during the treatment process should be minimized. In this study, the environmental benefits were measured using three indicators: GHG generation (I1), WFZ contribution (I2) and resource recovery (I3). GHG generation (I1) includes the amount of methane generated from COD removal (A11), the amount of GHG generated from sludge treatment (A12), and the amount of CO2 emissions from electricity consumption (A13). Resource recovery (I3) is mainly reflected in the reuse of wastewater and the recycling of nutrients.
- (2)
- Economic benefits
The weight of economic benefits is closely related to the economic conditions of the study area. The cities in which the Liaohe River Basin located are economically underdeveloped should have a higher weight, and the normal OAM of the wastewater plant and the cost of electricity need local financial support. In this study, the three indicators of sludge treatment cost (I4), electricity consumption cost (I5) and OAM cost (I6) are used to measure. Among them, the sludge treatment cost is the amount of activated sludge generated per unit weight of COD removed, the cost incurred to treat the corresponding sludge, the cost of electricity consumption is the amount of electricity consumed per unit weight of COD removed and thus the cost incurred, and the OAM cost includes the cost of various resources required for operation and the cost of labor.
- (3)
- Social benefits
Social benefits need to be considered from the socio-cultural perspective of the decision scenario, measuring the applicability of the process in the local context. In this study, four indicators of public evaluation, exposure to cold climate, stability and risk assessment were used for measurement. Public evaluation for the process in the treatment of malodorous gases and mosquitoes and other situations that will have a negative impact on public health, rural areas have higher requirements for public health compared to urban areas with poor infrastructure. Stability is the level of control to maintain a certain level of removal rate during operation, which is related to the complexity of the process and the average quality of the operator. The cold season performance is considered because the Liaohe River Basin is located in northeast China, and the cold climate in winter will last for 4–5 months, so the river flow is small and the water environment capacity decreases sharply compared with summer, whereas the pollution from living point sources will not decrease, and at the same time, it is difficult to remove pollutants with low incoming water temperature, so the cold season performance of wastewater plants is especially important. Stability is the level of control to maintain a certain level of removal rate during operation, which is related to the complexity of the process and the average quality of the operator. Risk assessment is then based on the amount of incoming water, whether a certain level of removal rate can meet the water quality requirements of the water function area. The results of the establishment of the indicator system are shown in Table 3.
Table 3.
Indicators system.
3.3. AHP Index System Scenario Analysis
The indicator weights of the AHP model should be analyzed under multiple decision scenarios. In this study, the indicator system is applied to the typical technologies used in most wastewater plants in the Liaohe River Basin, which are the A²/O (DS1) process, CASS process (DS2), MBR process (DS3) and A/O+MBR (DS4). In this study, the model was applied to the above four different treatment processes to optimize the appropriate effluent index.
This study summarizes the wastewater treatment technologies used in wastewater plants in the basin by reviewing data, field visits and issuing questionnaires, and summarizes the characteristics and parameters of each technology, based on which scenario analysis is conducted to derive the importance of the relationship between indicators in different treatment technologies.
In this study, four typical wastewater treatment technologies used in the watershed were investigated, as shown in Figure 3, Figure 3a shows the percentage of treatment size of wastewater plants selected for the four processes, Figure 3b shows the percentage of the number of wastewater plants selected for each of the four processes. Figure 3 shows that: the number of wastewater plants with A2/O is 28.21%, but they are responsible for 87.03% of the wastewater treatment in the basin, whereas the number of wastewater plants with A/O+MBR and MBR is 41.03% and 25.64%, but they are responsible for only 2.17% and 0.71% of the wastewater treatment in the basin. This is because the A2/O process is the more mature, simplest process and the most widely used process for nitrogen removal and phosphorus removal, and is chosen by wastewater plants that have been in operation for a relatively long time in the basin, mainly in towns and cities, with a large average treatment scale. MBR and A/O+MBR process of which the MBR process is an emerging process, characterized by a small footprint, not limited by the setting occasion, easy to operate and manage, easy to achieve automatic control, in the basin by the new township small sewage plants used. Therefore, the WFZ contribution I2 should be of high importance in the A2/O (DS1) and CASS processes (DS2), whereas the MBR (DS3) and A/O+MBR processes (DS4) have less importance.
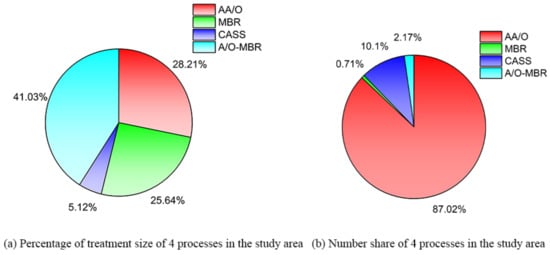
Figure 3.
Number of wastewater plant processes and treatment scale.
The operation of wastewater plants cannot be separated from the financial support of the government, there are differences in the economic development of each region, so the financial support capacity for environmental management also varies greatly, the choice of a high level of effluent standards will incur higher operating costs, will put pressure on the local financial expenditure, Therefore, it is necessary to integrate the technical characteristics of each process and the economic situation of the town to optimize the effluent standard from the economic point of view.
Figure 4 shows the distribution of fiscal expenditures by county and municipal governments in the watershed, The data is obtained from the statistical yearbooks published in the latest year (2021) of Changchun, Siping and Liaoyuan cities. The statistical yearbook is an informative annual publication by each prefecture-level city in China on the statistical data of all areas within the city for the previous year, in order to fully reflect the economic and social development of China. Siping City District and Yitong County have high total expenditures, indicating that within the watershed, Siping City District and Yitong County are relatively well-funded; however, Yitong County, similar to other county-level cities in the watershed, does not have a high share of expenditures on general public health, public safety and energy consumption. In contrast, although the total fiscal expenditure in Liaoyuan city district is not high, it gives higher fiscal expenditure to the above three items, indicating that towns pay more attention to general public health, public safety and energy consumption. Therefore, DS1 and DS2 should have higher weights for power consumption cost (I5), surrounding environmental impact (I7) and risk assessment (I10). Because the town’s funding budget is more adequate in the basin, economic efficiency (C2) is therefore less important; the opposite is true for DS3 and DS4.
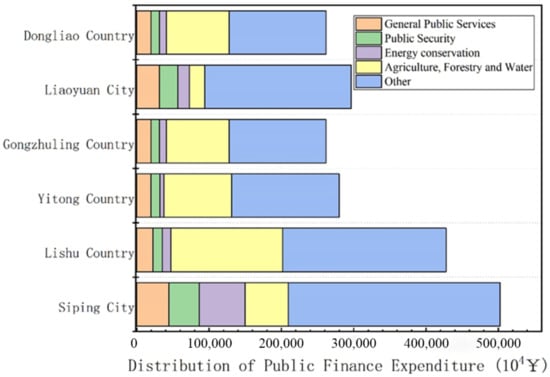
Figure 4.
Distribution of financial expenditures by county and municipal governments in the basin.
3.4. AHP Weighting Analysis
The comprehensive decision background overview and scenario analysis allow the establishment of a two-by-two comparison matrix between each process index, a process supported by experts related to the water pollution prevention and control project in the Liaohe River Basin of Jilin Province. The comparison matrix between indicators consists of 1 target-to-criterion matrix and 3 criterion-to-indicator matrices. The comparison matrices between the indicators of CASS (DS1), A2/O (DS2), MBR (DS3) and A/O+MBR (DS4) are shown in Table 4, Table 5, Table 6 and Table 7, respectively.
Table 4.
Comparison matrix between CASS indicators.
Table 5.
Comparison matrix between A2/O indicators.
Table 6.
Comparison matrix between MBR indicators.
Table 7.
Comparison matrix between A/O+MBR indicators.
After calculating the consistency CR values for each indicator matrix, the calculation results showed that the indicator comparison matrices all had good consistency. In this study, the calculation of the criterion weights (Wi), the indicator-to-criterion weights (Wj) and the indicator-to-decision target weights (Wi) of the indicator matrices was completed using Matlab software, and the results are shown in Table 8.
Table 8.
Weight distribution of indicator matrix.
As can be seen from Table 6, the environmental benefit weights of DS1 and DS2 at the criterion level reached 0.6327 and 0.5390, respectively, because the two processes are mainly distributed in towns and cities, with large average treatment scale and sufficient government financial expenditures, which attach the most importance to the improvement of the environment. In the remaining two criteria, DS1 places more importance on social benefits than economic benefits, with a weight of 0.1749, whereas DS2, in contrast to DS1, places more importance on economic benefits, due to the high sludge treatment cost I4, electricity consumption cost I5 and OAM cost I6 in the process parameters of DS2, resulting in the need to pay more attention to its economic benefits. While the economic benefits weights of DS3 and DS4 reached 0.5390 and 0.7028, respectively, these two processes are mainly distributed in the countryside, mostly decentralized treatment units with small average treatment scale, and the local economy is underdeveloped with insufficient budget and more attention to economic savings. Of the two remaining criteria, DS3 has a higher weight of environmental benefits than social benefits because the parameters related to indicator resource recovery (I3) in the MBR process are low, so more attention should be paid to them, whereas DS4 has the same weight of environmental and social benefits. The distribution of weights at the criterion level corresponds to the individual characteristics of each process and the geographical characteristics of the adopted location.
At the indicator level, the weight of the WFZ contribution of the three indicators DS1 and DS2 in environmental benefits reached 0.3726 and 0.2905, respectively, because of the large scale of treatment, so that the pressure to assess the water quality standards in the WFZ increased, DS3 and DS4 are more concerned about GHG emissions because of the small scale of treatment. The economic benefits of DS1, DS2 and DS4 are more concerned about the cost of power consumption (I5), whereas DS3 is more concerned about the OAM cost (I6), which is due to the MBR process itself process characteristics, the high cost of the core module membrane module, short life time, and the cost increase because other debris in the wastewater can cause pollution damage to the membrane module, whereas the A/O+MBR process avoids the above problems because the A/O process is coupled with the MBR process. The focus of attention for each of the four processes in the social benefits varies, which is determined by the respective technical characteristics and parameters of each process.
After the weighting analysis, it was found that the distribution of indicator weights for each process was reasonable and consistent with the scenario analysis in the previous section, the weights allowed for decision making on the most available options for the effluent criteria.
3.5. Options and Attribute Values
In this study, four different effluent standards (based on COD concentration) were selected, and the attribute values were calculated for different processes at different discharge targets. The four effluent standards are the widely used effluent standard of 50 mg/L in the study area and the most stringent 20 mg/L at present, and two gradients of 40 mg/L and 30 mg/L are set in them. For the quantified part of the available data, this paper calculates the annual treatment scale of different technologies in the study area as the benchmark, and the calculation formula is as in Section 2.2, and the electricity cost is referred to the local electricity cost in Jilin Province are calculated and finally converted to USD uniformly. For the attribute values that are difficult to determine, expert opinions are consulted to ensure the objectivity and accuracy of the data, and finally for different attribute values are finally classified into five levels as low, lower, medium, higher and high.
Translated with www.DeepL.com/Translator (free version). The attribute values for each process at different emission standards are shown in the Table 9, Table 10, Table 11 and Table 12.
Table 9.
Property values of CASS.
Table 10.
Property values of A2/O.
Table 11.
Property values of MBR.
Table 12.
Property values of A/O-MBR.
3.6. Indicator Values
In this study, the attribute values identified in the previous subsection were transformed into natural language and classified into five different grades: good, better, medium, poorer, and poor. After the assignment transformation and weighting calculated in Section 3, the indicator values for each process alternative are shown in the Table 13, Table 14, Table 15 and Table 16.
Table 13.
Weighted indicator values of CASS.
Table 14.
Weighted indicator values of A2/O.
Table 15.
Weighted indicator values of MBR.
Table 16.
Weighted indicator values of A/O-MBR.
3.7. Simulation Results
According to the equation, the posting schedule Ci of the model was calculated, and the results are shown in Table 17.
Table 17.
Ci values for each process option.
From the calculation results, it can be seen that CA3 has the highest score among CASS process and A2/O process, which indicates that CA3 is a suitable effluent standard for operating CASS and A2/O process wastewater plants in the Liaohe River Basin, whereas CA1 is optimal for MBR and A/O-MBR processes. CA4, as the most stringent effluent criterion, did not achieve a high priority ranking among the four technologies, and even ranked last among MBR and A/O-MBR, limited by the economy of the basin and more greenhouse gases produced, even though CA4 achieved the optimum in I2 and I3, it could not achieve the optimum in the final weighting, indicating that the stringent effluent criterion was not suitable for the basin. CA3 is optimal in the CASS process and A2/O process. CA3 is the most appropriate effluent standard as a more stringent effluent standard, balancing environmental, economic and social benefits in large water plants. CA2 does not show outstanding advantages among the four technologies and is not suitable as the optimal choice for any one of them. CA1 has the highest score among MBR and A/O-MBR processes and has a weight of 0.962 in the A/O-MBR process species, indicating that a lenient effluent standard is more appropriate for small wastewater treatment facilities located in this region of the township.
4. Conclusions
This study provides an opinion on what effluent standards to implement in the Liaohe River Basin through the coupled AHP and fuzzy TOPSIS model. The study firstly analyzed the scenarios of the four main wastewater treatment technologies used in the basin, analyzed the different technical characteristics of each technology and the background of their actual use in the basin, calculated the index weights of each technology using the AHP method, then determined the attribute values of each process under different effluent standards through extensive calculations and interviews with experts, and finally ranked the process alternatives by the fuzzy TOPSIS method. The ranking of the process alternatives was obtained by the fuzzy TOPSIS method. The following conclusions were obtained from this study.
- (1)
- The model results show that, with the effluent COD as the index, the effluent standard is 30 mg/L for A2/O and CASS processes as appropriate, whereas the effluent standard is 50 mg/L for MBR and A/O-MBR.
- (2)
- At the criterion level, different processes pay different attention to the environment (C1) and economy (C2) for their own technical characteristics and the actual context of use in the basin, with the technologies DS1 and DS2 chosen for large water plants paying more attention to C1 and the technologies DS3 and DS4 chosen for small water plants paying more attention to C2. The focus of attention of each technology at the indicator level is different, I2 is the most important indicator for DS1, I2, I1 and I5 are important indicators for DS2, I6 is the most important indicator for DS3 and I5 is the most important indicator for DS4, the fluctuation of the indicator weight has a greater potential to affect the choice of the optimal solution, when making similar environmental decision problems, the weight of the indicator needs to be focused on the situation.
- (3)
- Although some of the results of each process are similar, the actual weight distribution is not the same, the same process used in large water plants, CASS process CA3 and CA4 weights are similar, whereas CA3 in the A2/O advantage is obvious, because CASS process operating costs are relatively low, the economic benefits of low weight, local pollution control pressure can also choose CA4. MBR and A/O-MBR The technology chosen for small water plants, the options are ranked the same, with CA1 weighting of 0.962 for the A/O-MBR process, which is more suitable for the process in the basin’s lenient effluent standards.
Based on the above findings, it can be found that the coupled model can scientifically and effectively optimize the effluent standards of different technologies for wastewater treatment plants in the Liaohe River Basin. Considering the similarity of economic development and climate in Northeast China and the pressure of pollution control, the model proposed in this study can be extended to other provinces and cities in Northeast China to provide a decision support framework for the selection of effluent standards and can be used as a reference method for decision making in other industries.
In addition, there are still shortcomings and need for subsequent improvement in this study.
The process parameters and the weights of the indicators of the alternative options play an important role in the results of the preferences, and every effort should be made to ensure the integrity and accuracy of the data and the objectivity of the evaluation of the indicators. The four processes in this study were simply categorized as urban and rural by the location of the wastewater plant, and although the towns and villages in the same region are similar on an economic, environmental and social level, there is still some variability, and more refinement of the study area is needed in subsequent studies of this kind. In addition, the pollutants in wastewater plants are not only COD; however, NH3-N is also one of the indicators to evaluate the wastewater quality, and more indicators need to be considered to make the results more accurate in subsequent studies.
Author Contributions
Conceptualization, Y.Y.; methodology, Y.Y.; software, Y.D.; formal analysis, Y.Y.; investigation, F.S.; resources, J.T.; data curation, Y.Q.; writing—original draft preparation, Y.Y.; writing—review and editing, Z.L.; supervision, Z.L.; funding acquisition, J.T. All authors have read and agreed to the published version of the manuscript.
Funding
This research was funded by Major Science and Technology Project, Science and Technology Department of Jilin Province, grant number 20200503003SF.
Institutional Review Board Statement
Not applicable.
Data Availability Statement
No new data were created or analyzed in this study. Data sharing is not applicable to this article.
Acknowledgments
We acknowledge the data provided by Chinese Academy of Sciences, National Science & Technology Infrastructure of China, etc.
Conflicts of Interest
The authors declare that they have no conflict of interest.
References
- U.S. Environmental Protection Agency. Greenhouse Gas Inventory Report: Inventory of U.S. Greenhouse Gas Emissions and Sinks: 1990–2009; EPA: Washington, DC, USA, 2011.
- Bao, Z.; Sun, S.; Sun, D. Assessment of greenhouse gas emission from A/O and SBR wastewater treatment plants in Beijing, China. Int. Biodeterior. Biodegrad. 2016, 108, 108–114. [Google Scholar] [CrossRef]
- Delre, A.; Mnster, J.; Scheutz, C. Greenhouse gas emission quantification from wastewater treatment plants, using a tracer gas dispersion method. Sci. Total Environ. 2017, 605, 258–268. [Google Scholar] [CrossRef] [PubMed]
- Su, J.J.; Liu, B.Y.; Chang, Y.C. Emission of greenhouse gas from livestock waste and wastewater treatment in Taiwan. Agric. Ecosyst. Environ. 2003, 95, 253–263. [Google Scholar] [CrossRef]
- Brannon, E.Q. Greenhouse Gas Emissions from Biological Nutrient Removal During Wastewater Treatment; University of Rhode Island: Kingston, NY, USA, 2017. [Google Scholar]
- Bao, Z.; Sun, S.; Sun, D. Characteristics of direct CO2 emissions in four full-scale wastewater treatment plants. Desalination Water Treat. 2015, 54, 1070–1079. [Google Scholar] [CrossRef]
- Malila, R.; Lehtoranta, S.; Viskari, E.L. The role of source separation in nutrient recovery–comparison of alternative wastewater treatment systems. J. Clean. Prod. 2019, 219, 350–358. [Google Scholar] [CrossRef]
- Yan, C.; Zhang, H.; Li, B.; Wang, D.; Zhao, Y.J.; Zheng, Z. Effects of influent C/N ratios on CO2 and CH4 emissions from vertical subsurface flow constructed wetlands treating synthetic municipal wastewater. J. Hazard. Mater. 2012, 203, 188–194. [Google Scholar] [CrossRef] [PubMed]
- Singh, P.; Kansal, A. Energy and GHG accounting for wastewater infrastructure. Resour. Conserv. Recycl. 2018, 128, 499–507. [Google Scholar] [CrossRef]
- Mamais, D.; Noutsopoulos, C.; Dimopoulou, A.; Stasinakis, A.; Lekkas, T.D. Wastewater treatment process impact on energy savings and greenhouse gas emissions. Water Sci. Technol. 2015, 71, 303–308. [Google Scholar] [CrossRef] [PubMed]
- Shahabadi, M.B.; Yerushalmi, L.; Haghighat, F. Impact of process design on greenhouse gas (GHG) generation by wastewater treatment plants. Water Res. 2009, 43, 2679–2687. [Google Scholar] [CrossRef] [PubMed]
- Bodzek, D.; Janoszka, B.; Dobosz, C.; Warzecha, L.; Bodzek, M. Determination of polycyclic aromatic compounds and heavy metals in sludges from biological sewage treatment plants. J. Chromatogr. A 1997, 774, 177–192. [Google Scholar] [CrossRef]
- Feng, Y.; Zhang, Y.; Quan, X.; Chen, H. Enhanced anaerobic digestion of waste activated sludge digestion by the addition of zero valent iron. Water Res. 2014, 52, 242–250. [Google Scholar] [CrossRef] [PubMed]
- Zhang, G.; He, J.; Zhang, P.; Zhang, J. Ultrasonic reduction of excess sludge from activated sludge system II: Urban sewage treatment. J. Hazard. Mater. 2009, 164, 1105–1109. [Google Scholar] [CrossRef] [PubMed]
- Shehu, M.S.; Manan, Z.A.; Alwi, S.R.W. Optimization of thermo-alkaline disintegration of sewage sludge for enhanced biogas yield. Bioresour. Technol. 2012, 114, 69–74. [Google Scholar] [CrossRef] [PubMed]
- Zhang, G.; Yang, J.; Liu, H.; Zhang, J. Sludge ozonation: Disintegration, supernatant changes and mechanisms. Bioresour. Technol. 2009, 100, 1505–1509. [Google Scholar] [CrossRef]
- Zaker, A.; Chen, Z.; Wang, X.; Zhang, Q. Microwave-assisted pyrolysis of sewage sludge: A review. Fuel Process. Technol. 2019, 187, 84–104. [Google Scholar] [CrossRef]
- Chen, Y.C.; Kuo, J. Potential of greenhouse gas emissions from sewage sludge management: A case study of Taiwan. J. Clean. Prod. 2016, 129, 196–201. [Google Scholar] [CrossRef]
- Duan, B.; Zhang, W.; Zheng, H.; Wu, C.; Zhang, Q.; Bu, Y. Disposal Situation of Sewage Sludge from Municipal Wastewater Treatment Plants (WWTPs) and Assessment of the Ecological Risk of Heavy Metals for Its Land Use in Shanxi, China. Int. J. Environ. Res. Public Health 2017, 14, 823. [Google Scholar] [CrossRef]
- Yang, G.; Fan, M.; Zhang, G. Emerging contaminants in surface waters in China—A short review. Environ. Res. Lett. 2014, 9, 074018. [Google Scholar] [CrossRef]
- Dong, B.; Liu, X.; Dai, L.; Dai, X.H. Changes of heavy metal speciation during high-solid anaerobic digestion of sewage sludge. Bioresour. Technol. 2013, 131, 152–158. [Google Scholar] [CrossRef]
- Yang, C.; Meng, X.Z.; Chen, L.; Xia, X.Q. Polybrominated diphenyl ethers in sewage sludge from Shanghai, China: Possible ecological risk applied to agricultural land. Chemosphere 2011, 85, 418–423. [Google Scholar] [CrossRef]
- Schulz, A.; Obenaus, F.; Egerland, B.; Reicherter, E. Elimination costs for different wastewater compounds. Water Sci. Technol. 2003, 47, 119–124. [Google Scholar] [CrossRef] [PubMed]
- Zhou, P.; Ang, B.W.; Poh, K.L. Decision analysis in energy and environmental modeling: An update. Energy 2006, 31, 2604–2622. [Google Scholar] [CrossRef]
- Bognár, F.; Szentes, B.; Benedek, P. Development of the PRISM Risk Assessment Method Based on a Multiple AHP-TOPSIS Ap-proach. Risks 2022, 10, 213. [Google Scholar] [CrossRef]
- Mathew, M.; Chakrabortty, R.K.; Ryan, M.J. Selection of an optimal maintenance strategy under uncertain conditions: An interval type-2 fuzzy AHP-TOPSIS method. IEEE Trans. Eng. Manag. 2020, 69, 1121–1134. [Google Scholar] [CrossRef]
- Du, Y.; Chen, W.; Cui, K.; Zhang, K. Study on damage assessment of earthen sites of the Ming Great Wall in Qinghai Province based on Fuzzy-AHP and AHP-TOPSIS. Int. J. Archit. Herit. 2019, 14, 903–916. [Google Scholar] [CrossRef]
- Liu, B.; Tang, J.; Li, Z.; Yan, Y.; Chen, J.S. Optimal selection of sewage treatment technologies in town areas: A coupled multi-criteria decisionmaking model. Environ. Manag. 2020, 66, 709–721. [Google Scholar] [CrossRef]
- Liu, B.; Tang, J.; Qu, Y.; Yang, Y.; Lyu, H.; Dai, Y.D.; Li, Z.Y. A GIS-Based Method for Identification of Blindness in Former Site Selection of Sewage Treatment Plants and Exploration of Optimal Siting Areas: A Case Study in Liao River Basin. Water 2022, 14, 1092. [Google Scholar] [CrossRef]
- Dai, C.; Tang, J.; Li, Z.; Duan, Y.C.; Qu, Y.K.; Yang, Y.; Lyu, H.; Zhang, D.; Wang, Y.T. Index System of Water Resources Development and Utilization Level Based on Water-Saving Society. Water 2022, 14, 802. [Google Scholar] [CrossRef]
- Anaokar, G.; Khambete, A.; Christian, R. Evaluation of a performance index for municipal wastewater treatment plants using MCDM–TOPSIS. Int. J. Technol. 2018, 9, 715–726. [Google Scholar] [CrossRef]
- Zorpas, A.A.; Pociovălişteanu, D.M.; Georgiadou, L.; Voukkali, I. Environmental and technical evaluation of the use of alternative fuels through multi-criteria analysis model. Prog. Ind. Ecol. Int. J. 2016, 10, 3–15. [Google Scholar] [CrossRef]
- Yang, Q.; Yu, X. Evaluation of rural water environment governance in Changzhou. IOP Conf. Ser. Earth Environ. Sci. 2021, 804, 042026. [Google Scholar] [CrossRef]
- Bexek, J.C. (Ed.) Pattern Recognition with Fuzzy Objective Function Algorithm; Springer Science & Business Media: Melbourne, VI, Australia, 1981. [Google Scholar]
- Saaty, T.L. The Analytic Hierarchy Process; Springer: Berlin/Heidelberg, Germany, 1980; p. 324. [Google Scholar]
- Hwang, C.L.; Yoon, K. Methods for Multiple Attribute Decision Making. Multiple Attribute Decision Making; Springer: Berlin/Heidelberg, Germany, 1981; pp. 58–191. [Google Scholar]
- Chen, S.J.; Hwang, C.L. Fuzzy Multiple Attribute Decision Making Methods; Springer: Berlin/Heidelberg, Germany, 1992; pp. 289–486. [Google Scholar]
Disclaimer/Publisher’s Note: The statements, opinions and data contained in all publications are solely those of the individual author(s) and contributor(s) and not of MDPI and/or the editor(s). MDPI and/or the editor(s) disclaim responsibility for any injury to people or property resulting from any ideas, methods, instructions or products referred to in the content. |
© 2023 by the authors. Licensee MDPI, Basel, Switzerland. This article is an open access article distributed under the terms and conditions of the Creative Commons Attribution (CC BY) license (https://creativecommons.org/licenses/by/4.0/).