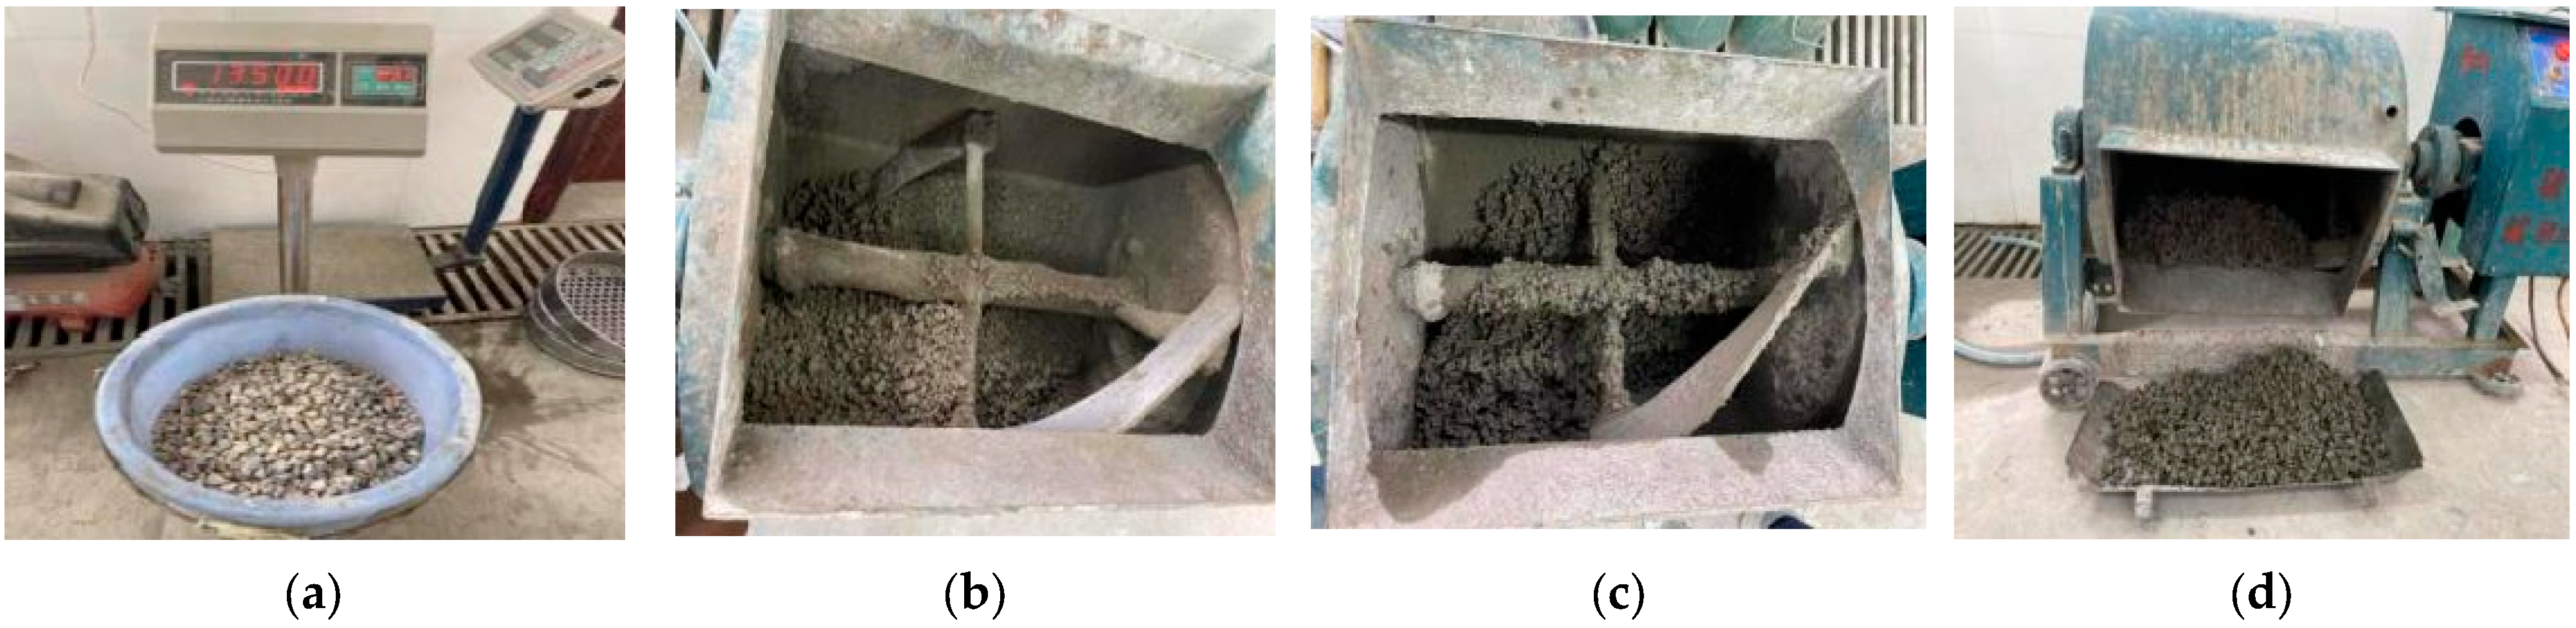
Figure 1.
Mixing process of the cement-wrapped paste method: (a) weighing material, (b) cement wrapped paste; (c) mixed material mixing, and (d) discharge.
Figure 1.
Mixing process of the cement-wrapped paste method: (a) weighing material, (b) cement wrapped paste; (c) mixed material mixing, and (d) discharge.
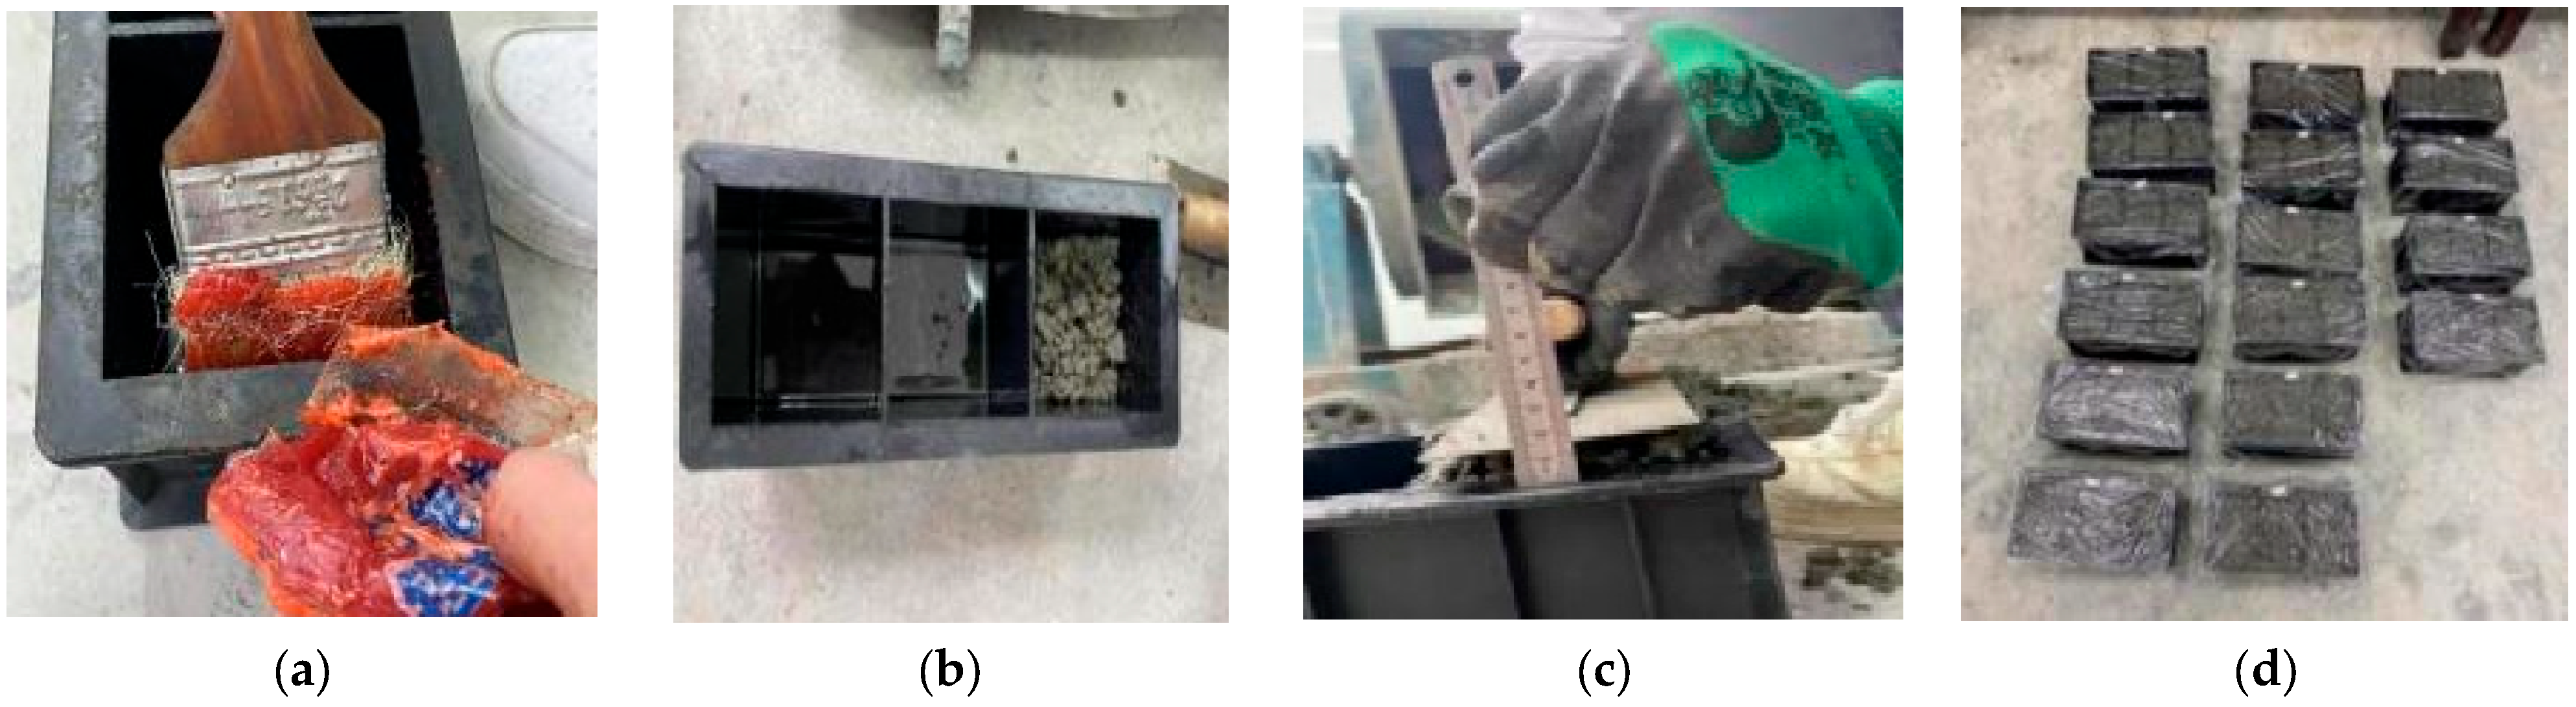
Figure 2.
Forming process of permeable concrete specimen: (a) brush grease, (b) assembly mold, (c) compaction, and (d) film mulching.
Figure 2.
Forming process of permeable concrete specimen: (a) brush grease, (b) assembly mold, (c) compaction, and (d) film mulching.
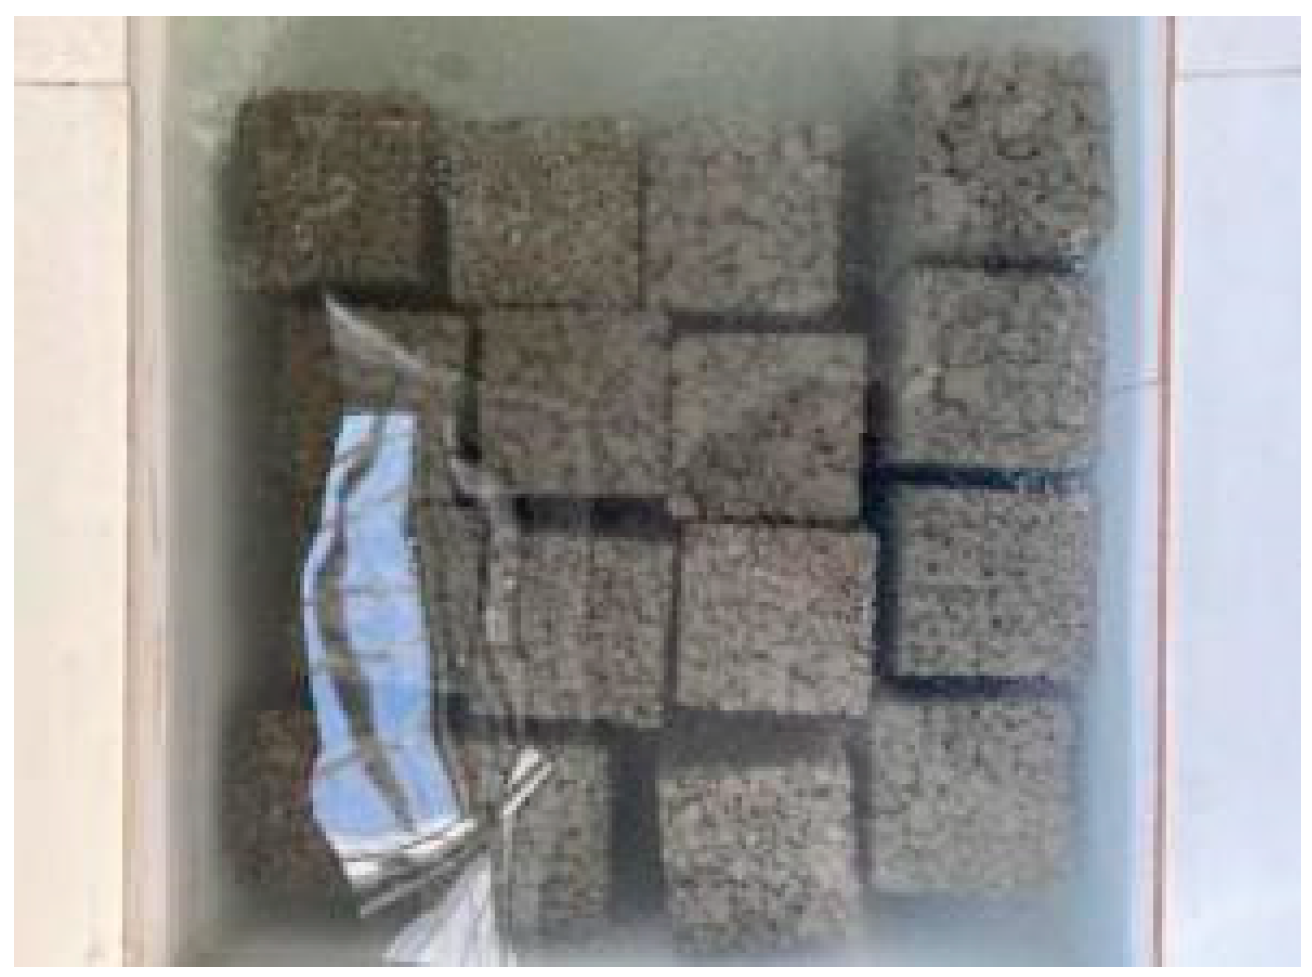
Figure 3.
Maintenance of permeable concrete.
Figure 3.
Maintenance of permeable concrete.
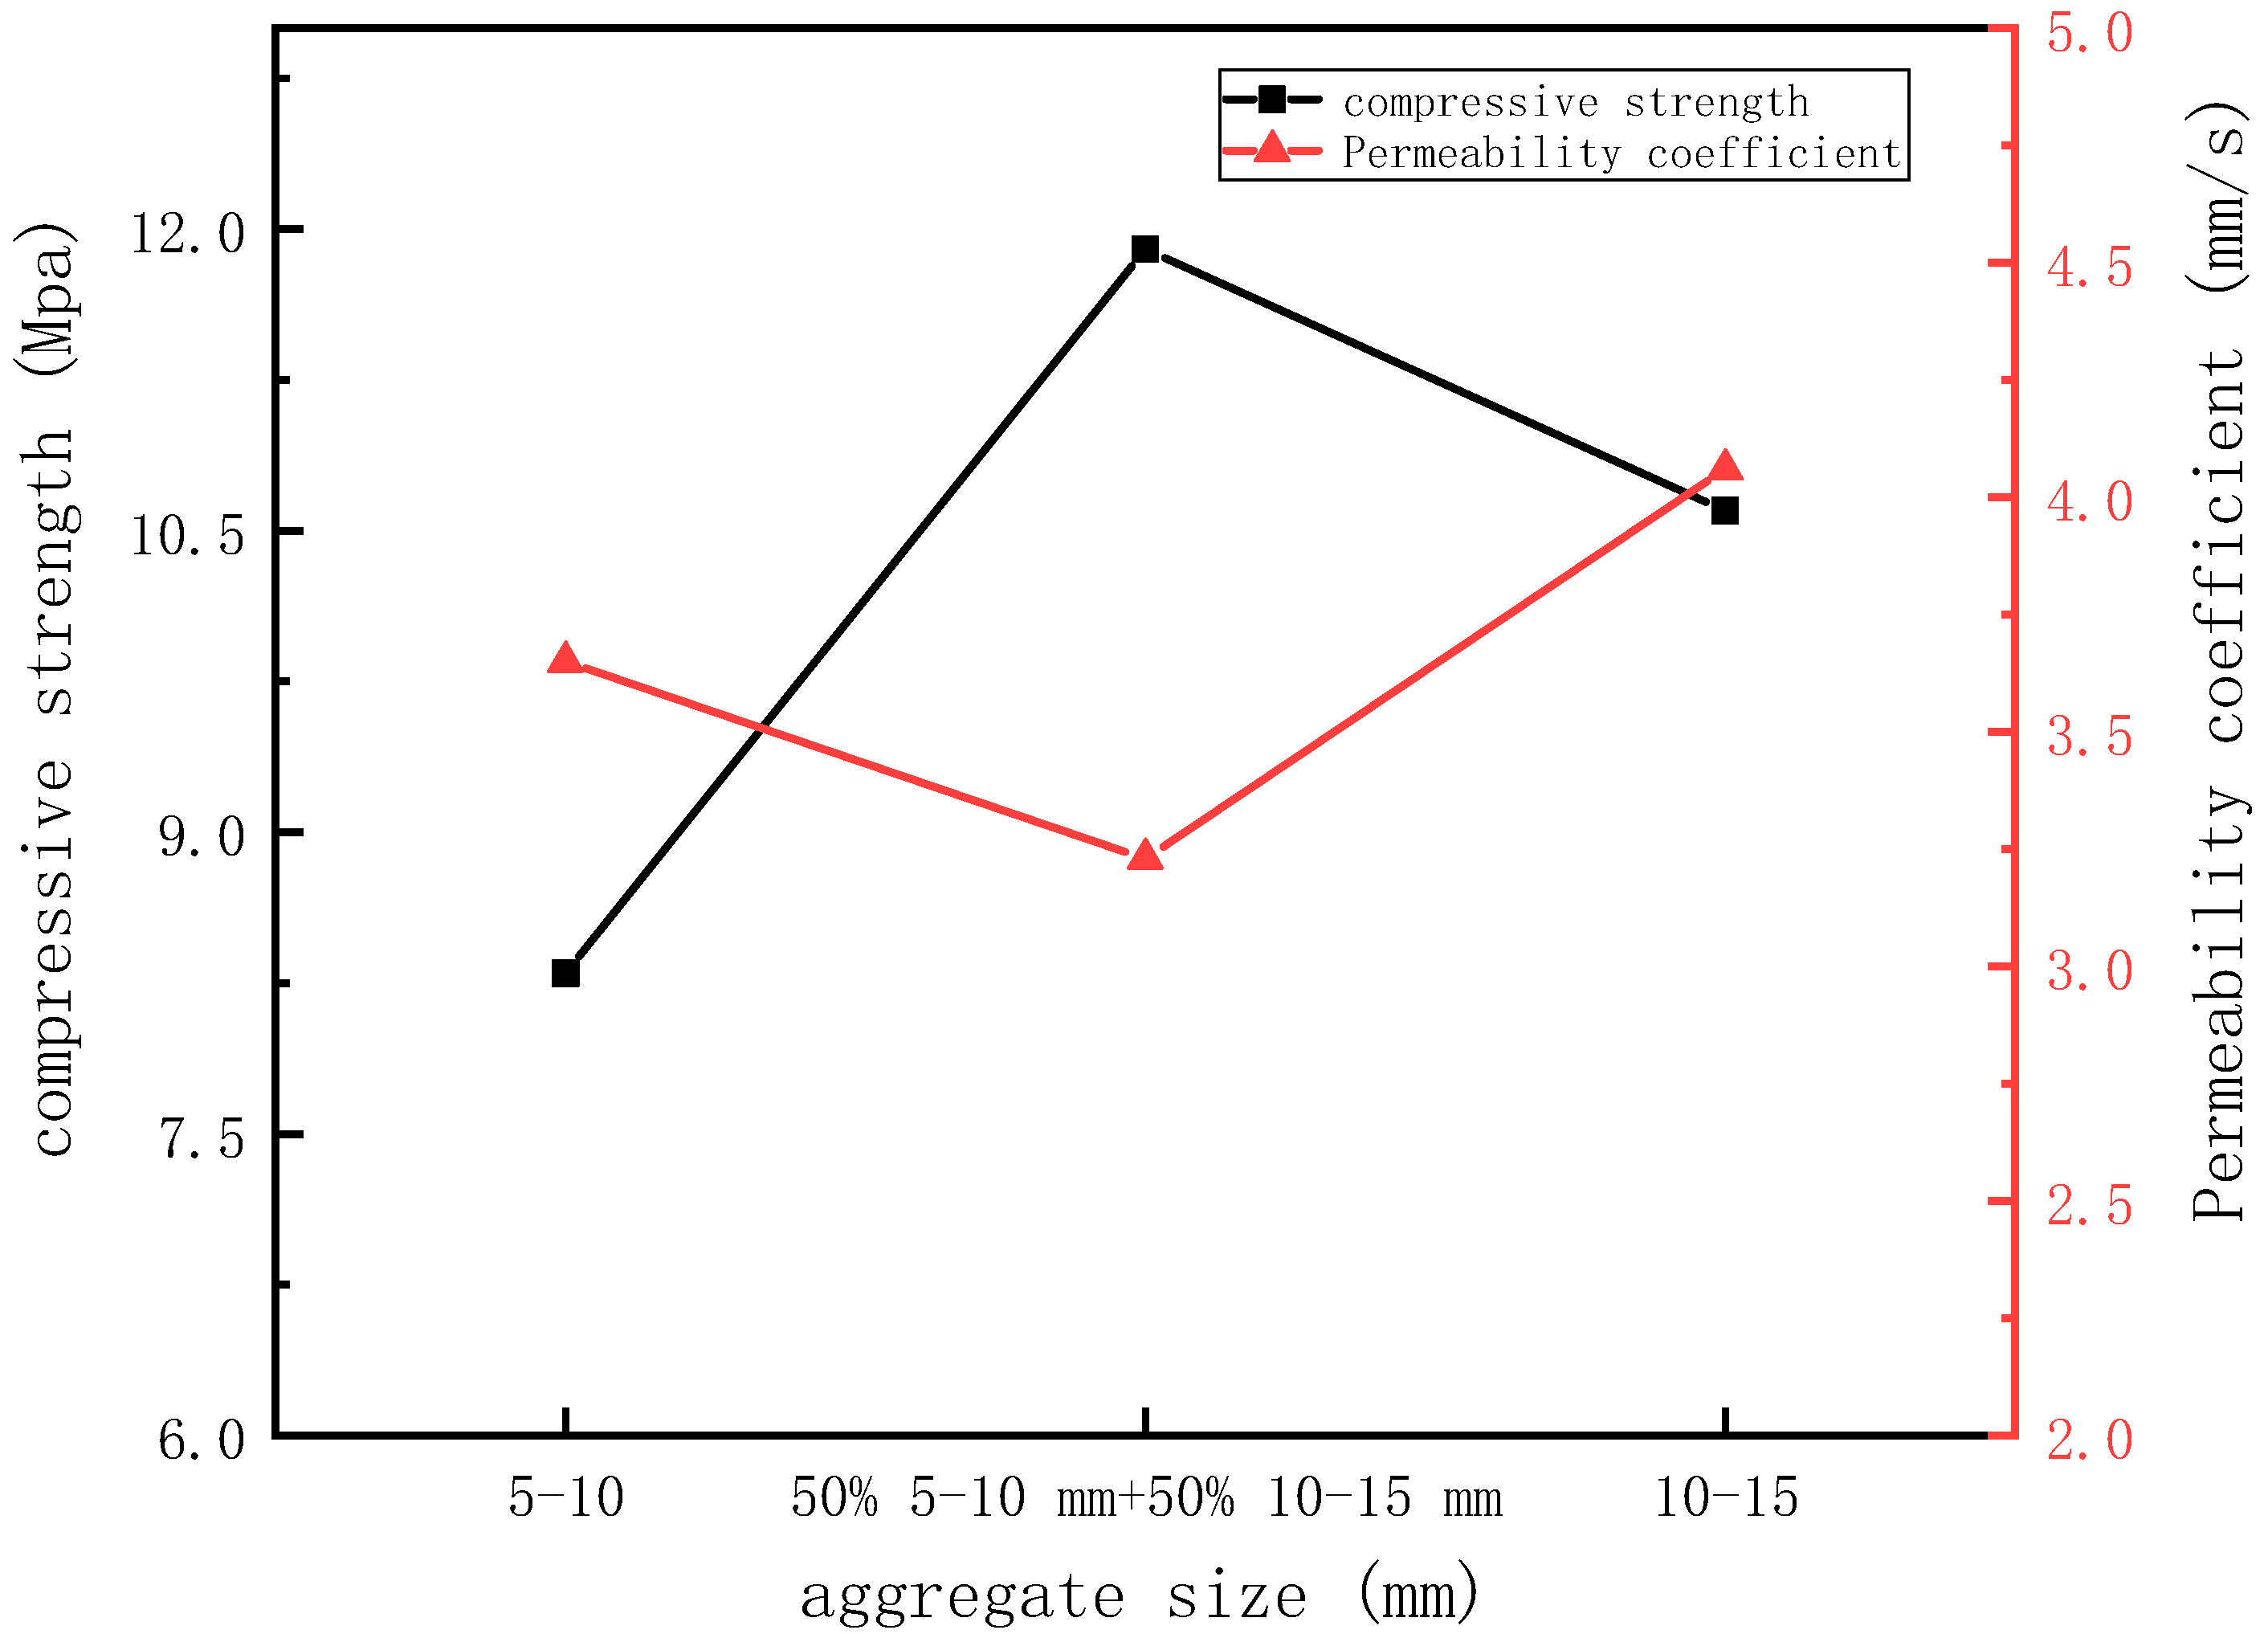
Figure 4.
Relationship between aggregate size and compressive strength and permeability coefficient.
Figure 4.
Relationship between aggregate size and compressive strength and permeability coefficient.
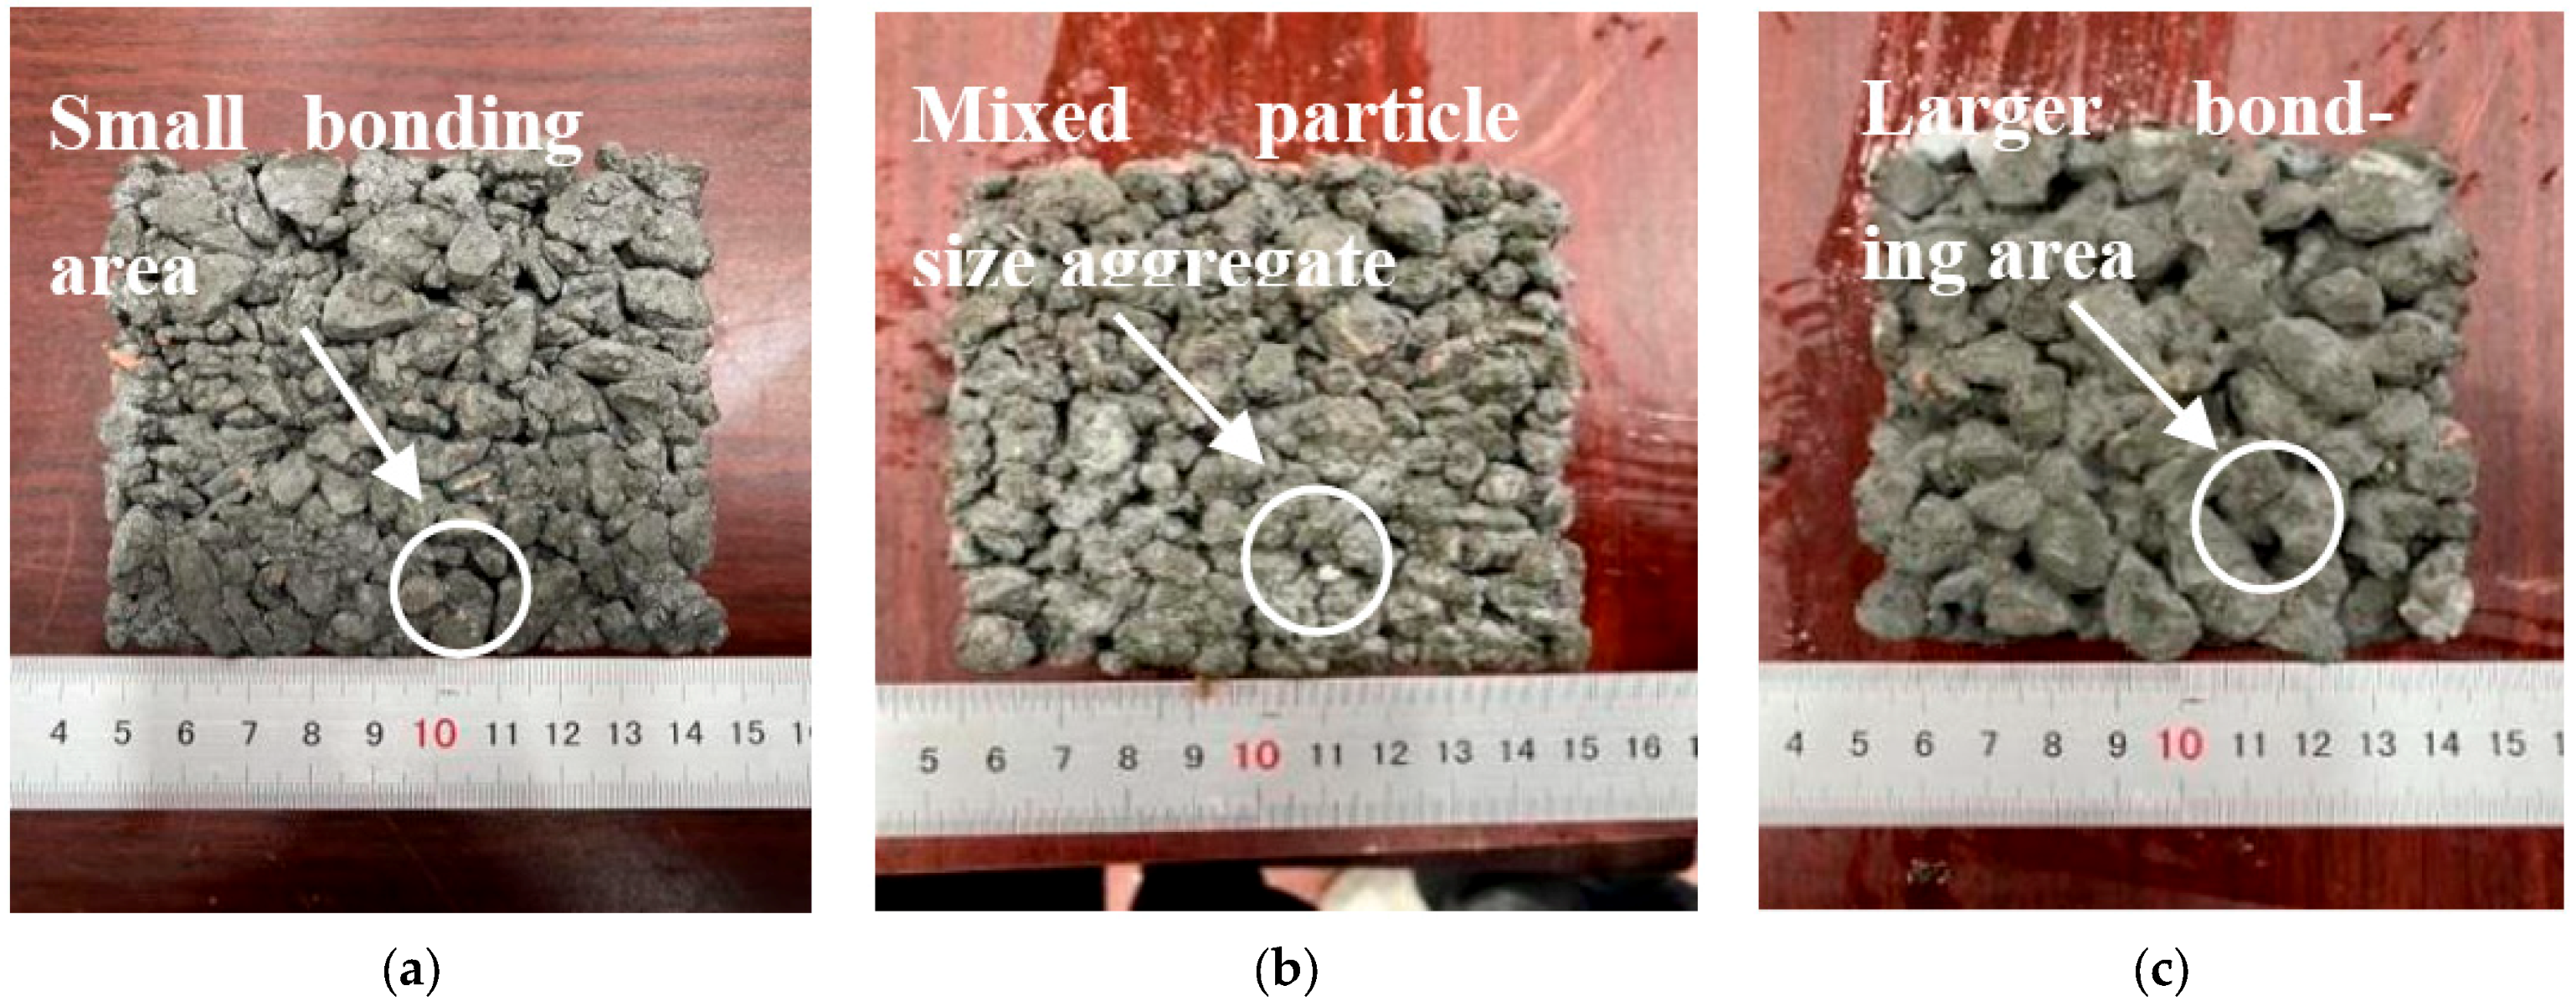
Figure 5.
Permeable concrete specimens with different aggregate sizes: (a) 5–10 mm aggregate specimen, (b) mixed aggregate specimen, and (c) 10–15 mm aggregate specimen.
Figure 5.
Permeable concrete specimens with different aggregate sizes: (a) 5–10 mm aggregate specimen, (b) mixed aggregate specimen, and (c) 10–15 mm aggregate specimen.
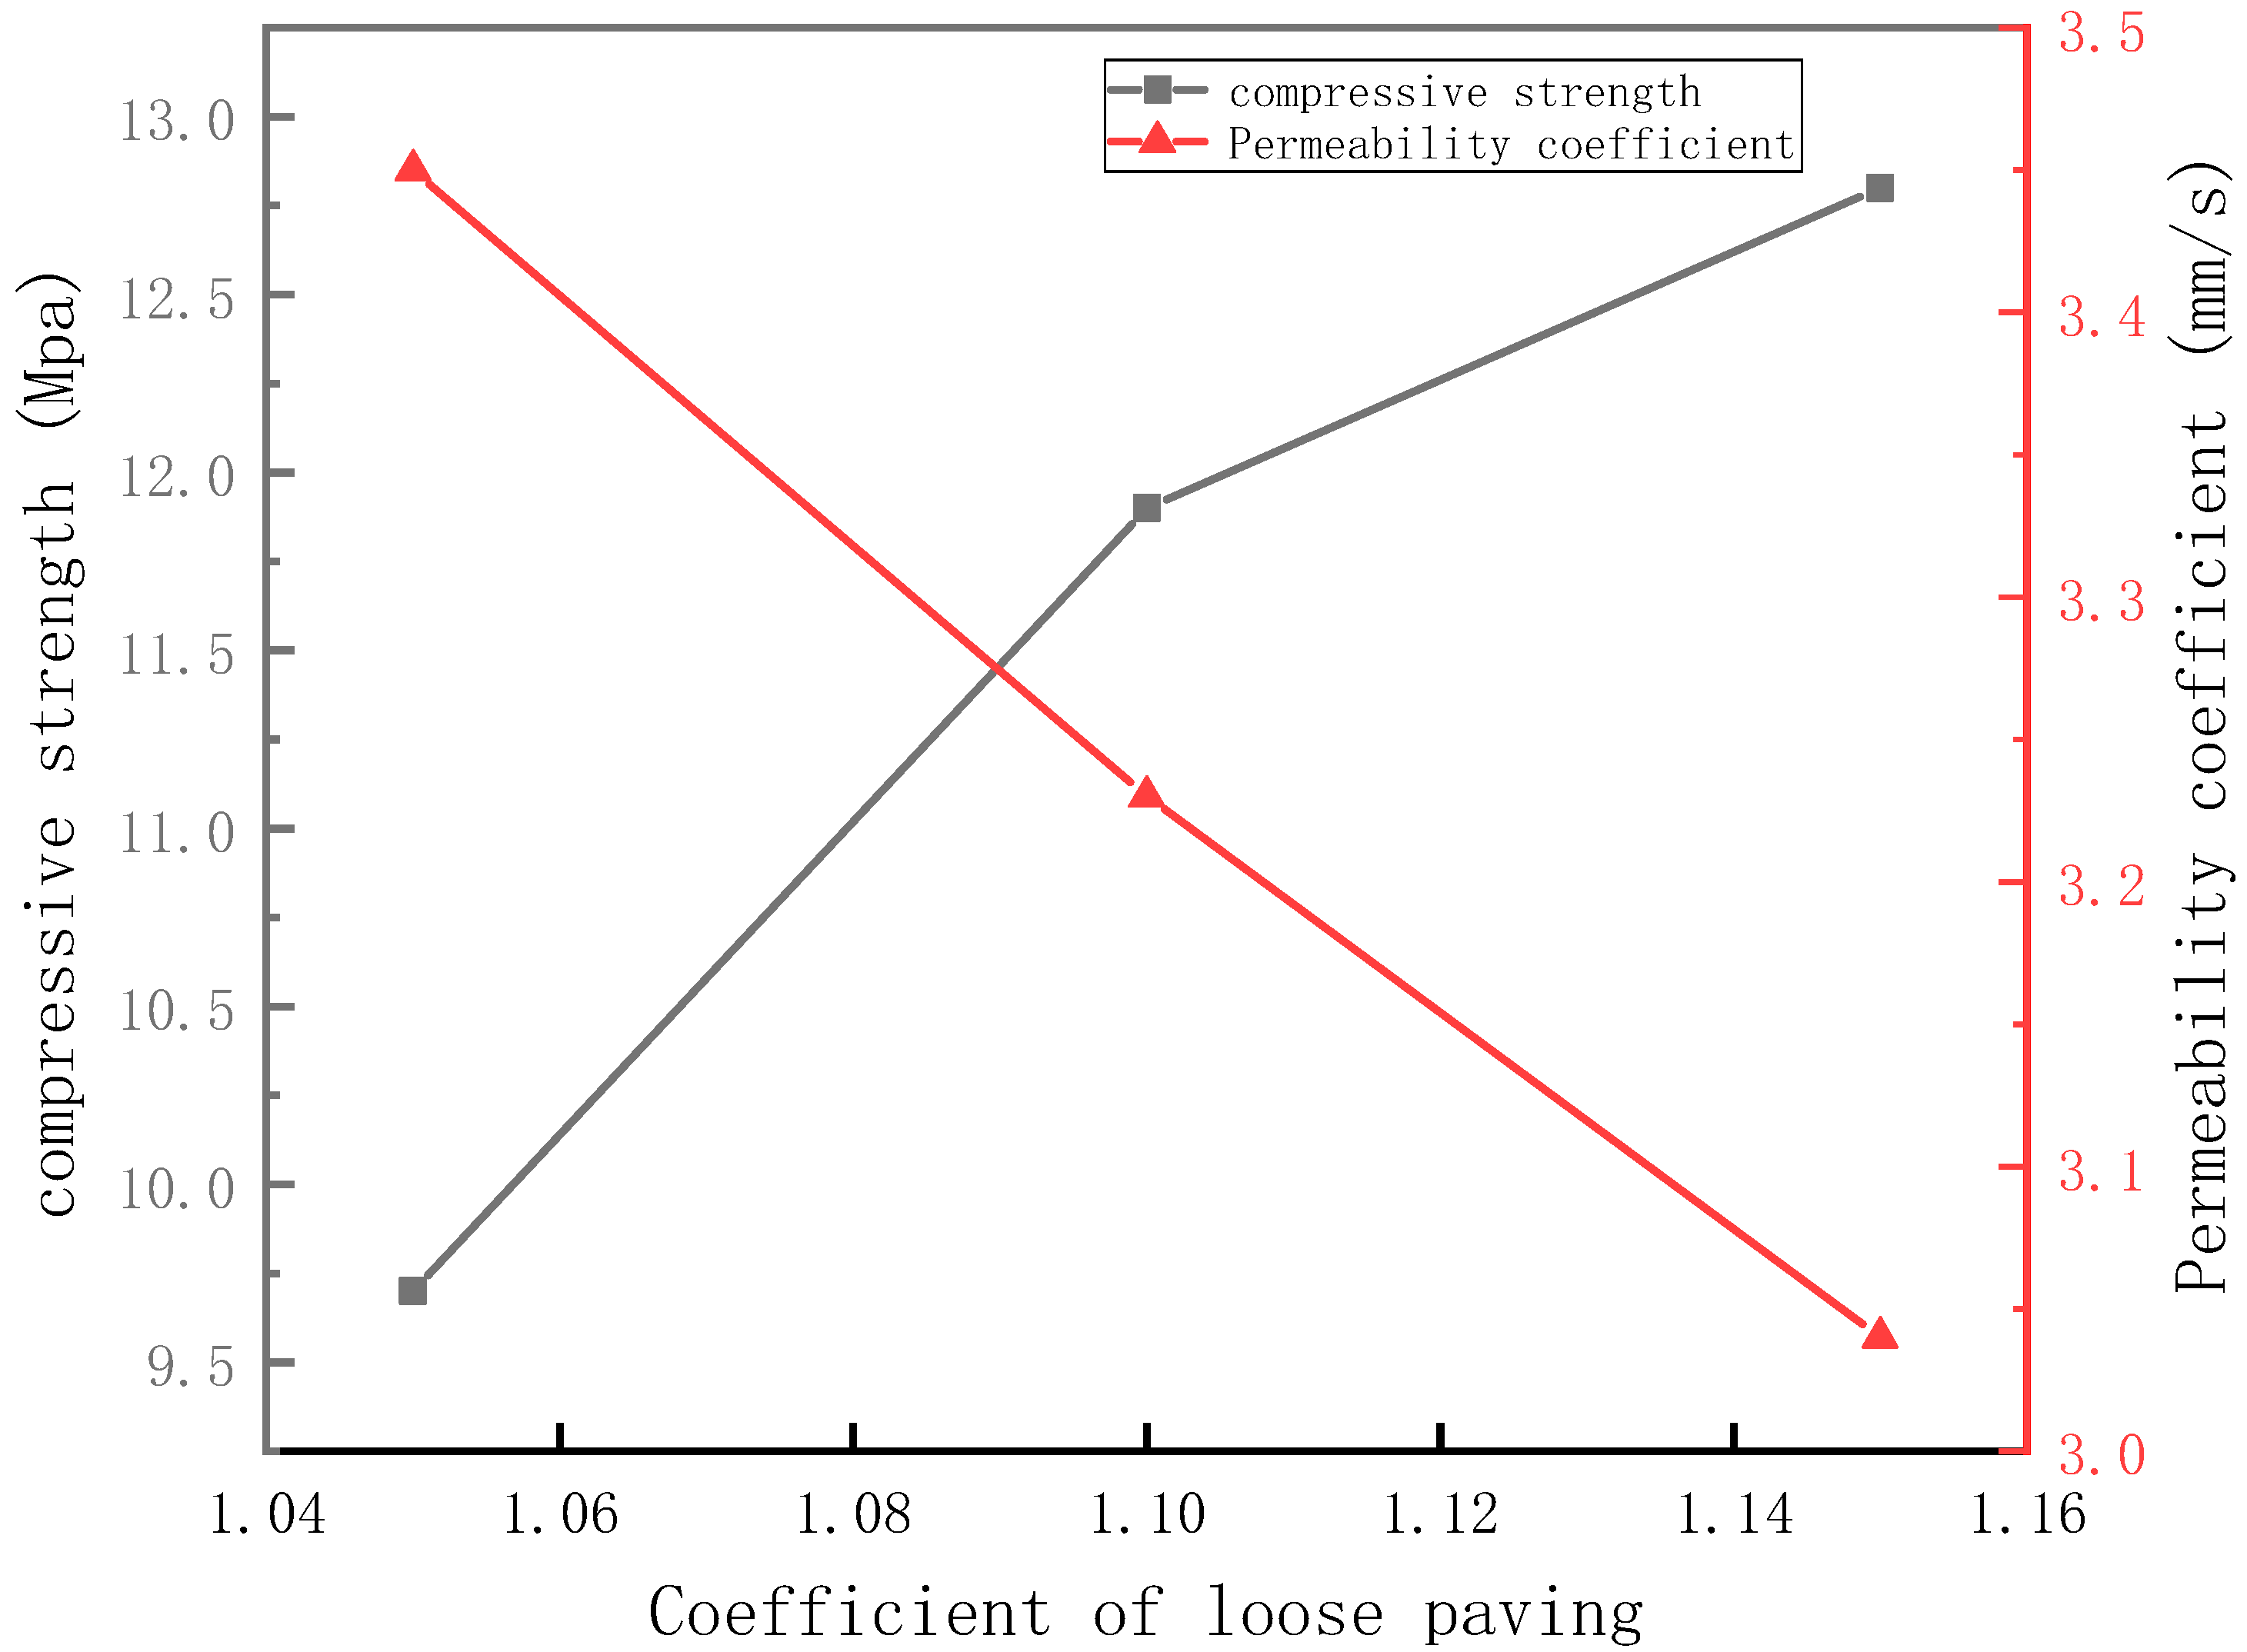
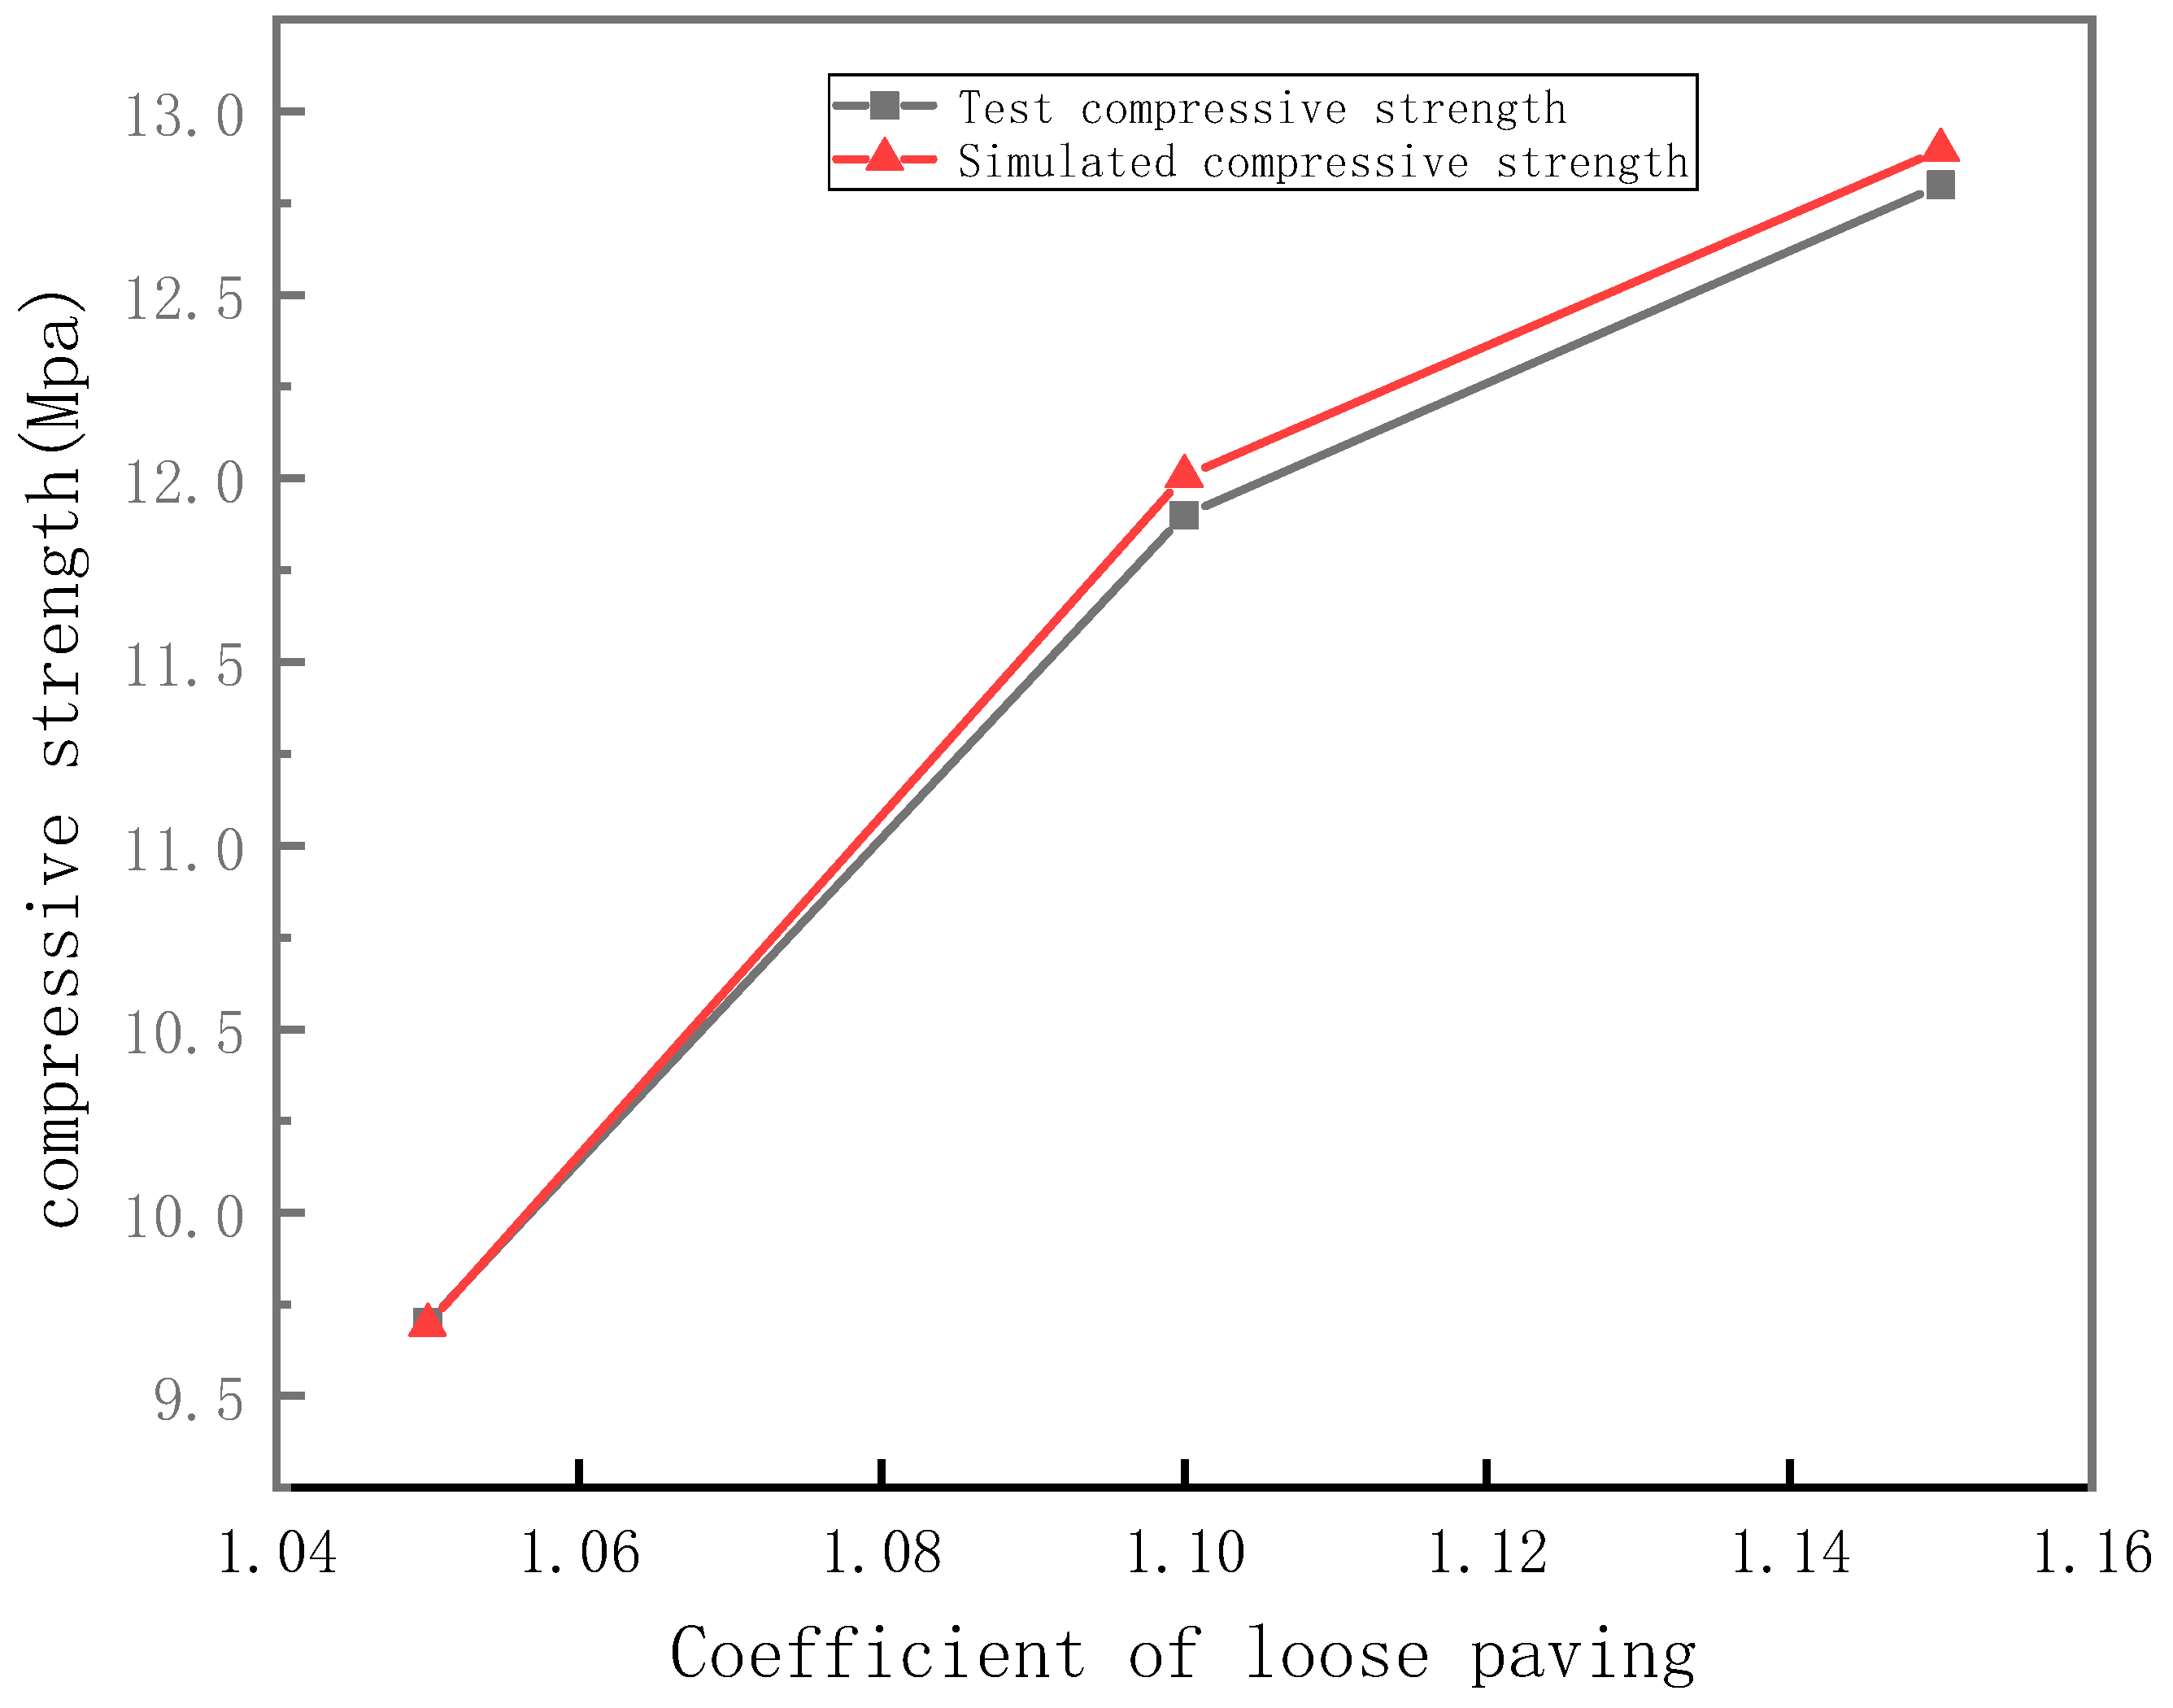
Figure 6.
Relationship between the loose paving coefficient and compressive strength and permeability coefficient.
Figure 6.
Relationship between the loose paving coefficient and compressive strength and permeability coefficient.
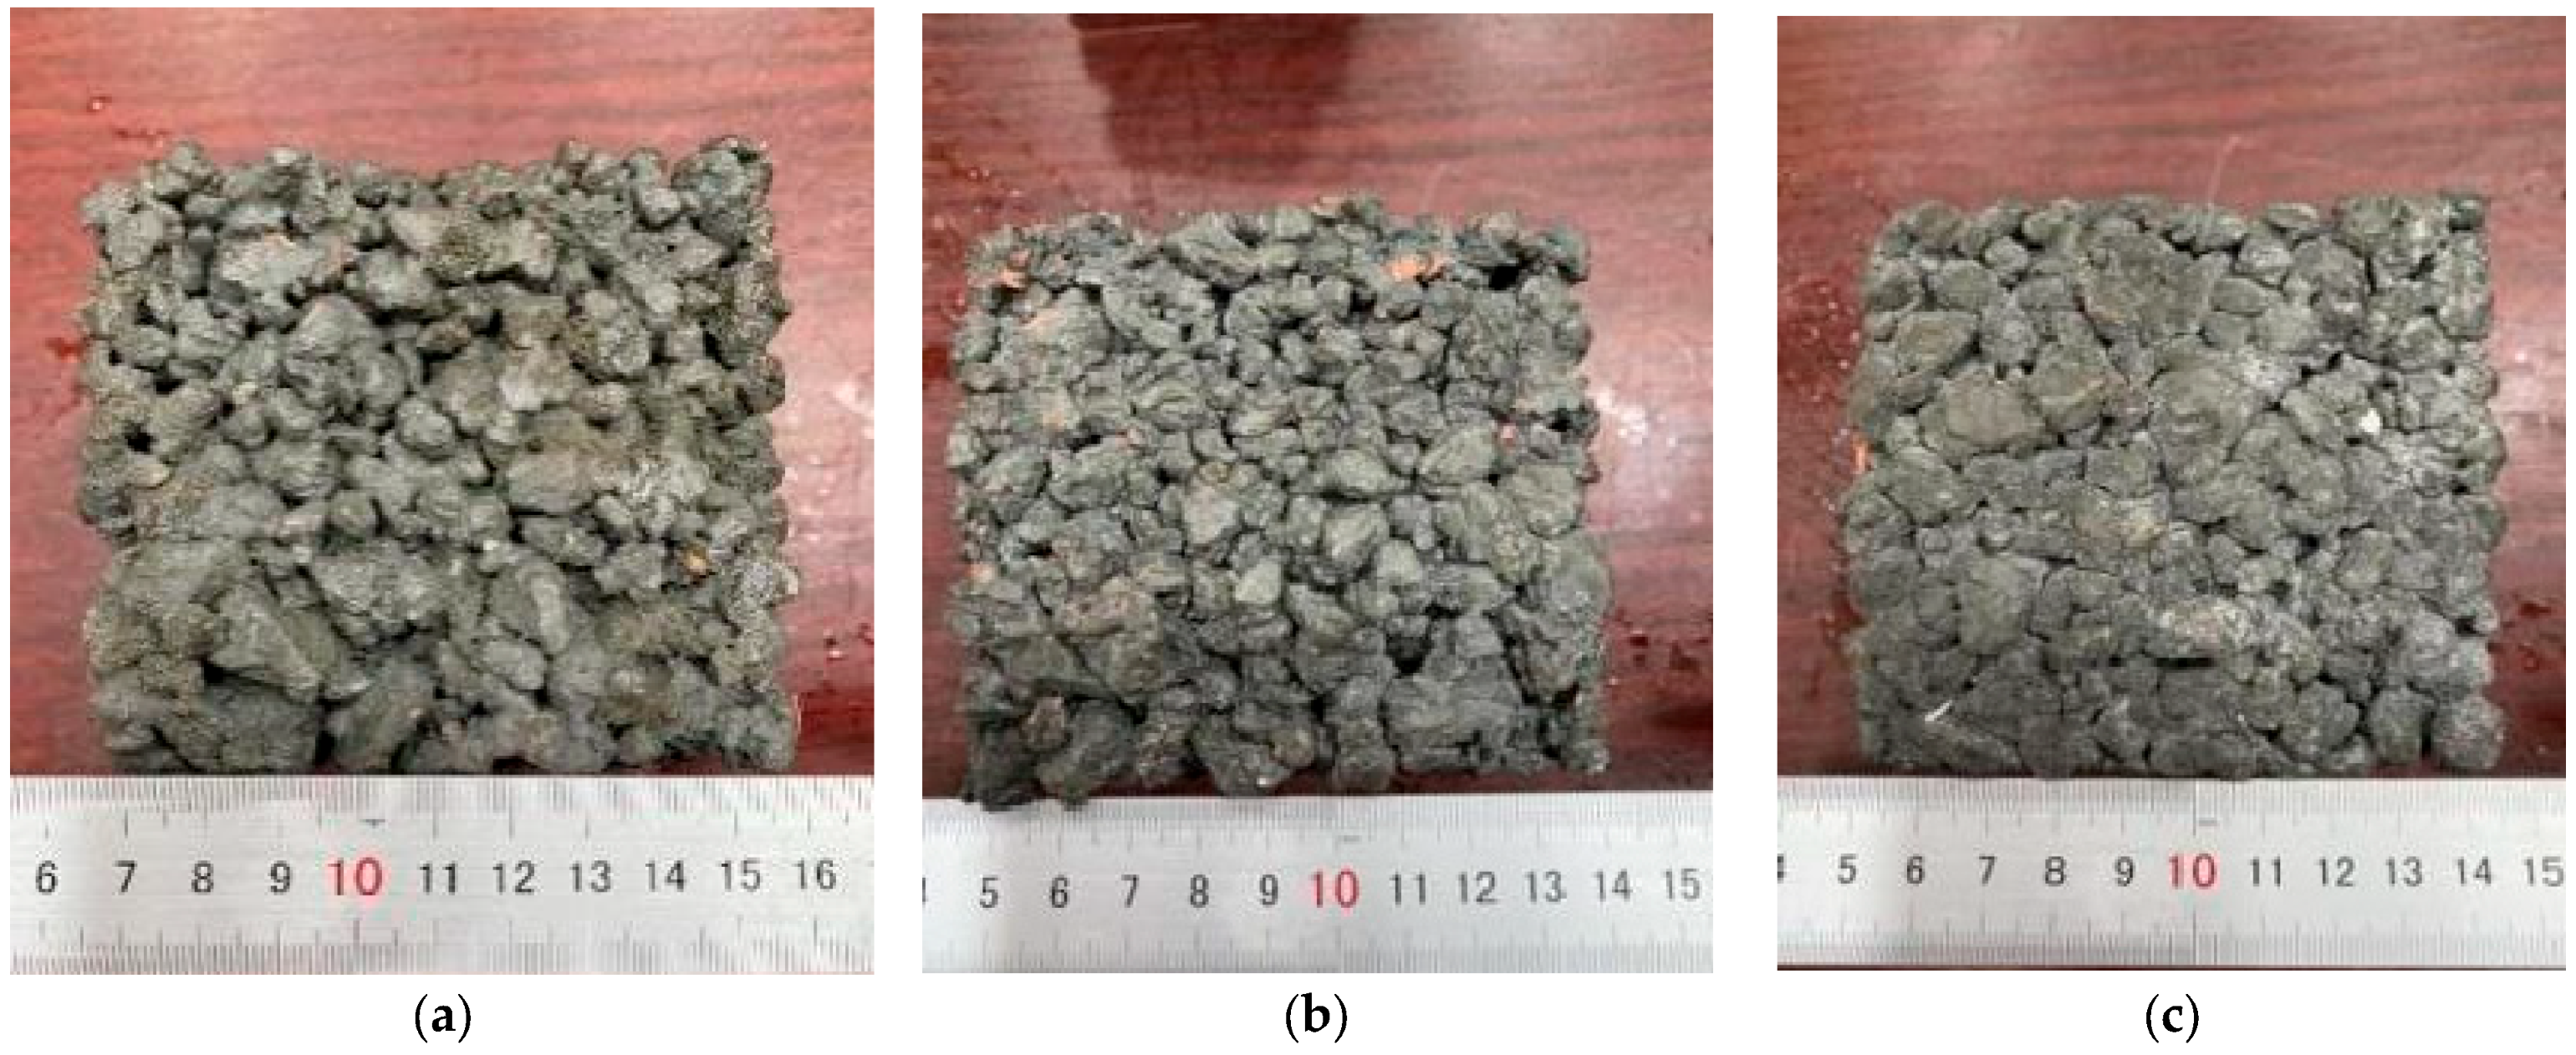
Figure 7.
Morphology of permeable concrete specimens under different loose paving coefficients: (a) loose paving coefficient = 1.05, (b) loose paving coefficient = 1.10, and (c) loose paving coefficient = 1.15.
Figure 7.
Morphology of permeable concrete specimens under different loose paving coefficients: (a) loose paving coefficient = 1.05, (b) loose paving coefficient = 1.10, and (c) loose paving coefficient = 1.15.
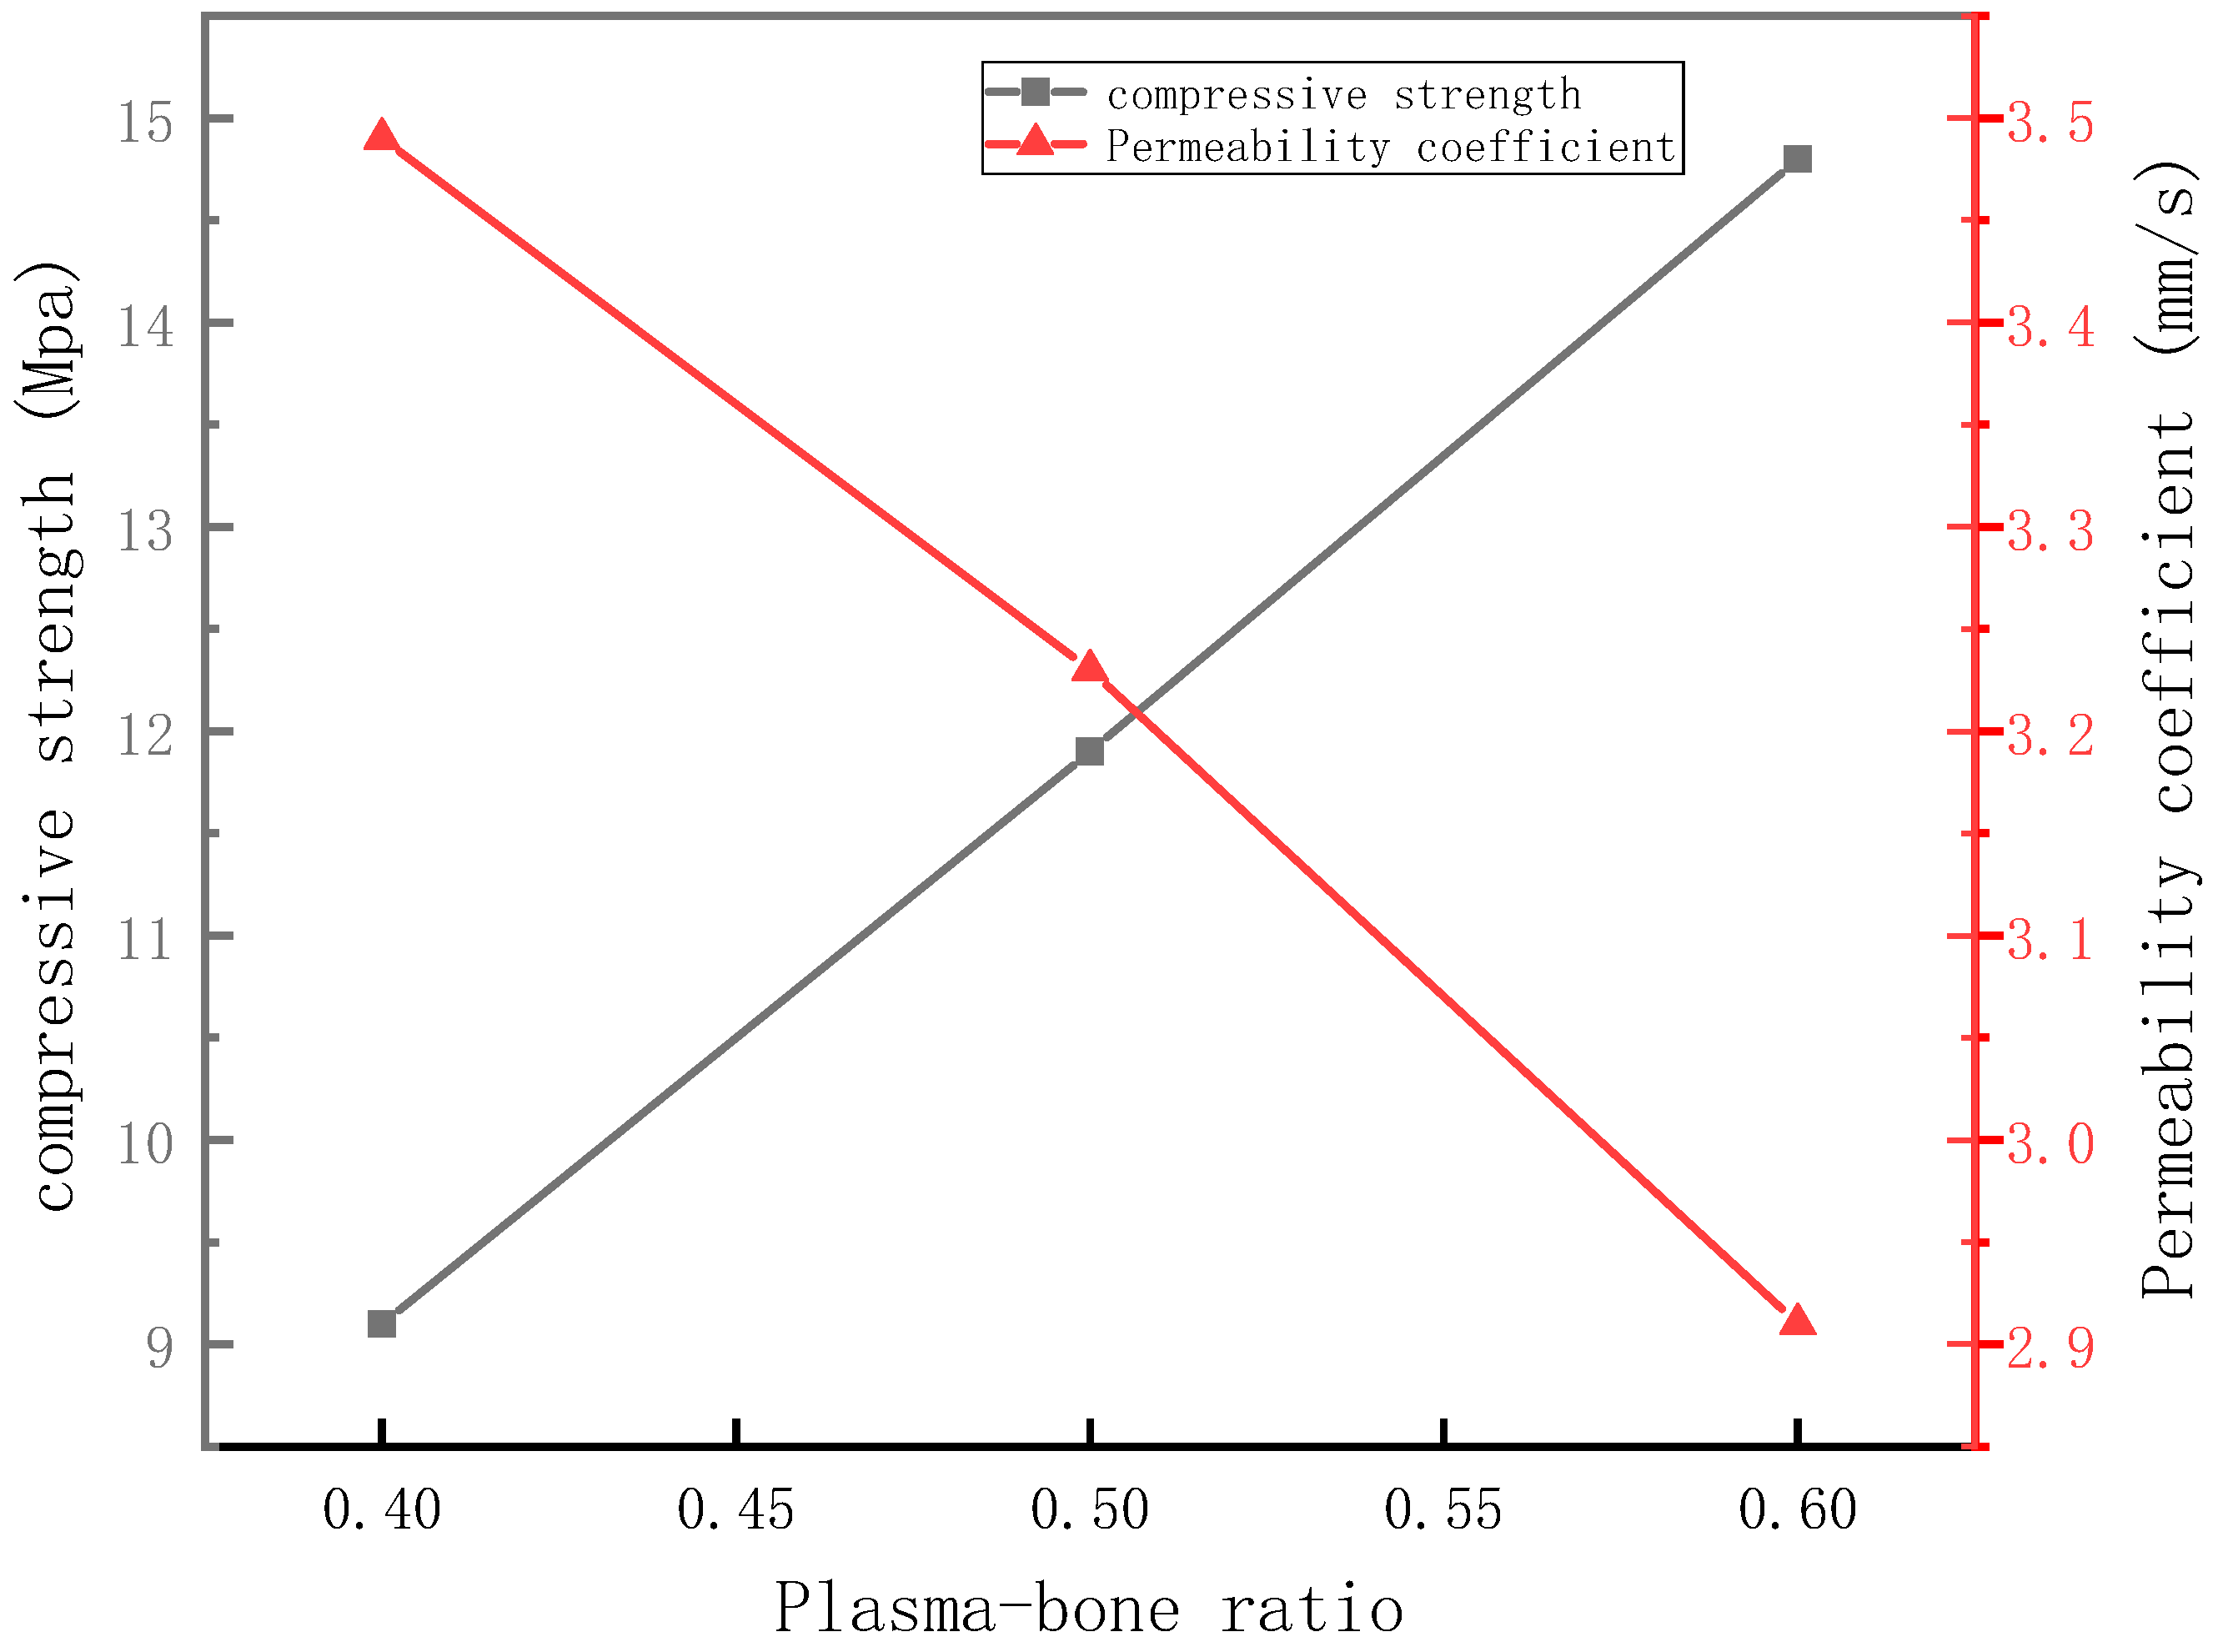
Figure 8.
Relationship between slurry-to-bone ratio and compressive strength and permeability coefficient.
Figure 8.
Relationship between slurry-to-bone ratio and compressive strength and permeability coefficient.
Figure 9.
Morphology of permeable concrete specimens with different paste-to-bone ratios: (a) plasma-to-bone ratio = 0.4; (b) plasma-to-bone ratio = 0.5; (c) plasma-to-bone ratio = 0.6.
Figure 9.
Morphology of permeable concrete specimens with different paste-to-bone ratios: (a) plasma-to-bone ratio = 0.4; (b) plasma-to-bone ratio = 0.5; (c) plasma-to-bone ratio = 0.6.
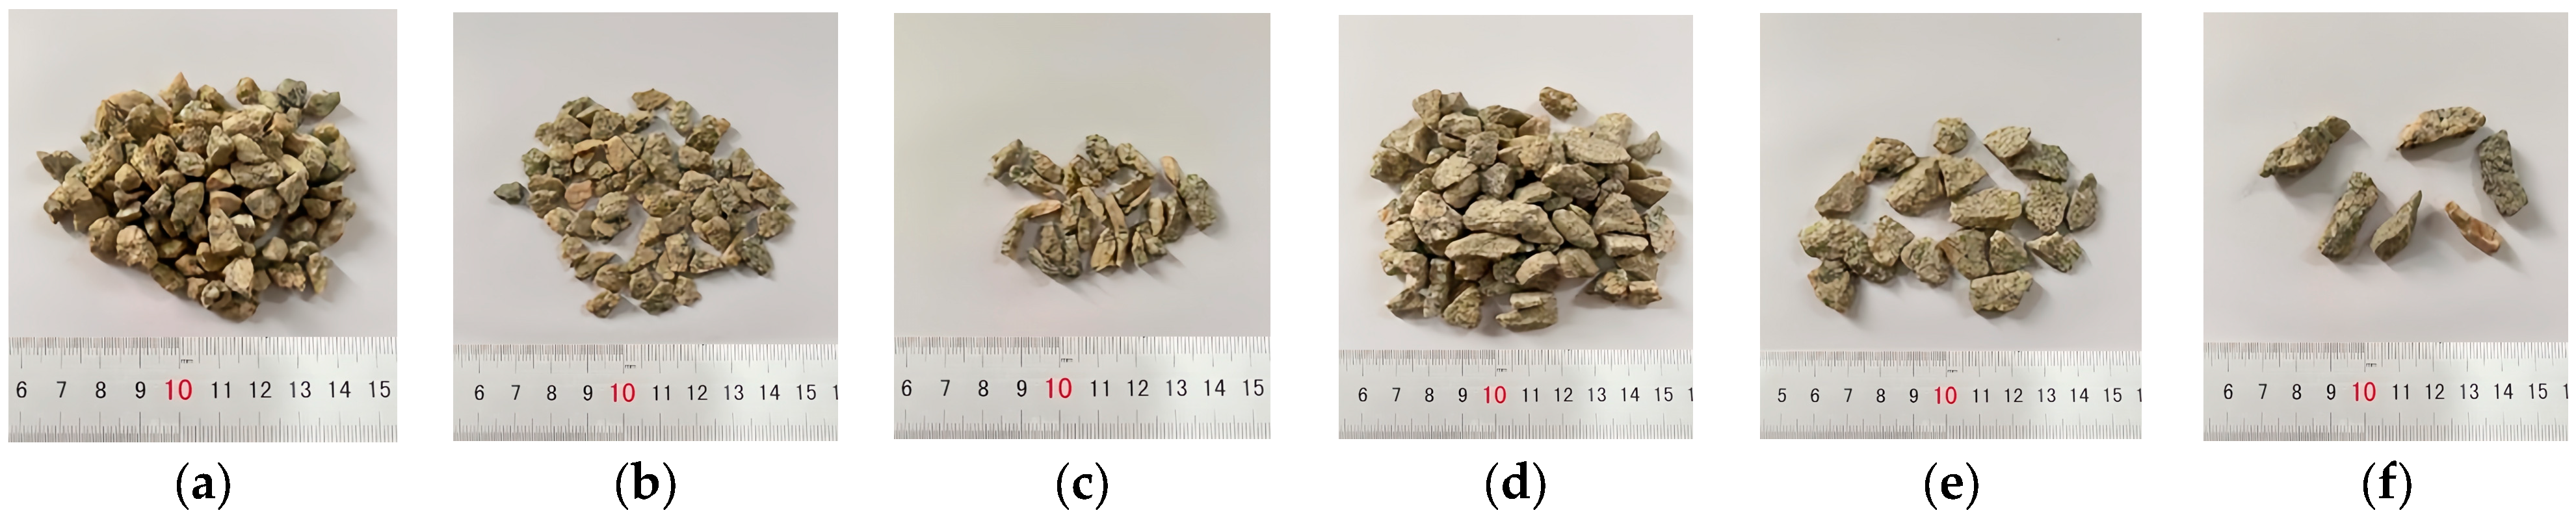
Figure 10.
Aggregate shape classification: (a) 5–10 mm angular aggregate, (b) 5–10 mm flat aggregate, (c) 5–10 mm slender aggregate, (d) 5–10 mm angular aggregate, (e) 10–15 mm flat aggregate, and (f) 10–15 mm slender aggregate.
Figure 10.
Aggregate shape classification: (a) 5–10 mm angular aggregate, (b) 5–10 mm flat aggregate, (c) 5–10 mm slender aggregate, (d) 5–10 mm angular aggregate, (e) 10–15 mm flat aggregate, and (f) 10–15 mm slender aggregate.
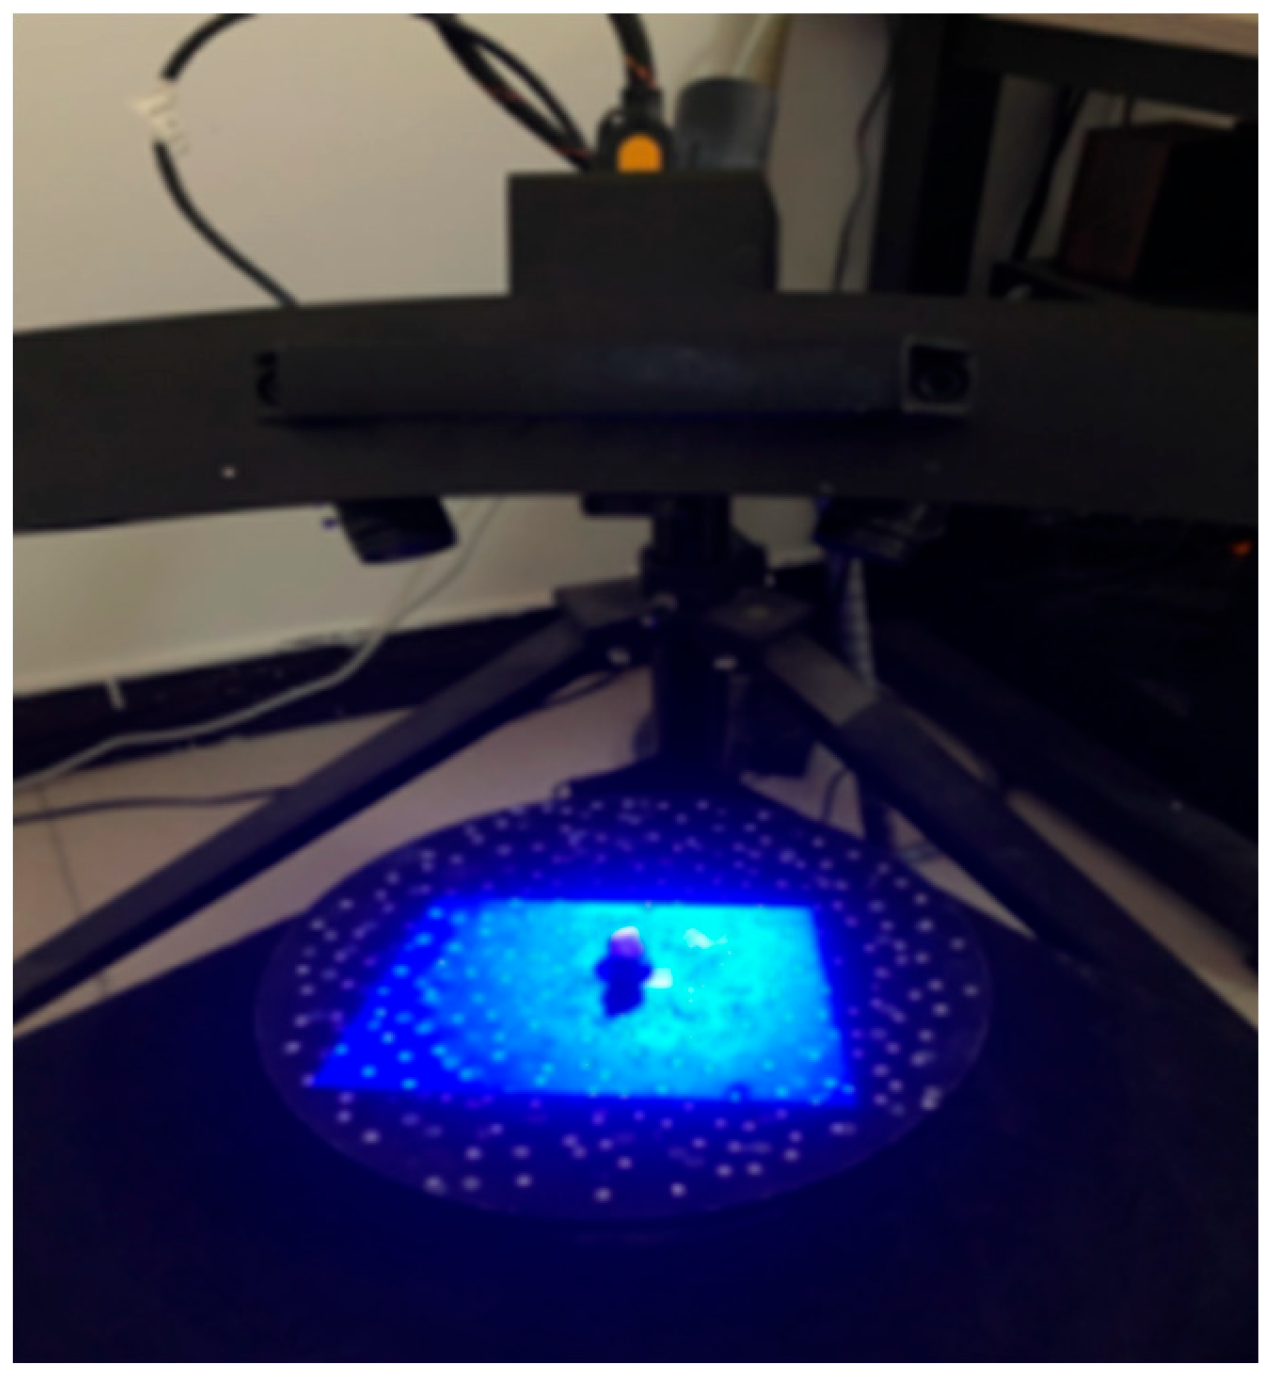
Figure 11.
Using a Binocular Blu-ray 3D Scanner to scan the aggregate processes one by one.
Figure 11.
Using a Binocular Blu-ray 3D Scanner to scan the aggregate processes one by one.
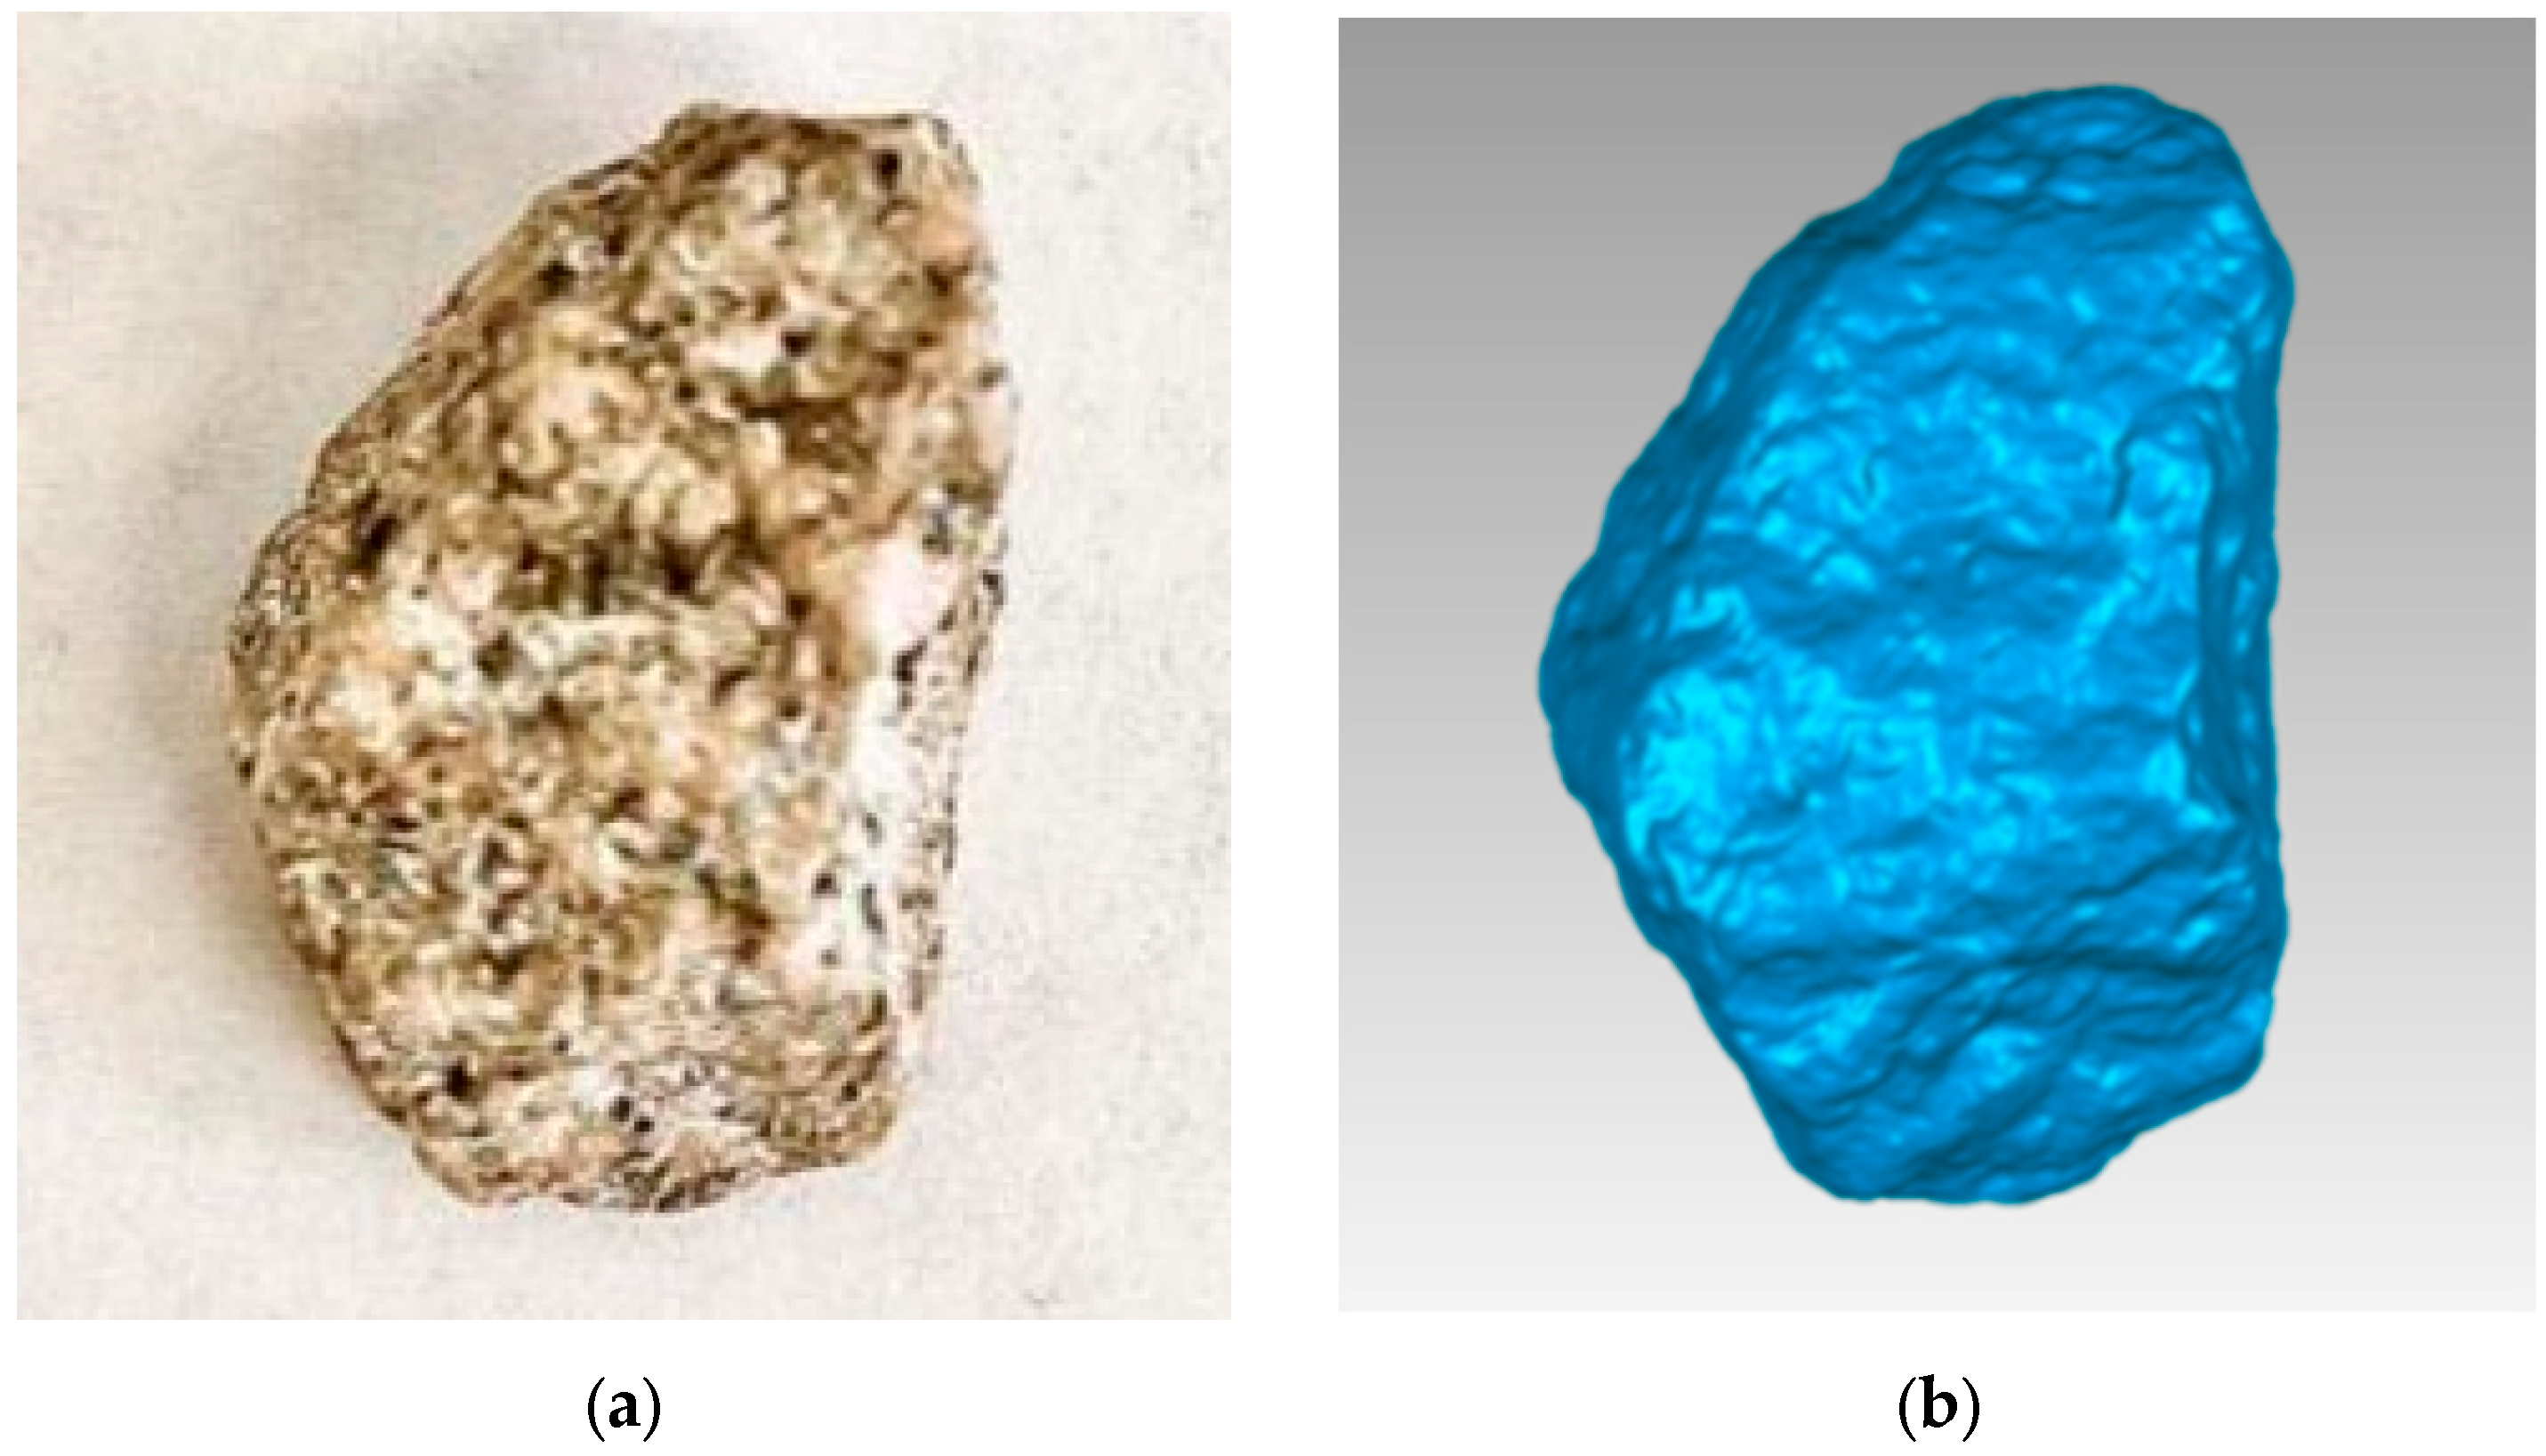
Figure 12.
(a) The true shape of the aggregate and (b) the shape of aggregate obtained from scanning.
Figure 12.
(a) The true shape of the aggregate and (b) the shape of aggregate obtained from scanning.
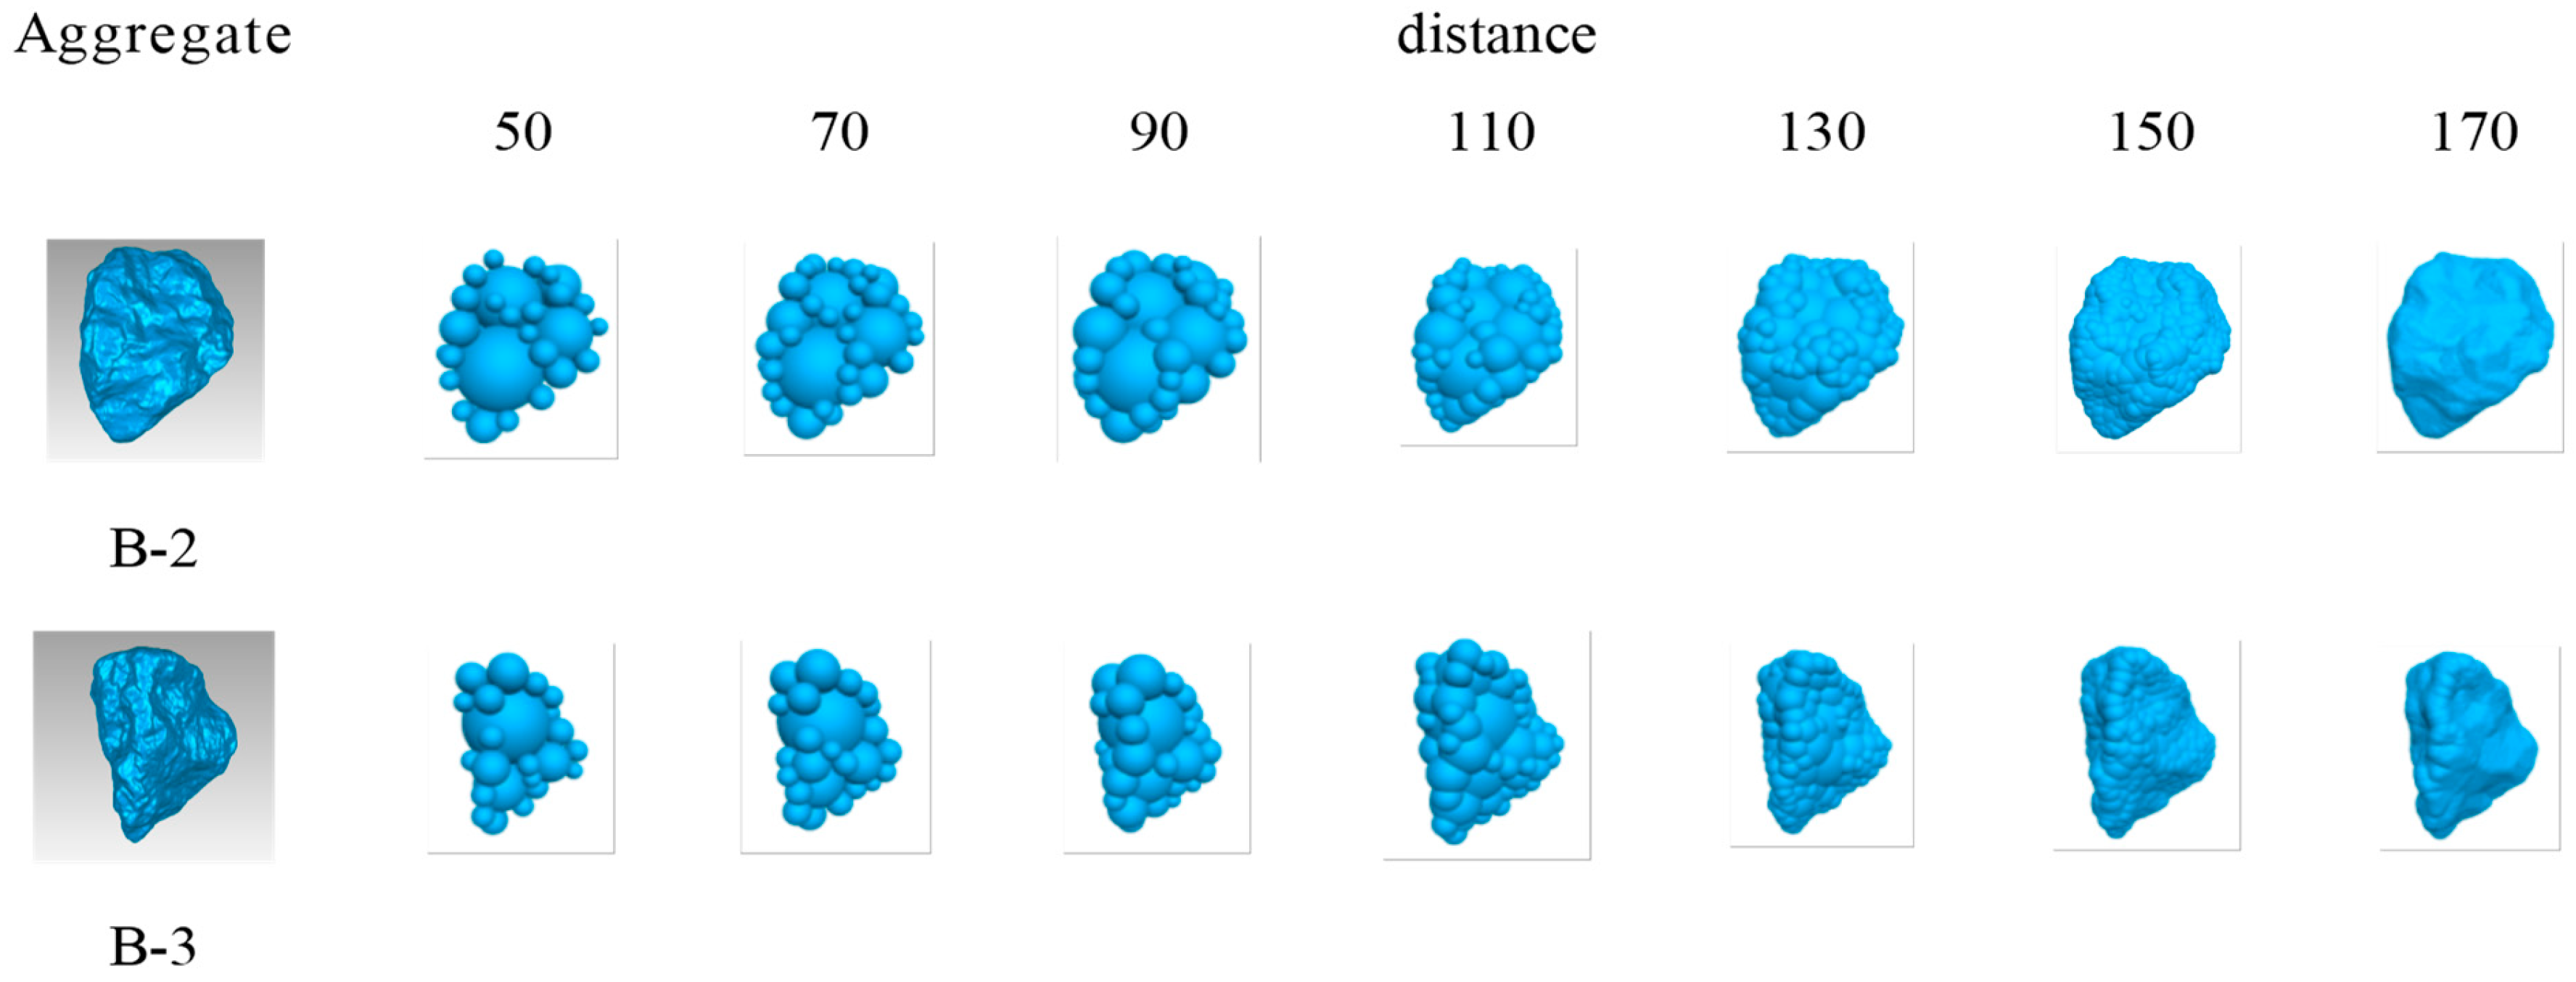
Figure 13.
Aggregate template morphology under different distance values.
Figure 13.
Aggregate template morphology under different distance values.
Figure 14.
The number of discrete elements of aggregate under different distance values.
Figure 14.
The number of discrete elements of aggregate under different distance values.
Figure 15.
Cluster template morphology under different ratio values.
Figure 15.
Cluster template morphology under different ratio values.
Figure 16.
The number of discrete in the cluster template with ratio.
Figure 16.
The number of discrete in the cluster template with ratio.
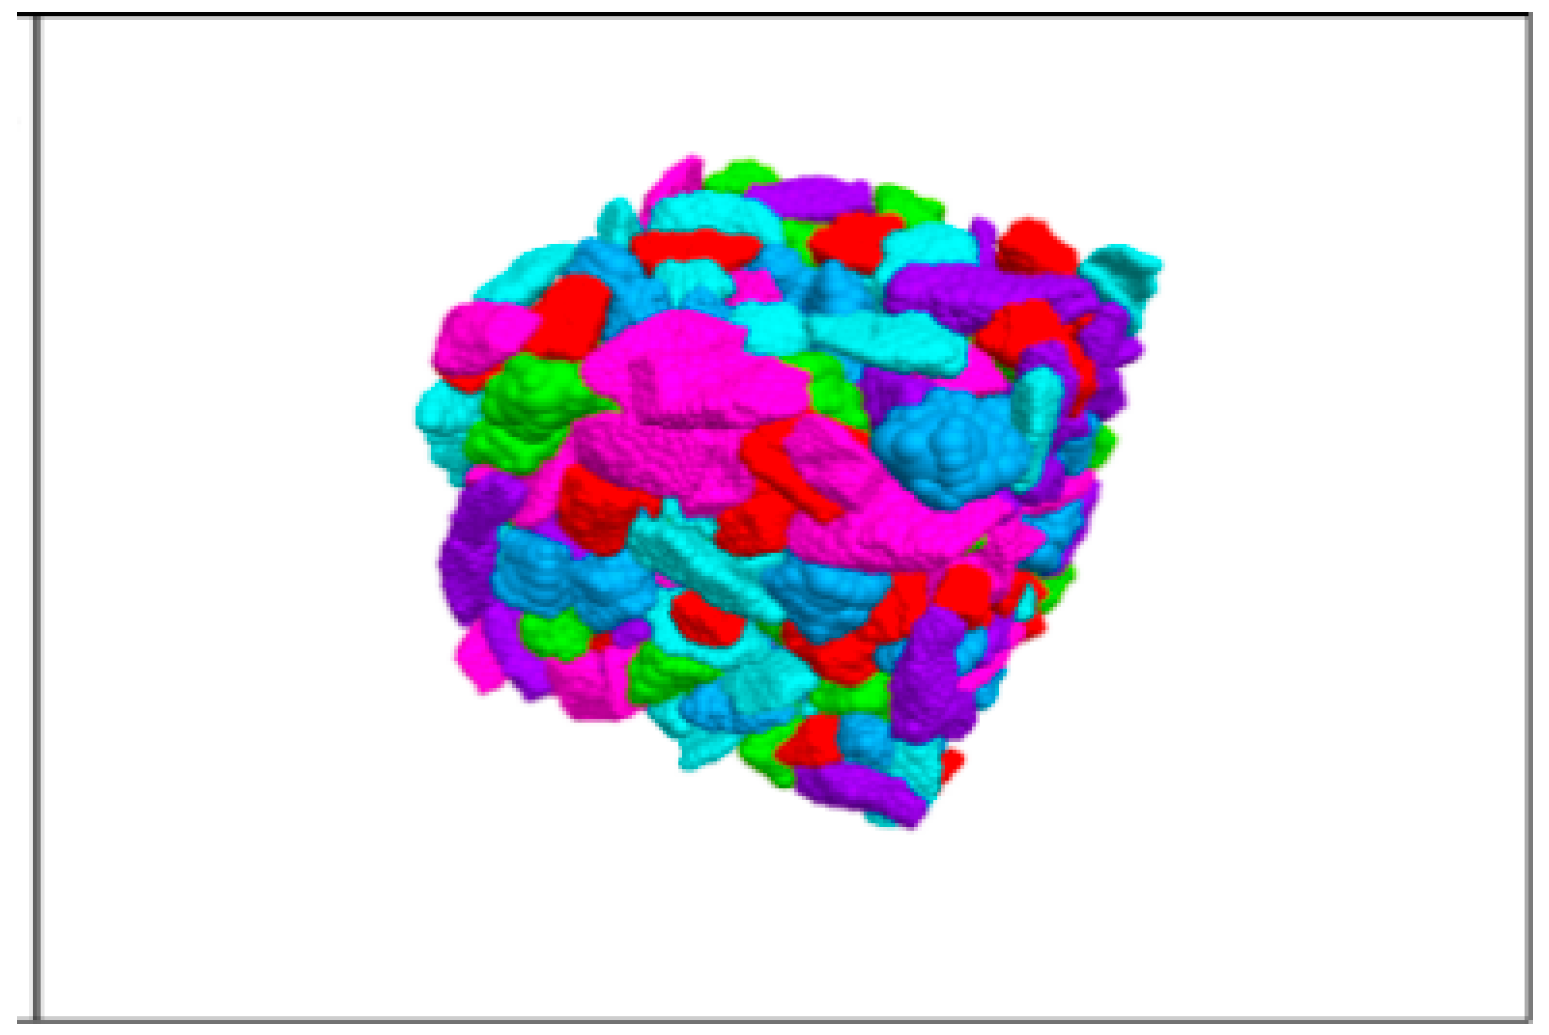
Figure 17.
Aggregate clusters with a 5–10 mm diameter generated by using the clump generate command.
Figure 17.
Aggregate clusters with a 5–10 mm diameter generated by using the clump generate command.
Figure 18.
Aggregate falling process: (a) the aggregate began to fall, (b) in the process of aggregate falling, and (c) the aggregate reaches a stable state.
Figure 18.
Aggregate falling process: (a) the aggregate began to fall, (b) in the process of aggregate falling, and (c) the aggregate reaches a stable state.
Figure 19.
Aggregate compaction process: (a) before compaction and (b) after compaction.
Figure 19.
Aggregate compaction process: (a) before compaction and (b) after compaction.
Figure 20.
Compacted cube test block.
Figure 20.
Compacted cube test block.
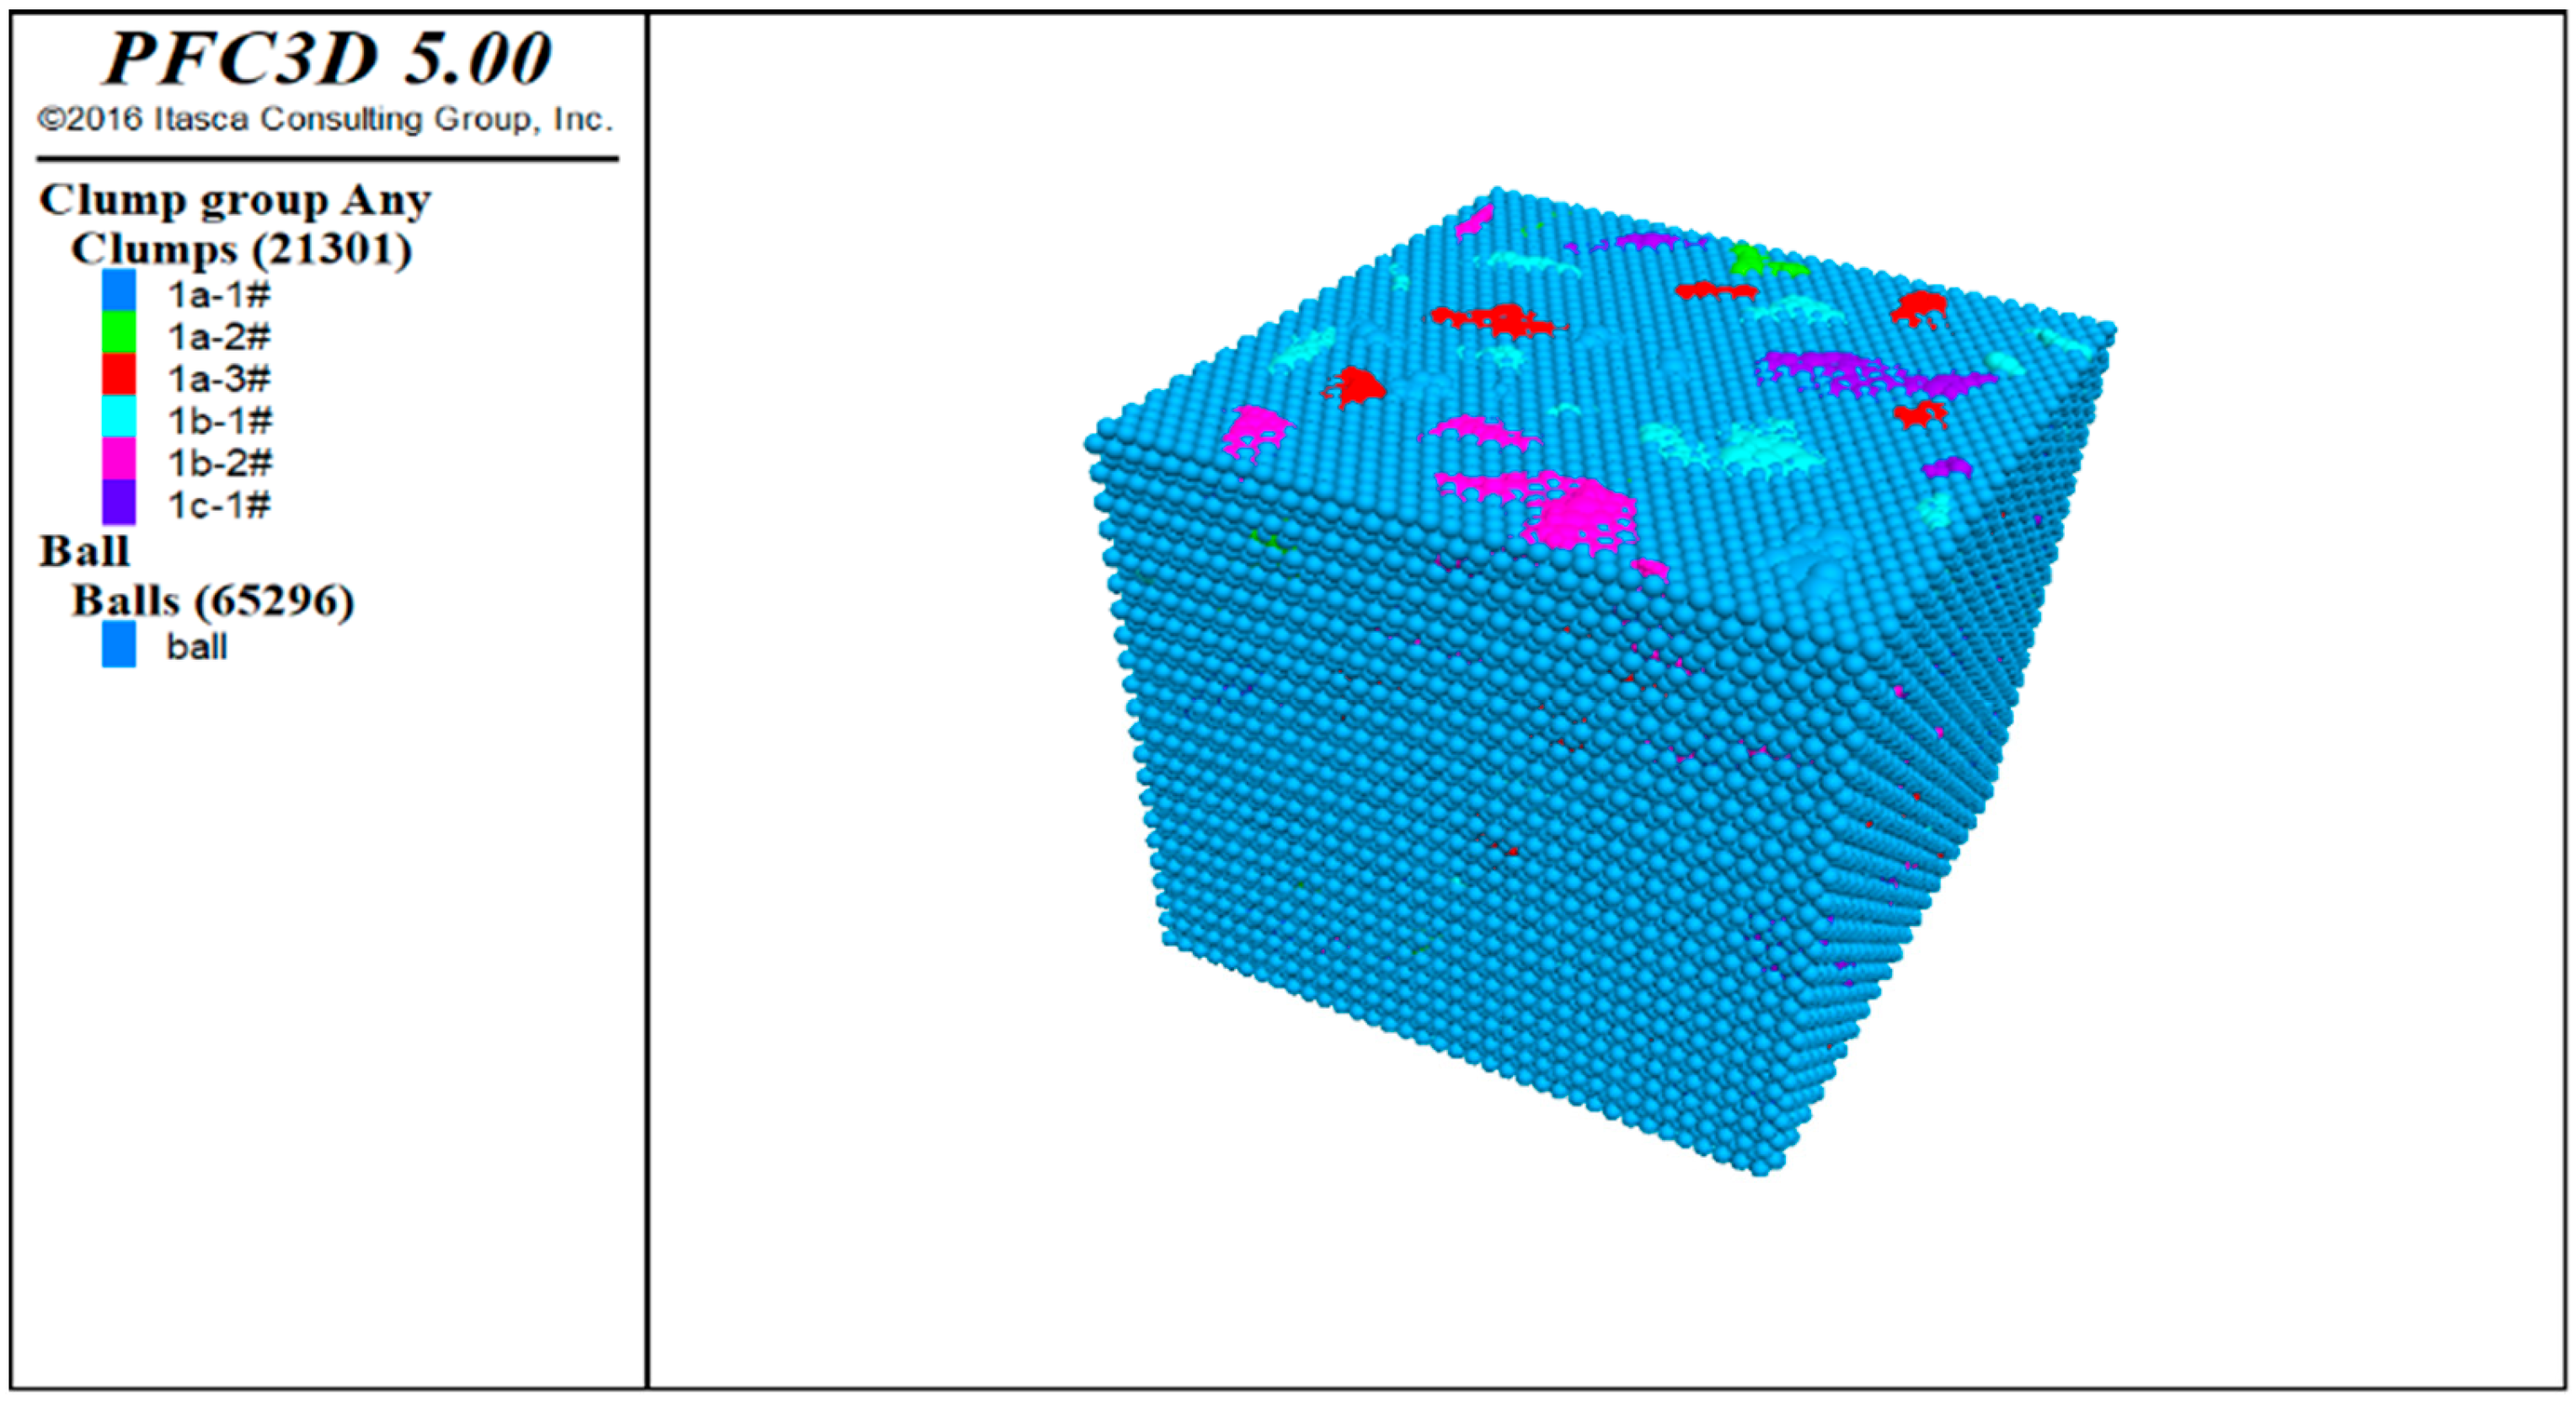
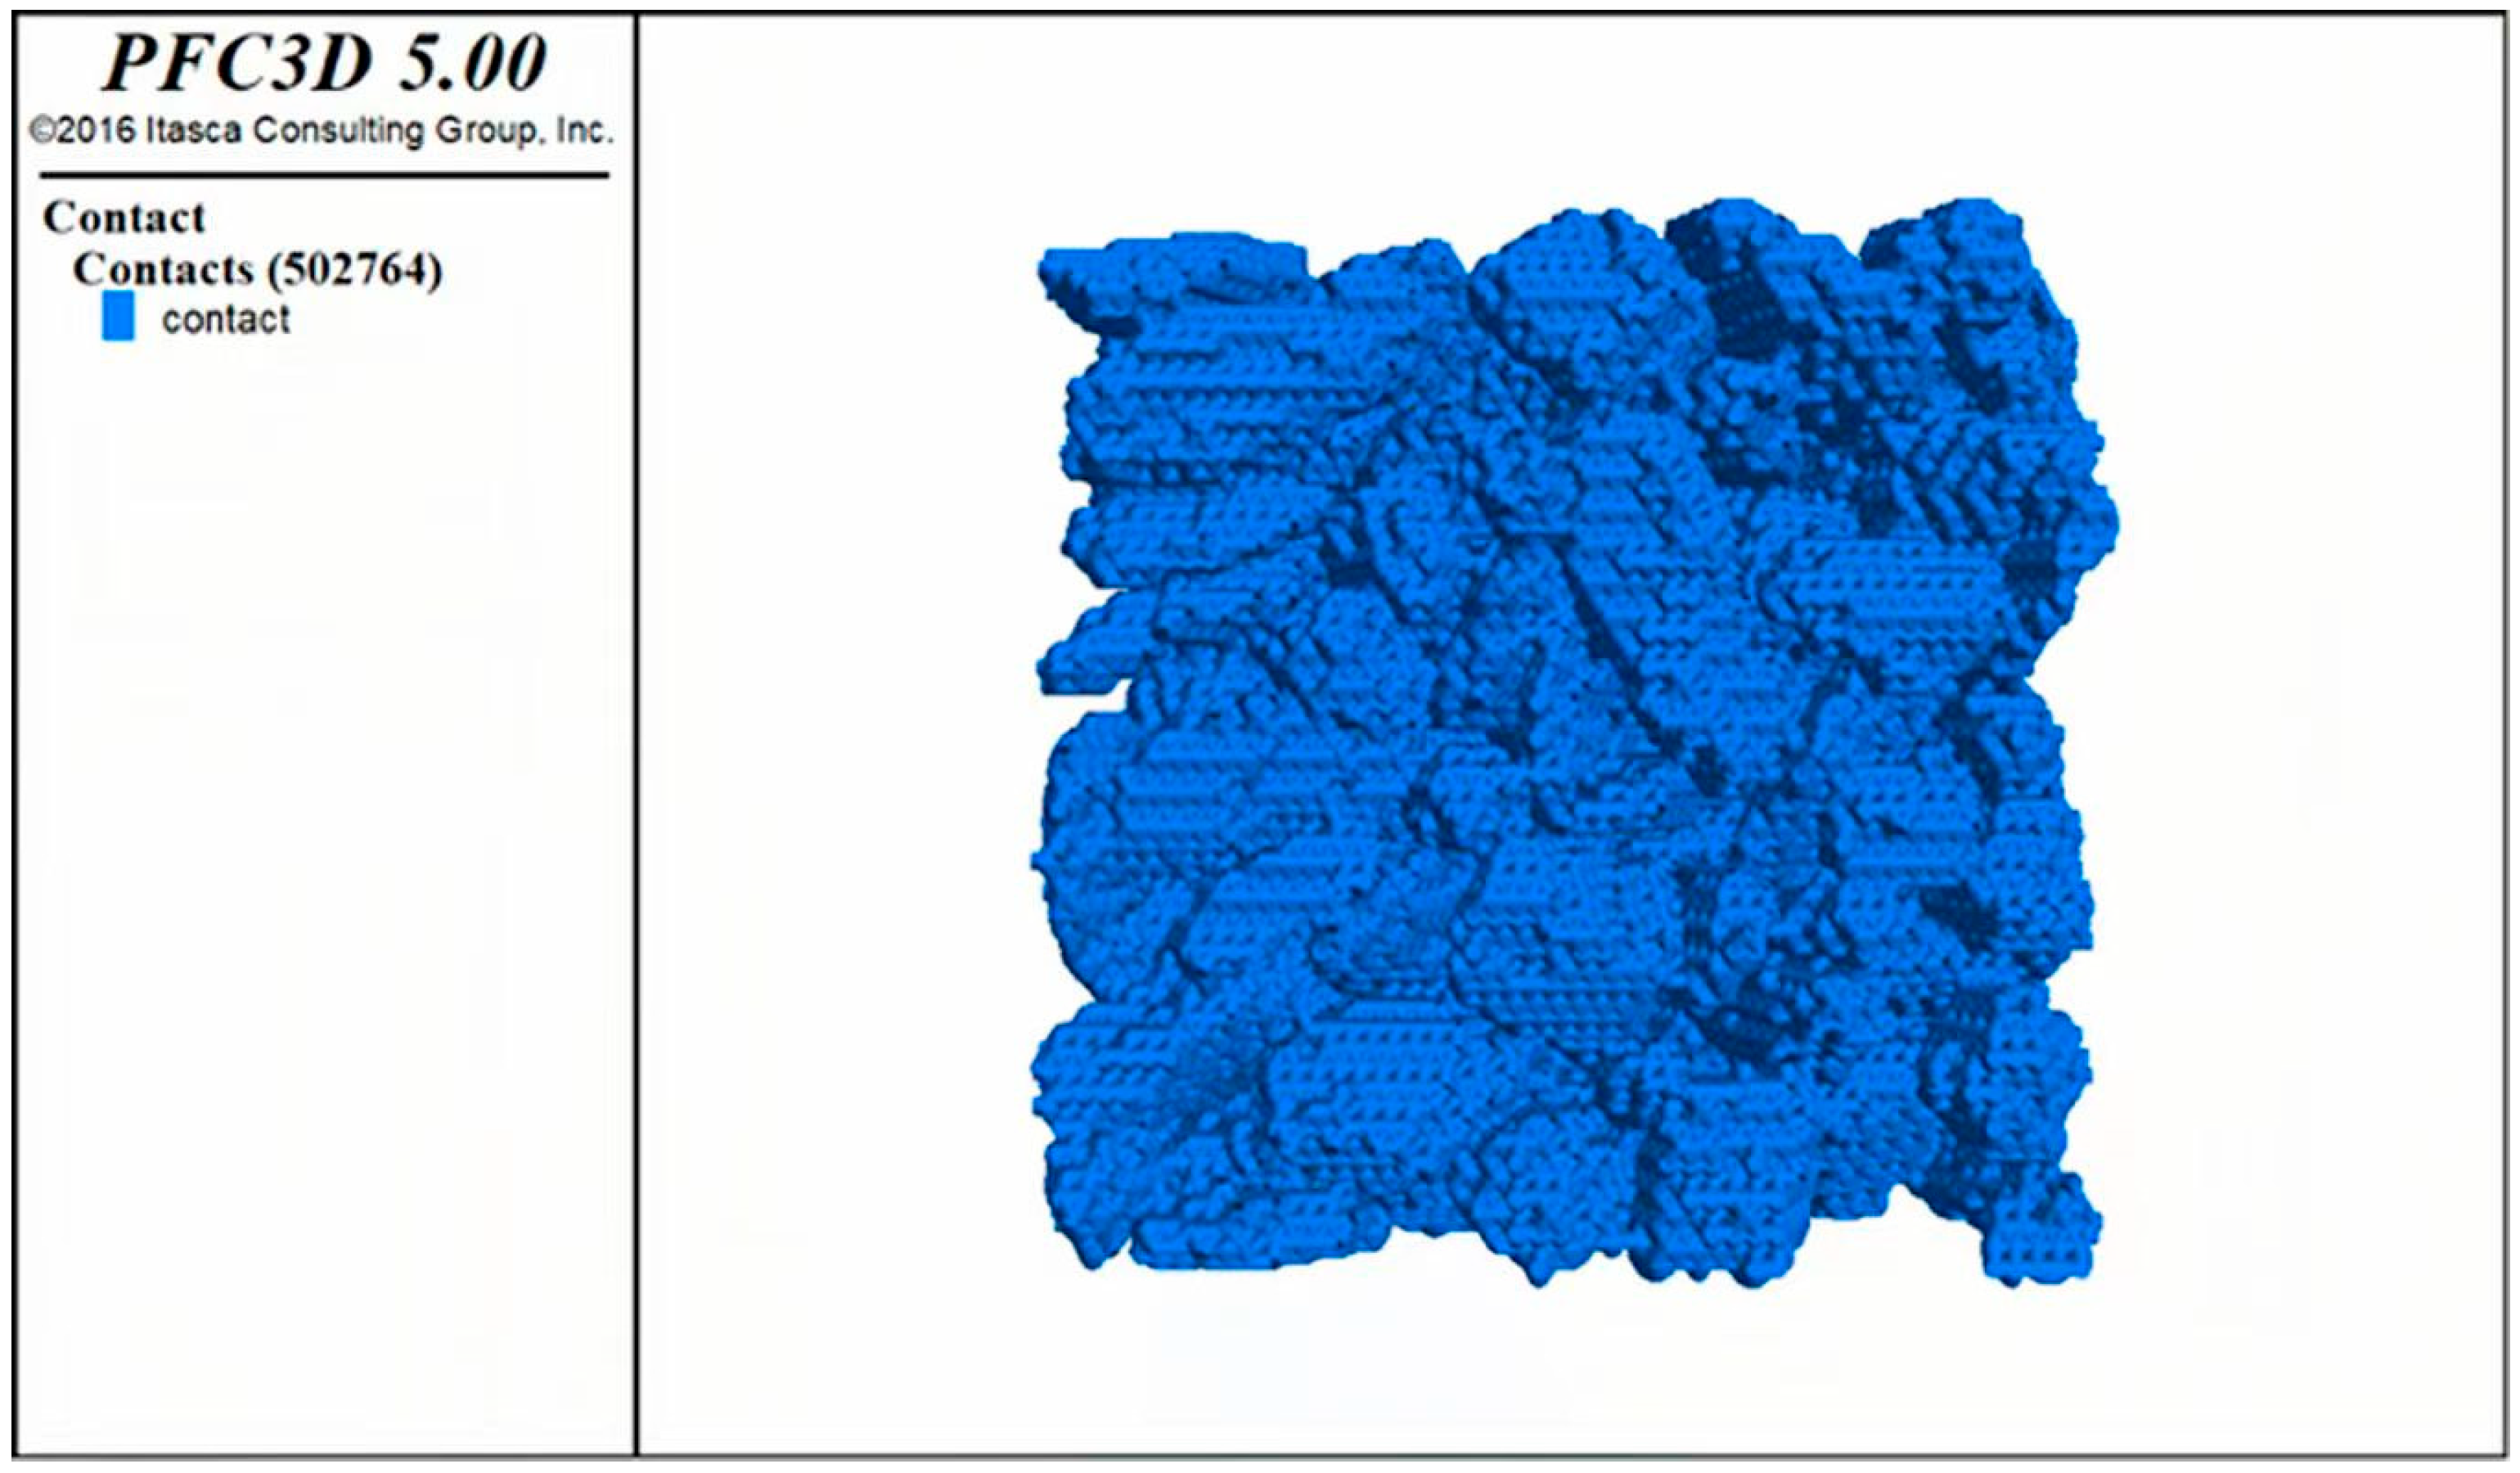
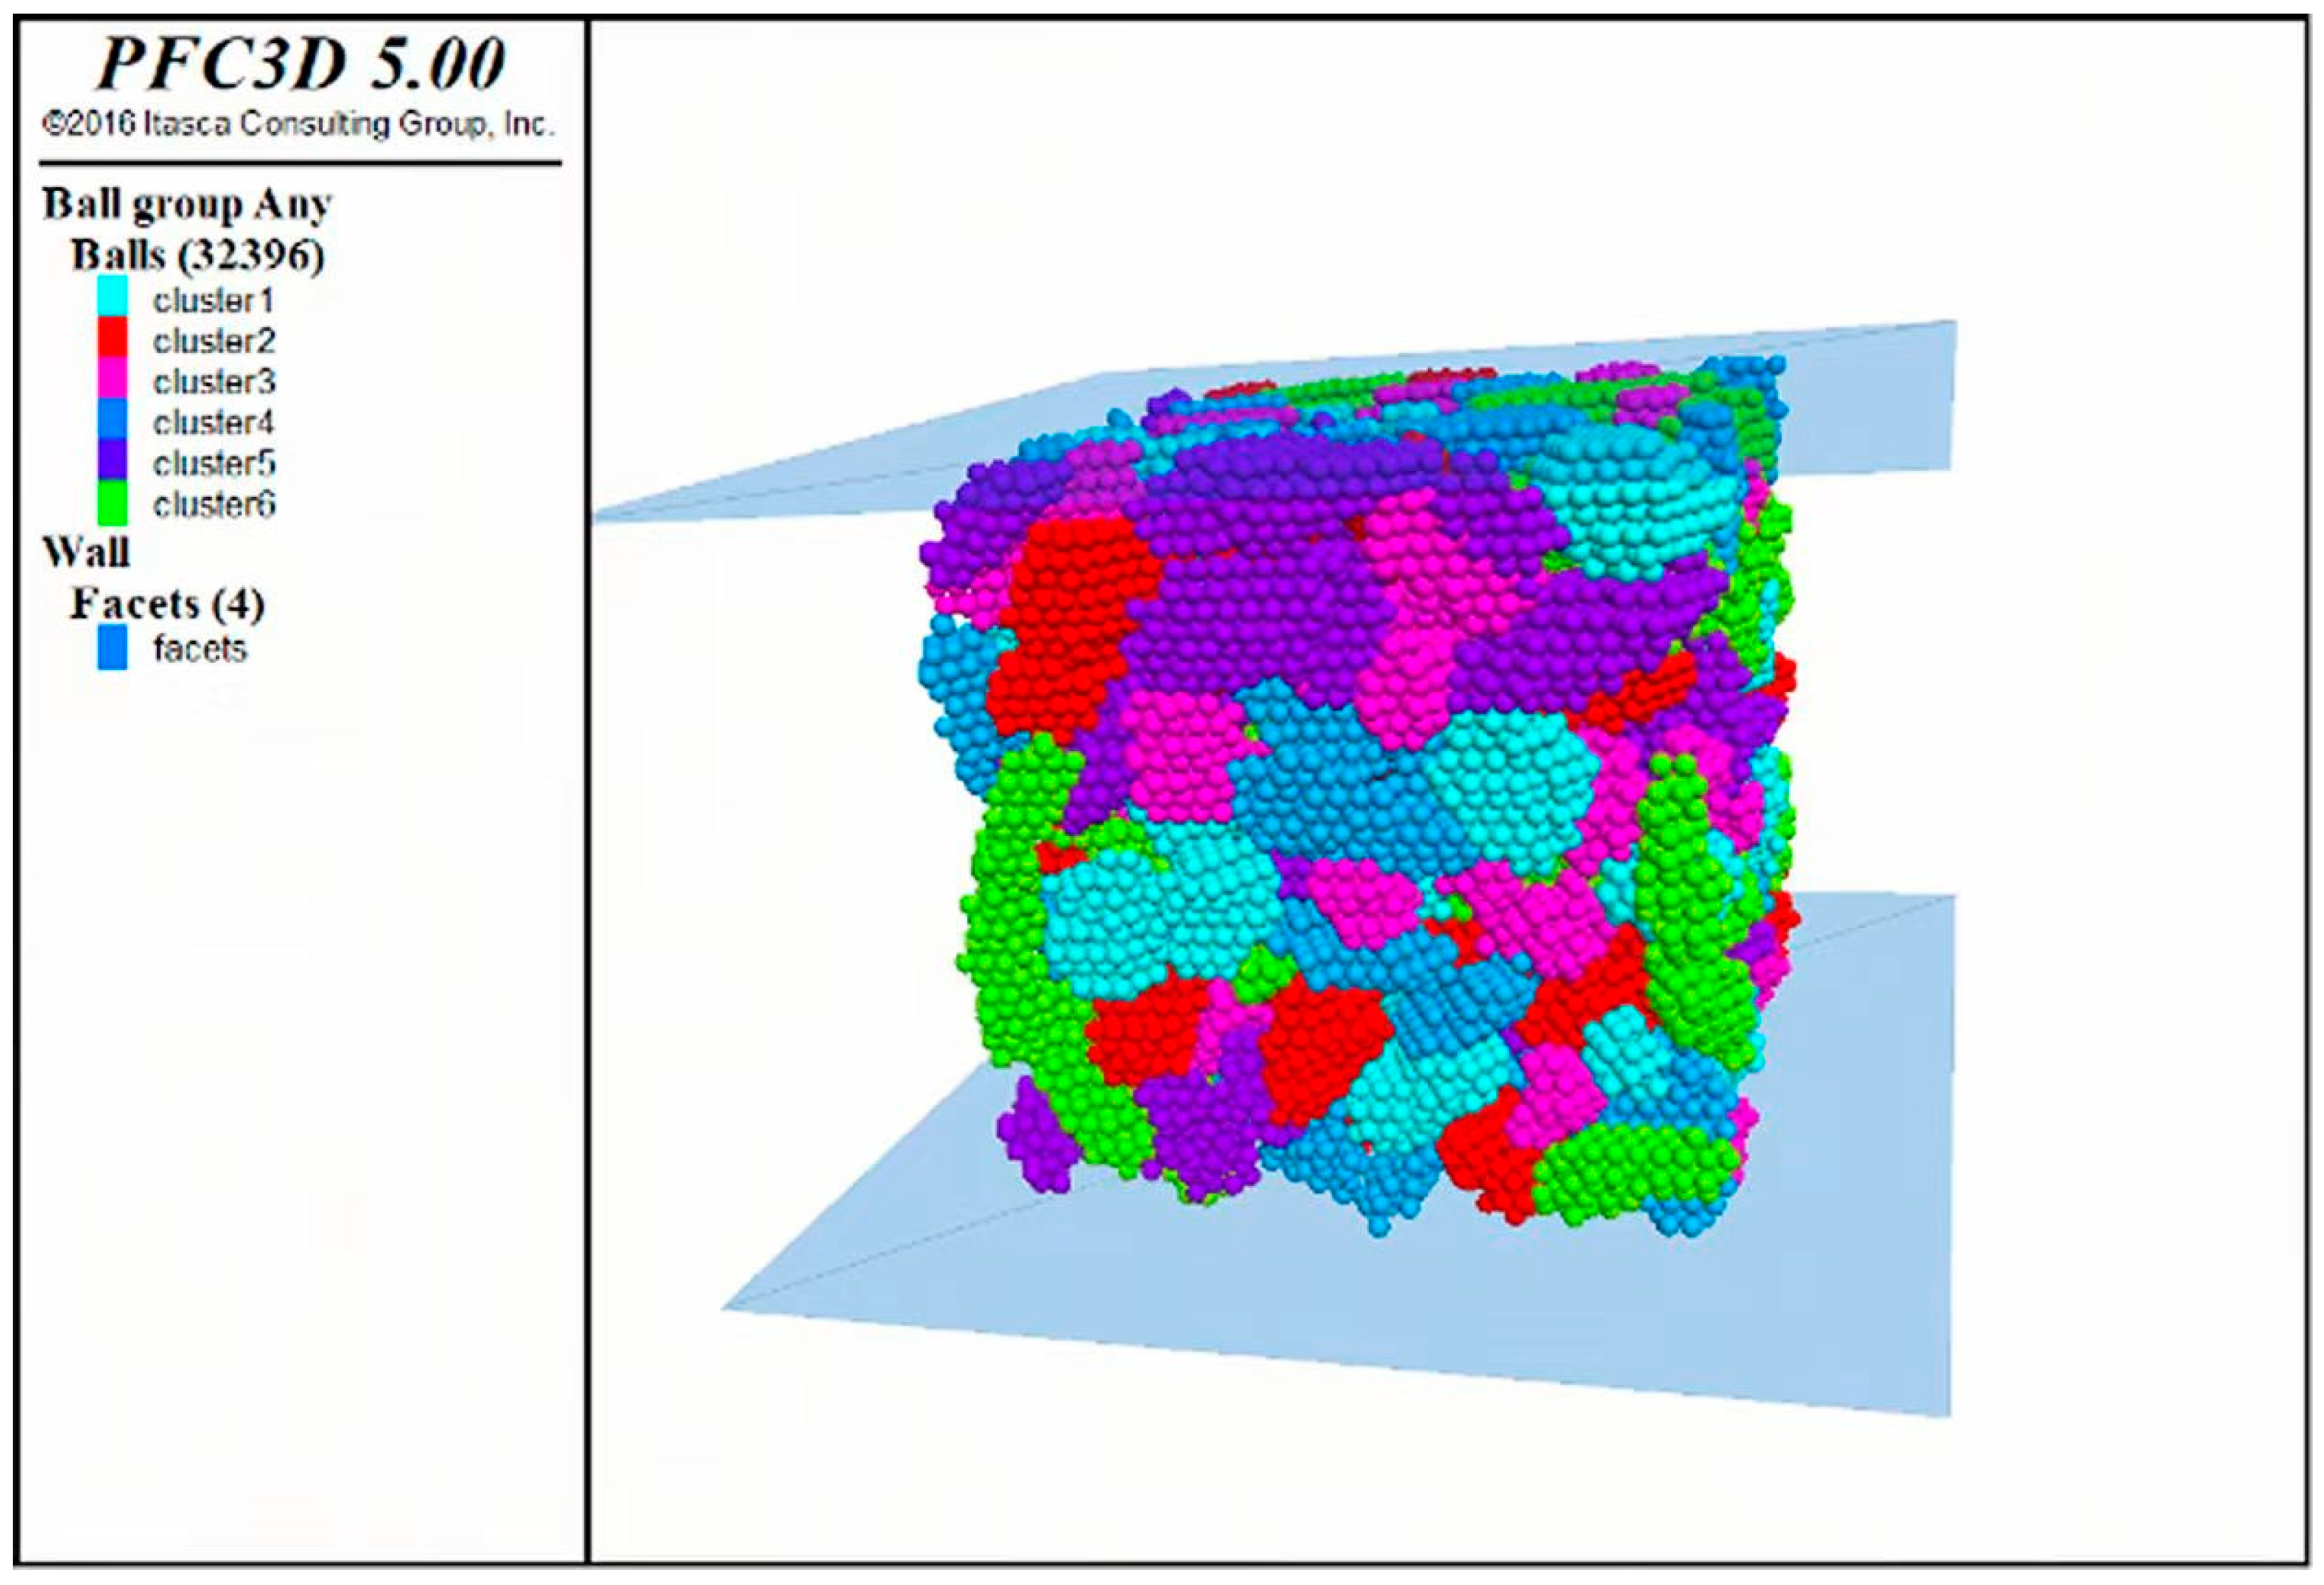
Figure 21.
Discrete element particles and aggregate clusters generated by the ball generate command.
Figure 21.
Discrete element particles and aggregate clusters generated by the ball generate command.
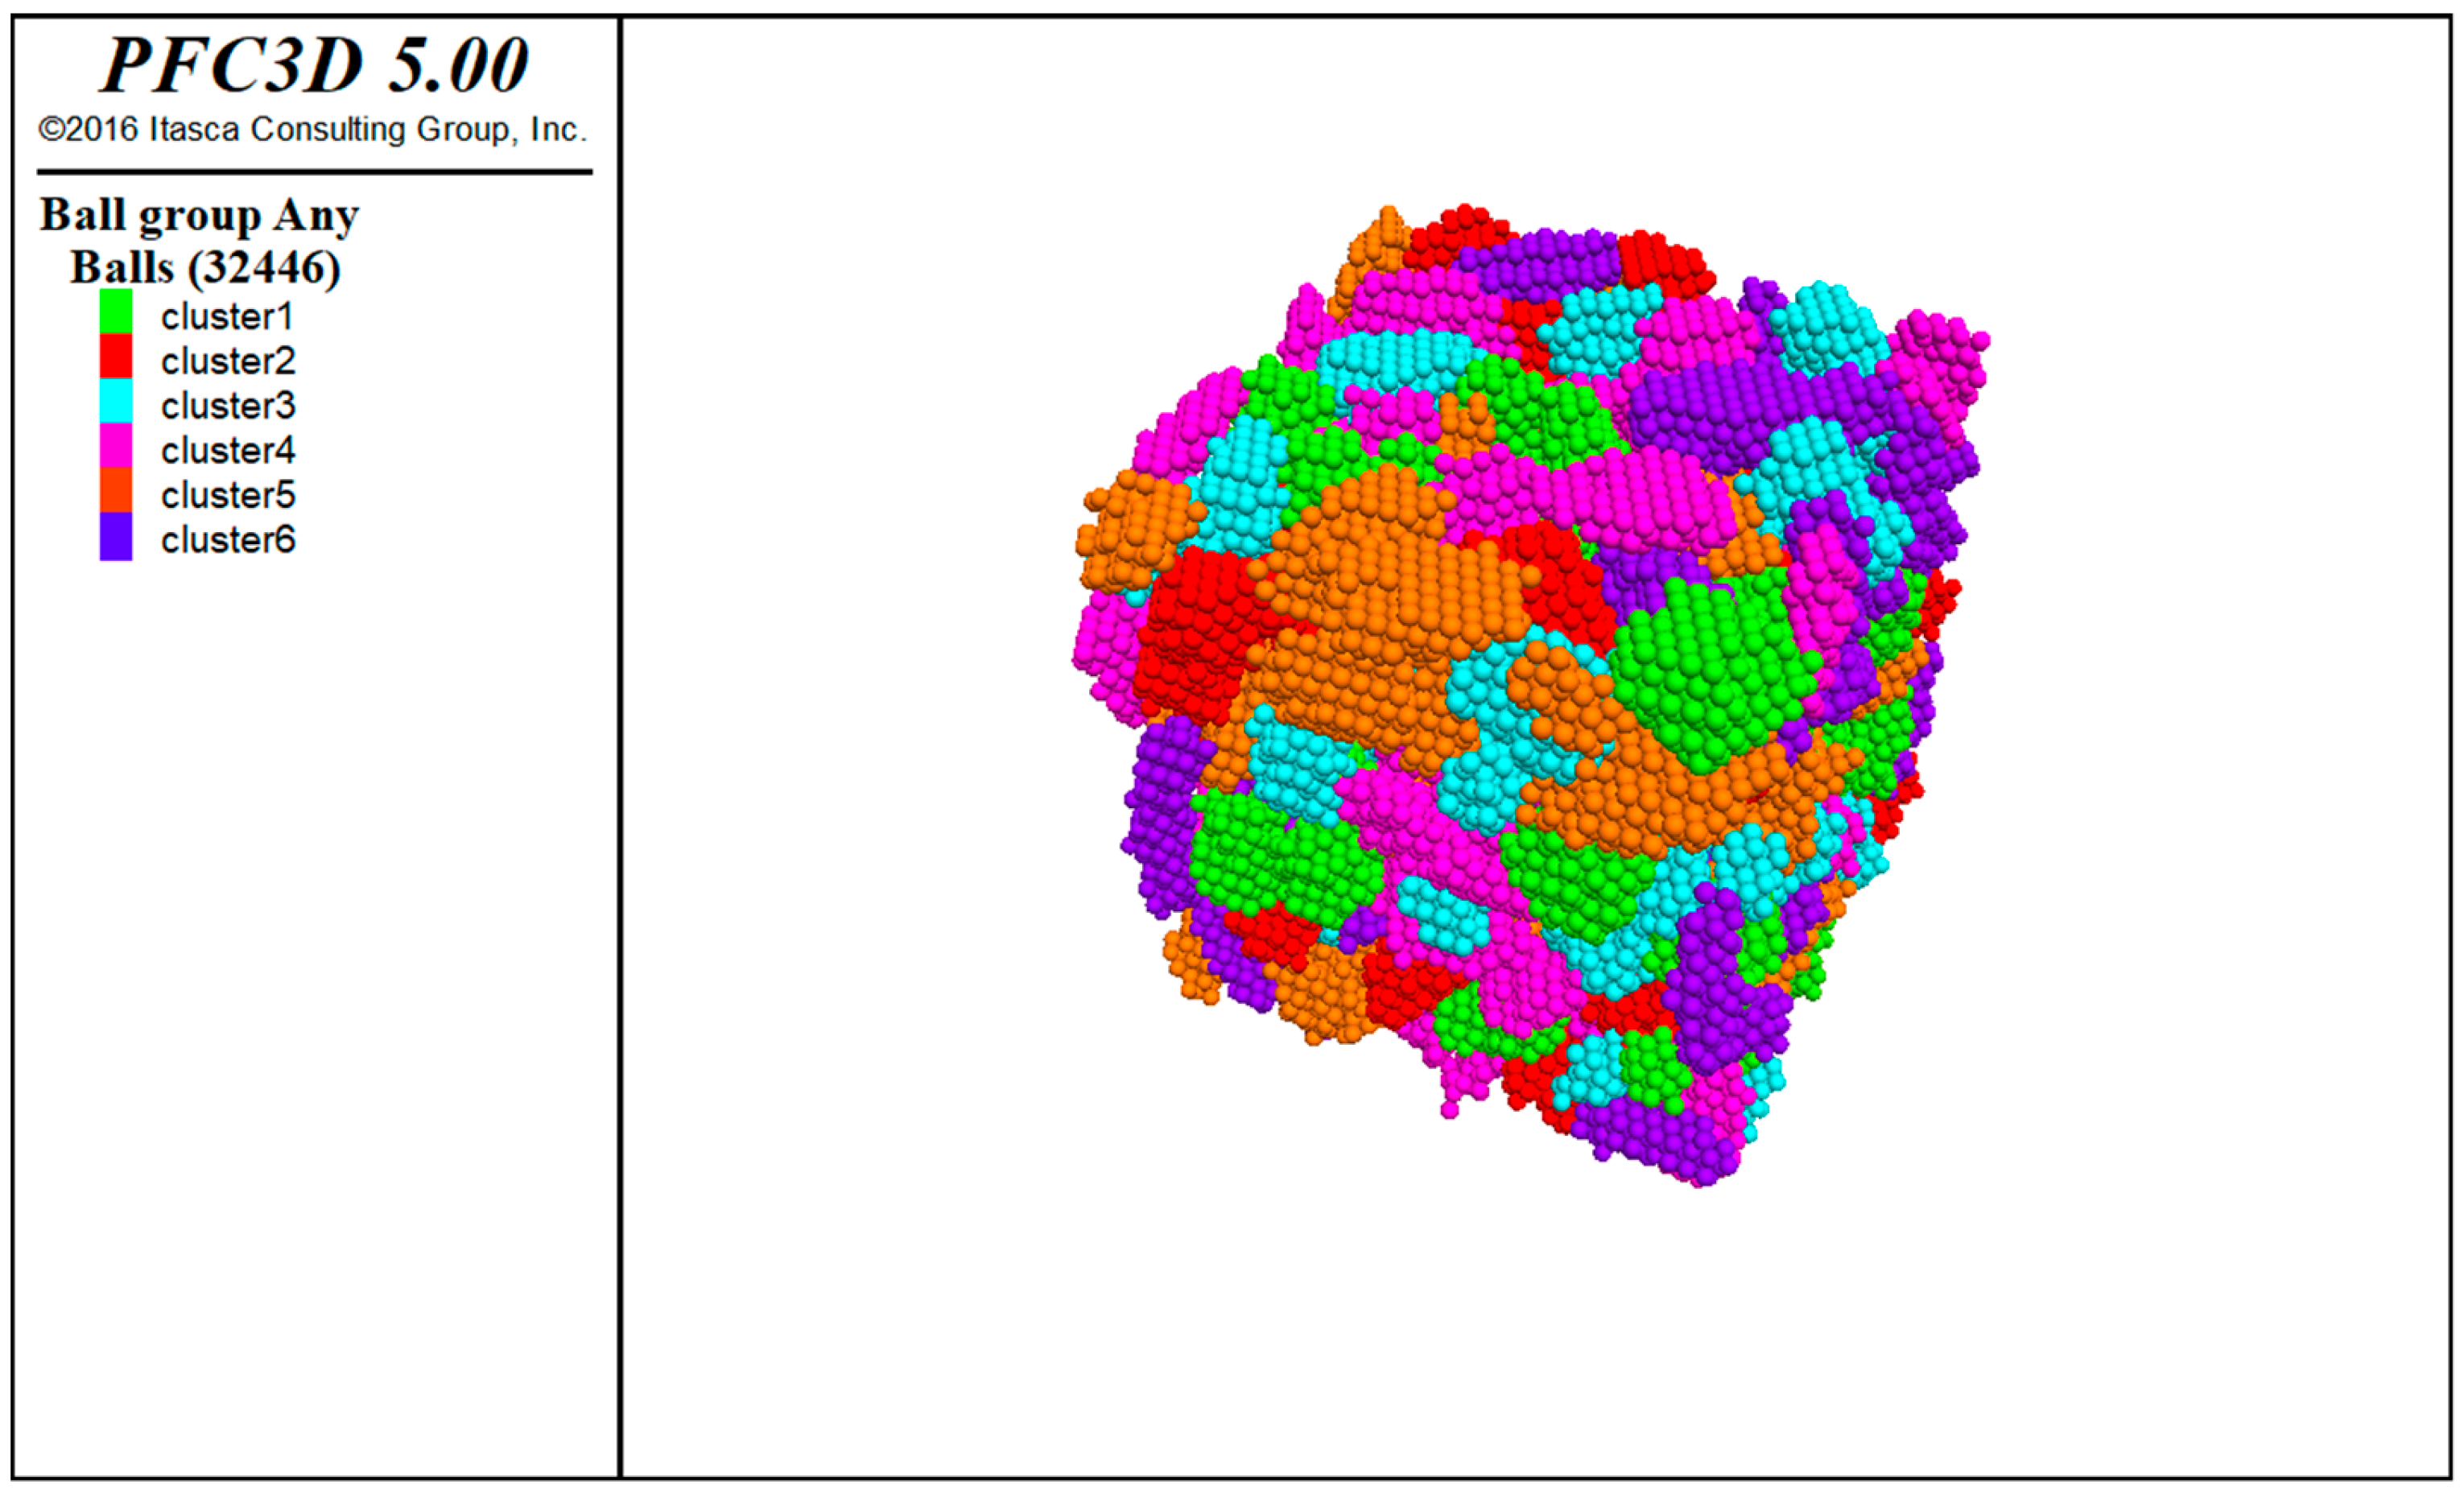
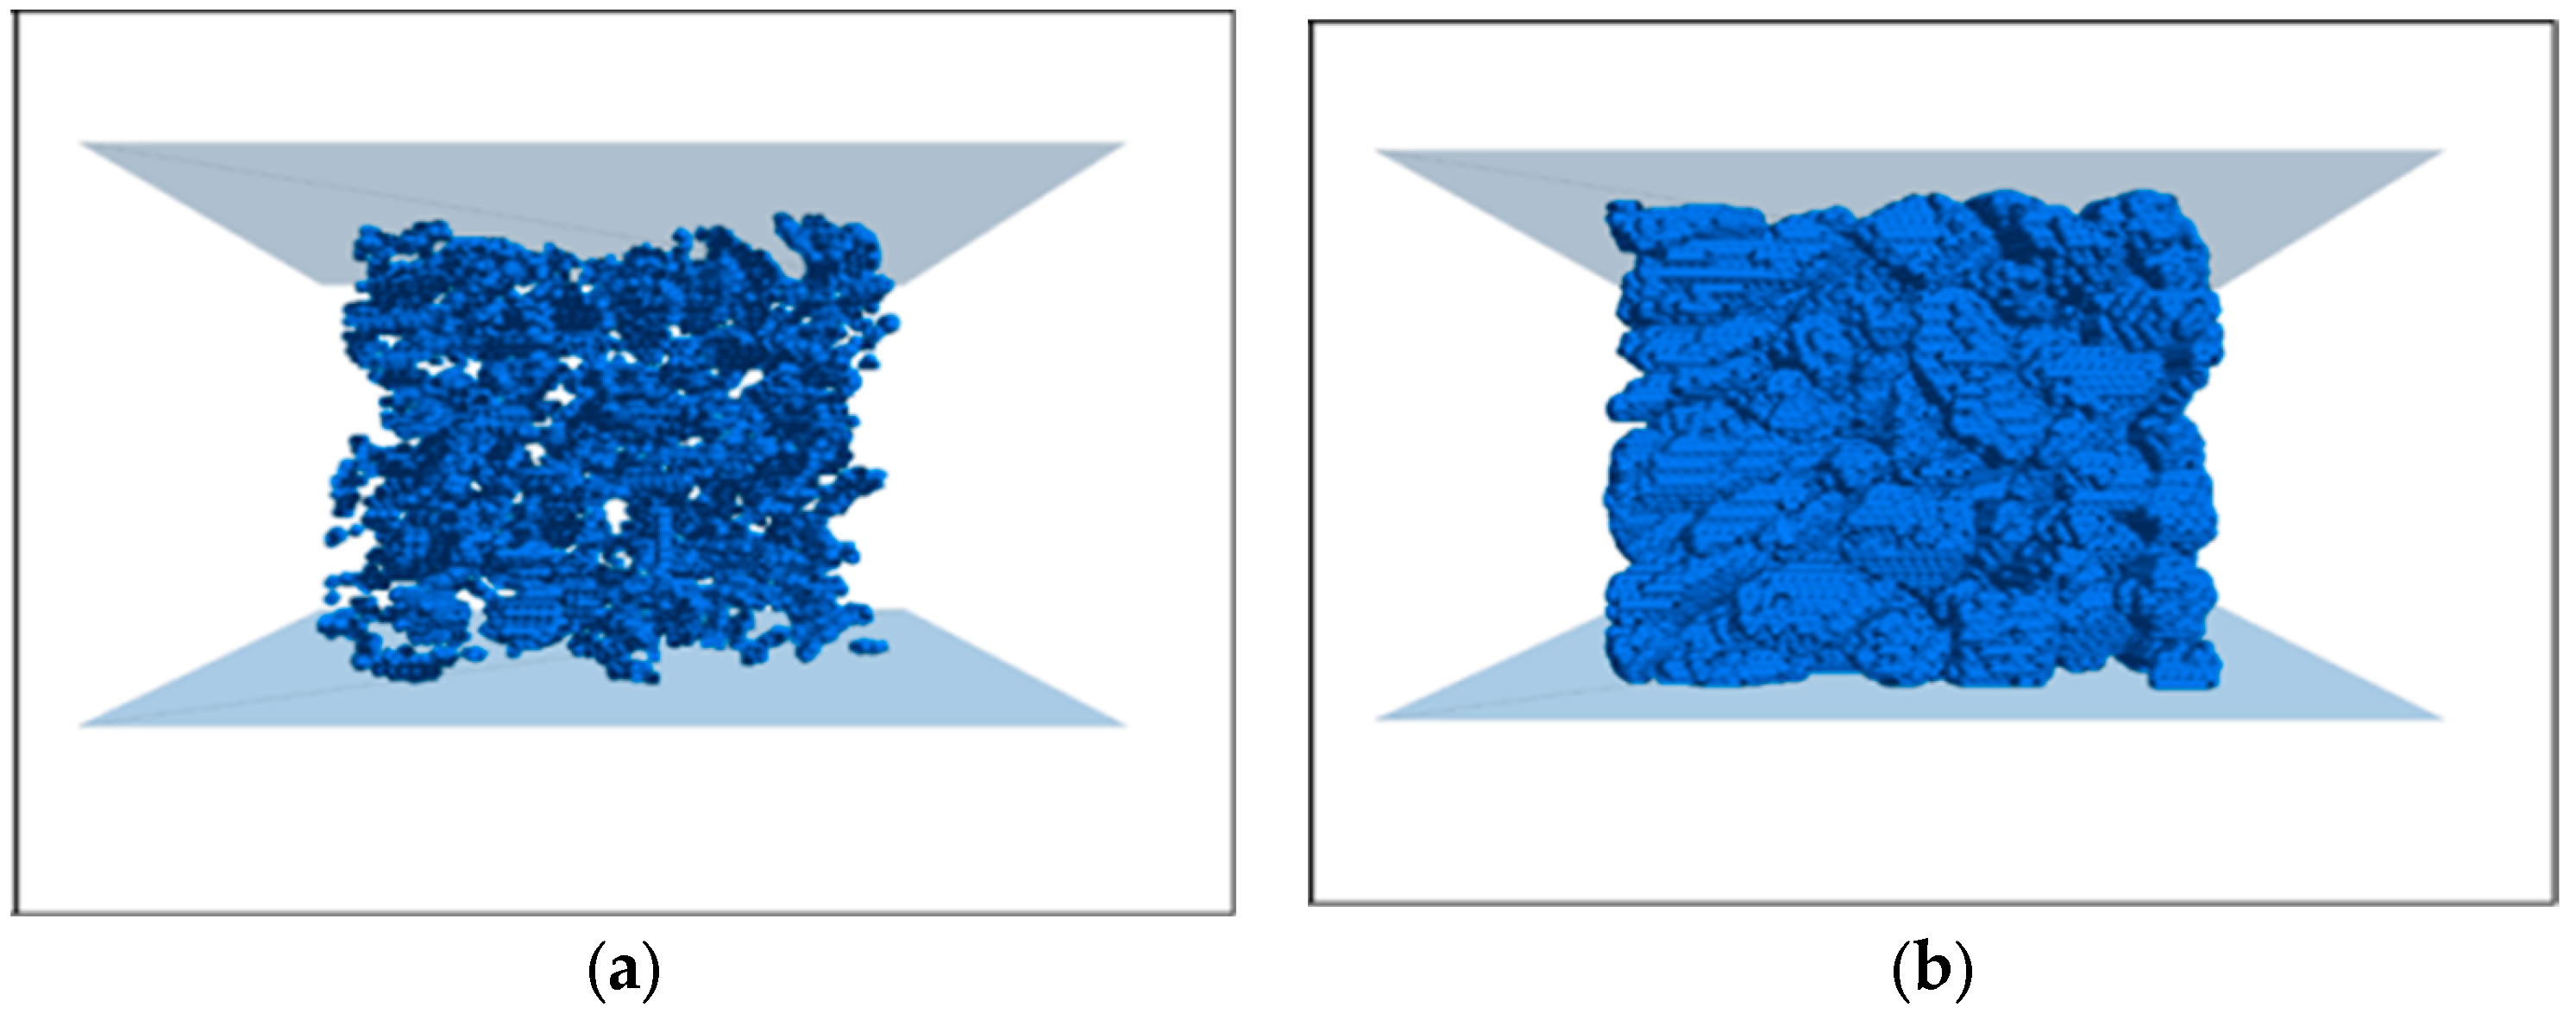
Figure 22.
Using FISH programming language to replace aggregate rigid clusters with flexible aggregate clusters.
Figure 22.
Using FISH programming language to replace aggregate rigid clusters with flexible aggregate clusters.
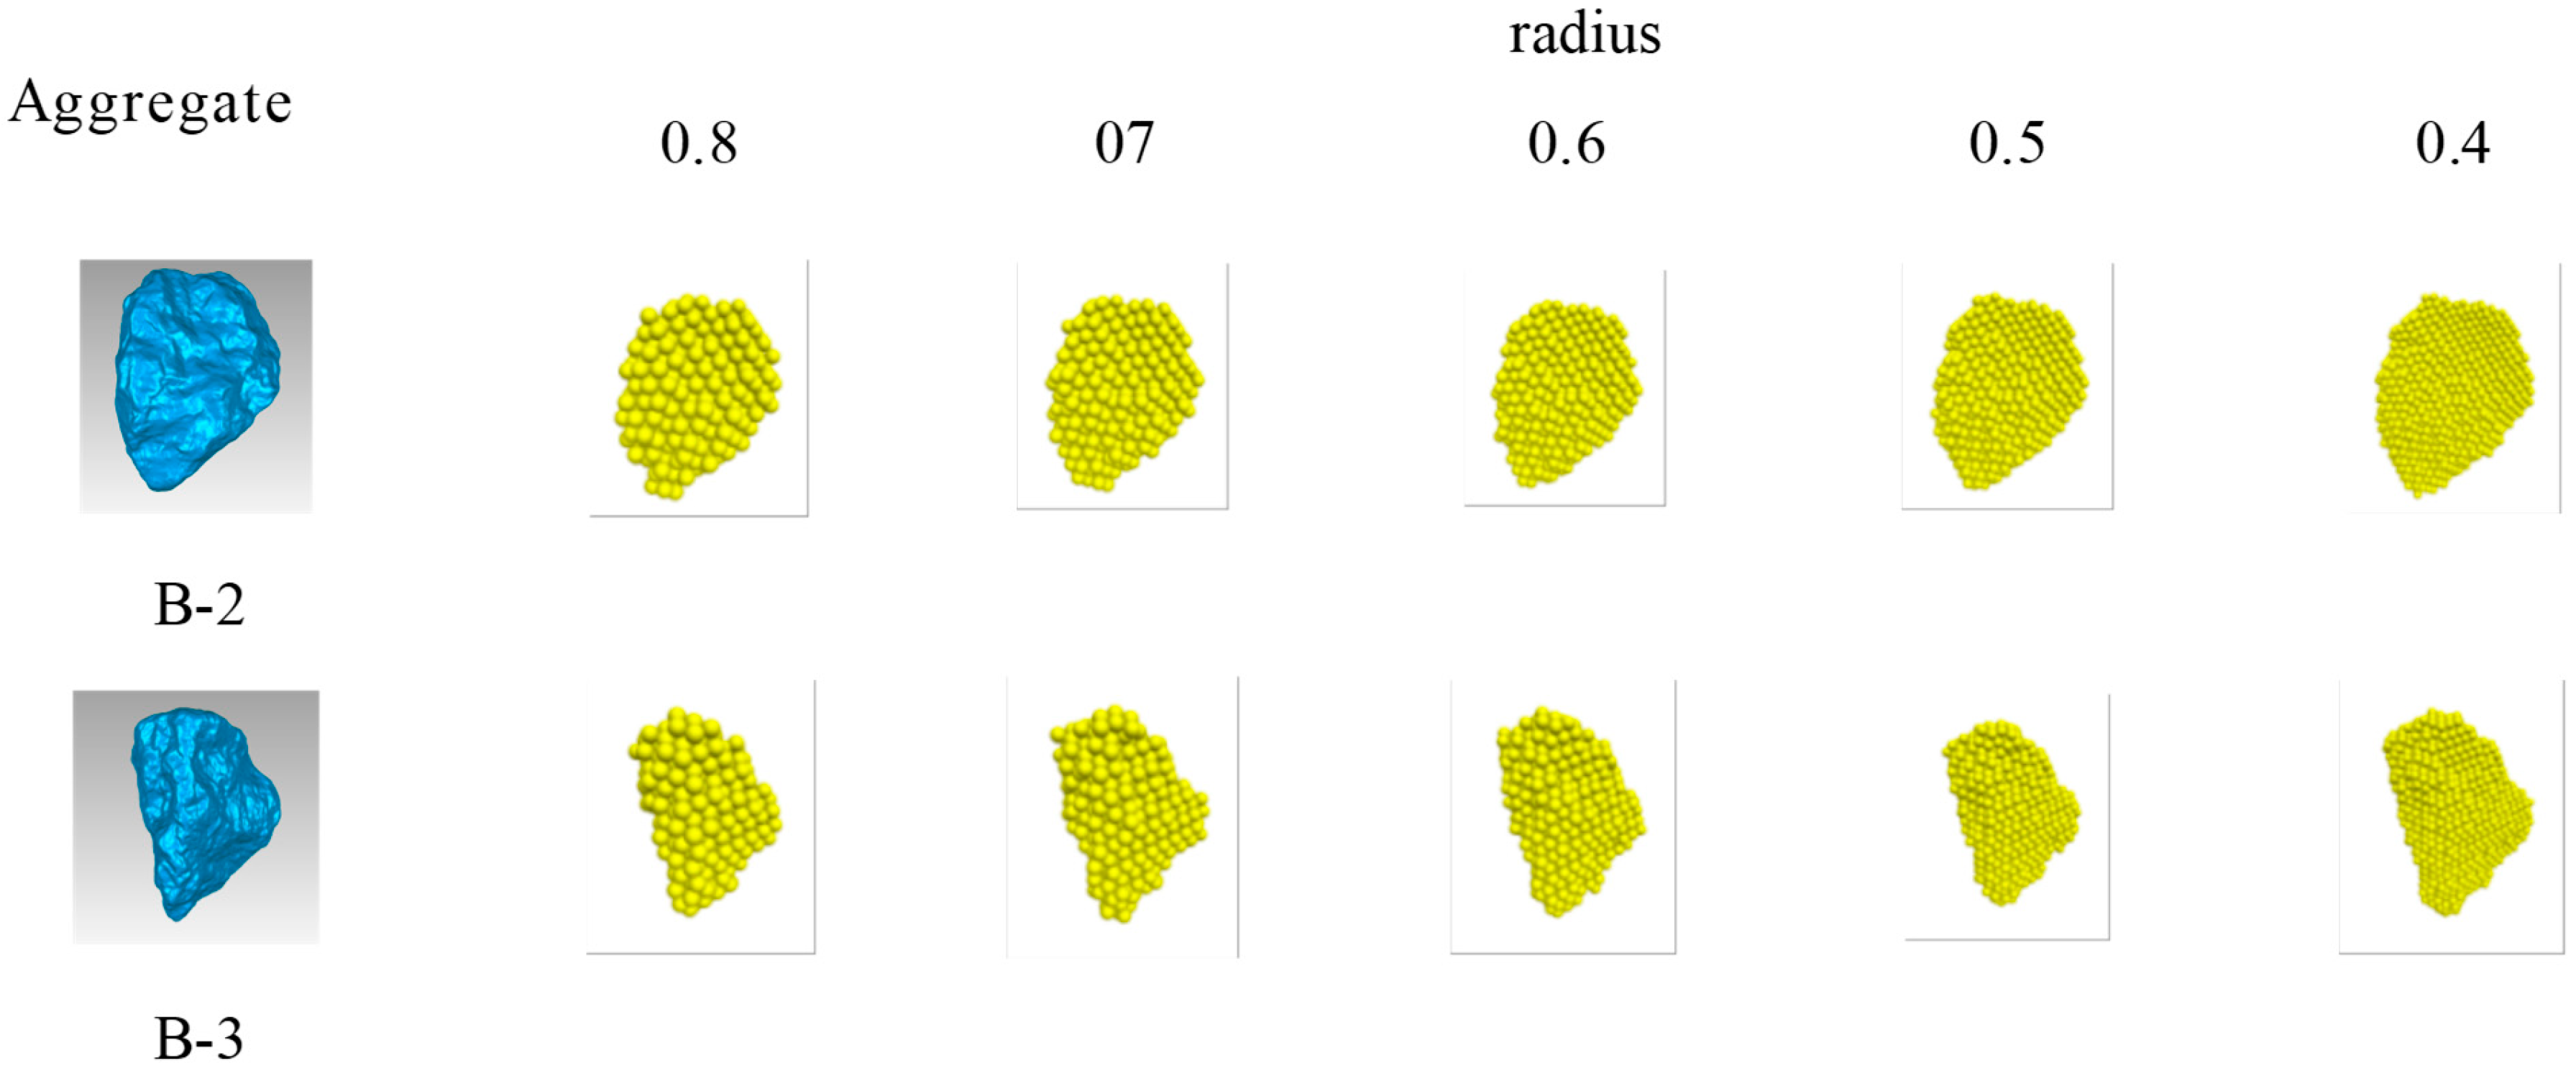
Figure 23.
Morphology of flexible aggregate clusters under different radius values.
Figure 23.
Morphology of flexible aggregate clusters under different radius values.
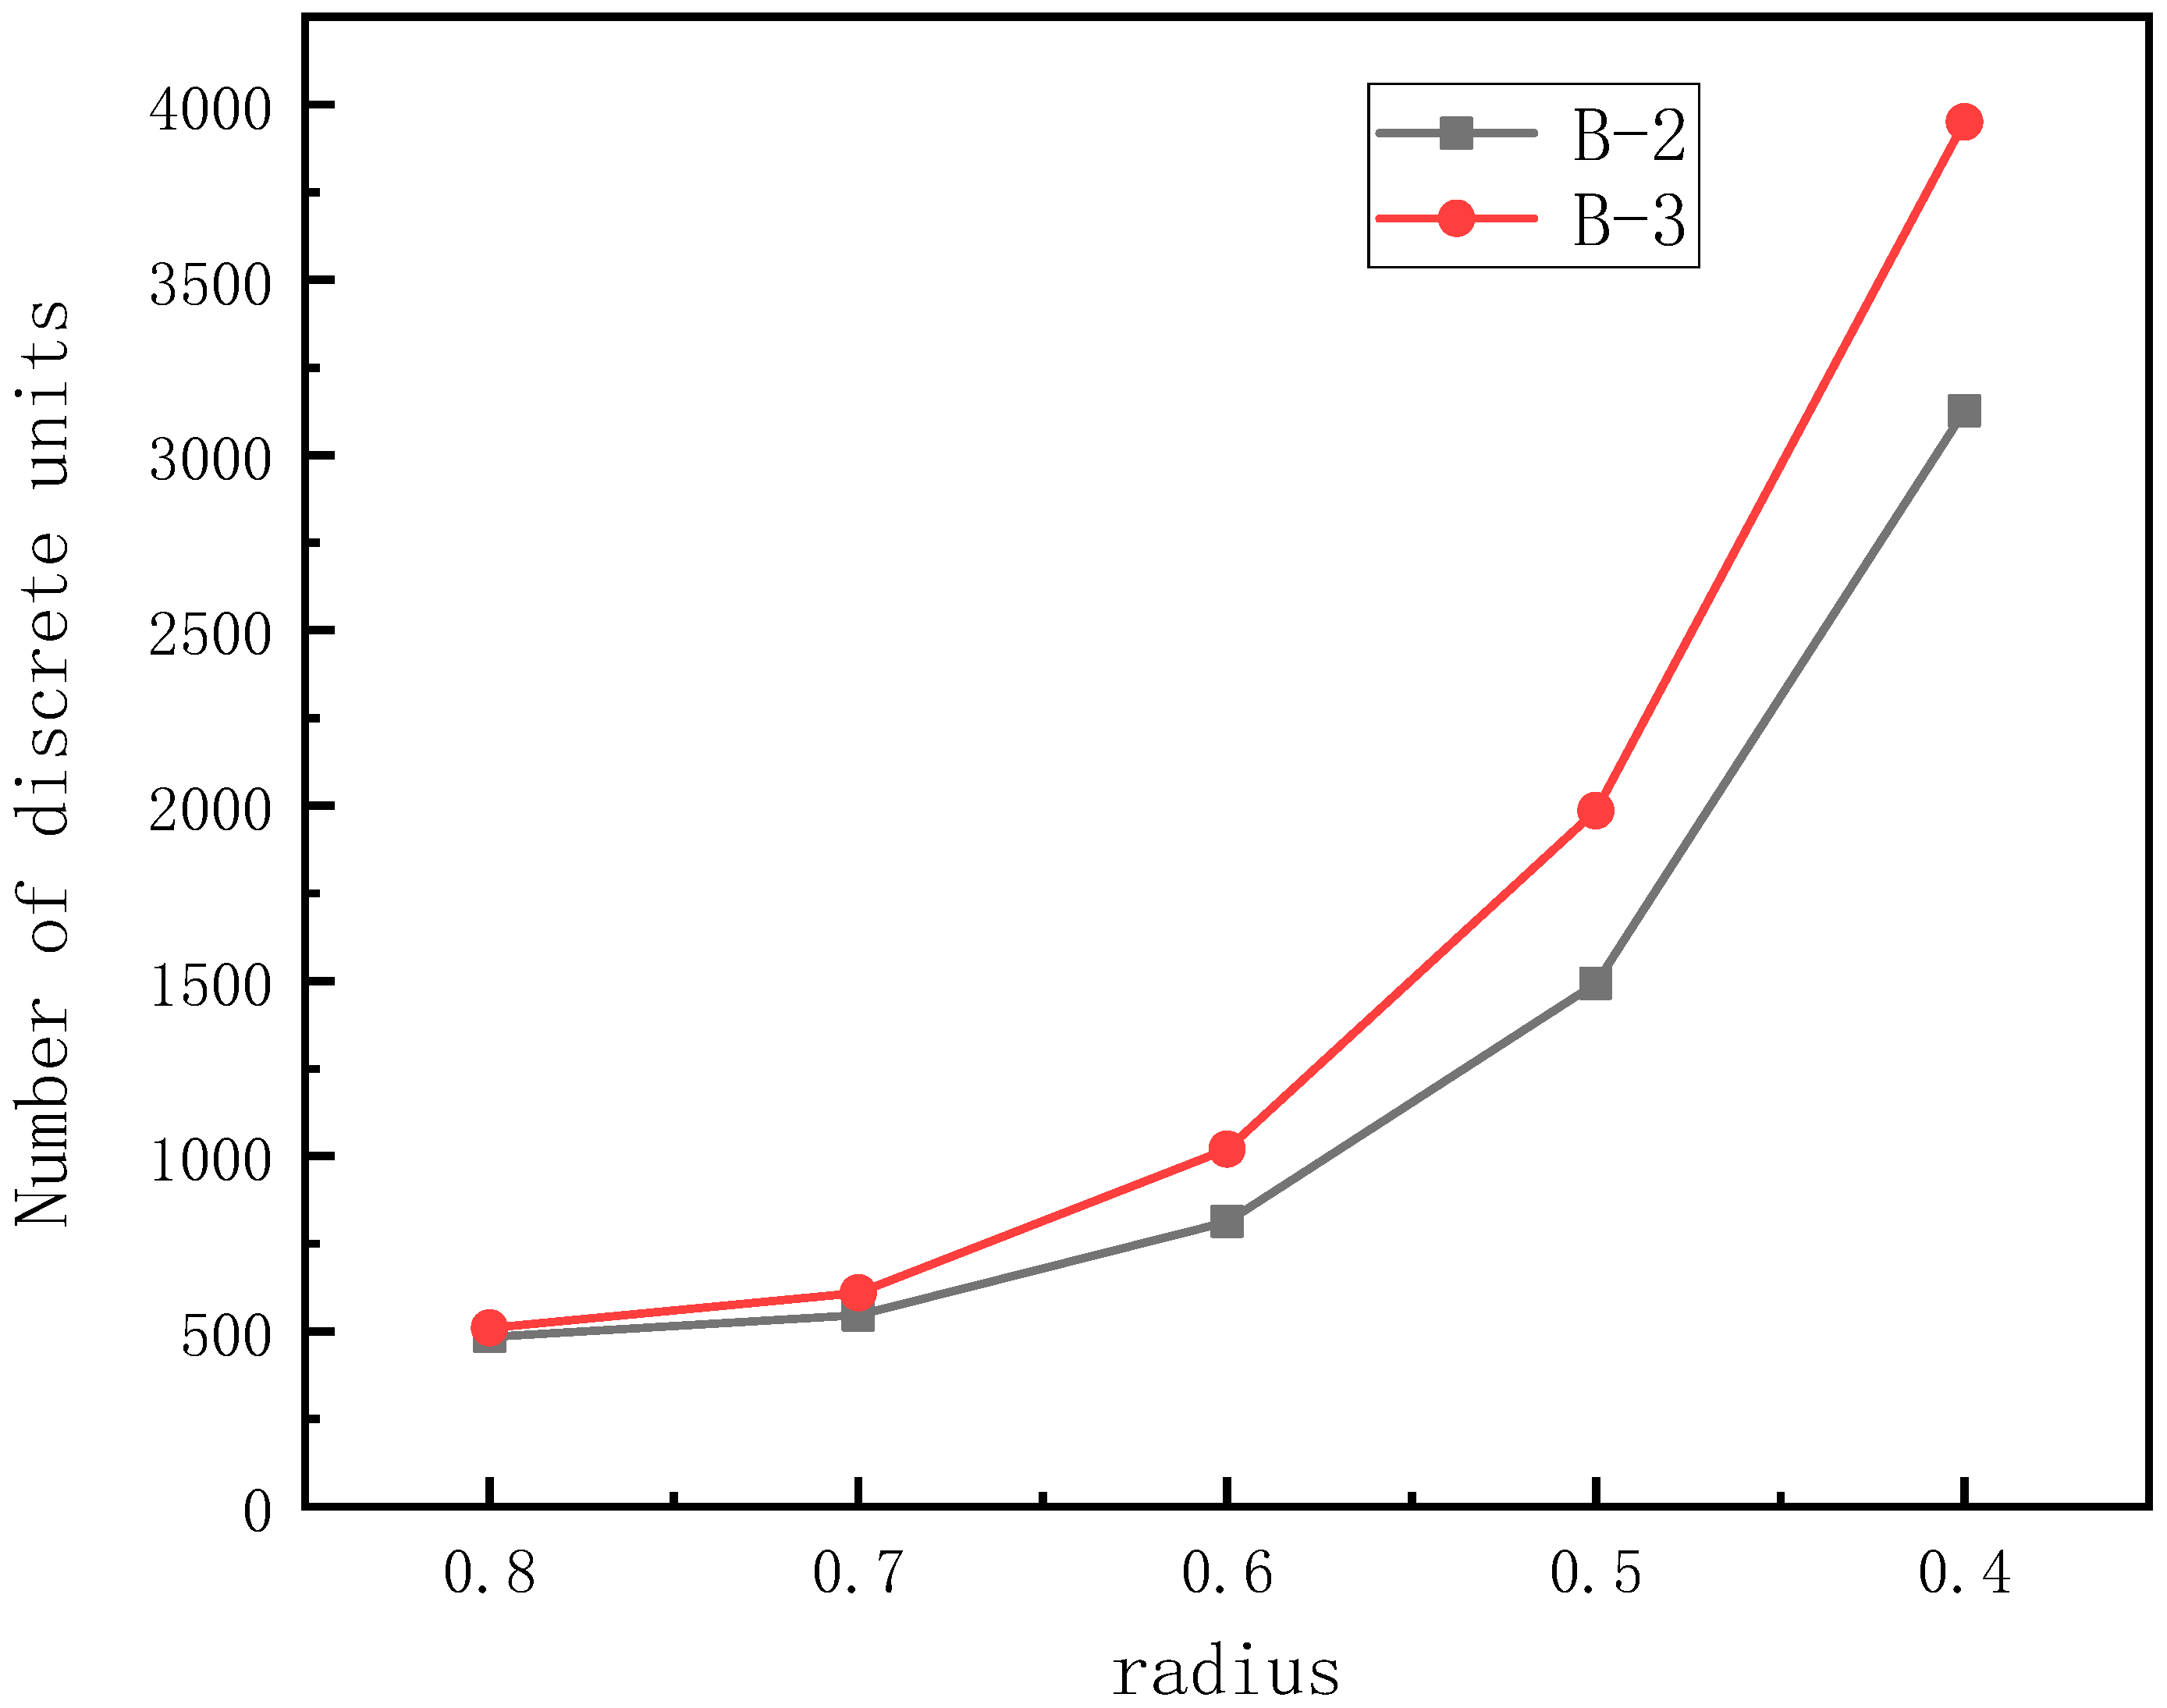
Figure 24.
The number of discrete elements in the cluster template with different ratio values.
Figure 24.
The number of discrete elements in the cluster template with different ratio values.
Figure 25.
Linear parallel bond model set by cmat default command.
Figure 25.
Linear parallel bond model set by cmat default command.
Figure 26.
(a) Linear parallel bond model and (b) joint model after setting.
Figure 26.
(a) Linear parallel bond model and (b) joint model after setting.
Figure 27.
Stress-strain curve and failure form of the compression test of a numerical model.
Figure 27.
Stress-strain curve and failure form of the compression test of a numerical model.
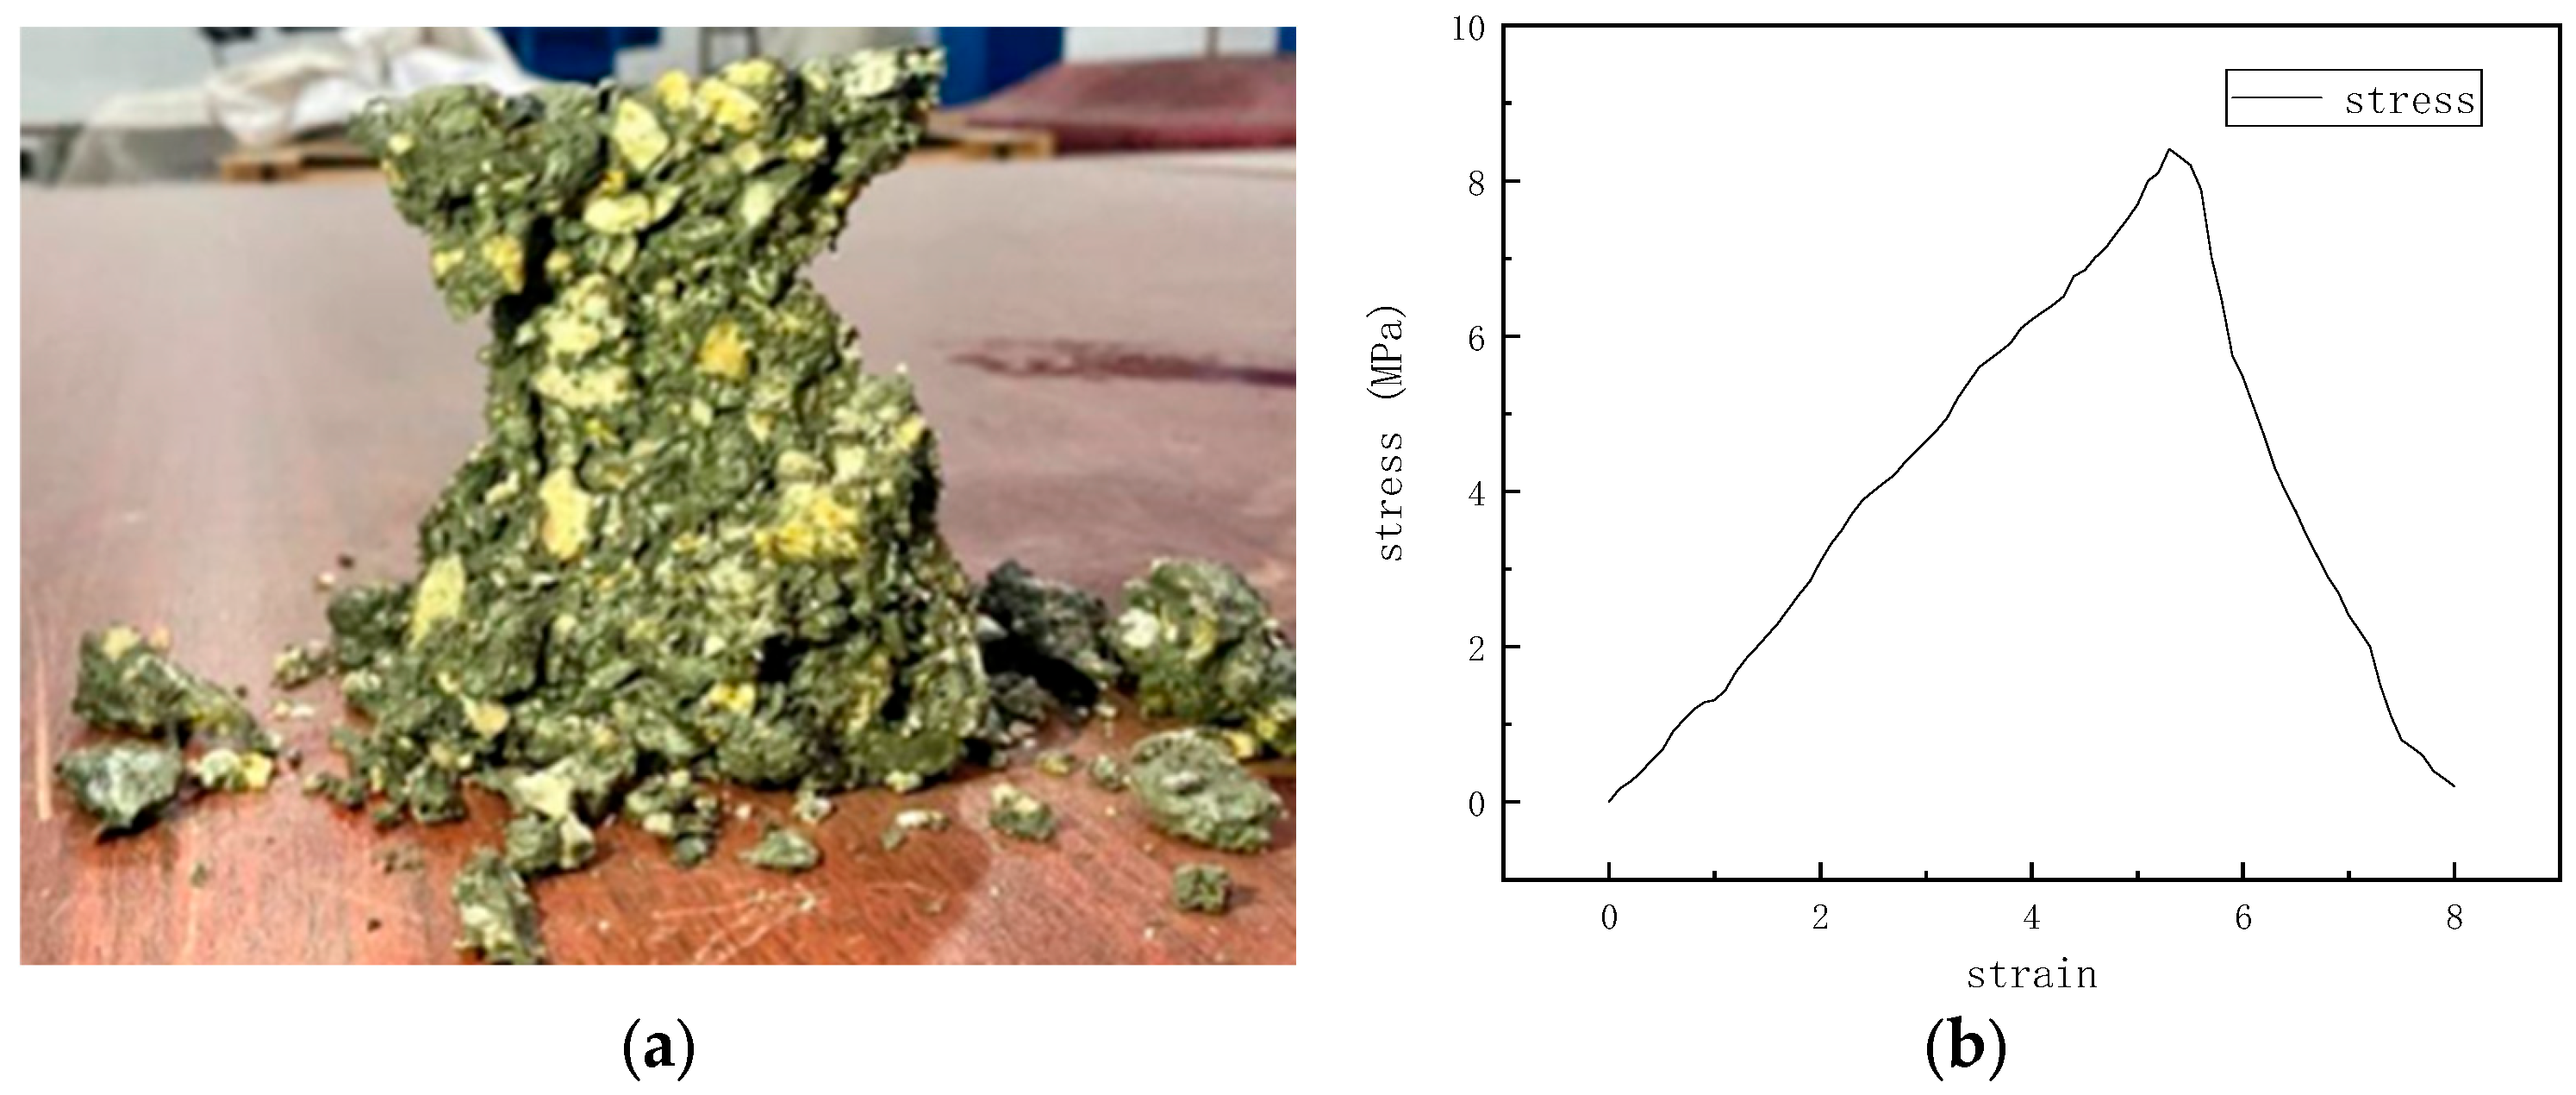
Figure 28.
Stress−strain curve and failure form of specimen in a compression test: (a) failure form of compression test and (b) stress−strain curve test.
Figure 28.
Stress−strain curve and failure form of specimen in a compression test: (a) failure form of compression test and (b) stress−strain curve test.
Figure 29.
Compressive test of the specimen.
Figure 29.
Compressive test of the specimen.
Figure 30.
Compression simulation and test results of the numerical model.
Figure 30.
Compression simulation and test results of the numerical model.
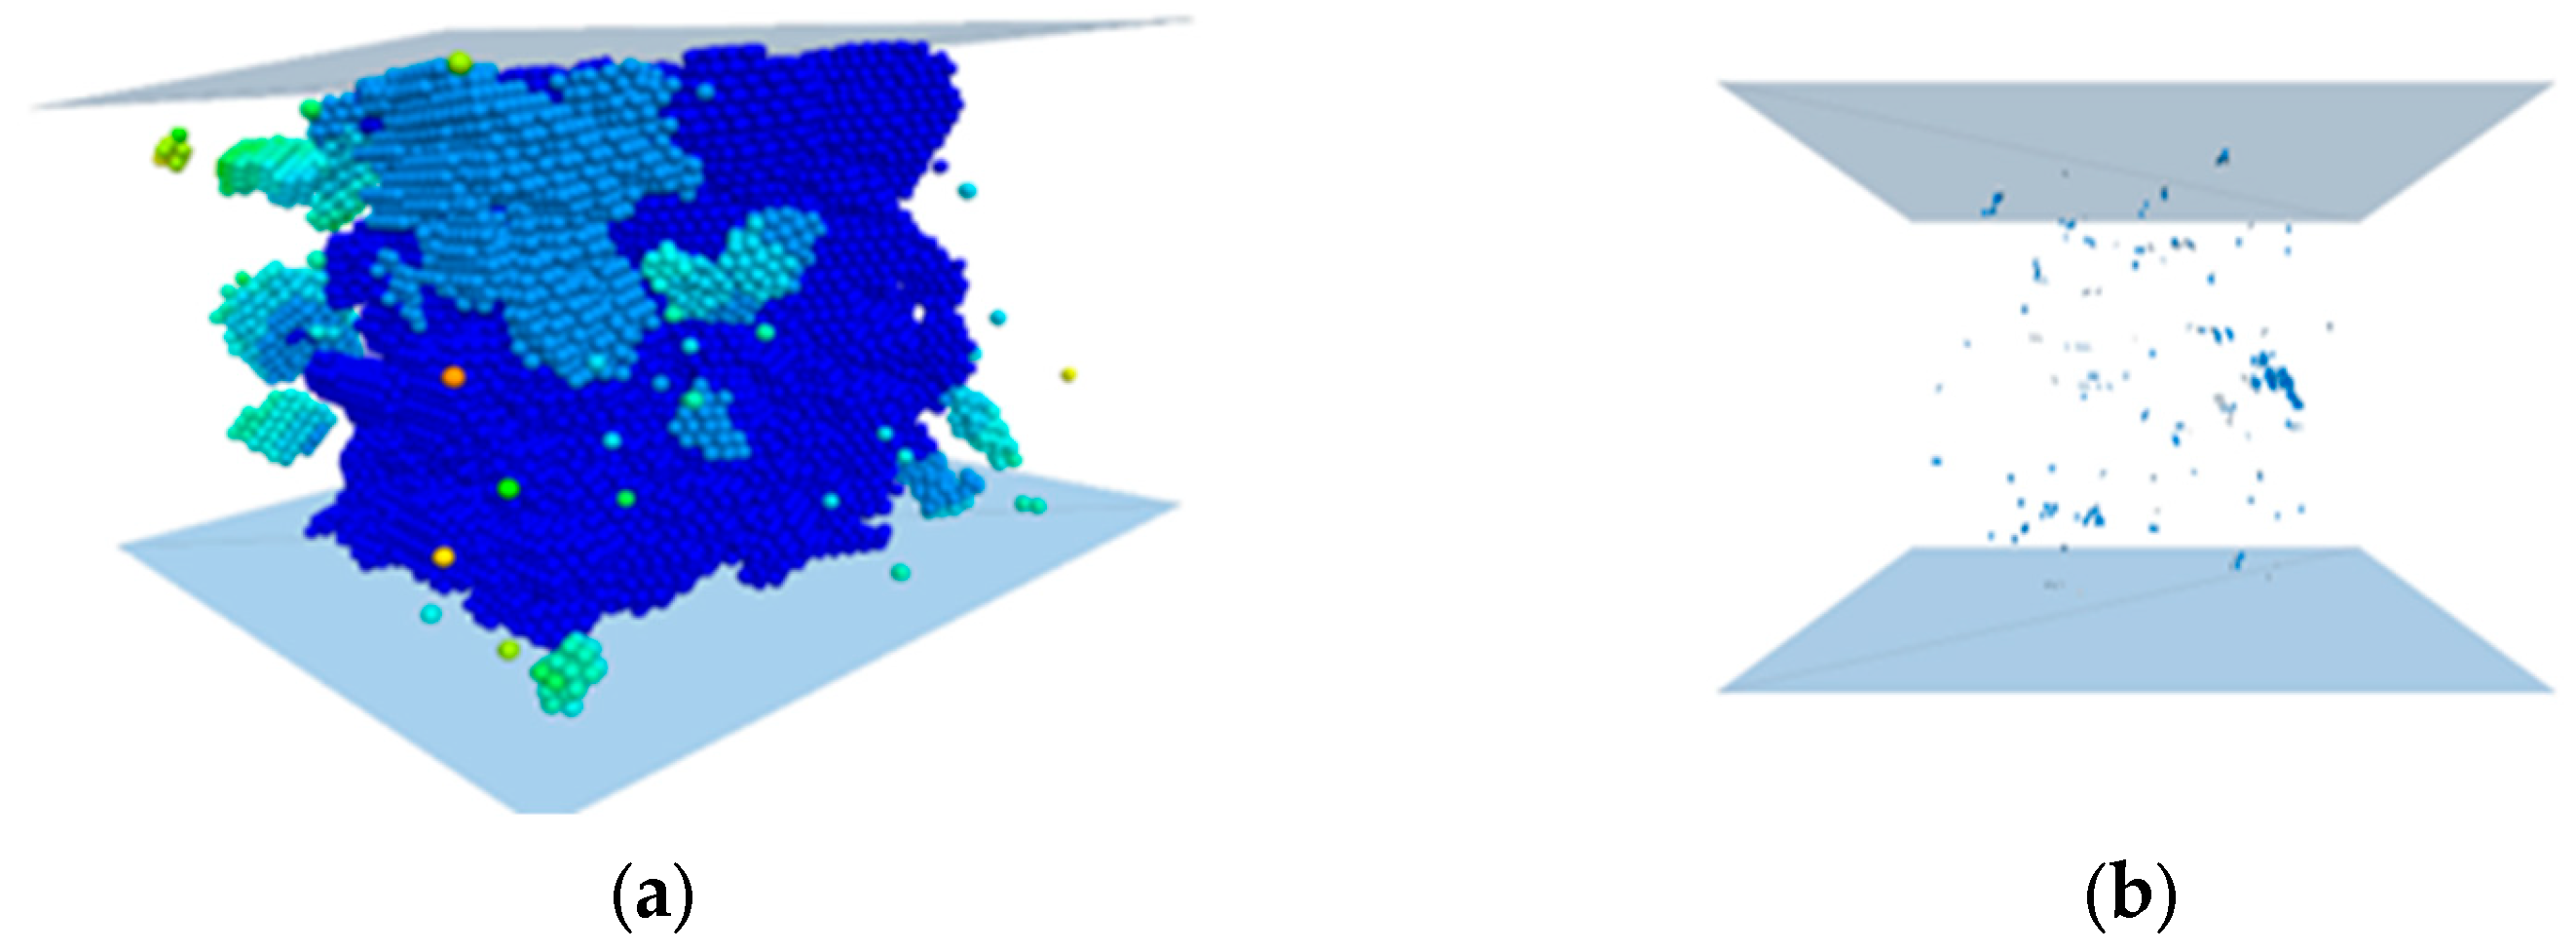
Figure 31.
Discrete element displacement and discrete element crack in the initial stage of compression: (a) displacement distribution of discrete elements and (b) numerical model fracture distribution.
Figure 31.
Discrete element displacement and discrete element crack in the initial stage of compression: (a) displacement distribution of discrete elements and (b) numerical model fracture distribution.
Figure 32.
Displacement and crack distribution of discrete element in compressive failure state: (a) displacement distribution of discrete elements and (b) numerical model fracture distribution.
Figure 32.
Displacement and crack distribution of discrete element in compressive failure state: (a) displacement distribution of discrete elements and (b) numerical model fracture distribution.
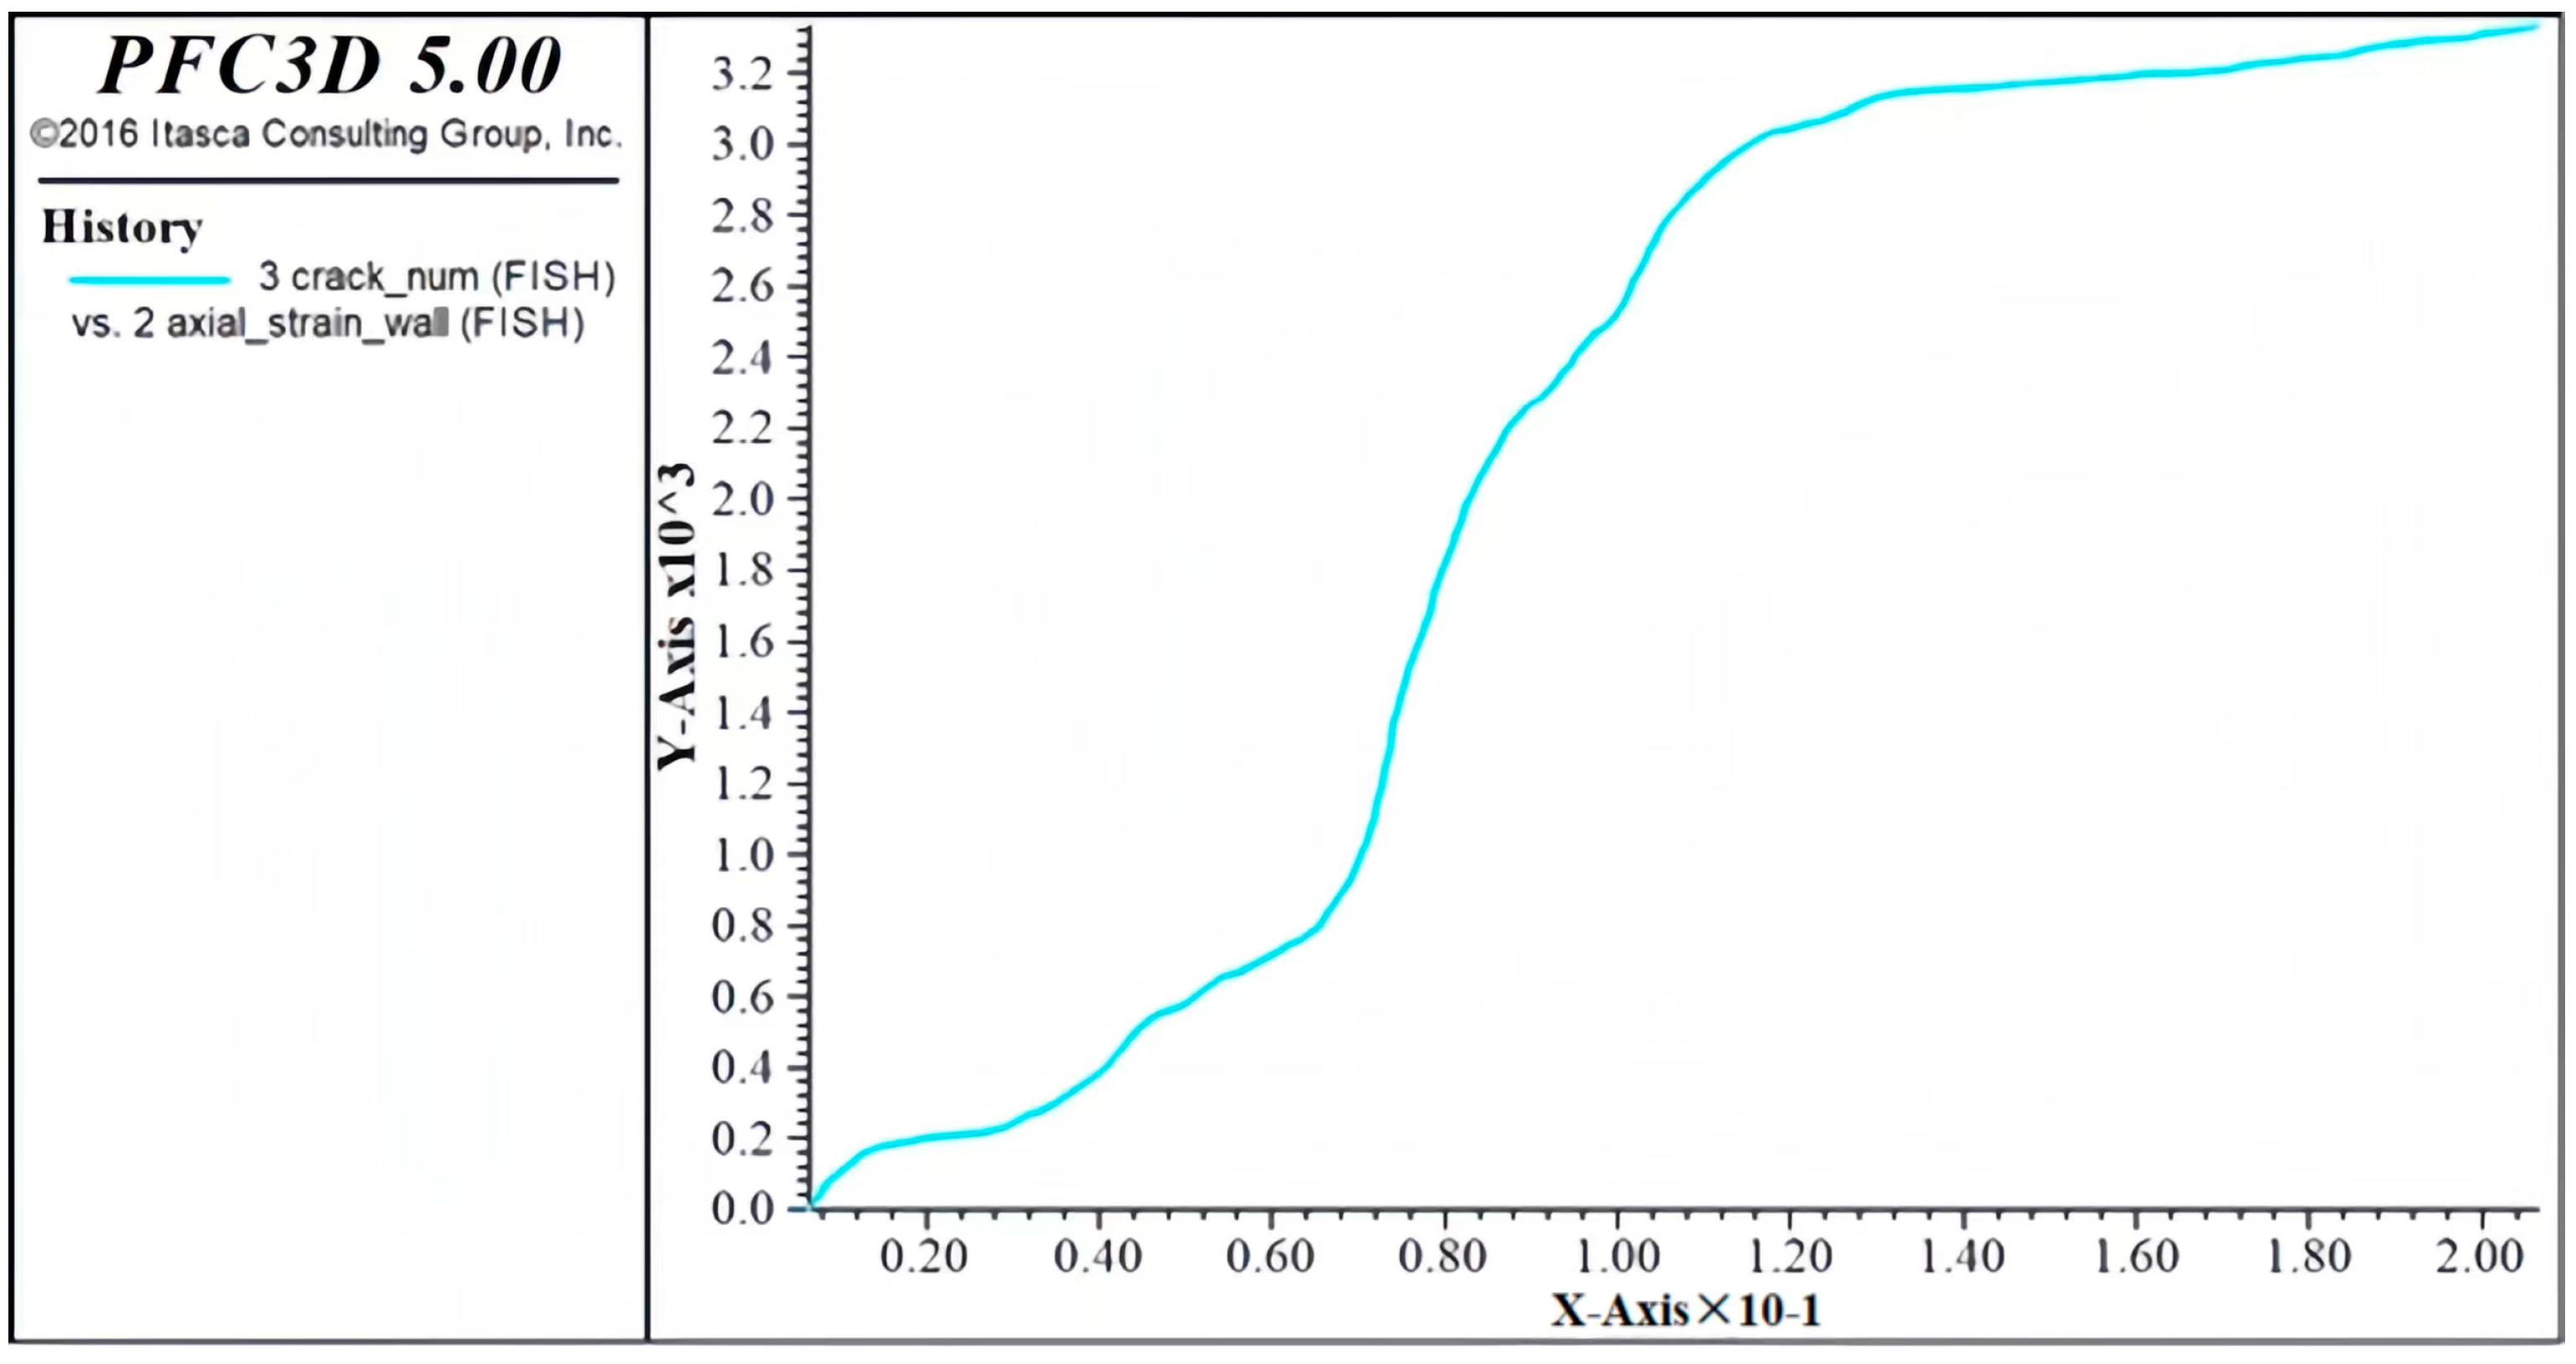
Figure 33.
The change in the number of fractures in the process of compression simulation.
Figure 33.
The change in the number of fractures in the process of compression simulation.
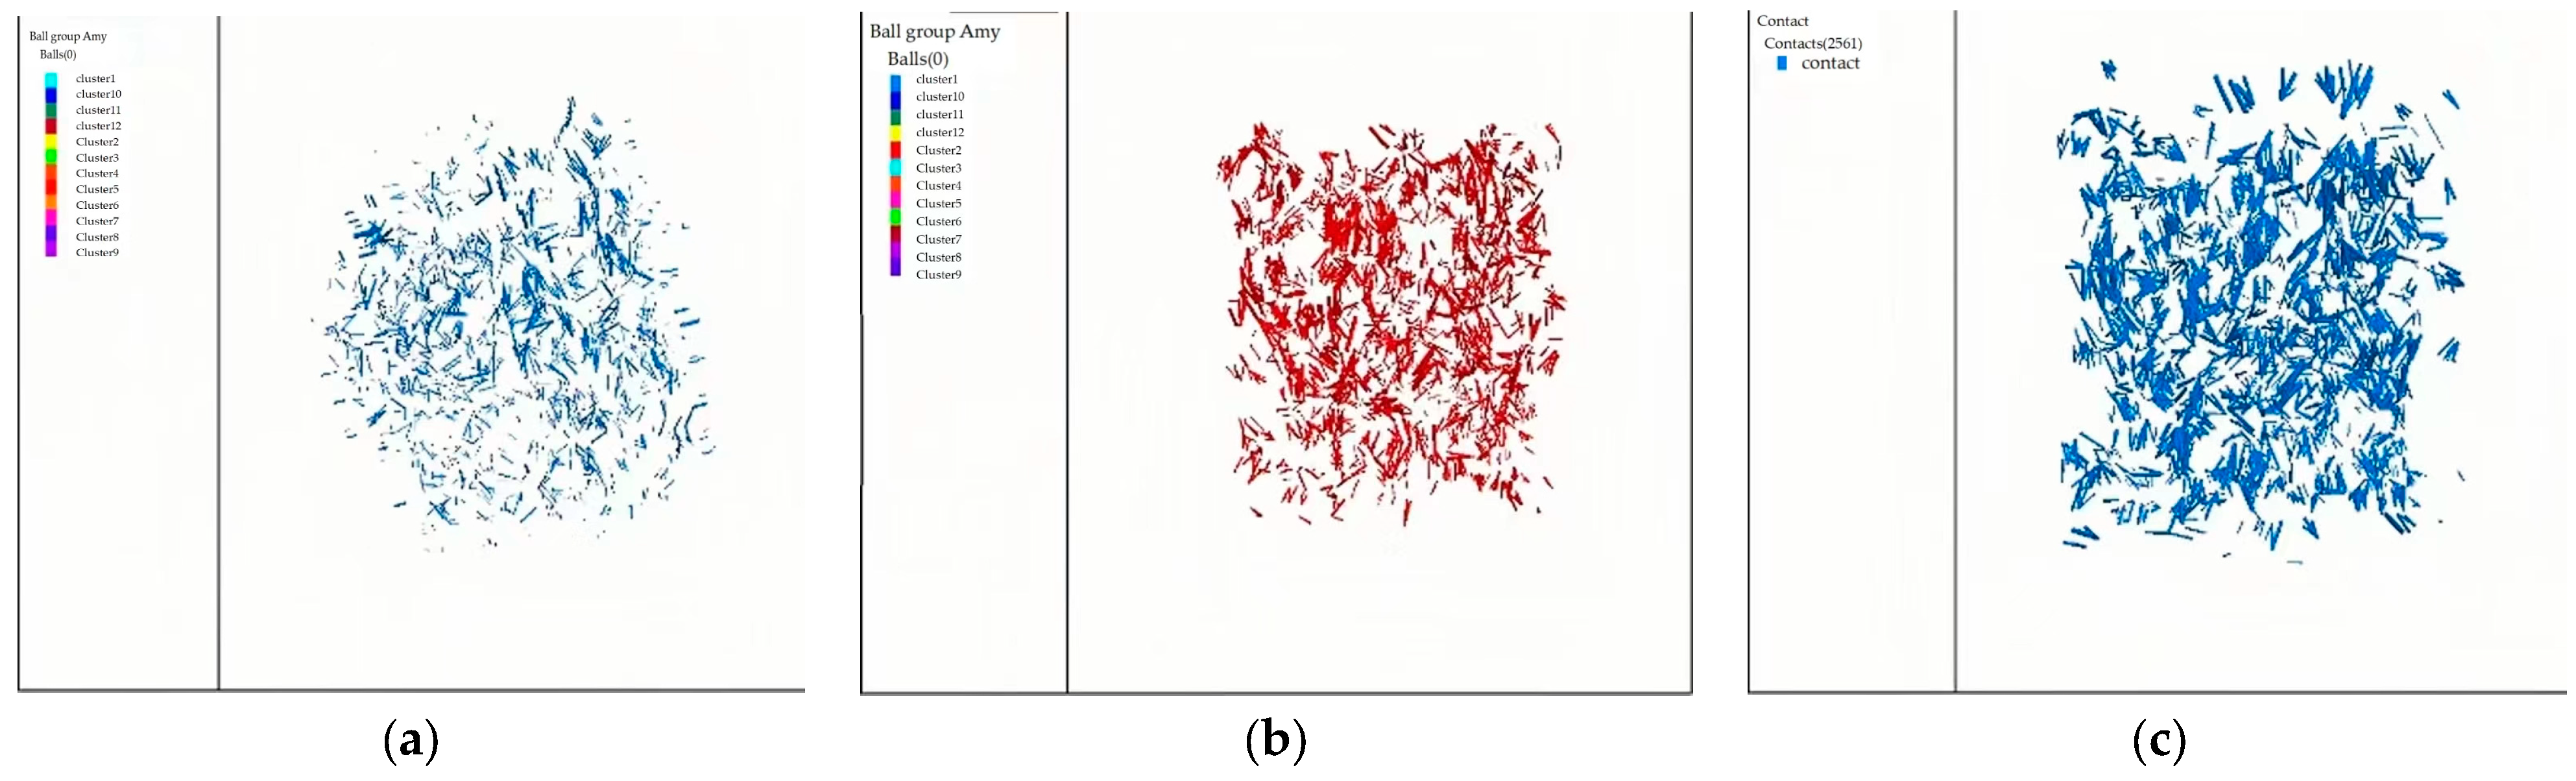
Figure 34.
Numerical model of contact quantity and distribution between aggregates: (a) loose paving coefficient = 1.05, (b) loose paving coefficient = 1.10, and (c) loose paving coefficient = 1.15.
Figure 34.
Numerical model of contact quantity and distribution between aggregates: (a) loose paving coefficient = 1.05, (b) loose paving coefficient = 1.10, and (c) loose paving coefficient = 1.15.
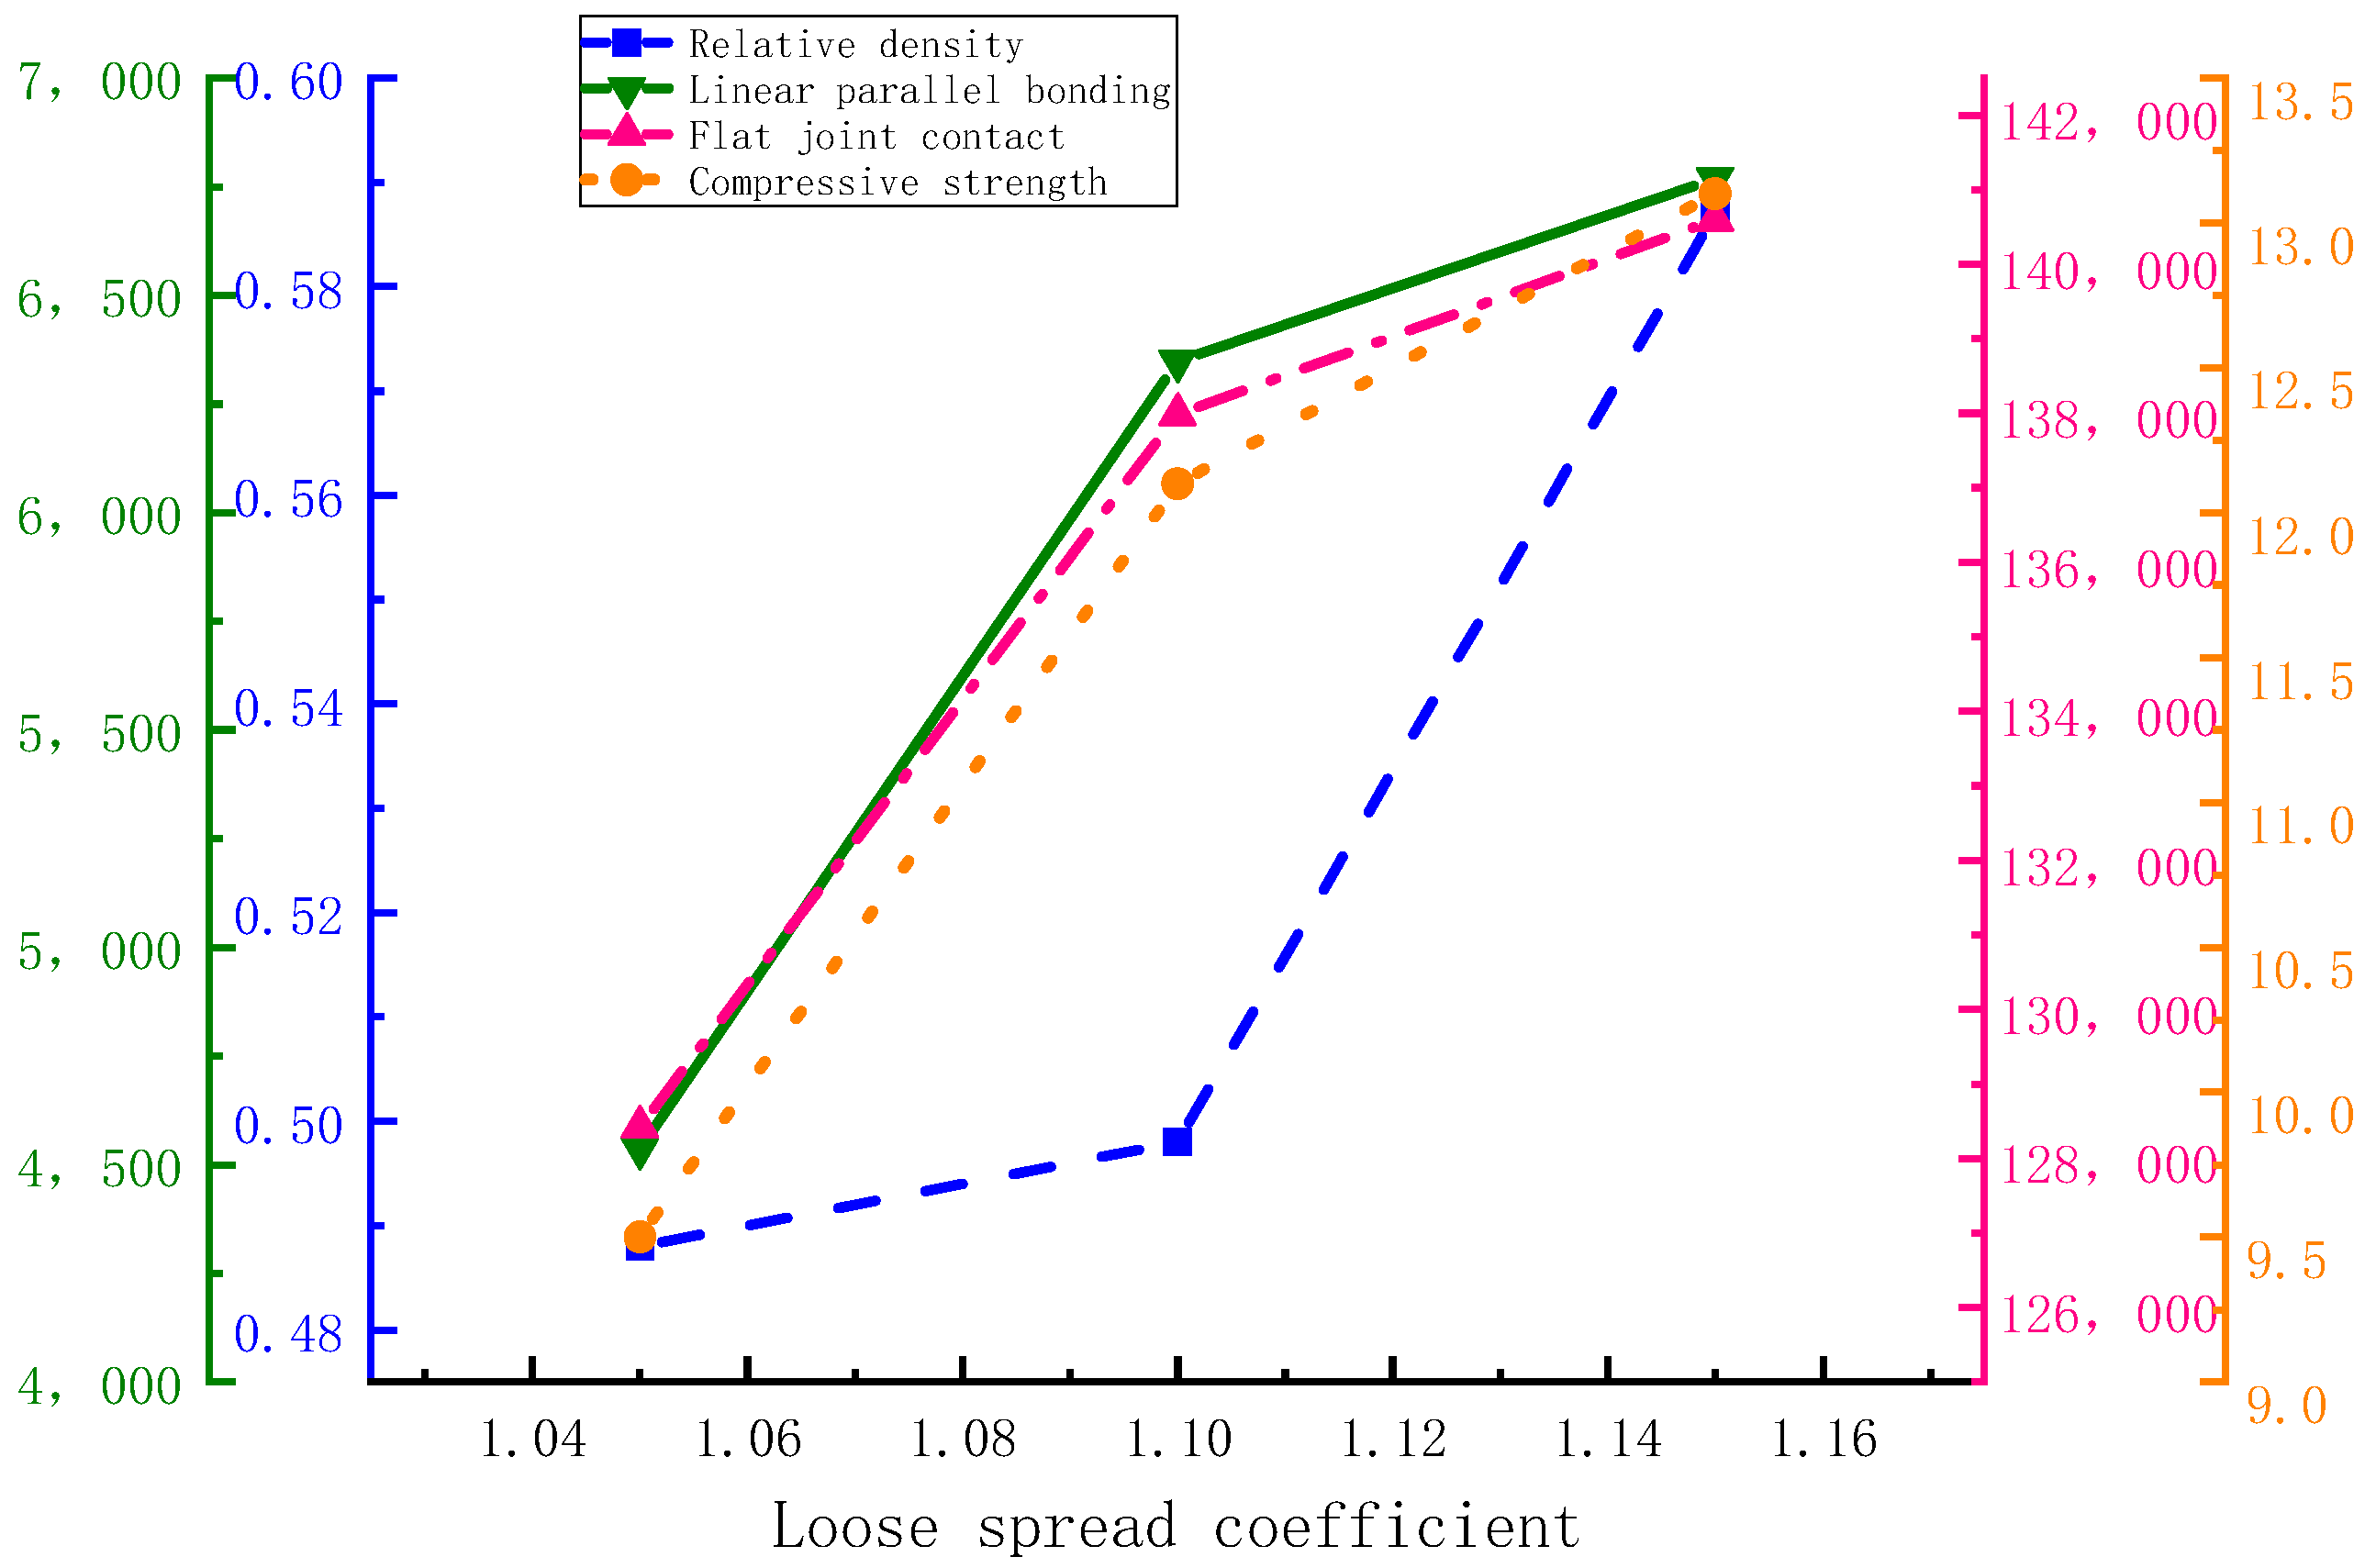
Figure 35.
Relationship between the relative density, contact number, compressive strength, and loose paving coefficient.
Figure 35.
Relationship between the relative density, contact number, compressive strength, and loose paving coefficient.
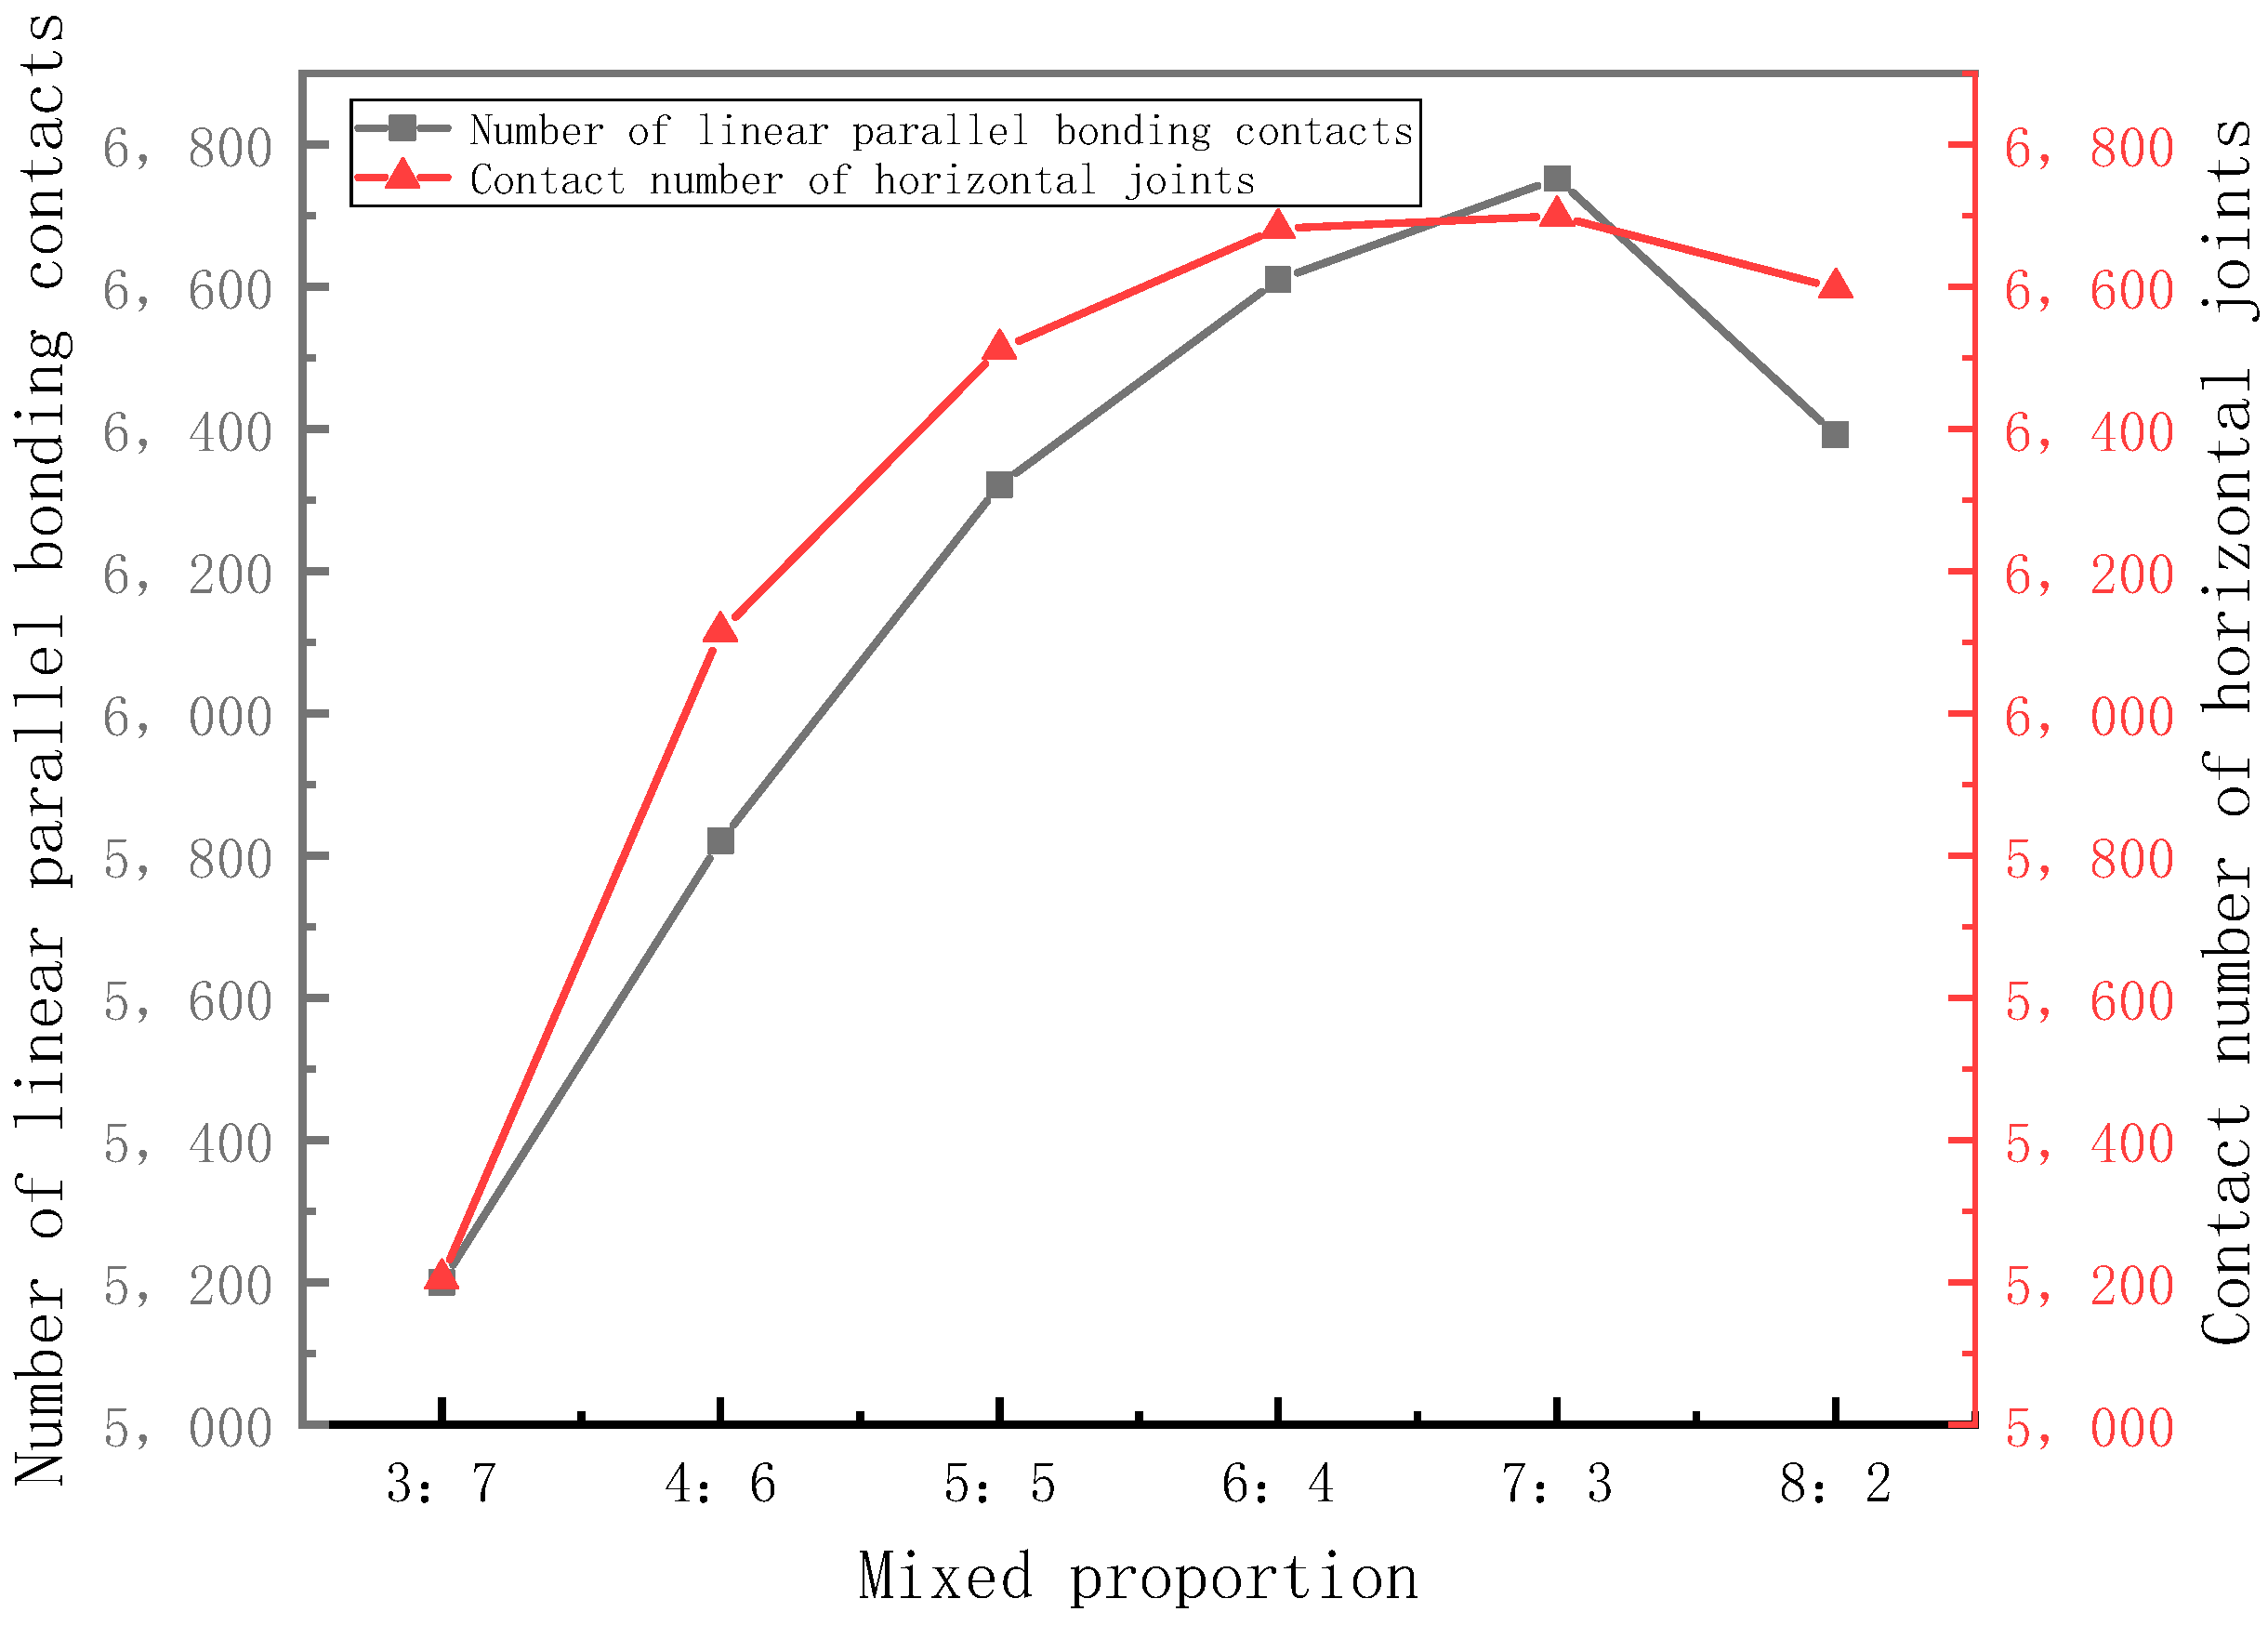
Figure 36.
Relationship between contact quantity and aggregate mixing ratio.
Figure 36.
Relationship between contact quantity and aggregate mixing ratio.
Table 1.
Physical and mechanical properties of cement.
Table 1.
Physical and mechanical properties of cement.
| Density (kg/m3) | Specific Surface Area
(m2/kg) | Setting Time (min) | Flexural Strength (MPa) | Compressive Strength (MPa) |
|---|
| | | Initial setting | Final coagulation | 3d | 28d | 3d | 28d |
| 3100 | 3500 | 128 | 190 | 4.6 | 7.8 | 17.9 | 42.7 |
Table 2.
Basic properties of natural coarse aggregate.
Table 2.
Basic properties of natural coarse aggregate.
| Kinds | Apparent Relative Density (kg/m3) | Crushing Value (%) | Compact Packing Density (kg/m3) | Stacked Porosity (%) | Apparent Density (kg/m3) | Water Absorption Rate |
|---|
| 5–10 mm | 2690 | 7.6 | 1456 | 45.67 | 2682 | 0.007 |
Table 3.
Horizontal design table of test factors.
Table 3.
Horizontal design table of test factors.
| Test Number | Aggregate Particle Size | Degree of Compaction | Plasma-Bone Ratio |
|---|
| A | 50% 5–10 mm + 50% 10–15 mm | 1.10 | 0.5 |
| B1 | 50% 5–10 mm + 50% 10–15 mm | 1.10 | 0.4 |
| B2 | 50% 5–10 mm + 50% 10–15 mm | 1.10 | 0.6 |
| C1 | 100% 5–10 mm | 1.10 | 0.5 |
| C2 | 100% 10–15 mm | 1.10 | 0.5 |
| D1 | 50% 5–10 mm + 50% 10–15 mm | 1.05 | 0.5 |
| D2 | 50% 5–10 mm + 50% 10–15 mm | 1.15 | 0.5 |
Table 4.
Actual consumption of materials in each group.
Table 4.
Actual consumption of materials in each group.
| Serial Number | Cement (kg) | Water (kg) | Stone (kg) |
|---|
| 5–10 mm | 10–15 mm |
|---|
| A | 1.660 | 0.465 | 2.682 | 2.682 |
| B1 | 1.138 | 0.319 | 2.299 | 2.299 |
| B2 | 1.494 | 0.418 | 2.012 | 2.012 |
| C1 | 1.660 | 0.465 | 5.364 | 0 |
| C2 | 1.660 | 0.465 | 0 | 5.364 |
| D1 | 1.660 | 0.465 | 2.682 | 2.682 |
| D2 | 1.660 | 0.465 | 2.682 | 2.682 |
Table 5.
The proportion of aggregate shapes.
Table 5.
The proportion of aggregate shapes.
| Aggregate Particle Size | Angular Shape | Flat Form | Slender Shape |
|---|
| 5–10 mm | 53.1% | 32.3% | 14.6% |
| 10–15 mm | 64.5% | 32.4% | 3.1% |
Table 6.
Aggregate number.
Table 6.
Aggregate number.
| Aggregate Particle Size | Angular Shape | Flat Form | Slender Shape |
|---|
| 5–10 mm | A-1, A-2, A-3 | A-4, A-5 | A-6 |
| 10–15 mm | B-1, B-2, B-3, B-4 | B-5, B-6 | / |
Table 7.
The number of two kinds of aggregates with the same quality.
Table 7.
The number of two kinds of aggregates with the same quality.
| Aggregate Quality/g | 71 | 103 | 128 | 151 |
|---|
| 5–10 mm Aggregate quantity/unit | 286 | 381 | 443 | 577 |
| 10–15 mm Aggregate quantity/unit | 40 | 54 | 63 | 81 |
Table 8.
The relationship between the number of particles, relative density, contact number, and loose spreading coefficient.
Table 8.
The relationship between the number of particles, relative density, contact number, and loose spreading coefficient.
| Loose Paving Coefficient | Number of Aggregate Particles (Unit) | Number of Original Particles (Unit) | Relative Density | Loose Paving Coefficient | Number of Aggregate Particles (Unit) |
|---|
| 1.05 | 31,866 | 65,296 | 0.488 | 1.05 | 31,866 |
| 1.10 | 32,506 | 65,296 | 0.498 | 1.10 | 32,506 |
| 1.15 | 33,216 | 65,296 | 0.587 | 1.15 | 33,216 |
Table 9.
Comparison between this study and previous studies.
Table 9.
Comparison between this study and previous studies.
| This Study | Previous Studies |
|---|
| The compressive performance of permeable concrete is simulated based on PFC3D, which is more clear and beautiful visually. | Liu Wei and others only use PFC2D to simulate ceramsite concrete, which has only planar a effect and no 3D clarity in vision. |
| Compared with the experimental results, the error of the numerical simulation results of the compressive strength is only 3%. Compared with the predecessors, the accuracy is higher and the simulation results are more accurate. | Liu Jinlong uses PFC for compressive strength numerical simulation results compared with the experimental results and the error is 10%; although it meets the accuracy requirements of the numerical simulation, the error is large. |
| A Binocular Blu-ray three-dimensional scanner is used to scan the aggregates one by one to obtain the true shape of the aggregate and establish a more realistic aggregate model. | Xu Hong, Zhao Long, and other scholars use ball particles instead of concrete aggregate, but the shape of concrete aggregate is irregular, so it is not accurate to use ball particles instead of aggregate. |
| Not only are the numerical simulations carried out using PFC3D software, but it is also proven that the mechanical properties are closely related to the number of contacts between the particles in the simulation model. | Most scholars such as he Shengdong only study the mechanical properties though numerical simulation but do not discuss why the mechanical properties of the specimens are different under different parameters. |


