Article

Citrus Orchards in Agroforestry, Organic, and Conventional Systems: Soil Quality and Functioning

by
Lucas Contarato Pilon
,
Jordano Vaz Ambus
,
Elena Blume
,
Rodrigo Josemar Seminoti Jacques
and
José Miguel Reichert
*
Rural Sciences Center, Universidade Federal de Santa Maria, Santa Maria 97105-900, RS, Brazil
*
Author to whom correspondence should be addressed.
Sustainability 2023, 15(17), 13060; https://doi.org/10.3390/su151713060
Submission received: 11 July 2023 / Revised: 31 July 2023 / Accepted: 10 August 2023 / Published: 30 August 2023

Abstract

:
Citrus crop management has evolved to improve the quality of orchards and production, encompassing agroforestry and agroecological management practices. We sought to analyze different management systems in different seasons of the year, evaluating the quality of the soil physical, chemicals and biological properties, and the herbaceous vegetation occurring in citrus orchards. Five sites were studied: citrus in agroforestry and biodynamic systems (Cs), citrus in biodynamic systems (Co), citrus in conventional systems (Cc), and two forest sites, one with 40 (F40) and another with 200 years of regeneration (F200). Soil properties were evaluated in three layers (0–5, 5–20, and 20–40 cm) in four seasons, while the herbaceous survey was carried out in two of these seasons. The results showed that the Co and Cs orchards had better indicators in terms of chemical (pH, phosphorus, cation exchange capacity, and soil organic carbon (SOC)), physical (soil density, total porosity, and macro- and microporosity), and biological properties (global enzymatic activity) than the Cc management. The agroforestry management was even superior in soil quality, with improved pH levels, microporosity, and feeding behavior of the soil fauna. The most evident temporal variations were for pH, SOC, global enzymatic activity, and feeding activity of the soil fauna. The Cs and Co orchards showed greater richness and abundance of herbaceous species. Organic management favors a timely coverage of multiple benefits, with the presence of the Commoliaceae and Fabaceae families, and offering an ecological effect and green manure of high ecosystem value. In conclusion, agroforestry and biodynamic management systems are the best options to maintain soil quality and functioning for citrus production.

1. Introduction

Agriculture and methods of production have changed throughout the evolution of humanity; new paradigms are created, and the way we obtain our food is a reflection of how society is organized. In this sense, the current role of agriculture around the world is undoubtedly the search for efficient and ecological production systems, with special attention to the preservation of the environment and natural resources [1,2,3]. Forms of production that aim at the best use of the soil and the environment can be considered extremely modern and in line with the current need to increase production efficiency and, consequently, food security [4,5].
Soil is a great indicator of the environmental quality of agricultural systems, as it plays a key role in regulating carbon and nutrient cycling [6,7]. Changes in land use and management practices, such as crop rotation, the addition of organic matter, and maintaining crop residues in the field, improve soil physical, chemical, and biological properties [8]. Practices and management applied to the soil control the quality and influence the input processes and quality of soil cover, as well as the rates of decomposition and stabilization of organic matter [9,10,11,12,13,14].
Systems that allow the maintenance and improvement of soil quality are considered conservationist. All applied management aims at sustaining important chemical, physical, and biological properties for proper soil functioning [10,15]. Organic and/or agroecological production orchards focus on soil conservation, with greater concern for natural resources, elimination of pesticide use, and environmental harmony [16]. As more elements are incorporated into systems, the more complex they become and their self-regulatory capacity increases, bringing them closer to natural systems [16,17]. An example of this is agroforestry, which combines agricultural and forestry production, maximizing the productive potential of the site and making production more sustainable and efficient [4].
Comparison of organic and conventional management systems has aroused the interest of researchers. Among agroecological systems, agroforestry is promising, with successful experiences in Latin America [15,18,19], Africa [20], and Europe [21]. In citrus orchards, there is a change, at a global level, of cultivation strategies for improving production sustainability. In southern Brazil, citrus is cultivated under different production systems, such as organic, conventional, integrated production, agroforestry, biodynamic, natural, alternative, permaculture, and mixed systems (Reichert, personal information). Although the conventional system is the most used, agroecological systems are recommended. The recommendation is to reduce pesticide use as well as energy and fertilizer consumption. Moreover, improvement of biological parameters [22] resulting from soil organic matter contributes to soil aggregation [23].
Soil management is one of the most important practices in organic crops, and the soil must be permanently maintained with a cover crop (mulching), using organic fertilizers, which are among the most common fertilizers, and composting [24]. Regarding fertilization, long-term field experiments show the benefits of organic fertilization on soil fertility [25]. Soil aggregation responds quickly to management practices and environmental conditions. Soil aggregation is an indicator of soil-based ecosystems [26] and plays an important role in carbon sequestration [27]. Moreover, aggregation is indicator of soil quality [28,29].
By characterizing the physical structure and biological parameters of the soil, we seek to understand the effect of different systems of citrus production on soil quality and functioning. We evaluated the effect of long-term management of citrus under agroforestry (biodynamic), organic (biodynamic), and conventional systems in southern Brazil. A strength of the manuscript is the significant effort toward aggregate stability and biological characterization of the studied ecosystems.

2. Materials and Methods

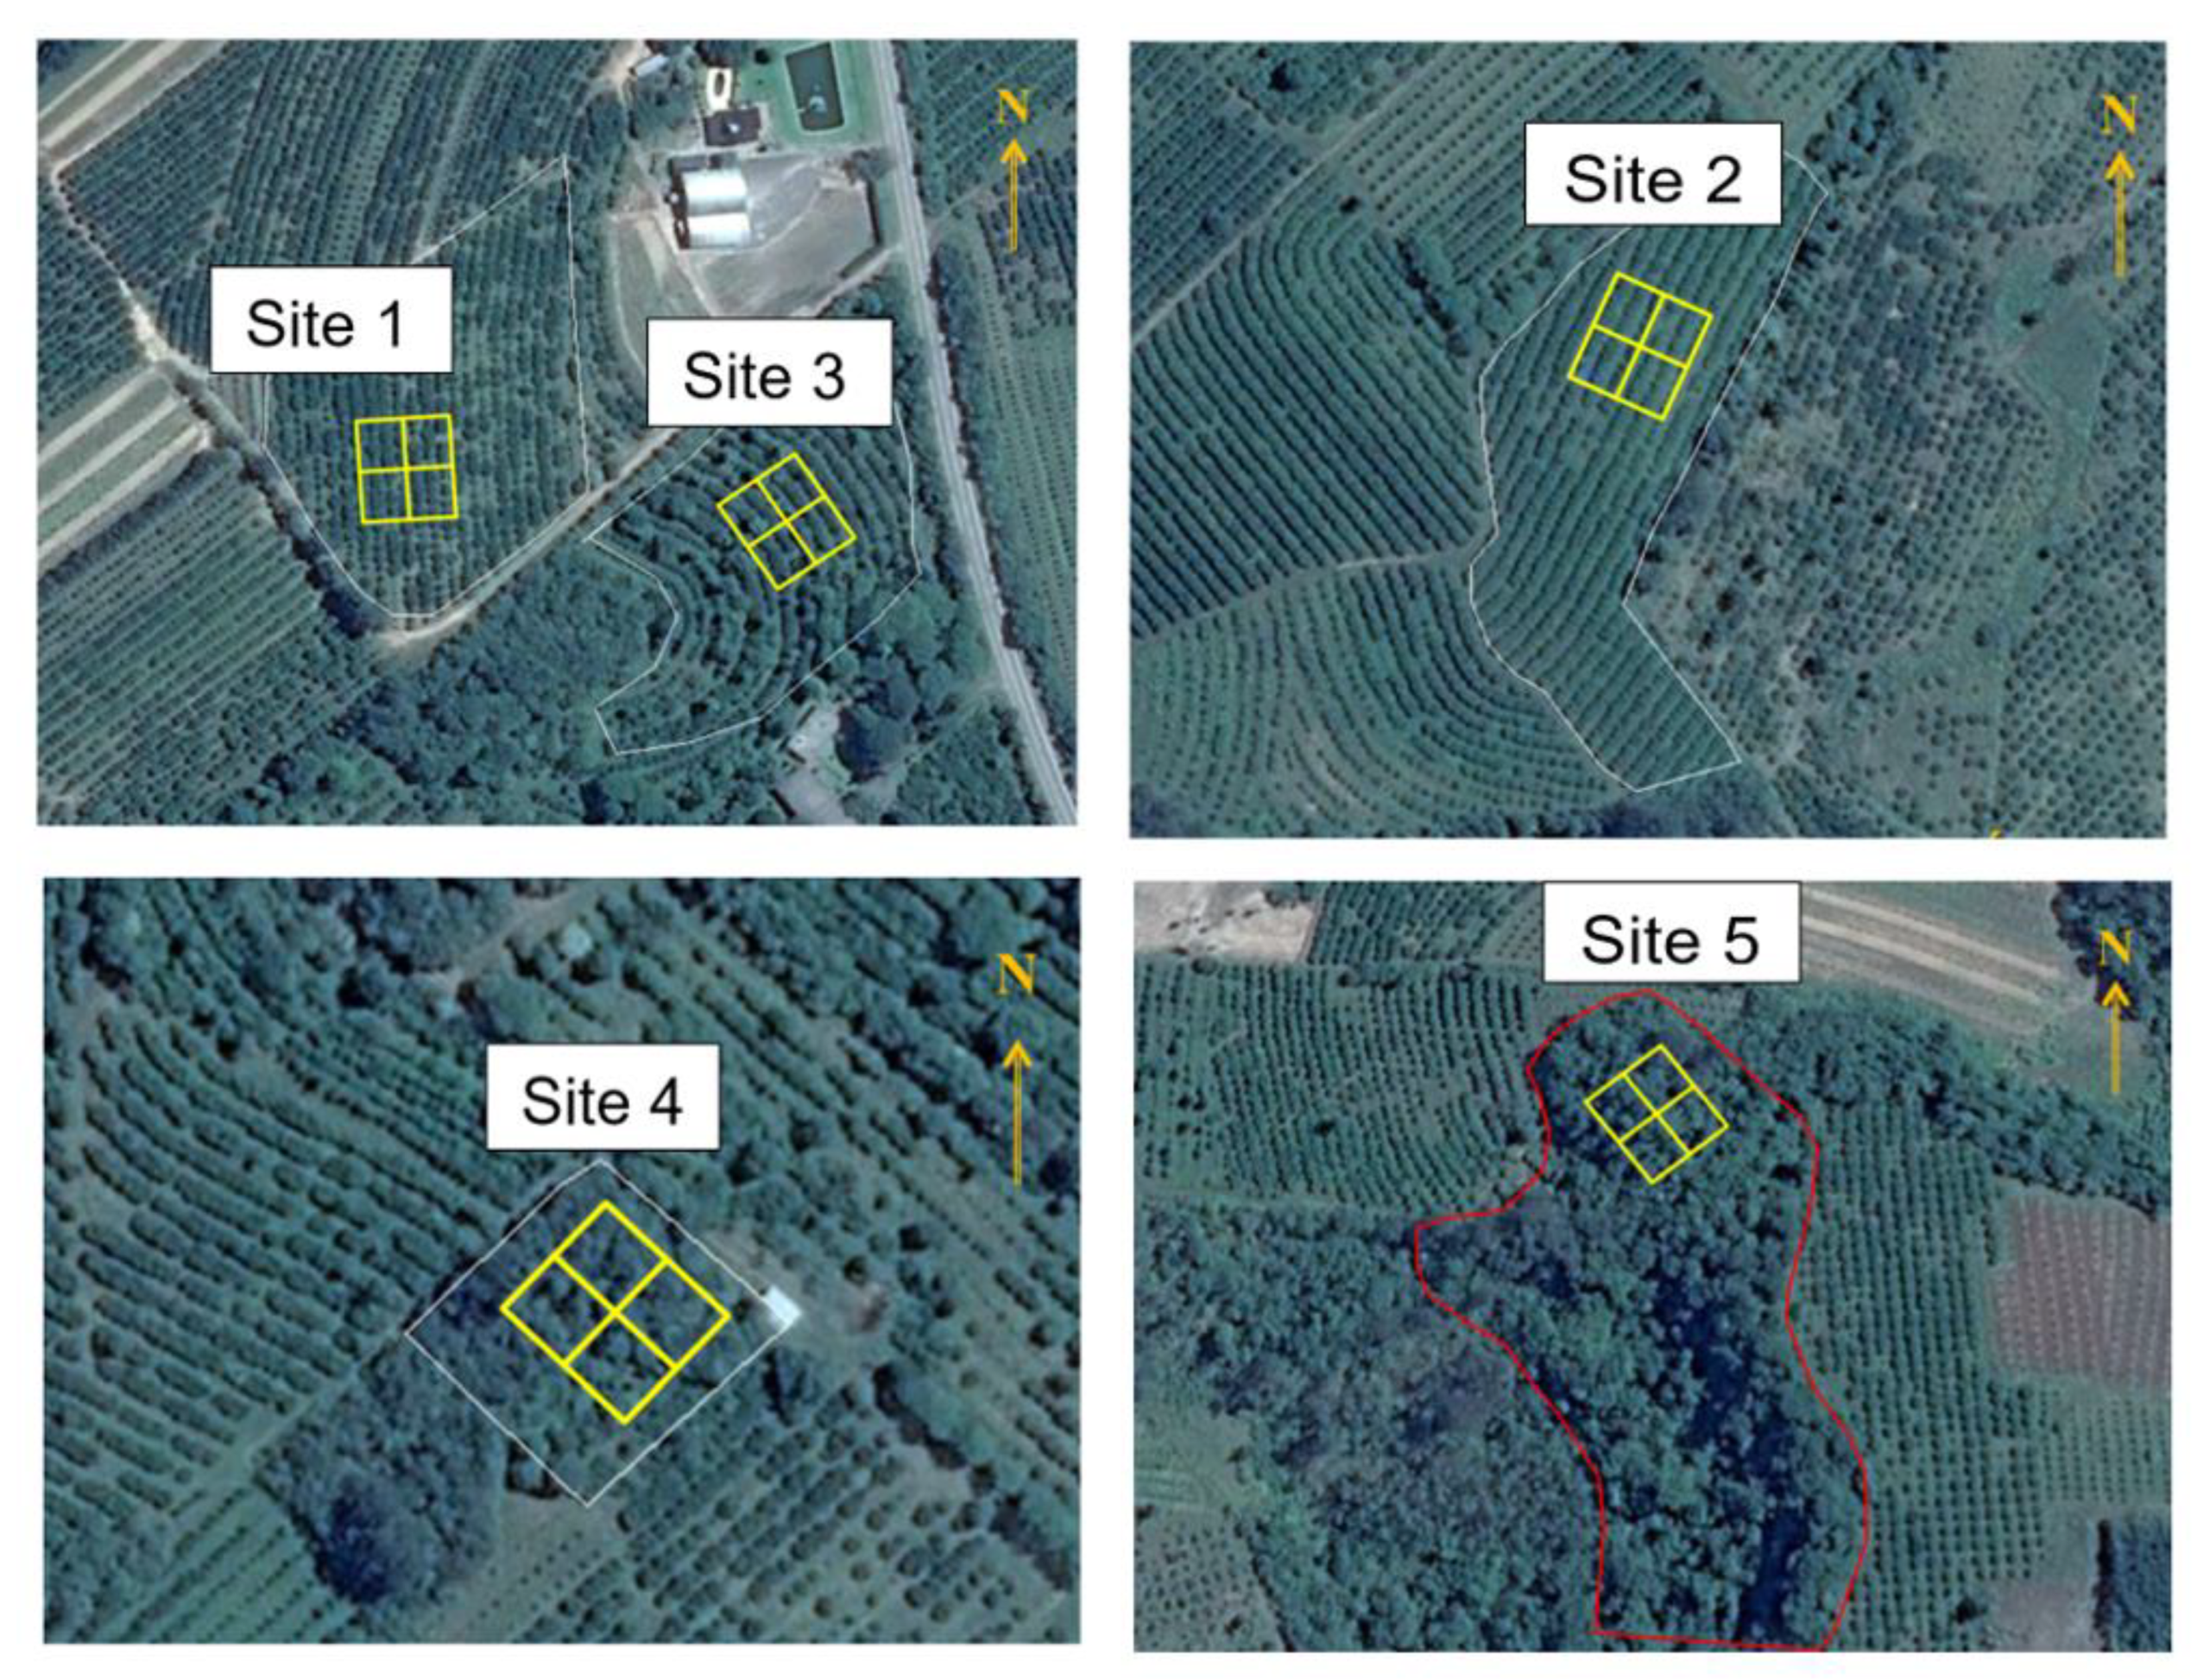
2.1. Citrus Farming System and Forest Site Description

This study was carried out in farming sites (Figure 1) in southern Brazil (29°41′20″ S and 51°27′39″ W). According to the classification of Köppen [30], the local climate is Cfa—humid subtropical with a hot summer. The soil is classified as sandy Argissolo by the Brazilian Soil Classification System SiBCS [31], and Ultisol by Soil Taxonomy [32]. The soil is derived from sandstone (Botucatu Formation), occupying an undulating to strongly undulating relief, with original vegetation from the region predominantly composed of Atlantic Forest and Pampa [33].
Located at three different farms, the research was carried out on five land-use/management systems, described as citrus in a conventional system (Cc; 1.12 ha; coordinates 29′37′57.74′ S and 51′28′21.38′ O), organic citrus (biodynamic agriculture) (Co; 1.17 ha; coordinates 29′38′21.13′ S and 51′28′34.96′ O), citrus in a biodynamic agroforestry system (Cs; 1.16 ha; coordinates 29′37′57.42′ S and 51′28′16.61′ O), native forest (Atlantic Forest) with approximately 40 years of regeneration (F40; 0.37 ha; coordinates 29′38′11.10′ S and 51′28′35.28′ O), and native forest with approximately 200 years of regeneration (F200; 2.1 ha; coordinates 29′38′33.61′ S 51′30′43.39′ O).
The citrus organic system (Co) crop started in 1998 with the citrus planting. With organic management practices include the use of compost and the management of spontaneous plants with mowing. In 2009, the farmer began working with biodynamic agriculture.
The citrus agroforestry system (Cs), initially was under the same management as the previous site, because it belongs to the same farmer; however, in 1999 the inclusion of forest species began. Native forest species and some exotic species were included, locally known as Açoita-cavalo (Luehea grandiflora Mart. & Zucc), Acácia Negra (Acacia mearnsi De Wild), Angico-vermelho (Parapiptadenia rigida (Benth.) Brenan), Araucária (Araucaria angustifolia (Bertol.) Kuntze), Butiá (Butia eriospatha (Mart. Ex Drude) Becc.), Cabreúva (Myroxylon peruiferum L.f.), Canafístula (Peltophorum dubium (Spreng.) Taub.), Canela (Cinnamomum zeylanicum Blume), Canjerana (Cabralea canjerana (Vell.) Mart.), Cedro rosa (Cedrela odorata L.), Cinamomo (Melia azedarach L.), Ipê roxo (Handroanthus impetiginosus Mart. ex DC.), Jacarandá-mimoso (Jacaranda mimosifolia, D. Don), Jerivá (Syagrus romanzoffiana (Cham.) Glassman), Louro-pardo (Cordia trichotoma (Vell.) Arrab. ex Steud.), Mamica de cadela (Zanthoxylum rhoifolium Lam.), and Timbaúva (Enterolobium contorstisiliquum (Vell.) Morong.). These trees were planted in the row of citrus trees at an average spacing of 15 m.
The citrus conventional system (Cc) was installed in 1990. Conventional soil tillage was performed, using a plow and a harrow to mobilize the soil for manual planting of citrus tree seedlings (Citrus delicious Tenore) of the variety Montenegrina, Okitsu, Morgote, and Caí, grafted on Poncirus trifoliata L. Citrus plants were allocated at a spacing of 3 m between plants in a row and 6.5 m between rows.
Forest sites consisted of native forest (Atlantic Forest) with approximately 40 years of regeneration (F40), and native forest with approximately 200 years of regeneration (F200).

2.2. Soil Sampling

Soil sampling was performed on a georeferenced grid, in the soil layers of 0–0.05, 0.05–0.20, and 0.20–0.40 m. Soil samples were collected in four different periods in 2014 and 2015, namely period 1—Spring 2014; period 2—Summer 2015; period 3—Winter/Spring 2015; and period 4—Spring/Summer 2015. In the results, whenever the period in not specified, the sampling was performed in period 1.
For each site of the experiment, a survey was carried out by systematic sampling in a regularly spaced grid of 3600 m2 (30 m × 34 m). The points were the vertices of the grid, as shown in Figure 1 (15 m between points and 17 m between lines on the grid), totaling 9 georeferenced points in five sites (totaling 45 sample points). At each grid point, composite soil samples were collected in the soil layers of 0–0.05, 0.05–0.20, and 0.20–0.40 m, totaling 135 samples per period (Figure 1).
Soil samples for chemical, granulometry, particle density, and biological characterization were with disturbed structure. Core samples were collected for bulk density, porosity, and water retention determinations. Clods were sampled for aggregate stability analysis.

2.3. Soil Chemical Analysis

Soil chemical analyses carried out include pH in water (1:2.5 ratio), measured with a pH meter; available P and K, extracted by Mehlich-1 solution and determined by espectrocolorimetry; exchangeable Ca, Mg, and Al, extracted with KCl and determined with atomic absorption, all according to the methodology proposed by Tedesco et al. [34]. The H + Al was determined through the mathematical relationship with TSM-Santa Maria buffer, according to Toledo et al. [35]. Total organic carbon (TOC) was determined by wet digestion with a mixture of potassium dichromate and sulfuric acid under external heating, according to Mebius [36].

2.4. Soil Physical Analysis

2.4.1. Granulometry, Soil Bulk Density, and Particle Density

Particle size distribution was determined with the pipet method [37], according to Stokes’ law, after dispersion on a horizontal stirrer of the suspension with chemical dispersant 6% NaOH for 4 h [38]. Bulk density (Bd) was calculated from core samples, and particle density (Pd) was determined by the volumetric flask method as modified by Gubiani et al. [39]. Total porosity (Tp) was calculated by the expression Tp = 1 − Bd/Pd, and the macroporosity (Map) by the equation Map = Tp − Mip.

2.4.2. Soil Water Retention Curve, Macroporosity, and Microporosity

Initially, the soil samples were saturated by capillarity for two days. After saturation, they were drained at tensions of 6 and 10 kPa in a sand column [40,41] and at tension of 100 kPa in Richards chambers [42]. Soil water retention at tensions of 500, 1000, and 1500 kPa was determined in a psychrometer, using the WP4 dew point potentiometer [43].
After reaching saturation, the samples were placed on a tension table at 6 kPa. Subsequently, they were taken to the Richards extractor (porous plate) to determine the water retention curve in the soil. Finally, the rings were dried in an oven at 105 °C until constant weight, to determine the dry weight. Microporosity (Mip) was calculated from the water retained at 6 kPa.

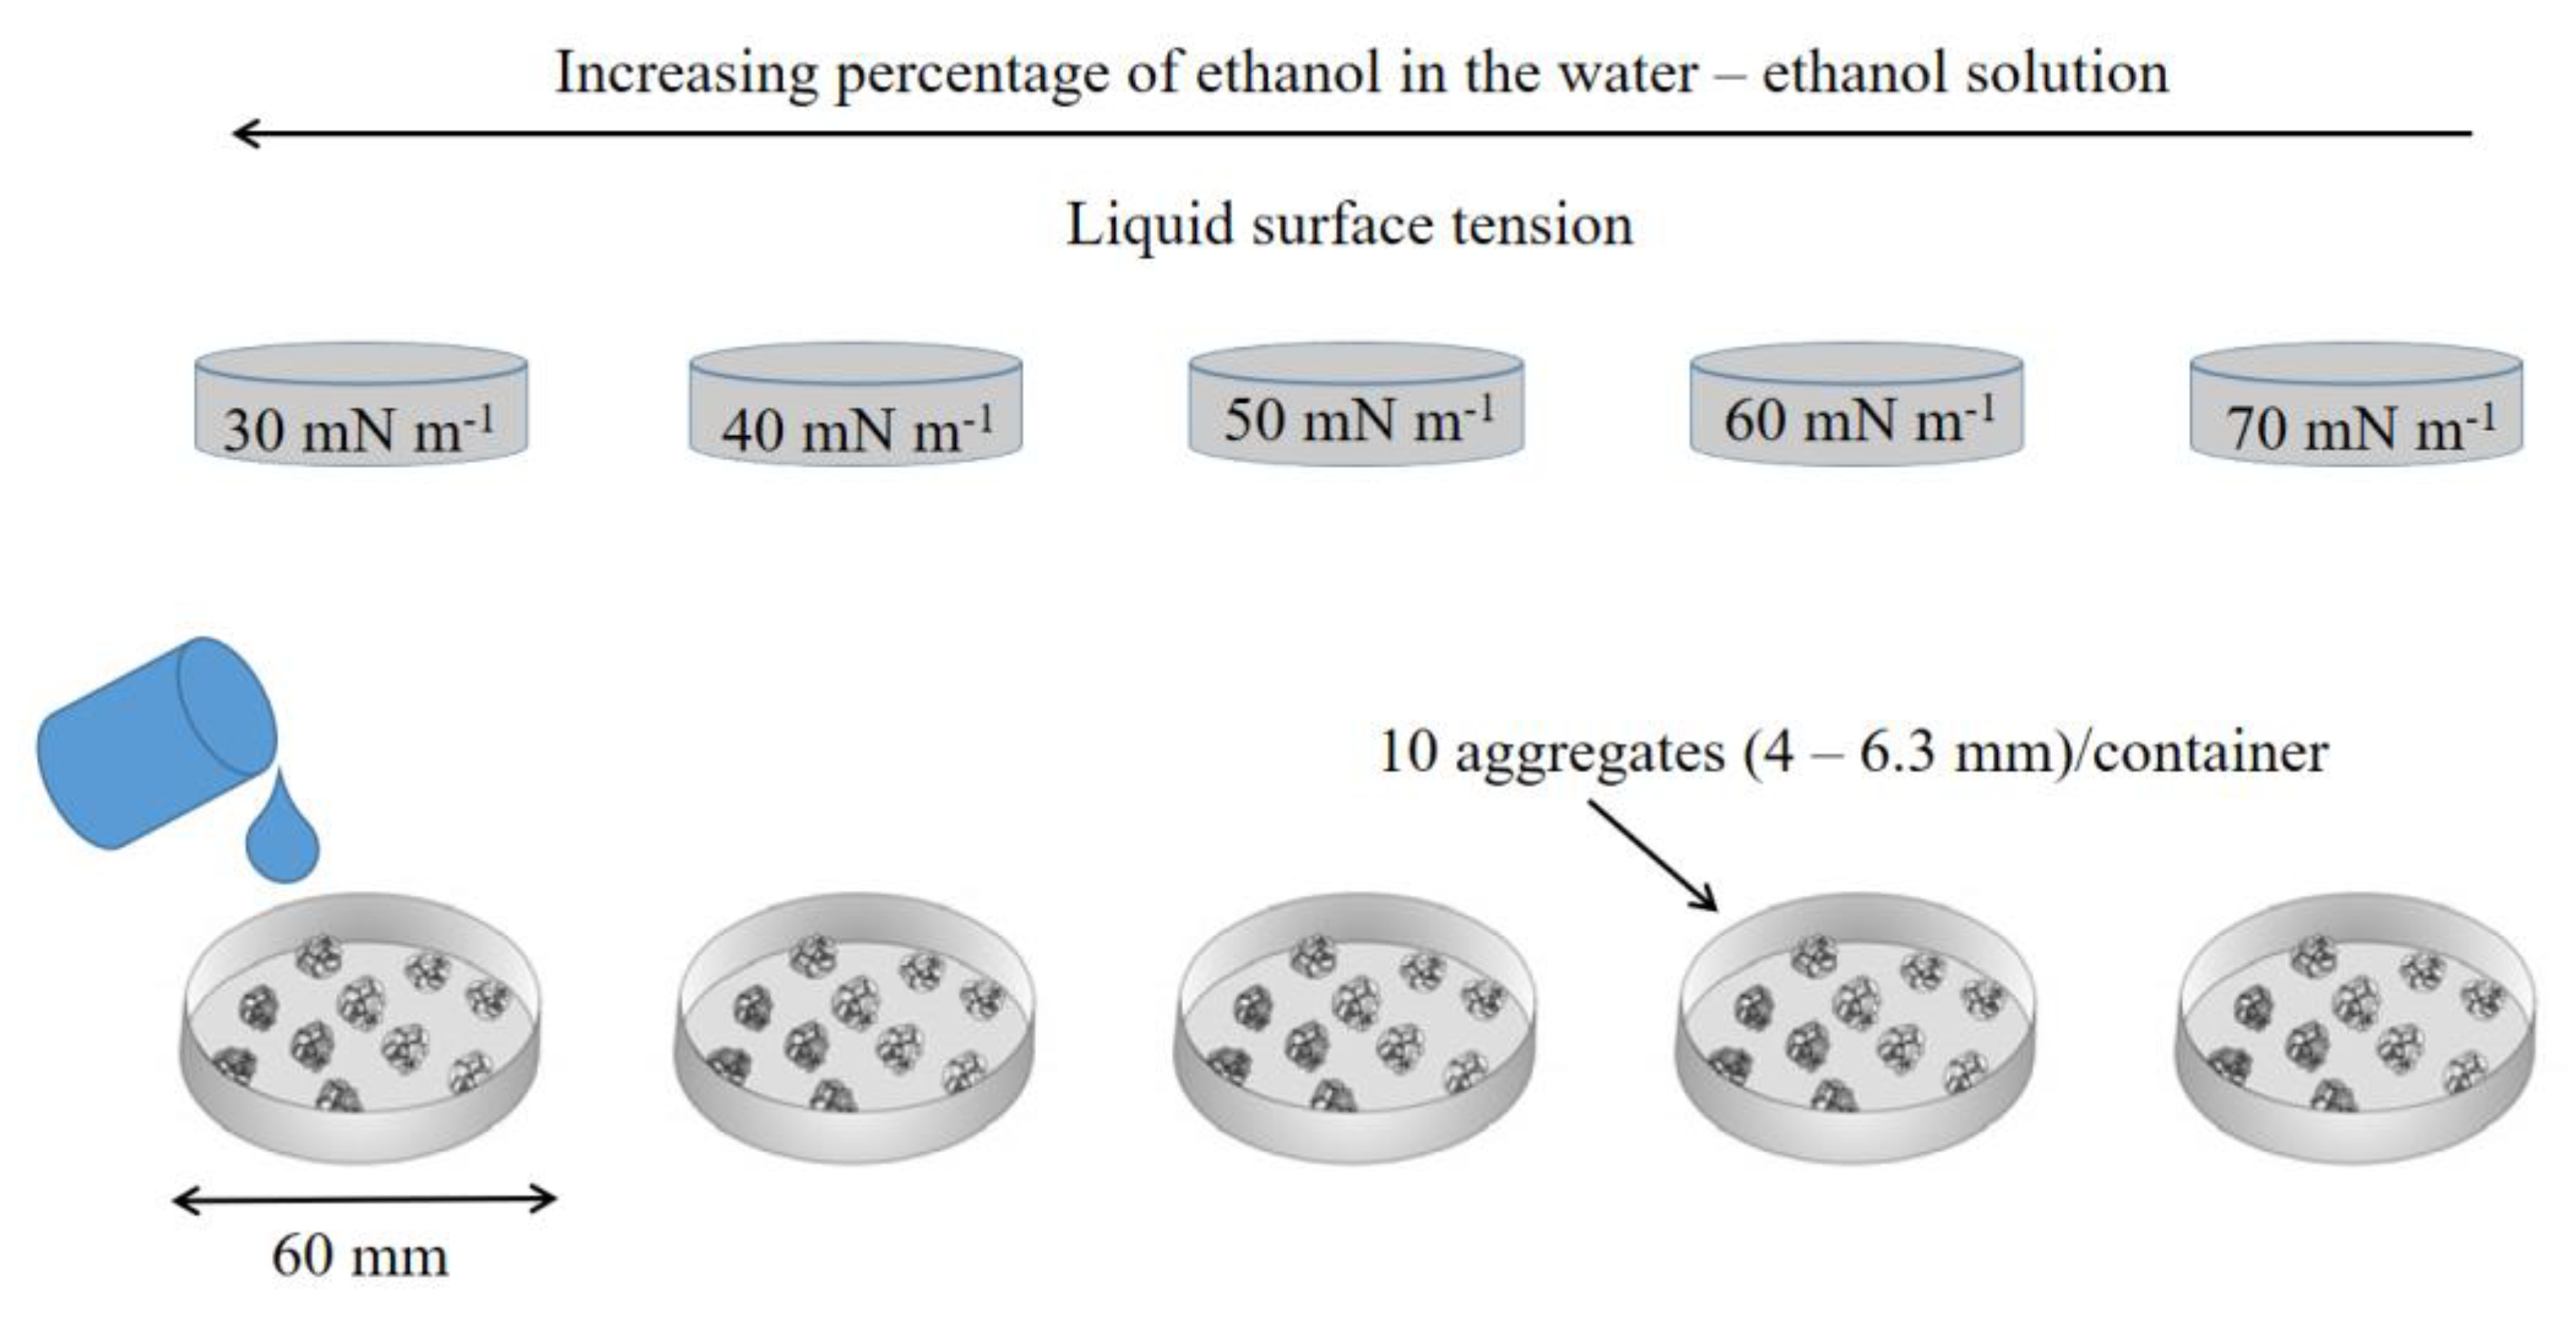
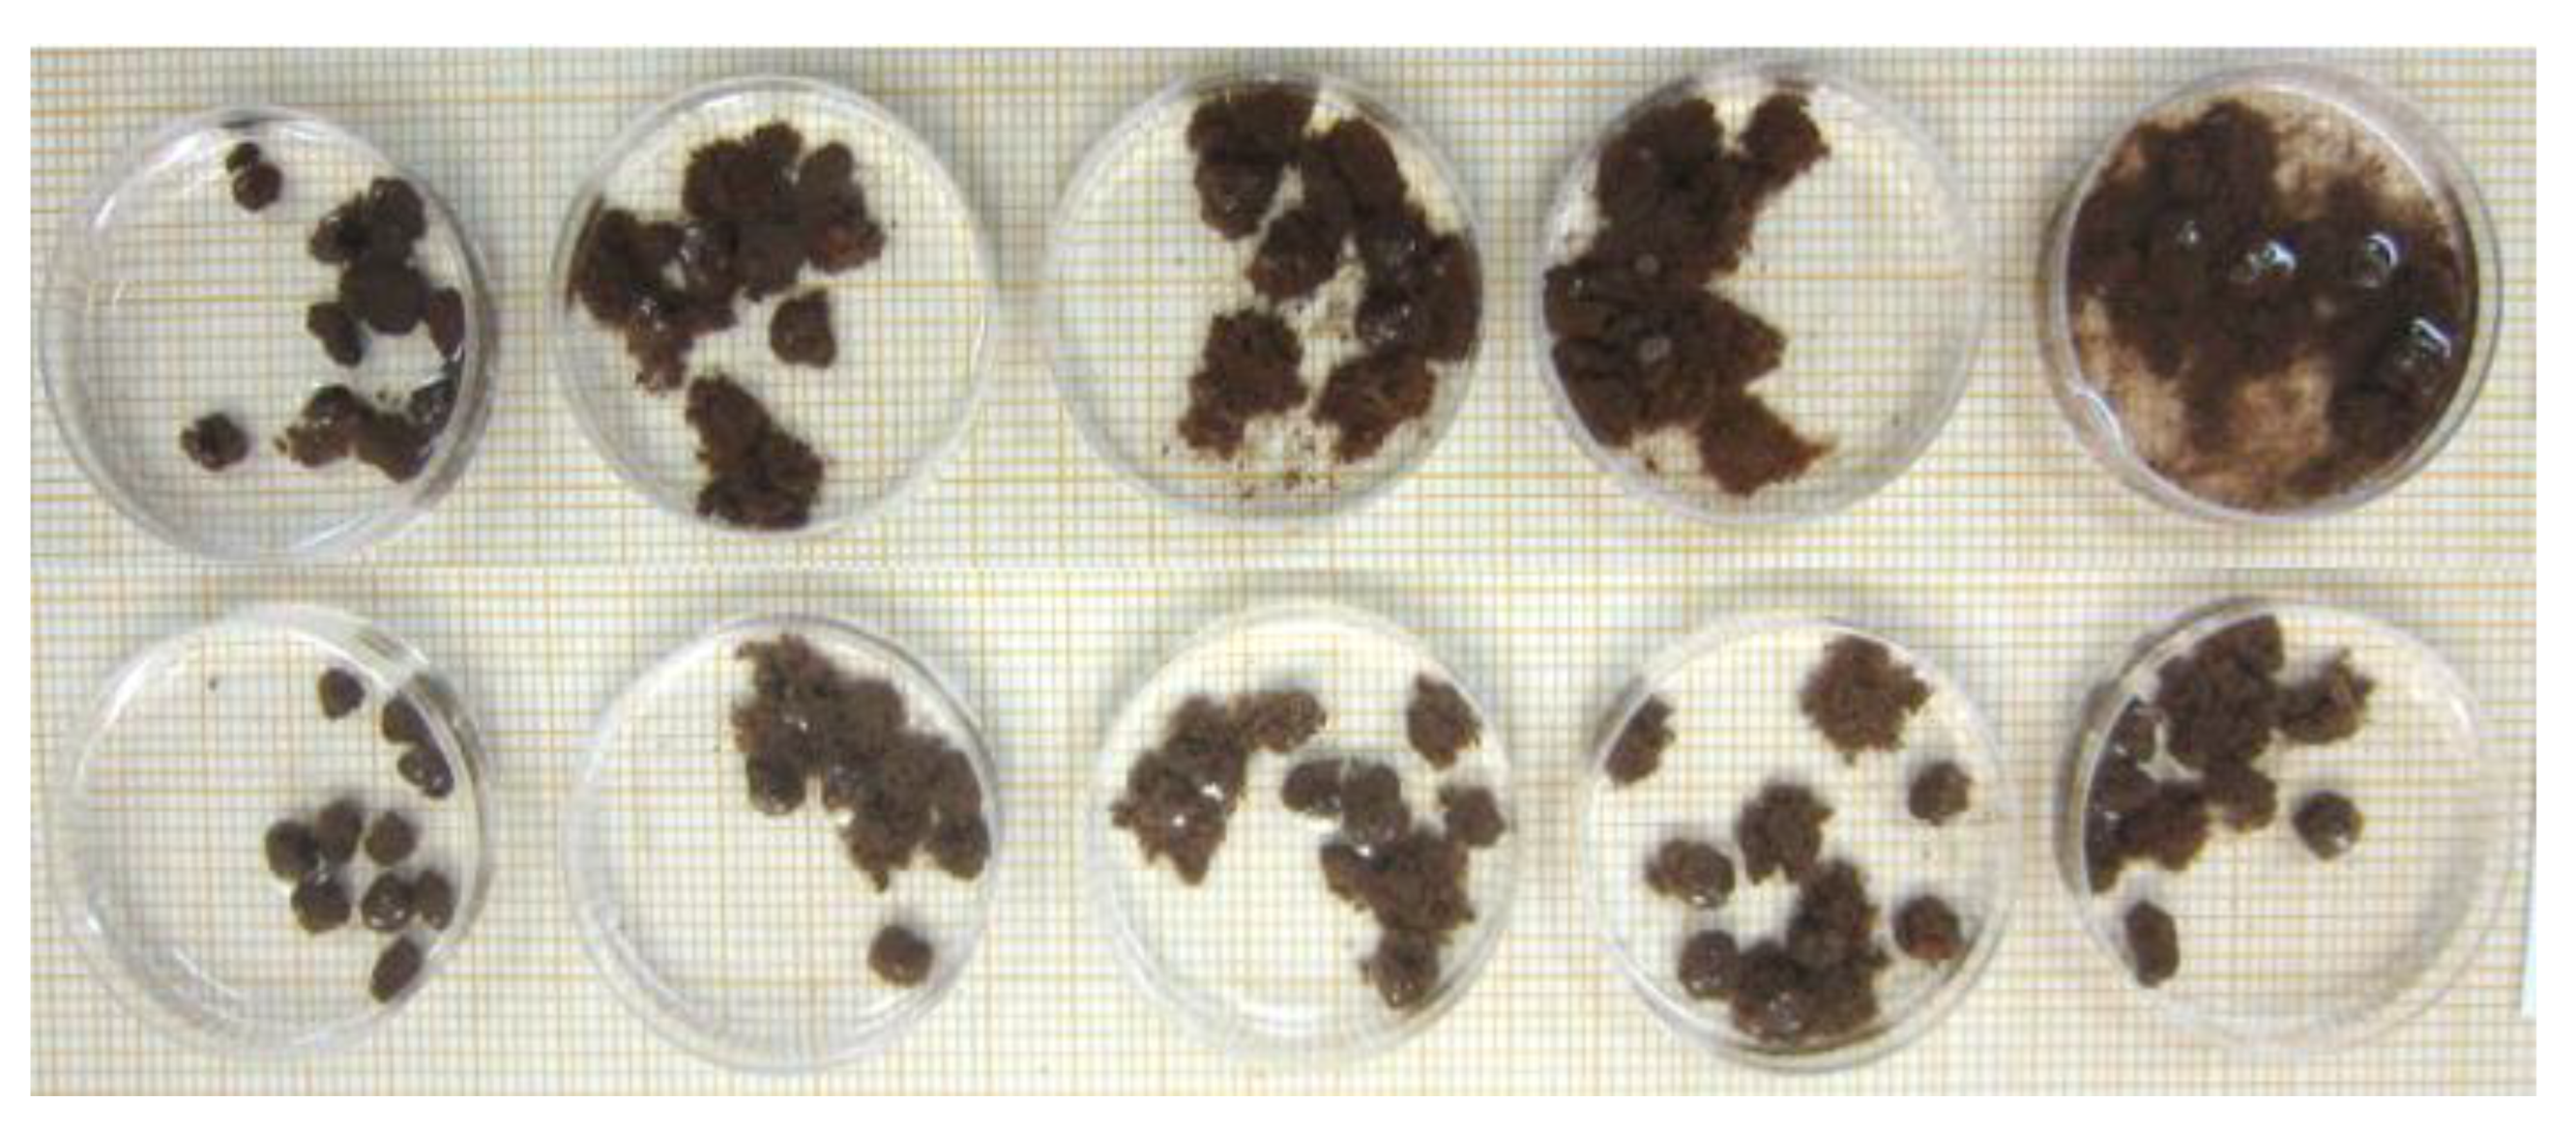
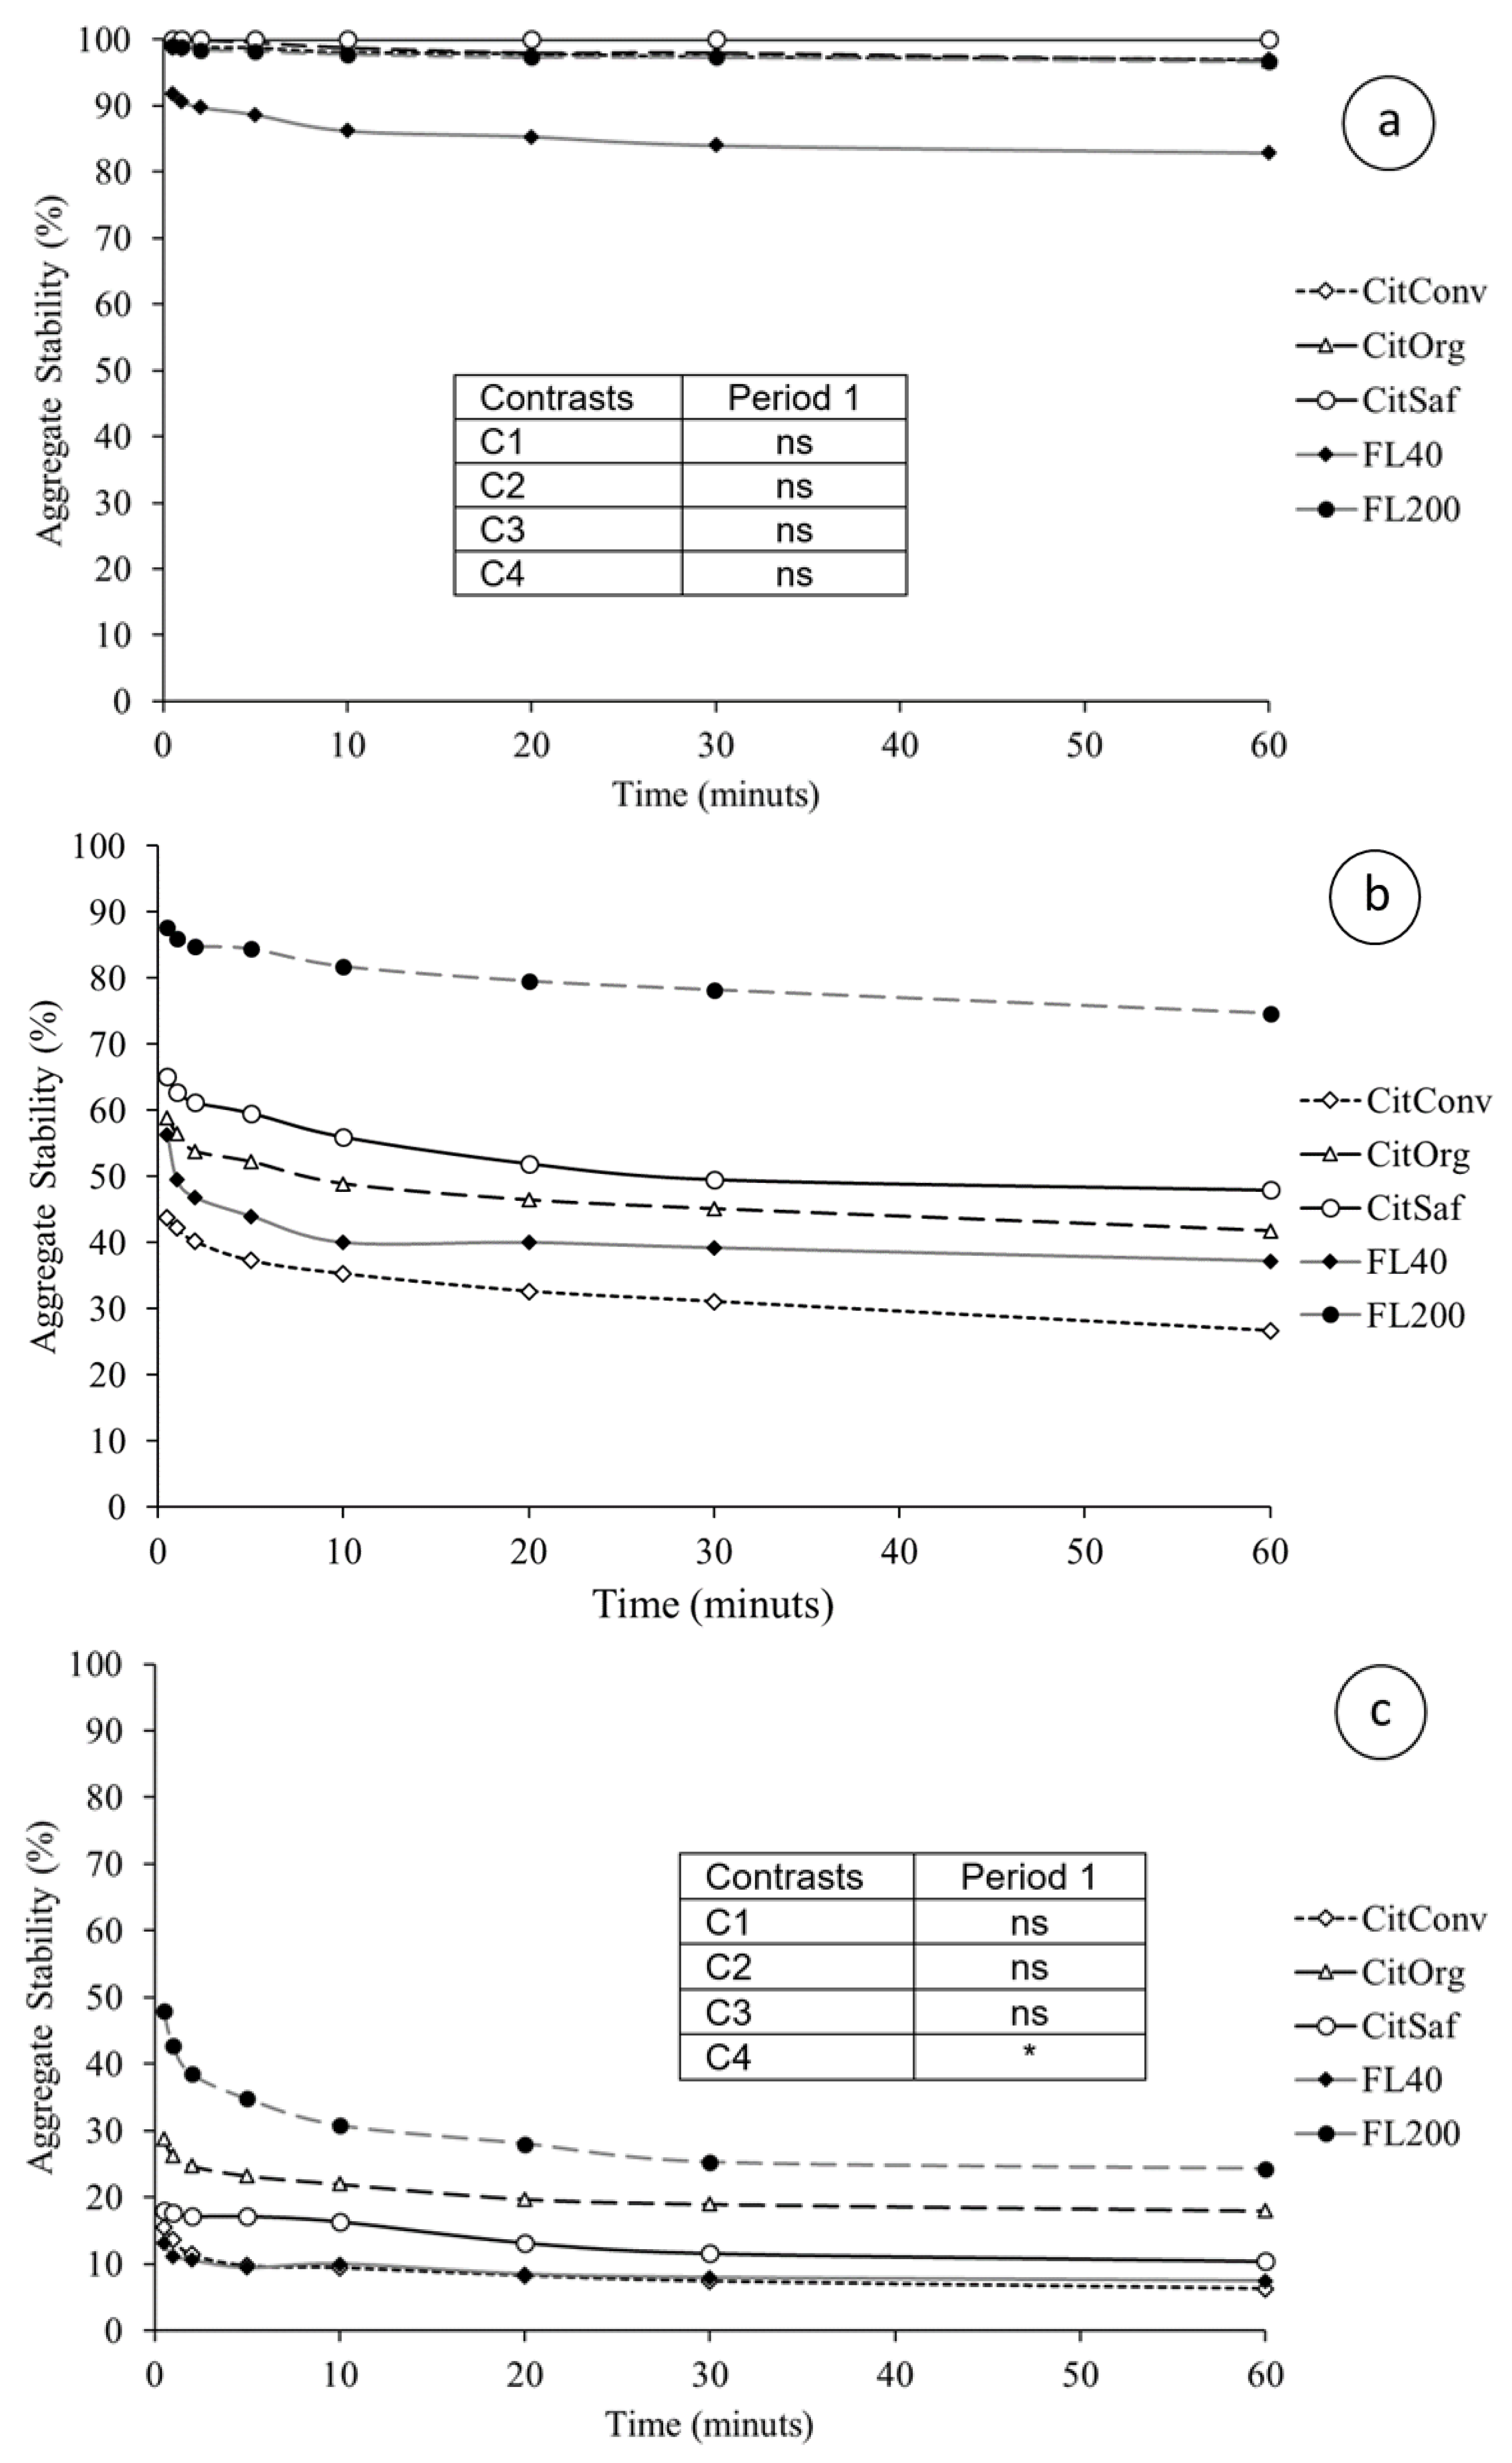
2.4.3. Stability of Soil Aggregates

Aggregate stability was determined using clod field samples, with manual crushing and sieving to a size between 4.0 and 6.3 mm. Stability determination was performed using the procedure developed by Goebel et al. [44], using the immersion of aggregates in ethanol–water solution with different surface tensions. The ethanol–water solutions were 47.0%, 19.9%, 10.2%, 4.7%, and 0.9% (by mass), that is, surface tensions of 30, 40, 50, 60, and 70 mN m−1. The surface tensions of the ethanol–water solutions were determined using an electronic scale with the Du Noüy ring method, cited in Goebel et al. [44].
Ten aggregates from each soil were selected and placed in Petri dishes with a diameter of 60 mm. Simultaneously, 15 mL of each solution was added according to the scheme in Figure 2. The changes in the structure of the aggregates were analyzed in photographic images at times of 0.5, 1, 2, 5, 10, 20, 30, and 60 min of immersion, obtained with a digital camera (Figure 3). After 30 min of immersion, the number of intact aggregates was counted on each plate (C = 1 to 5), and the percentage of aggregates (n = 50) was calculated. The stability of aggregates was determined by the aggregate stability (AS) index:
AS: (∑C1 to 5 A) × (100/n)
where c represents each dish, A is the number of intact aggregates per dish, and n is the total number of aggregates. High values indicate strong stability of the aggregates.

2.5. Biological Analysis

2.5.1. Hydrolysis of Fluorescein Diacetate (FDA)
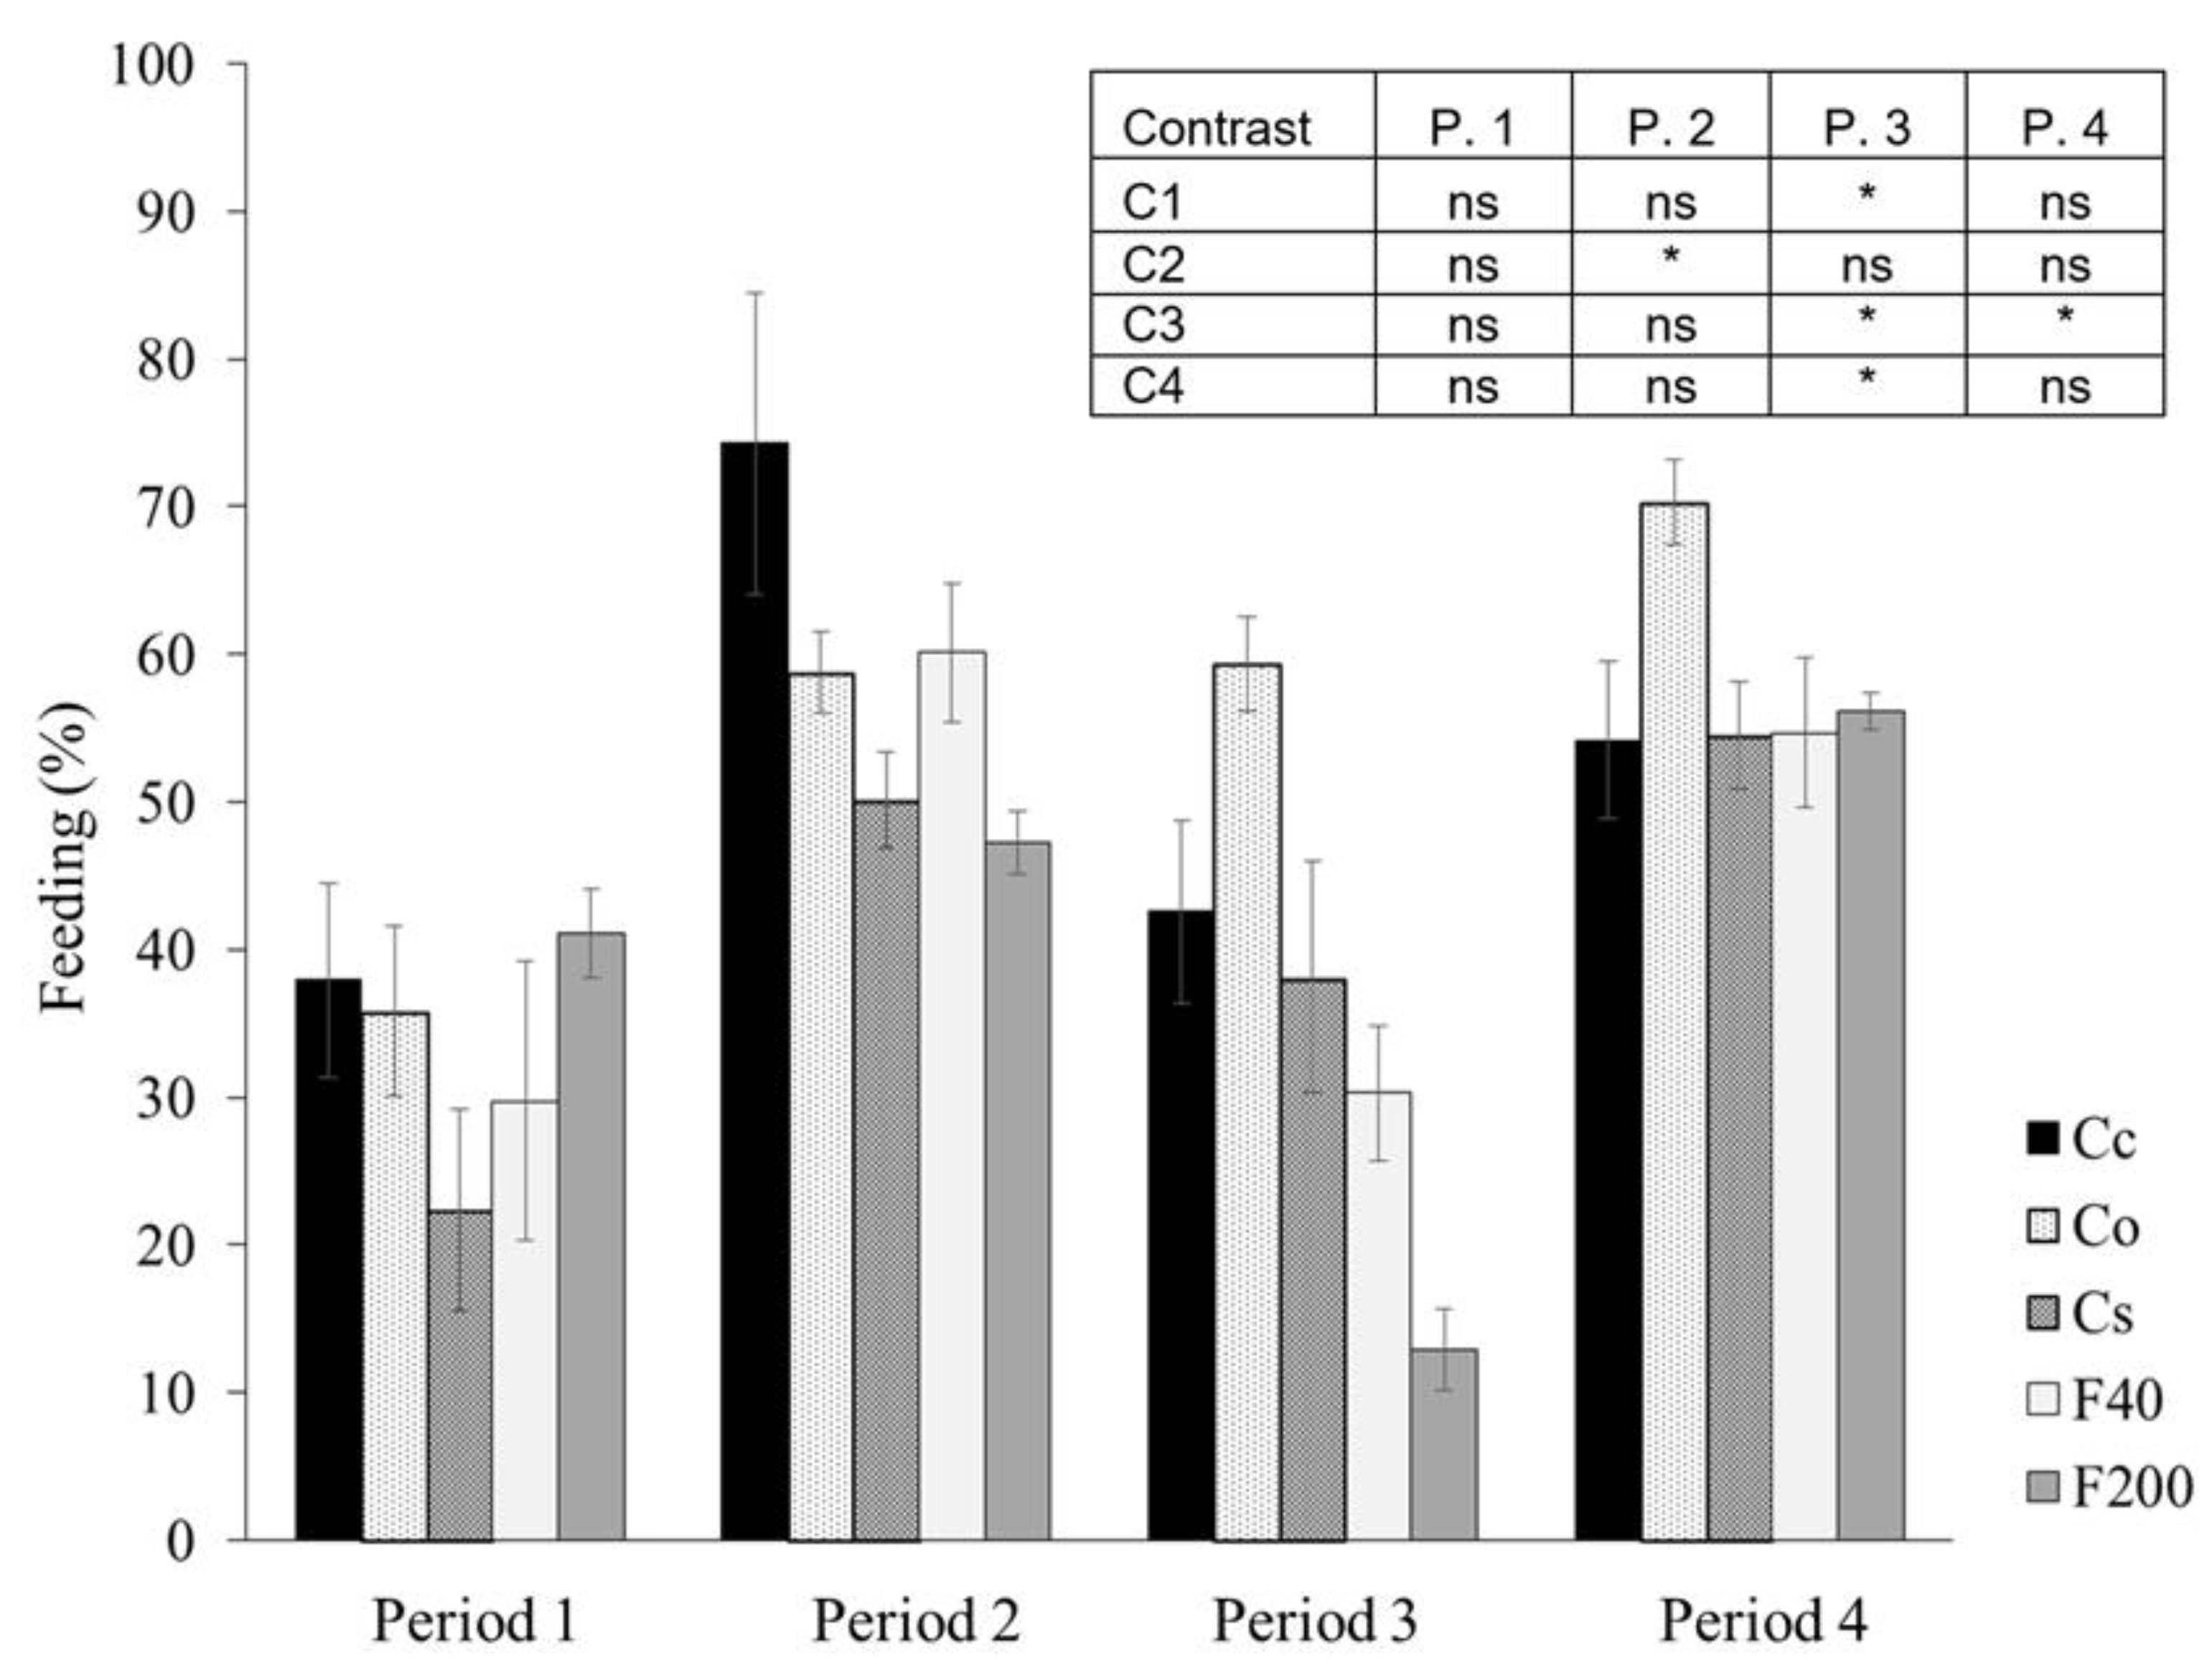
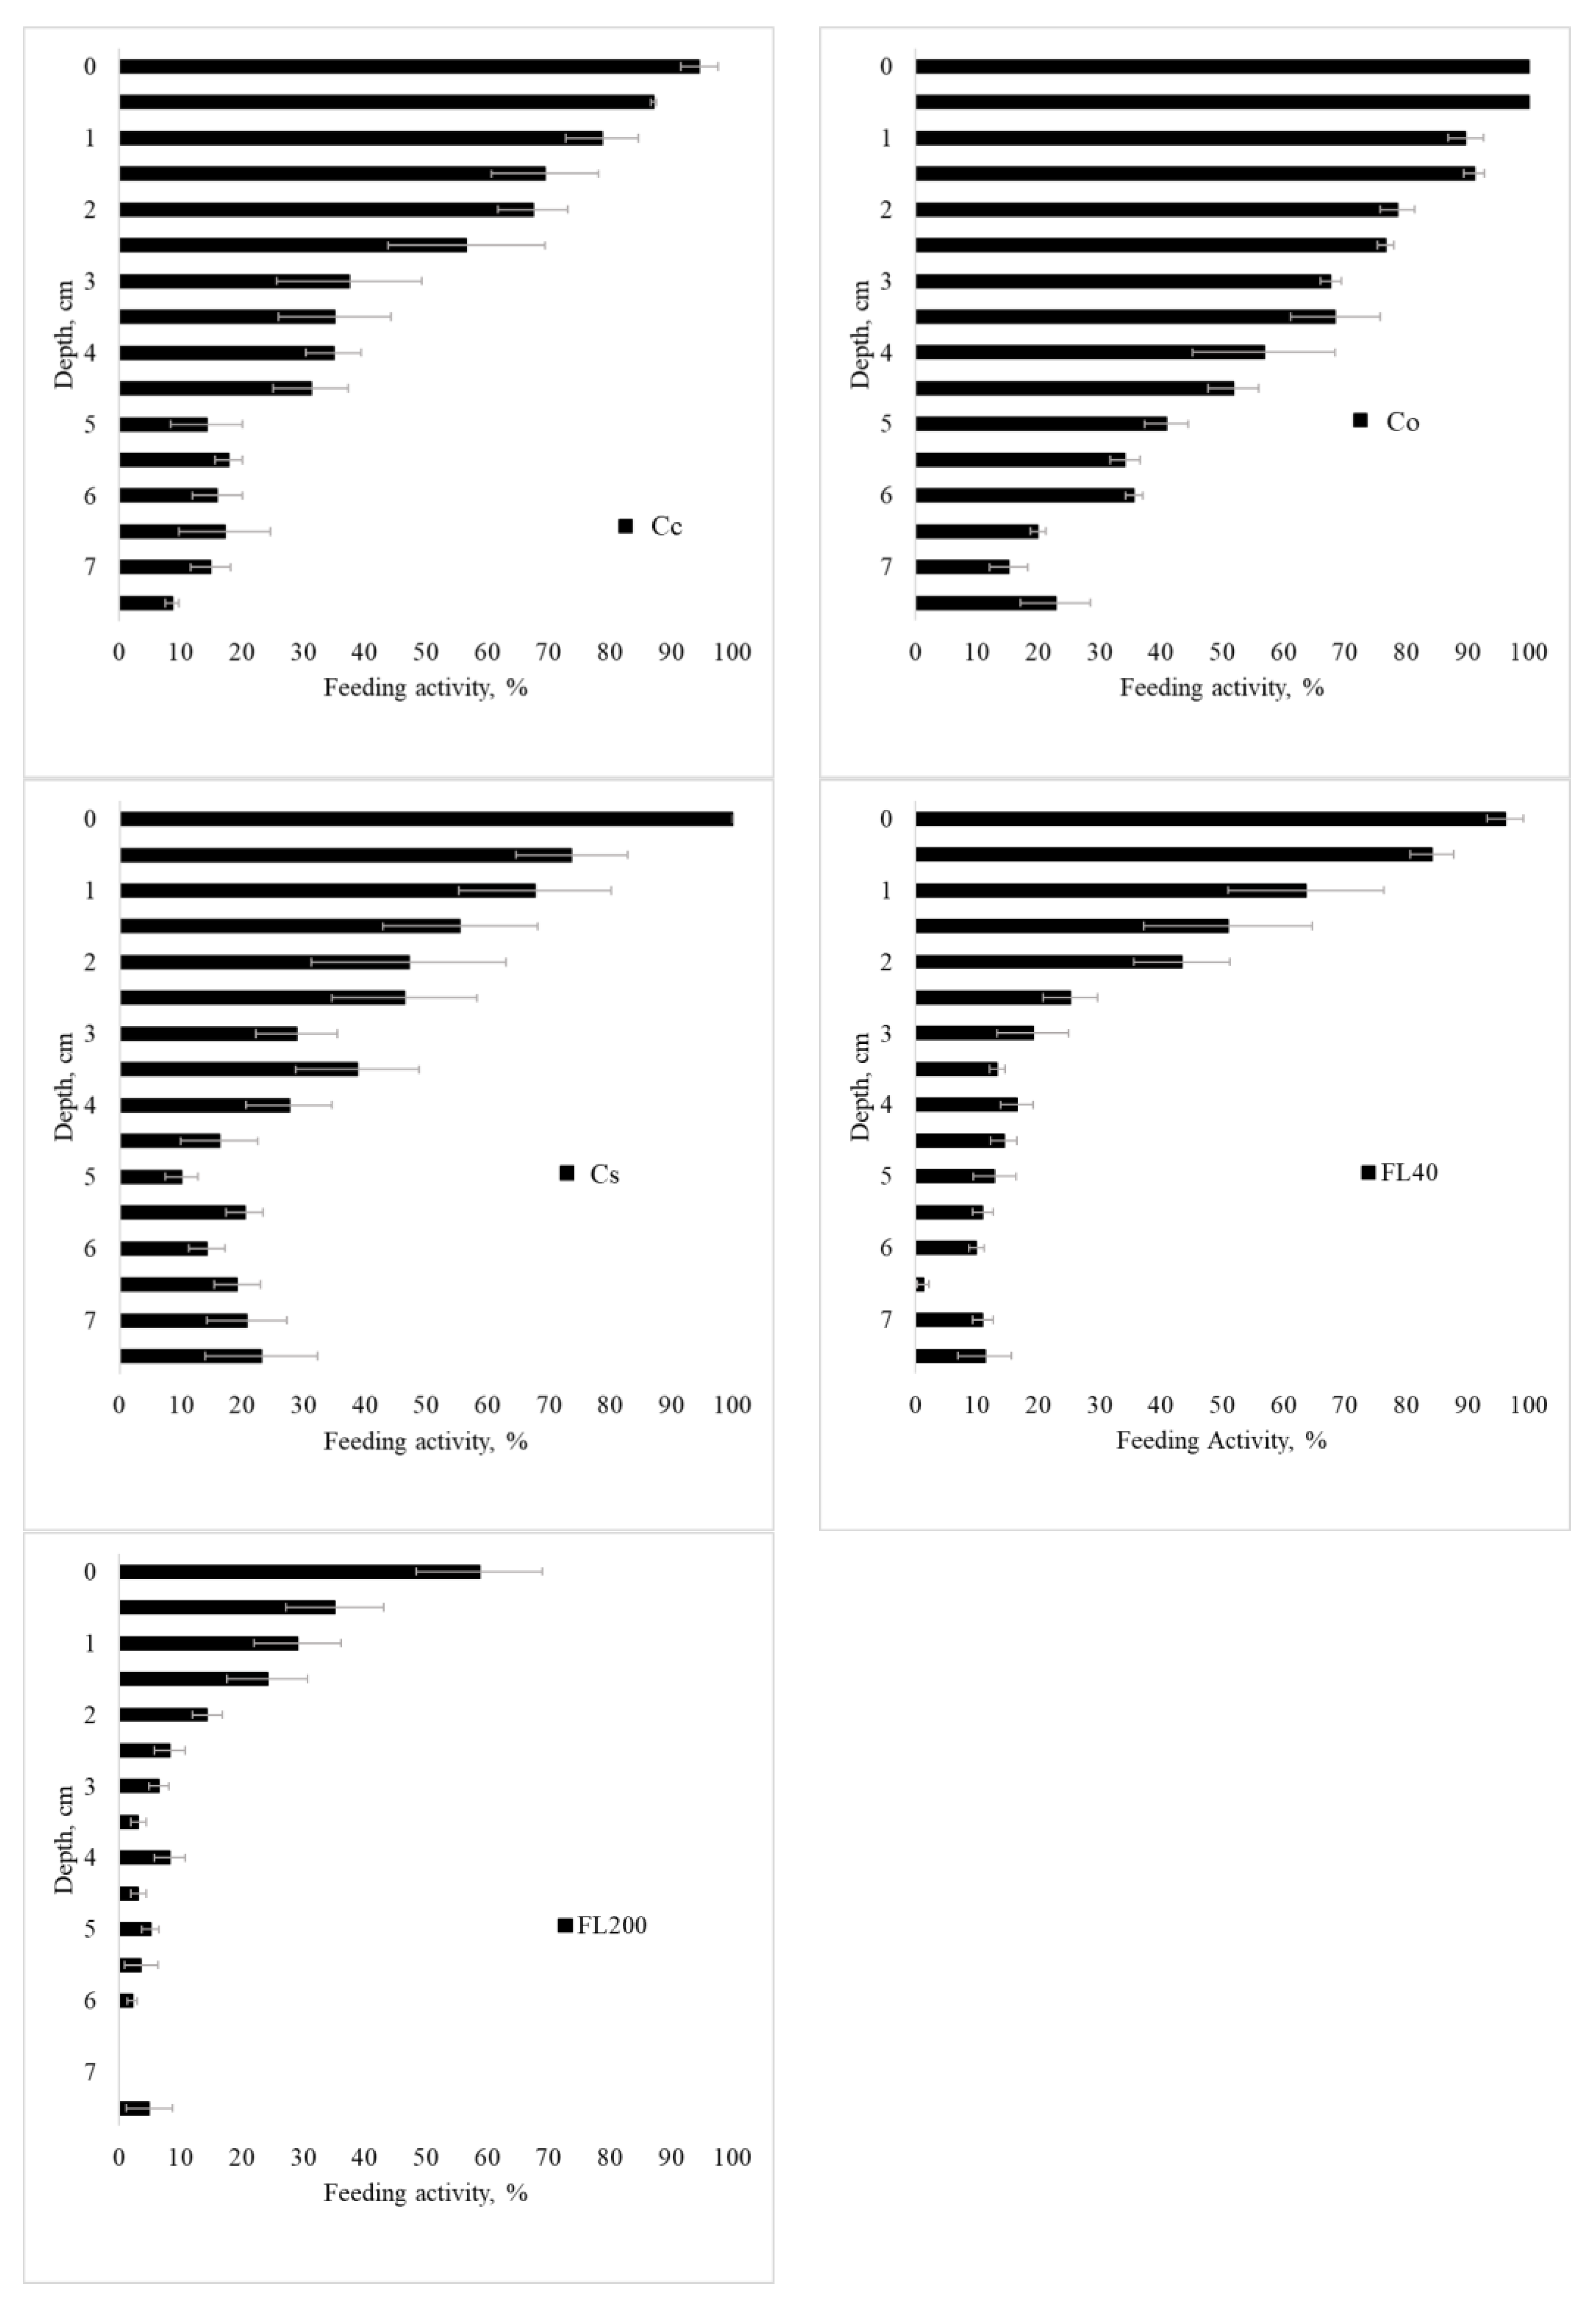
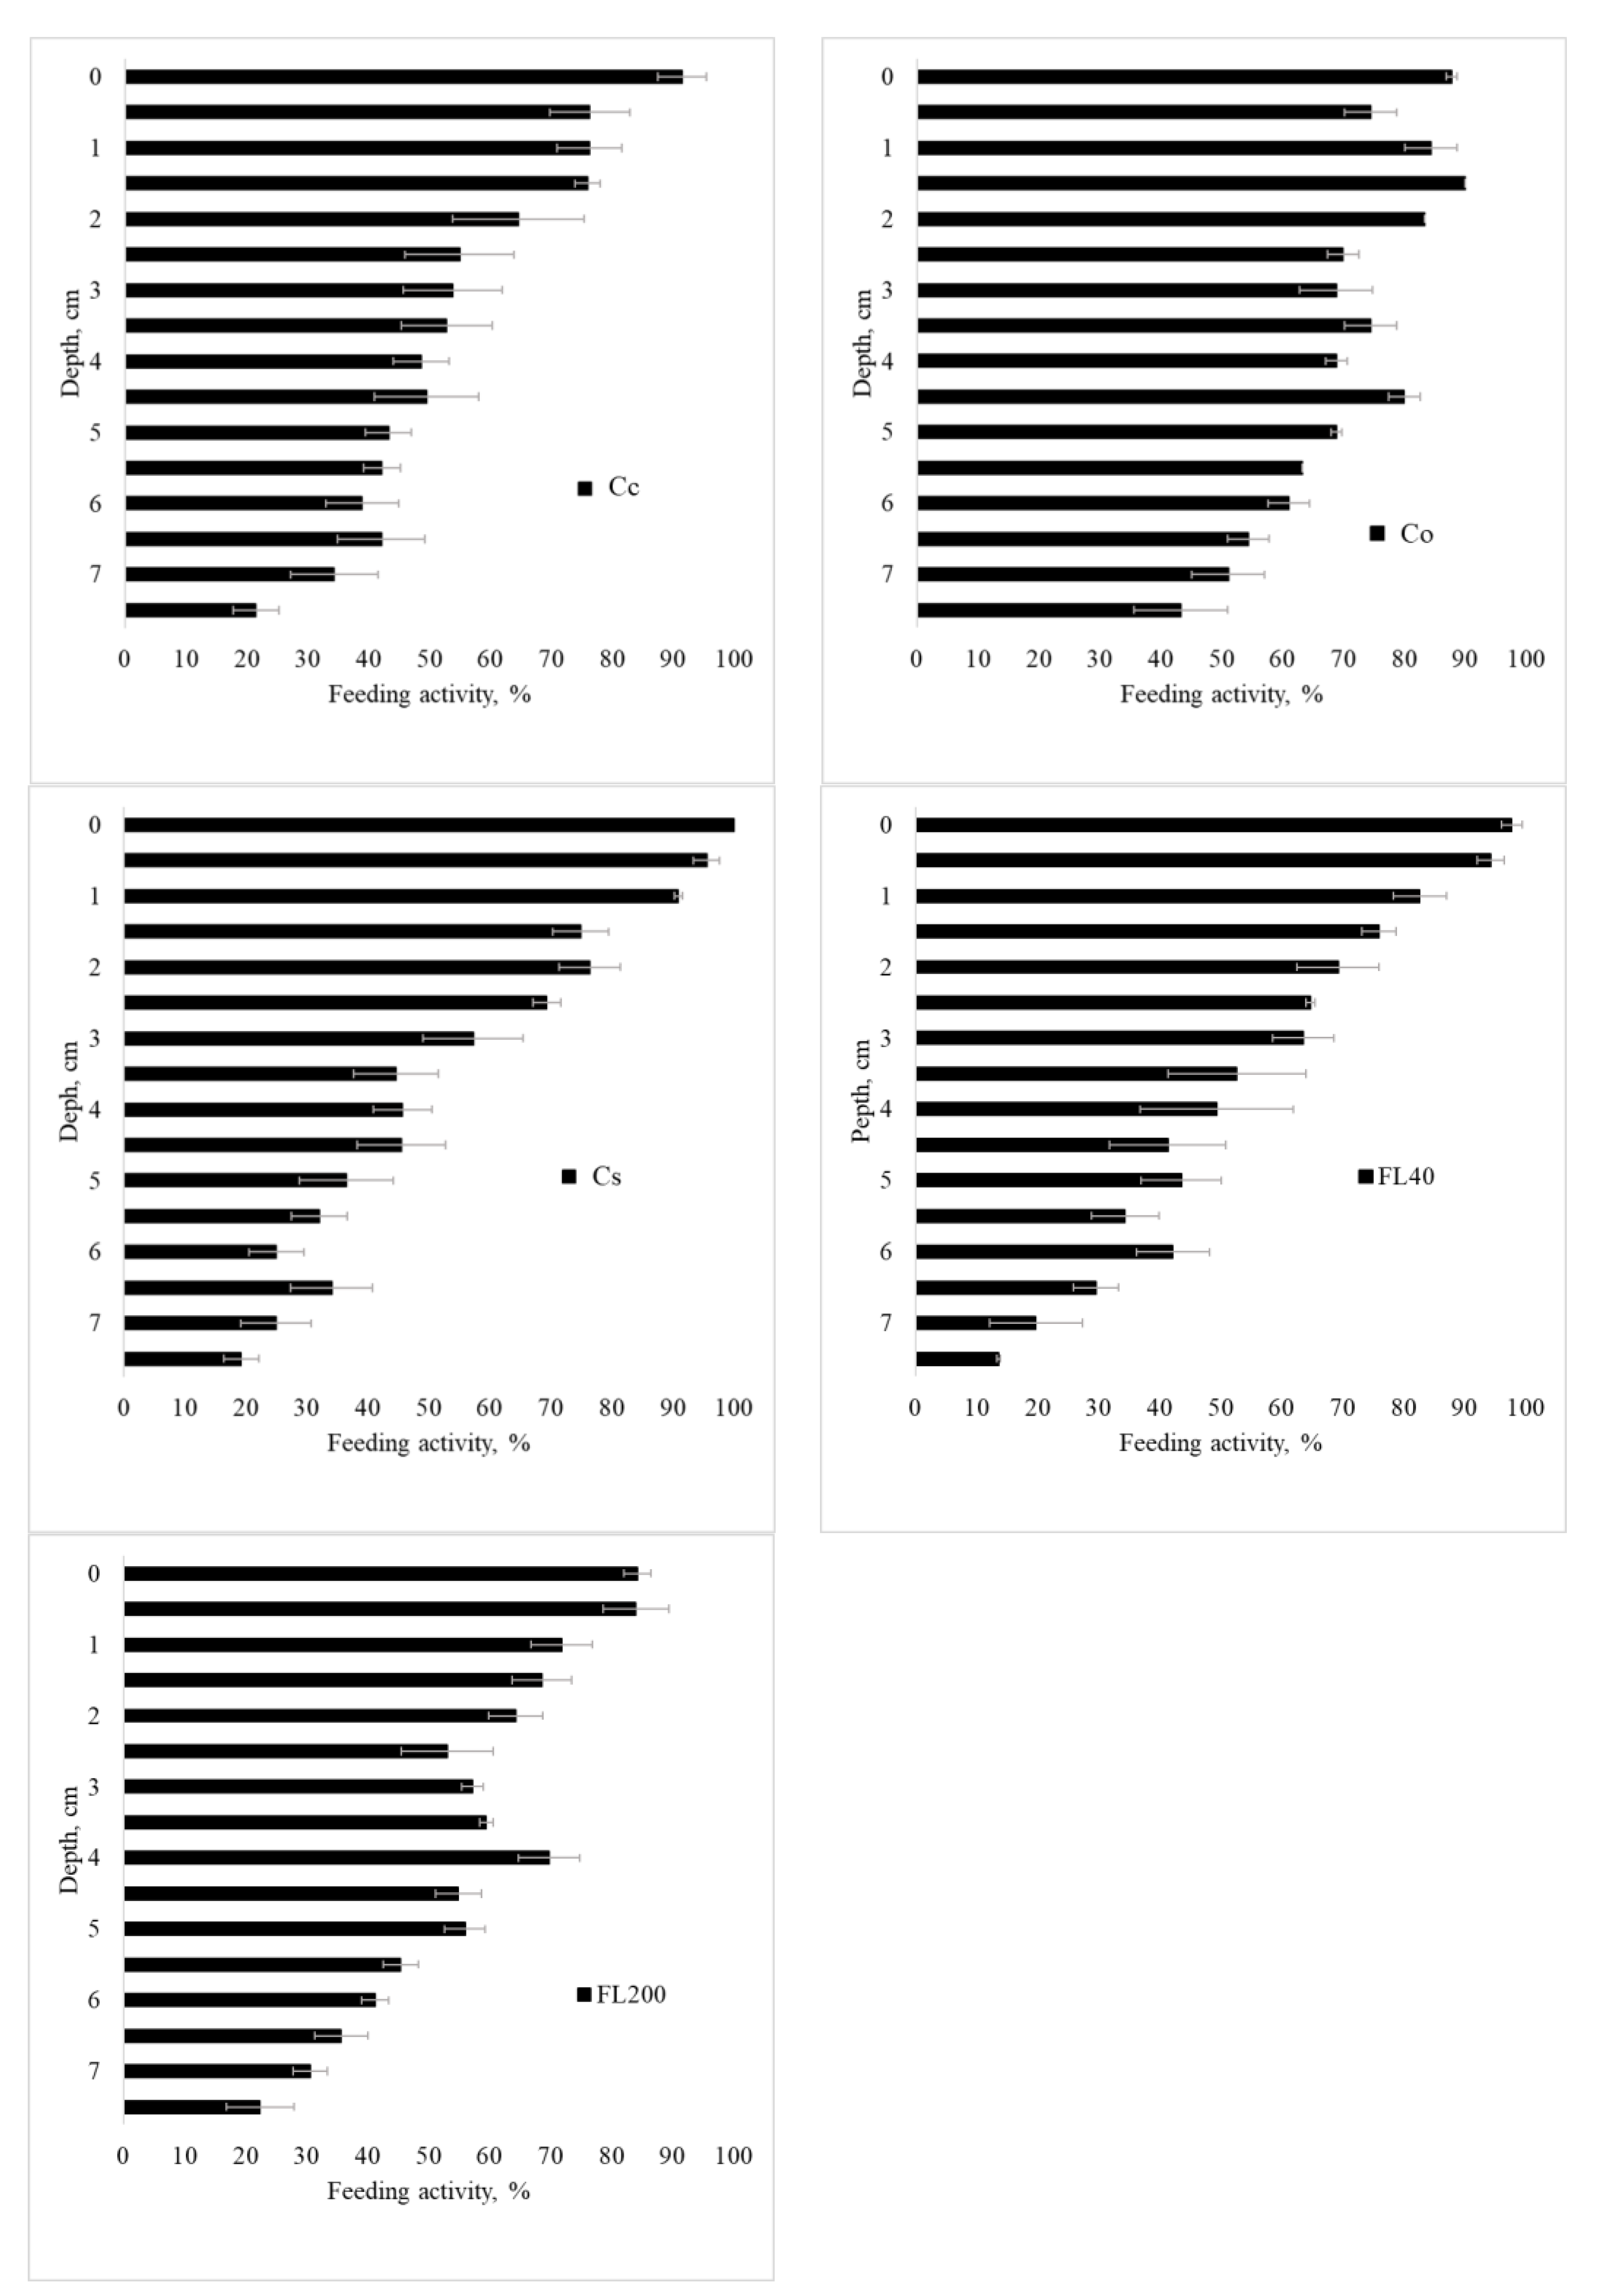
The methodology of Green et al. [45] was used with the following adaptions. In triplicate, 1 g of soil was incubated with 20 mL of 60 mM sodium phosphate buffer at 25 °C for 15 min under agitation at 100 rpm. After this period, 100 μL of the 4.8 mM FDA solution was added. The samples were stirred for 1 h 45 min (100 rpm, 25 °C), and then 20 mL of acetone was added to each flask, and 4.8 mM FDA solution to the control samples. These samples were centrifuged at 6000 rpm for 5 min and filtered through filter paper.
The intensity of the yellow color was measured in a spectrophotometer (λ = 490 nm). The fluorescein concentration was calculated using a standard curve prepared with known fluorescein concentrations (1, 2, 3, 4, and 5 μg of fluorescein mL−1). Enzyme activity was expressed in μg of fluorescein released per gram of dry soil (μg F g−1 dry soil) per hour.

2.5.2. Bait Blade

To determine the feeding activity of soil organisms, the Bait blade method proposed by Törne [46] was used. The method consists of a set of polyvinyl chloride (PVC) blades, 120 mm long, 6 mm wide, and 1 mm thick, with 16 holes 2 mm in diameter, spaced 5 mm apart; see Figure 4 [47]. As a substrate, a moistened mixture of powdered cellulose (70%), wheat flour (27%), and activated charcoal (3%) was used [47], with which the holes were manually filled. The method was chosen due to its low cost, simplicity, efficiency, and its ability to not cause disturbances in the soil and landscape [48,49].
Twenty-four slides were installed in 1 m2 at each sampling point. The blades remained in the soil until the site showed consumption of approximately 50% of the holes, after which they were carefully removed. The residence time of the slides in the field was 21 days. In each hole, the substrate was evaluated as not consumed (0%) or completely consumed (100%), with the aid of a bench magnifying glass.

2.6. Statistical Analysis

Since we sampled different sites, there are no true field replications. Thus, the statistical analysis consisted of orthogonal contrasts (Table 1).

3. Results

3.1. Soil Chemical Properties

Ecologically managed sites Co and Cs had high pH in all layers studied and all periods, while the conventionally managed site Cc had higher active acidity, which increased considerably with depth (Table 2). The farmer who carried out the management in the Co and Cs sites reported that, at the beginning of the orchard fertilization management, compost doses above 40 Mg ha−1 were applied at the site for several consecutive years, while the conventional management, by the application chemical fertilization, showed an increase in acidity, as shown in Table 2. This behavior was also observed when analyzing the periods separately (Table 3). The forest sites showed high acidity. When considering the soil type, the natural condition of the soil involved acidity at an average level (Table 2 and Table 3).
Available phosphorus in Co and Cs orchards showed high levels on the surface layer, then decreasing from the 0.05 m layer. Such surface contents were higher than in the Cc site, while in the 0.05 to 0.40 m layer, it was higher than in the other sites. The sites had low CEC values, which arises from the soil condition: a sandy soil with low contents of carbon (Figure 5) and clay (Table 3).
Soil CEC (Table 2) on the surface (0–0.05 m) was found to be higher in biodynamic management orchards (Co and Cs), which had received compost since 1998, than in conventional orchards, by analyzing contrast C2. Possibly, soil organic carbon content, 5.00 and 8.36 dag kg−1, respectively, contributed to the observed CEC values. These values were higher at the surface of sites under organic management, and with increasing depth, these values decreased in all sites. Forest sites were superior compared with citrus crops, according to contrast C1. The conventional management Cc presented the lowest averages of carbon contents in the soil, although the contrast C2 in the various periods and layers was not significant.

3.2. Soil Physical Properties

All sites presented high levels of sand, above 81.0%. Only F40 in layer 0.20–0.40 had a sand content of 77.5%. The low clay content, between 5.4 and 16.8%, is reflected in the low CEC shown in Table A1, a natural condition of this soil. Citrus cultivation sites had lower clay contents in all layers.
Biodynamic management orchards (Co and Cs) had low soil density (Bd), which is reflected in the results for total porosity (Tp) and microporosity (Mip). Some soil Bd values were less than 1 g cm−3, Tp had an average of 0.63 m3 m−3, and microporosity varied between 0.35 and 0.40 (Table 4). A significant effect was found in the soil surface, justifying the ecological management with compost fertilization and organic residue disposal. Forest sites had average values for the mentioned properties, while the conventional cultivation Cc presented the lowest quality, with Bd equal to 1.40 g cm−3, Tp at 0.47 m3 m−3, and Mip at 0.27 m3 m−3. The greatest Tp was observed in F200. With soil depth, there was an increase in bulk density and reduction in porosity. Microporosity reduced with greater intensity than macroporosity.
Soil water retention curves (Figure A2) show Co and Cs sites had, on the surface, a greater retention capacity than the other sites for all water tensions (matric potentials), followed by F200. In the 0.20–0.40 m layer, F200 shows superior retention capacity at the beginning of the curve (lower tensions), but as the matrix potentials increase, the sites showed a similar behavior.
The stability of aggregates refers to values for the time of 30 min of contact with the tensioning solution. Figure A3 and Figure A4 show the stability of soil samples as a function of time, i.e., the persistence and kinetics of disaggregation. Persistence of disaggregation was measured after 30 min of immersion (Table 5). There was no statistical difference between sites for the layers studied. All showed high stability, above 84.0% aggregation in period 1 (Spring 2014), a value considered high for the proposed method. In period 3 (Winter/Spring 2015), only the F40 site was lower than the others on the soil surface. In the 0.05–0.20 m layer, the contrasts were not significant; again, the similarity between sites is noted, and the values in this part represent low stability, which decreases even more in the 0.20–0.40 m layer. Only the F200 site had higher stability. The observed behavior was similar in the sites between periods 1 and 3.

3.3. Soil Biological Properties

Soil biological properties are represented by fluorescein diacetate hydrolysis data (FDA) and soil fauna feeding activity (Bait blade) for the four periods. The enzymatic activity between the periods showed a dynamic behavior, with levels that reveal low alteration along the study periods. In the first two periods, the levels were lower, but they increased until the fourth period (Table 6).
Biological activity in soils decreased with depth. Higher values of enzymatic activity were observed in forest sites due to the large amount of organic material in the litter, but this was only significant in period 4 (contrast 1). Regarding the agriculture sites, an effect similar to the forest one occurred in the first soil layer in the organic citrus and agroforestry sites, due to the frequent application of compost in both sites, and in the second layer by the input of material from adjacent trees, while the cultivation of citrus in the conventional system showed lower contents in all periods (contrast 2, in Table 6).
Soil fauna feeding activity data are presented graphically as an average of the entire set of holes per slide. An oscillatory biological effect occurred between periods, except for the Co system, which had gradually increased activity (Figure 6). The sites did not differ among themselves in the periods. Only Co was greater than Cs in periods 3 and 4 (contrast 3). Only in period 3 (Winter/Spring 2015), did sites F200 and F40 show lower values of feeding activity, while citrus sites were equal (Figure 6).
Feeding activity of the fauna according to the layer is presented in Figure 7, Figure A4, Figure A5 and Figure A6 for the seasons, use, and management systems. Food consumption has a gradient, with higher consumption on the surface and a decrease with depth. This result may represent a direct facilitation of biotic factors and greater biological activity in the first few centimeters of the profile; as one goes deeper into the soil, the biological activity decreases.
In the first period (Spring 2014, Figure 7), a similar behavior can be observed between the sites of citrus cultivation and the F40 forest site, with more intense consumption close to the surface and less intense at greater depth. A striking fact is the behavior of the F200 forest, in periods 1, 2, and 4, with a homogeneous consumption along the blade, which represents an active behavior of the fauna in the soil with biological stability. In the second period (Summer 2015, Figure A4), there was the highest general consumption among the studied periods. The Cc site had high consumption throughout the entire follow-up, while the Co, Cs, and F40 sites showed a consumption gradient. Regarding period 3 (Winter/Spring 2015, Figure A5), the feeding behavior was similar between the forest and agroforestry sites, with a gradient of high activity on the surface and little consumption at depth. Period 4 (Spring/Summer 2015, Figure A6) was similar to period 2 (Summer 2015).
The agricultural practices provide an understanding of the observed effects, including the high consumption in the blades in the Cc from the practices of mineral fertilization and application of desiccant pesticides. Sites with biodynamic management, with practices of maintenance of the herbaceous vegetation, i.e., basically mowing, provide more stability to the fauna present in the soil.

4. Discussion

4.1. Soil Chemical Properties

Soil pH, available P, and cation exchange capacity, being lowest in forested sites (contrast 1: forest < citrus) and highest in organic and agroforestry systems (contrast 2: Co + Cs > Cc), are consistent with the differences in organic and inorganic fertilization practices reported by the citrus farmers. High pH found in the biodynamic management sites (Co and Cs) shows a cumulative effect of compost use. Soil chemical balance is predominantly controlled by concentration and composition of solid phase, aeration, and pH [50].
An important phenomenon that may have contributed to acidity decrease, particularly toxic aluminum, is the formation of stable complexes with the applied organic matter with aluminum [50]. Soils with organic fertilizer management initially have lower pH than systems using synthetic fertilizers, but in the medium term soil pH reaches higher and more stable levels. Although pH decreases with organic N mineralization, there is usually a reduction in acidity due to aluminum complexation and increase in base saturation [50].
The biodynamic sites (Co and Cs) received about 40 Mg ha−1 of compost at the beginning of the orchard fertilization management and for several consecutive years, while the conventional management sites received only chemical fertilization. Many studies show an increase in soil organic matter in the soil surface caused by organic systems in different climatic conditions [51,52,53,54,55,56]. Differences in organic carbon for the different sites, decreasing with depth, is typical for most soils [10,12].
Organic carbon was highest in older forest sites (contrast 4: F200 > F40), which clearly shows the importance of forests in recuperating and/or maintaining increased soil organic matter, from the contribution of roots and aboveground material decaying and decomposing on the soil [57]. Agroforestry and organic citrus had more carbon than conventional citrus (contrast 2: Cs + Co > Cc), showing the contribution of forest materials to increasing carbonation [58,59]. An evident and combined effect was also the similarity in organic carbon content for agroforestry and organic citrus orchards (contrast 3: Cs ≅ Co), showing the importance of having a forest component intercropped with citrus crops.
Organic carbon is not physically and chemically protected in sandy soils [9], which may possibly explain the substantial decrease in organic carbon in Co and Cs in periods 2, 3, and 4 compared with period 1. Furthermore, organic carbon in non-tilled soils concentrates near the soil surface [10,12], thus reducing system differences with soil depth.
Hence, the biodynamic orchards (Co and Cs) have better soil chemical quality, namely soil pH, available phosphorus, cation exchange capacity, and soil organic carbon. These properties are fundamental for healthy, productive citrus orchards.

4.2. Soil Physical Properties

Soil bulk density in all layers was highest in forest sites (contrast 1: forest > citrus), particularly for lower-age forests (contrast 4: F40 > F200), and for conventional citrus (contrast 2: Cs > Co + Cs), associated with lower total porosity and increased microporosity, i.e., smaller pores, in deeper soil layers. The lower soil bulk density and increased porosity in the citrus orchard intercropped with trees shows the potential of agroforestry systems to improve soil physical conditions. Carvalho et al. [58] and Pilon [59] also observed lower bulk density in soils under agroforestry systems, because of increased biological activity in such systems [59]. Increased organic carbon content contributes to decreasing soil bulk density [58,59] and increasing soil structure stability [60].
Aggregate stability, highest in biodynamic citrus (contrast 2: Co + Cs > Cc) and in older forests (contrast 4: F200 > F40), shows the importance of searching agricultural systems with increased sustainability. Soil aggregation and soil organic matter are dynamic properties and quickly reflect land use and soil management [61,62]. Aggregation differences among systems decreased with some depth, since aggregation is a more dynamic and variable process in the upper soil layer because of increased availability of fresh organic matter, biological activity, root growth, and wetting–drying cycles.
The biological activity of fungi and bacteria has a positive influence on soil aggregation [60]. Moreover, soils with adequate surface coverage prevent or reduce the direct action of raindrops and overland flow [63,64], maintain more uniform soil moisture and temperature [65,66], and favor root system development [67] and microbial activity [68]. These conditions contribute to a more satisfactory environment for aggregation [69], improving the porous system and reducing bulk density.
Roots of tree species in agroforestry orchards and the herbaceous vegetation in organic citrus, with greater vigor and diversity, show the effect of organic management systems on soil structure and aggregation stability [60]. Roots stimulate soil aggregation by promoting the microbial population in the rhizosphere, supplying organic material, and promoting reorientation and approximation of soil particles and microaggregates [60].
High sand and low clay contents characterize the studied soil, with an average 10% clay, fitting into a soil class with low aggregate stability. Clay is one of the main cementing agents in soil aggregation in soils [70], where high clay contents also contribute to greater accumulation of organic carbon because of greater protection of soil organic matter under such conditions [71,72,73].
Furthermore, the sandy soil texture explains the observed low water retention and availability [74,75,76,77,78,79,80], requiring soil coverage to reduce water evaporation and augment organic matter to improve water retention. Greater retention capacity in the soil surface of biodynamic orchards (Co and Cs) for all water tensions (matric potentials), followed by F200, shows the importance of soil organic matter and structure in water retention and availability to plants [81,82].
Therefore, the biodynamic orchards (Co and Cs) have improved soil physical quality, particularly in bulk density, porosity, aggregation, and water retention and availability to plants, which contributes, to the establishment and maintenance of healthy, productive citrus orchards.

4.3. Soil Biological Properties

The FDA hydrolysis is a direct measure of extracellular enzymes, and it is suggested as a measurement of the global hydrolysis capacity of the soil and an indication of the biological activity of the soil [45]. As the most evident result, enzymes levels were greatest in the biodynamic orchards (contrast 2: Co + Cs > Cc), particularly in the soil surface layer. High heterotrophic activity arises from the deposition of organic material on the soil [62]. Regarding the cultivation sites, an effect similar to that observed for forests occurred in the first soil layer in organic citrus and agroforestry sites. The constant application of compost at both sites and, in the second layer, the contribution of biomass from trees in the system possibly explain this system response.
Soil fauna activity measured with the Bait blade method represents the rate of organic matter decomposition and nutrient cycling by microorganisms [83,84], including fungi, mites, nematodes, and annelids, with the latter known to be highly correlated with the disappearance of nutritive material on Bait blades [83]. The most evident effect was observed in period 3 (Winter/Spring 2015), when the highest activity was observed for biodynamic orchards (contrast 2: Co + Cs > Cc), where agroforestry was the best system (contrast 3: Cs > Co), and low-age forests (contrast 4: F40 > F200). Conventional citrus showed more average feeding activity than biodynamic citrus and forest sites in periods 1 and 2, with a sudden decline in periods 3 and 4. This behavior is possibly related to food availability to microorganisms depending on soil management at different times, although we do not have the specific records of tillage, weeding, and other activities.
Food consumption shows a depth gradient, revealing high consumption at the surface and detritivore activity in this layer, associated with the production and decomposition of senescent organic matter [83]. This gradient is also dependent on climatic conditions, soil profile, and soil fauna groups [84,85,86]. Between the forest sites, a smaller gradient effect was observed in the F200 forest than in the F40. The climatic stage of F200 is also reflected in the soil as a steady-state system. The method is promising and allows accessing the status of invertebrate activity in the soil as an indication of organic matter decomposition rates [49].
In deeper soil under forest systems, feeding activity was superior to citrus systems. In general, sites with a forest component have great abundance and diversity, favoring the effect of greater activity in depth, a phenomenon found by Podgaiski et al. [48]. Moreover, Pessotto et al. [87] add to this effect the greater abundance of hemiedaphic organisms and the quality of senescent organic material.
Thus, the biodynamic orchards (Co and Cs) have improved soil biological properties, namely global enzymatic activity and soil fauna feeding activity. These systems also have richness and abundance of herbaceous species, with the presence of Commoliaceae and Fabaceae families, offering an ecological effect and green manure of high ecosystem value for citrus production.

5. Conclusions

Biodynamic management practices were more beneficial to soil systems compared to the conventional management frequently used, with improvement in soil chemical (acidity, phosphorus, cation exchange capacity, and organic matter), physical (soil density, porosity, aggregation, and water retention), and biological properties (fluorescein diacetate hydrolysis).
Agroforestry management was the best system for soil quality, with higher pH, better soil structure with micropores, and improved feeding behavior of soil fauna, compared with the other land-use/management systems.
Soil pH, soil organic carbon, global enzymatic activity, and feeding activity of soil fauna showed seasonal effects. The systems with citrus in agroforestry and biodynamic systems showed greater richness and abundance of spontaneous herbaceous species. Organic management favors a timely coverage of multiple benefits, with the presence of the Commoliaceae and Fabaceae families, providing green manure of high ecosystem value.
Finally, the best management system for citrus production is agroforestry, more closely resembling forest sites, by improving soil physical, chemical, and biological properties. Further studies should also evaluate the occurrence of pests, diseases, and weeds, along with fruit production, allowing a more solid recommendation for farmers producing citrus.

Author Contributions

Conceptualization, L.C.P. and J.M.R.; formal analysis, all authors; investigation, L.C.P. and R.J.S.J.; methodology, L.C.P., E.B., R.J.S.J. and J.M.R.; resources, J.M.R.; writing—original draft, L.C.P. and J.V.A.; writing—review and editing, J.M.R. All authors have read and agreed to the published version of the manuscript.

Funding

This study was financed in part by the Coordination for the Improvement of Higher Education Personnel (Capes)—finance Code 001, and the Brazilian Council for Scientific and Technological Development (CNPq).

Institutional Review Board Statement

Not applicable.

Informed Consent Statement

Not applicable.

Data Availability Statement

Data available on request from the authors.

Acknowledgments

We thank the farmers Luiz Laux, Mike Kochenborger, and Lirio Delfino Ost, and their respective families, from Montenegro-RS, Brazil, where this study was conducted. Thanks also to the local EMATER-RS for the initial visits to these farmers.

Conflicts of Interest

The authors declare no conflict of interest.

Appendix A

Table A1. Soil pH in four periods of the sites with different land use (citrus or forest) and orchard management.
Land Use pH in Water
Period 1 (Spring 2014)Period 2 (Summer 2015)Period 3 (Winter/Spring 2015)Period 4 (Spring/Summer 2015)
x ¯ σ x ¯ σ x ¯ σ x ¯ σ
Layer 0–0.05 m
Cc5.940.145.340.175.670.285.700.36
Co6.750.226.690.026.220.116.220.10
Cs6.920.196.620.126.450.336.510.10
F405.020.295.030.344.861.054.681.12
F2005.000.174.670.255.350.575.210.63
C1* * * *
C2* * * *
C3ns ns ns ns
C4ns * ns ns
Layer 0.05–0.20 m
Cc5.240.204.780.104.920.334.990.22
Co6.930.336.500.096.670.326.680.36
Cs7.180.226.430.146.490.396.410.37
F404.800.244.780.344.550.234.530.06
F2004.680.454.610.414.680.774.710.72
C1* * * *
C2* * * *
C3ns ns ns ns
C4ns ns ns ns
Layer 0.2–0.40 m
Cc4.940.124.720.094.790.165.030.44
Co6.300.285.990.286.130.626.080.73
Cs6.890.206.450.156.140.196.180.28
F404.730.154.830.174.850.724.830.54
F2004.920.414.700.464.740.554.490.38
C1* * * *
C2* * * *
C3* * ns ns
C4ns ns ns ns
Cc = conventional citrus; Cs = agroforestry citrus; Co = organic citrus; F40 = forest with 40 years of regeneration; and F200 = forest with 200 years of regeneration. * Orthogonal contrast significant at 5%; ns = not significant; C1 = Forests vs. Citrus; C2 = Co + Cs vs. Cc; C3 = Cs vs. Co; and C4 = F200 vs. F40.
Figure A1. Soil water retention curve of the research sites: Cc—conventional citrus, Cs—agroforestry citrus, Co—organic citrus, F40—forest with 40 years of regeneration, and F200—forest with 200 years of regeneration, in the layers 0–0.05 m (top), 0.05–0.20 m (middle), and 0.20–0.40 m (bottom).
Sustainability 15 13060 g0a1
Figure A2. Aggregate stability as a function of immersion time, for the layers 0–0.05 m (a), 0.05–0.20 m (b), and 0.20–0.40 m (c), in period 1 (Spring 2014). CitConv—conventional citrus, CitSaf—agroforestry citrus, CitOrg—organic citrus, FL40—forest with 40 years of regeneration, and FL200—forest with 200 years of regeneration. * Orthogonal contrast significant at 5%; ns = not significant; C1 = Forests vs. Citrus, C2 = Co + Cs vs. Cc, C3 = Cs vs. Co, and C4 = F200 vs. F40. The contrasts frame for “b” is the same as for “c”.
Sustainability 15 13060 g0a2
Figure A3. Aggregate stability as a function of immersion time, for the layers 0–0.05 m (a), 0.05–0.20 m (b), and 0.20–0.40 m (c), in period 3 (Winter/Spring 2015). CitConv—conventional citrus, CitSaf—agroforestry citrus, CitOrg—organic citrus, FL40—forest with 40 years of regeneration, and FL200—forest with 200 years of regeneration. * Orthogonal contrast significant at 5%; ns = not significant; C1 = Forests vs. Citrus, C2 = Co + Cs vs. Cc, C3 = Cs vs. Co, and C4 = F200 vs. F40.
Sustainability 15 13060 g0a3
Figure A4. Feeding activity in Period 2 (Summer 2015), in the standard 7.5 cm layer, in Cc—conventional citrus, Cs—agroforestry citrus, Co—organic citrus, FL40—forest with 40 years of regeneration, and FL200—forest with 200 years of regeneration. Period 1—Spring 2014; 2—Summer 2015; 3—Winter/Spring 2015, and 4—Spring/Summer 2015. Horizontal bar for each mean is standard error.
Sustainability 15 13060 g0a4
Figure A5. Feeding activity in Period 3 (Winter/Spring 2015), in the standard 7.5 cm layer, in Cc—conventional citrus, Cs—agroforestry citrus, Co—organic citrus, FL40—forest with 40 years of regeneration, and FL200—forest with 200 years of regeneration. Period 1—Spring 2014; 2—Summer 2015; 3—Winter/Spring 2015 and 4—Spring/Summer 2015. Horizontal bar for each mean is standard error.
Sustainability 15 13060 g0a5
Figure A6. Feeding activity in Period 4 (Spring/Summer 2015), in the standard 7.5 cm layer, in Cc—conventional citrus, Cs—agroforestry citrus, Co-organic citrus, FL40—forest with 40 years of regeneration, and FL200—forest with 200 years of regeneration. Period 1—Spring 2014; 2—Summer 2015; 3—Winter/Spring 2015, and 4—Spring/Summer 2015. Horizontal bar for each mean is standard error.
Sustainability 15 13060 g0a6

References

  1. Cunha, J.E.F.; Bravo, J.V.M. Effects of environmental protection policies on fragile areas of a watershed occupied by agriculture in the Brazilian Cerrado. J. Environ. Manag. 2022, 319, 115695. [Google Scholar] [CrossRef]
  2. Maia, A.G.; Miyamoto, B.C.B.; Garcia, J.R. Climate Change and Agriculture: Do Environmental Preservation and Ecosystem Services Matter? Ecol. Econ. 2018, 152, 27–39. [Google Scholar] [CrossRef]
  3. Sadowski, A.; Baer-Nawrocka, A. Food and environmental function in world agriculture—Interdependence or competition? Land. Use Policy 2018, 71, 578–583. [Google Scholar] [CrossRef]
  4. David, P.; Schneider, M. Sustainability of food security in different cacao production systems: A land, labour, energy and food quality nexus approach. Resour. Conserv. Recycl. 2023, 190, 106874. [Google Scholar] [CrossRef]
  5. Kharel, M.; Dahal, B.M. Good agriculture practices for safe food and sustainable agriculture in Nepal: A review. J. Agric. Food Res. 2022, 10, 100447. [Google Scholar] [CrossRef]
  6. Pellegrino, E.; Piazza, G. Microbiome structure and interconnection in soil aggregates across conservation and conventional agricultural practices allow to identify main prokaryotic and fungal taxa related to soil functioning. Soil. Biol. Biochem. 2022, 175, 108833. [Google Scholar] [CrossRef]
  7. Piazza, G.; Pellegrino, E. Long-term conservation tillage and nitrogen fertilization effects on soil aggregate distribution, nutrient stocks and enzymatic activities in bulk soil and occluded microaggregates. Soil. Tillage Res. 2020, 196, 104482. [Google Scholar] [CrossRef]
  8. Yifru, A.; Taye, B. Effects of landuse on soil organic carbon and nitrogen in soils of bale, Southeastern Ethiopia. Trop. Subtrop. Agroecosystems 2011, 14, 229–235. [Google Scholar]
  9. Six, J.; Conant, R.T. Stabilization mechanisms of soil organic matter: Implications for C-saturation of soils. Plant Soil. 2002, 24, 155–176. [Google Scholar] [CrossRef]
  10. Wacker, T.S.; Jensen, L.S. Conservation agriculture affects soil organic matter distribution, microbial metabolic capacity and nitrogen turnover under Danish field conditions. Soil. Tillage Res. 2022, 224, 105508. [Google Scholar] [CrossRef]
  11. Alletto, L.; Cueff, S. Physical properties of soils under conservation agriculture: A multi-site experiment on five soil types in south-western France. Geoderma 2022, 428, 116228. [Google Scholar] [CrossRef]
  12. Marriott, E.E.; Wander, M. Qualitative and quantitative differences in particulate organic matter fractions in organic and conventional farming systems. Soil. Biol. Biochem. 2006, 38, 1527–1536. [Google Scholar] [CrossRef]
  13. Baldock, J.A.; Creamer, C. Linking decomposition rates of soil organic amendments to their chemical composition. Soil. Res. 2021, 59, 630–643. [Google Scholar] [CrossRef]
  14. Blume, E.; Reichert, J.M. Banana leaf and glucose mineralization and soil organic matter in microhabitats of banana plantations under long-term pesticide use: Pesticides, soil organic matter, and microbes in banana crop. Environ. Toxicol. Chem. 2015, 34, 1232–1238. [Google Scholar] [CrossRef]
  15. Teixeira, H.M.; Bianchi, F.J.J.A. Impact of agroecological management on plant diversity and soil-based ecosystem services in pasture and coffee systems in the Atlantic forest of Brazil. Agric. Ecosyst. Environ. 2021, 305, 107171. [Google Scholar] [CrossRef]
  16. Loranger-Merciris, G.; Ozier-Lafontaine, H. Fast improvement of macrofauna communities and soil quality in plantain crops converted to agroecological practices. Pedobiologia 2022, 93–94, 150823. [Google Scholar] [CrossRef]
  17. Palomo-Campesino, S.; García-Llorente, M. Do agroecological practices enhance the supply of ecosystem services? A comparison between agroecological and conventional horticultural farms. Ecosyst. Serv. 2022, 57, 101474. [Google Scholar] [CrossRef]
  18. Declerck, F.R.; Chazdon, R.L. Biodiversity conservation in human-modified landscapes of Mesoamerica: Past, present, and future. Biol. Conserv. 2010, 143, 2301–2313. [Google Scholar] [CrossRef]
  19. Harvey, C.A.; Komar, O. Integrating agricultural landscapes with biodiversity conservation in the Mesoamerican hotspot. Biol. Conserv. 2008, 22, 8–15. [Google Scholar] [CrossRef]
  20. Garrity, D.P.; Akinifesi, F.K. Evergreen agriculture: A robust approach to sustainable food security in Africa. Food Secur. 2010, 2, 197–214. [Google Scholar] [CrossRef]
  21. van der Ploeg, J.D.; Barjolle, D. The economic potential of agroecology: Empirical evidence from Europe. J. Rural. Stud. 2019, 71, 46–61. [Google Scholar] [CrossRef]
  22. Van Leeuwen, J.P.; Lehtinen, T. An ecosystem approach to assess soil quality in organically and conventionally managed farms in Iceland and Austria. Soil 2015, 1, 83–101. [Google Scholar] [CrossRef]
  23. Borges, A.L.; Trindade, A.V. Cultivo Orgânico de Fruteiras Tropicais: Manejo do Solo e da Cultura; Circular 64; Embrapa Mandioca e Fruticultura: Cruz das Almas, Brazil, 2003. [Google Scholar]
  24. Raupp, J.; Oltmanns, M. Organically fertilized plants can manage water-limited growth conditions better than minerally fertilized plants, Results from Multi-year experiment. In Proceedings of the 17th International Symposium of CIEC, NRC, Cairo, Egypt, 24–27 November 2008; pp. 159–164. [Google Scholar]
  25. Coyne, M.S.; Pena-Yewtukhiw, E.M. Soil health—It’s not all biology. Soil. Secur. 2022, 6, 100051. [Google Scholar] [CrossRef]
  26. Das, S.; Bhattacharyya, R. Soil aggregate-associated carbon and organic carbon pools as affected by conversion of forest lands to agriculture in an acid soil of India. Soil. Tillage Res. 2022, 223, 105443. [Google Scholar] [CrossRef]
  27. Guhra, T.; Stolze, K. Pathways of biogenically excreted organic matter into soil aggregates. Soil. Biol. Biochem. 2022, 164, 108483. [Google Scholar] [CrossRef]
  28. Loss, A.; Lourenzi, C.R. Carbon, nitrogen and natural abundance of 13C and 15N in biogenic and physicogenic aggregates in a soil with 10 years of pig manure application. Soil. Tillage Res. 2017, 166, 52–58. [Google Scholar] [CrossRef]
  29. Rodríguez, L.; Suárez, J.C. Agroforestry systems impact soil macroaggregation and enhance carbon storage in Colombian deforested Amazonia. Geoderma 2021, 384, 114810. [Google Scholar] [CrossRef]
  30. Köppen, W. Climatologia: Con un Estudio de los Climas de la Tierra; Fondo de Cultura Economica: Mexico City, Mexico, 1948; p. 478. [Google Scholar]
  31. Santos, H.G.; Jacomine, P.K.T. Sistema Brasileiro de Classificação de Solos, 5th ed.; Embrapa: Brasilia, Brazil, 2018; p. 356. [Google Scholar]
  32. Soil Survey Staff. Soil Taxonomy: A Basic System of Soil Classification for Making and Interpreting Soil Surveys, 2nd ed.; Natural Resources Conservation Service, U.S. Department of Agriculture Handbook; U.S. Department of Agriculture: Washington, DC, USA, 1999; p. 436. [Google Scholar]
  33. Pietrzacka, R. Caracterização Física e Química de um Argissolo em Área de Citricultura Orgânica com Diferentes Manejos da Cobertura Vegetal do Solo. Master’s Thesis, The Federal University of Rio Grande do Sul, Porto Alegre, Brazil, 2009. Programa de Pós-Graduação em Ciência do Solo. p. 106. [Google Scholar]
  34. Tedesco, M.J.; Gianello, C. Análise de Solo, Plantas e Outros Materiais, 2nd ed.; Universidade Federal do Rio Grande do Sul: Porto Alegre, Brazil, 1995; p. 147. [Google Scholar]
  35. Toledo, J.A.; Kaminski, J. Tampão Santa Maria (TSM) como alternativa ao tampão SMP para medição da acidez potencial de solos ácidos. Rev. Bras. Cienc. Solo 2012, 36, 427–435. [Google Scholar] [CrossRef]
  36. Mebius, L.J. A rapid method for the determination of organic carbon in soil. Anal. Chim. Acta 1960, 22, 120–124. [Google Scholar] [CrossRef]
  37. Embrapa; Centro Nacional de Pesquisa de Solos. Manual de Métodos de Análise de Solo, 2nd ed.; Embrapa: Rio de Janeiro, Brazil, 1997; p. 212. [Google Scholar]
  38. Suzuki, L.E.A.S.; Reichert, J.M. Dispersion and flocculation of Vertisols, Alfisols and Oxisols in Southern Brazil. Geoderma Reg. 2015, 5, 64–70. [Google Scholar] [CrossRef]
  39. Gubiani, P.I.; Reinert, D.J. Método alternativo para a determinação da densidade de partículas do solo—Exatidão, precisão e tempo de processamento. Ciênc Rural. 2006, 36, 664–668. [Google Scholar] [CrossRef]
  40. Reinert, D.J.; Reichert, J.M. Coluna de areia para medir a retenção de água no solo—Protótipos e teste. Ciênc Rural. 2006, 36, 1931–1935. [Google Scholar] [CrossRef]
  41. Gubiani, P.I.; Albuquerque, J.A. Tensão e extração de água em mesa de tensão e coluna de areia, em dois solos com elevada densidade. Ciênc Rural. 2009, 39, 2535–2538. [Google Scholar] [CrossRef]
  42. Klute, A. Water retention: Laboratory methods. In Methods of Soil Analysis I. Physical and Mineralogical Methods; Black, C.A., Ed.; American Society of Agronomy, Soil Science Society of America: Madison, WI, USA, 1986; pp. 635–662. [Google Scholar]
  43. Gubiani, P.I.; Reichert, J.M. Assessing errors and accuracy in dew-point potentiometer and pressure plate extractor measurements. Soil. Sci. Soc. Am. J. 2013, 77, 19–24. [Google Scholar] [CrossRef]
  44. Goebel, M.; Woche, S.K. Quantitative analysis of liquid penetration kinetics and slaking of aggregates as related to solid–liquid interfacial properties. J. Hydrol. 2012, 63, 442–443. [Google Scholar] [CrossRef]
  45. Green, V.S.; Stott, D.E. Assay for fluorescein diacetate hydrolytic activity: Optimization for soil samples. Soil. Biol. Biochem. 2006, 38, 693–701. [Google Scholar] [CrossRef]
  46. Törne, E. Assessing feeding activities of soil-living animals I. Bait-lamina-testes. Pedobiologia 1990, 34, 89–101. [Google Scholar]
  47. Kratz, W. The bait-lamina test. General aspects, applications and perspectives. Environ. Sci. Pollut. Res. 1998, 5, 94–96. [Google Scholar] [CrossRef]
  48. Podgaiski, L.R.; Silveira, F.S. Avaliação da atividade alimentar dos invertebrados de solo em campos do sul do Brasil—Bait-lamina Test. Entomo Bras. 2011, 4, 108–113. [Google Scholar] [CrossRef]
  49. Römbke, J.H.; Hofer, M.V.B. Feeding activities of soil organisms at four different forest sites in Central Amazonia using the bait-lamina method. J. Trop. Ecol. 2006, 22, 313–320. [Google Scholar] [CrossRef]
  50. Stevenson, F.J. Humus Chemistry: Genesis, Composition, Reactions; John Wiley & Sons: New York, NY, USA, 1982. [Google Scholar]
  51. Stockdale, E.A.; Shepherd, M.A. Fortune S and Cuttle SP, Soil fertility in organic farming systems—Fundamentally different? Soil. Use Manag. 2002, 18, 301–308. [Google Scholar] [CrossRef]
  52. Bulluck III, L.R.; Brosius, M. Organic and synthetic fertility amendments influence soil microbial, physical and chemical properties on organic and conventional farms. Appl. Soil. Ecol. 2002, 19, 147–160. [Google Scholar] [CrossRef]
  53. Drinkwater, L.E.; Wagoner, P. Legume-based cropping systems have reduced carbon and nitrogen losses. Nature 1998, 396, 262–265. [Google Scholar] [CrossRef]
  54. Hondebrink, M.A.; Cammeraat, L.H. The impact of agricultural management on selected soil properties in citrus orchards in Eastern Spain: A comparison between conventional and organic citrus orchards with drip and flood irrigation. Sci. Total Environ. 2017, 581–582, 153–160. [Google Scholar] [CrossRef] [PubMed]
  55. Chenu, C.; Angers, D.A. Increasing organic stocks in agricultural soils: Knowledge gaps and potential innovations. Soil. Tillage Res. 2019, 188, 41–52. [Google Scholar] [CrossRef]
  56. Silva, D.C.; Silva, M.L.N. Atributos do solo em sistemas agroflorestais, cultivo convencional e floresta nativa. Rev. Estud. Ambient. 2011, 13, 77–86. [Google Scholar]
  57. Reichert, J.M.; Rodrigues, M.F. Fragmentation, fiber separation, decomposition, and nutrient release of secondary-forest biomass, mechanically chopped-and-mulched, and cassava production in the Amazon. Agric. Ecosyst. Environ. 2015, 204, 8–16. [Google Scholar] [CrossRef]
  58. Carvalho, R.; Goedert, W.J. Atributos físicos da qualidade de um solo sob sistema agroflorestal. Pesq. Agropec Bras. 2004, 39, 1153–1155. [Google Scholar] [CrossRef]
  59. Pilon, L.C. Atributos de um Argissolo Amarelo Coeso sob Cultivo de Cafeeiro a Pleno sol e Consorciado com Espécies Arbóreas. Master’s Thesis, Universidade Federal do Espírito Santo, Vitória, Brazil, 2013. Programa de Pós Graduação em Produção Vegetal. p. 104. [Google Scholar]
  60. Tisdall, J.M.; Oades, J.M. Stabilization of soil aggregates by the root systems of ryegrass. Austr J. Soil. Res. 1979, 17, 429–441. [Google Scholar] [CrossRef]
  61. Palmeira, P.R.T.; Pauletto, E.A. Agregação de um Planossolo submetido a diferentes sistemas de cultivo. Rev. Bras. Cienc. Solo 1999, 23, 189–195. [Google Scholar] [CrossRef]
  62. Are, M.; Kaart, T. The effects of crops together with winter cover crops on the content of soil water-stable aggregates in organic farming. Agriculture 2021, 11, 1035. [Google Scholar] [CrossRef]
  63. Schäfer, M.J.; Reichert, J.M. Erosão em sulcos em diferentes preparos e estados de consolidação do solo. Rev. Bras. Cienc. Solo 2001, 25, 19–430. [Google Scholar] [CrossRef]
  64. Schäfer, M.J.; Reichert, J.M. Erosão em entressulcos em diferentes preparos e estados de consolidação do solo. Rev. Bras. Cienc. Solo 2001, 25, 431–441. [Google Scholar] [CrossRef]
  65. Awe, G.O.; Reichert, J.M. Temporal variability and covariance structures of soil temperature in a sugarcane field under different management practices in southern Brazil. Soil. Tillage Res. 2015, 150, 93–106. [Google Scholar] [CrossRef]
  66. Awe, G.O.; Reichert, J.M. Temporal processes of soil water status in a sugarcane field under residue management. Plant Soil. 2015, 387, 395–411. [Google Scholar] [CrossRef]
  67. Ambus, J.V.; Awe, G.O. Integrated crop-livestock systems in lowlands with rice cultivation improve root environment and maintain soil structure and functioning. Soil. Tillage Res. 2023, 227, 105592. [Google Scholar] [CrossRef]
  68. Campos, B.C.; Reinert, D.J. Estabilidade estrutural de um Latossolo Vermelho-Escuro distrófico após sete anos de rotação de culturas e sistemas de manejo do solo. Rev. Bras. Cienc. Solo 1995, 19, 121–126. [Google Scholar]
  69. Wendling, B.; Jucksch, I. Carbono orgânico e estabilidade de agregados de um Latossolo Vermelho sob diferentes manejos. Pesq. Agropec Bras. 2005, 40, 487–494. [Google Scholar] [CrossRef]
  70. Reichert, J.M.; Norton, L.D. Aggregate stability and rain-impacted sheet erosion of air-dried and prewetted clayey surface soils under intense rain. Soil. Sci. 1994, 158, 159–169. [Google Scholar] [CrossRef]
  71. Bayer, C.; Mielniczuk, J. Nitrogênio total de um solo submetido a diferentes métodos de preparo e sistemas de cultura. Rev. Bras. Cienc. Solo 1997, 21, 235–239. [Google Scholar]
  72. Reichert, J.M.; Corcini, A.L. Onion-forage cropping systems on a Vertic Argiudoll in Uruguay: Onion yield and soil organic matter, aggregation, porosity and permeability. Soil. Tillage Res. 2022, 216, 105229. [Google Scholar] [CrossRef]
  73. Wohlenberg, E.V.; Reichert, J.M. Dinâmica da agregação de um solo franco-arenoso em cinco sistemas de culturas em rotação e em sucessão. Rev. Bras. Cienc. Solo 2004, 28, 891–900. [Google Scholar] [CrossRef]
  74. Weiler, D.A.; Moro, V.J. Carbon balance in sugarcane areas under different tillage systems. BioEnergy Res. 2019, 12, 778–788. [Google Scholar] [CrossRef]
  75. Reichert, J.M.; Albuquerque, J.A. Estimation of water retention and availability in soils of Rio Grande do Sul. Rev. Bras. Cienc. Solo 2009, 33, 1547–1560. [Google Scholar] [CrossRef]
  76. Reichert, J.M.; Prevedello, J. Eucalyptus tree stockings effect on water balance and use efficiency in subtropical sandy soil. Ecol. Manag. 2021, 497, 119473. [Google Scholar] [CrossRef]
  77. Cavalli, J.P.; de Araújo, E. Eucalyptus growth responses to soil water storage capacity in Arenosols and Acrisols soils: Wood and biomass stock modelling. Sustainability 2022, 14, 12215. [Google Scholar] [CrossRef]
  78. Vaz, C.M.P.; de Freitas Iossi, M. Validation of the Arya and Paris water retention model for Brazilian soils. Soil. Sci. Soci. Am. J. 2005, 69, 577–583. [Google Scholar] [CrossRef]
  79. Reichert, J.M.; Rodrigues, M.F. Fire-free fallow management by mechanized chopping of biomass for sustainable agriculture in eastern Amazon: Effects on soil compactness, porosity, and water retention and availability. Land. Degrad. Dev. 2016, 27, 1403–1412. [Google Scholar] [CrossRef]
  80. Reichert, J.M.; Bervald, C.M.P. Mechanized land preparation in eastern Amazon in fire-free forest-based fallow systems as alternatives to slash-and-burn practices: Hydraulic and mechanical soil properties. Agric. Ecosyst. Environ. 2014, 192, 47–60. [Google Scholar] [CrossRef]
  81. Amorim, R.S.S.; Albuquerque, J.A. Water retention and availability in Brazilian Cerrado (Neotropical savanna) soils under agricultural use: Pedotransfer functions and decision trees. Soil. Tillage Res. 2022, 224, 105485. [Google Scholar] [CrossRef]
  82. Braida, J.A.; Bayer, C. Matéria orgânica e seu efeito na física do solo. Tópicos Ciênc Solo 2011, 7, 221–278. [Google Scholar]
  83. Coleman, C.; Crossley, D.A.J.R. Fundamentals of Soil Ecology; Academic Press: San Diego, CA, USA, 2004; p. 384. [Google Scholar]
  84. Lavelle, P. Diversity of soil fauna and ecosystem function. Biol. Int. 1996, 33, 3–16. [Google Scholar]
  85. Hättenschwiler, S.; Tiunov, A.V. Biodiversity and litter decomposition in terrestrial ecosystems. Annu. Rev. Ecol. Evol. Syst. 2005, 36, 191–218. [Google Scholar] [CrossRef]
  86. Gongalsky, K.B.; Pokarzhevskii, D.A. Stratification and dynamics of bait-lamina perforation in three forest soils along a north–south gradient in Russia. Appl. Soil. Ecol. 2004, 25, 111–122. [Google Scholar] [CrossRef]
  87. Pessotto, M.D.F.; Santana, N.A. Relação do uso do solo com a diversidade e a atividade da fauna edáfica. Nativa 2020, 8, 397–402. [Google Scholar] [CrossRef]
Figure 1. Location of the sampling grid in each plot (30 m × 34 m) marked in yellow, where white or red parts are limits of each site. Site 1: conventional citrus (Cc); site 2: organic citrus (Co); site 3: citrus agroforestry biodynamic (Cs); site 4: forest with 40 years of regeneration (F40); and site 5: forest with 200 years of regeneration (F200). Source: Google Earth (2014).
Sustainability 15 13060 g001
Figure 2. Determination of aggregate stability. Adapted from Goebel et al. [44].
Sustainability 15 13060 g002
Figure 3. Images of the aggregate stability determination procedure, using the scheme in Figure 2.
Sustainability 15 13060 g003
Figure 4. Bait blade dimensions, with holes that are filled with the food mix. Adapted from Kratz [47].
Sustainability 15 13060 g004
Figure 5. Total organic carbon (TOC, dag kg−1) in layers 0–0.05 m (a), 0.05–0.20 m (b), and 0.20–0.40 m (c) at four sampling periods of each treatment: Cc = conventional citrus; Cs = agroforestry citrus; Co = organic citrus; F40 = forest with 40 years of regeneration; and F200 = forest with 200 years of regeneration. * Orthogonal contrast significant at 5%; ns = not significant; C1 = Forests vs. Citrus; C2 = Co + Cs vs. Cc; C3 = Cs vs. Co; and C4 = F200 vs. F40. Period 1—Spring 2014; 2—Summer 2015; 3—Winter/Spring 2015, and 4—Spring/Summer 2015.
Sustainability 15 13060 g005
Figure 6. Average feeding activity in each period, in the standard 7.5 cm layer, in Cc (conventional citrus), Cs (agroforestry citrus), Co (organic citrus), F40 (forest with 40 years of regeneration), and F200 (forest with 200 years of regeneration). * Orthogonal contrast significant at 5%; ns = not significant; C1 = Forests vs. Citrus; C2 = Co + Cs vs. Cc; C3 = Cs vs. Co; and C4 = F200 vs. F40. Period 1—Spring 2014; 2—Summer 2015; 3—Winter/Spring 2015; and 4—Spring/Summer 2015. Vertical bar for each mean is standard error.
Sustainability 15 13060 g006
Figure 7. Feeding activity in period 1 (Spring 2014), in the standard 7.5 cm layer, in Cc (conventional citrus), Cs (agroforestry citrus), Co (organic citrus), FL40 (forest with 40 years of regeneration), and FL200 (forest with 200 years of regeneration). Period 1—Spring 2014; 2—Summer 2015; 3—Winter/Spring 2015; and 4—Spring/Summer 2015. Horizontal bar for each mean is standard error.
Sustainability 15 13060 g007
Table 1. Orthogonal contrasts used in the evaluation of the analyzed properties, considering the different systems of use and management.
ContrastsSystems of Use and Management
F200F40CsCoCc
C11.51.5−1−1−1
C20011−2
C3001−10
C41−1000
The contrasts were used for the three layers evaluated separately (0–0.05; 0.05–0.20; and 0.20–0.40 m). C1 = Forests vs. Citrus; C2 = Organic citrus and agroforestry vs. Conventional citrus; C3 = Citrus agroforestry vs. Organic citrus; and C4 = F200 vs. F40. F200 = Forest with 200 years of regeneration; F40 = forest with 40 years of regeneration; Cs = citrus agroforestry biodynamic; Co = organic citrus (Co); and Cc = conventional citrus.
Table 2. Soil chemical properties at four periods of the sites with different land use (citrus and forest) and orchard management.
Land UsepH in WaterpH TSMAvailable PCEC Effective CEC pH 7
(mg dm−3)cmolc dm−3cmolc dm−3
x ¯ σ x ¯ σ x ¯ Σ x ¯ σ x ¯ Σ
Layer 0–0.05 m
Cc5.70.187.00.0758.213.901.40.201.90.26
Co6.50.097.00.08134.443.644.20.405.00.44
Cs6.60.106.90.12153.519.124.90.505.70.58
F404.90.296.40.4416.310.602.20.372.90.32
F2005.10.246.40.206.10.802.61.283.40.93
C1* * * * *
C2* ns * * *
C3ns ns ns ns ns
C4ns ns ns ns ns
Layer 0.05–0.20 m
Cc5.00.136.70.2646.817.350.70.101.10.05
Co6.70.197.50.0623.211.231.30.461.70.60
Cs6.60.137.10.3332.19.921.60.372.00.41
F404.70.126.40.2810.18.151.10.241.70.11
F2004.70.416.20.553.10.491.70.593.30.71
C1* * * ns *
C2* * * * *
C3ns ns ns ns ns
C4ns ns ns * *
Layer 0.20–0.40 m
Cc4.90.116.40.2734.413.000.60.211.40.13
Co6.10.317.30.243.60.970.70.020.90.01
Cs6.40.127.10.205.31.990.90.121.20.44
F404.80.246.50.407.65.151.10.251.80.17
F2004.70.246.30.622.80.141.40.273.30.56
C1* * * * *
C2* * * ns ns
C3ns ns ns ns ns
C4ns ns ns * *
Cc = conventional citrus; Cs = agroforestry citrus; Co = organic citrus; F40 = forest with 40 years of regeneration; and F200 = forest with 200 years of regeneration. * Orthogonal contrast significant at 5%; ns = not significant; C1 = Forests vs. Citrus; C2 = Co + Cs vs. Cc; C3 = Cs vs. Co; and C4 = F200 vs. F40.
Table 3. Means and standard deviations of soil particle size of the sites with different land use (citrus or forest) and orchard management.
Land UseSand (%)Silt (%)Clay (%)
x ¯ σ x ¯ σ x ¯ σ
Layer 0–0.05 m
Cc89.91.32.70.87.31.4
Co85.1 3.26.21.38.72.9
Cs84.12.47.91.88.11.1
F4082.54.06.12.011.43.9
F20083.63.05.11.611.32.4
C1* ns *
C2* * ns
C3ns ns ns
C4ns ns ns
Layer 0.05–0.20 m
Cc88.82.62.80.68.42.2
Co88.53.04.22.47.23.6
Cs90.72.33.91.65.41.1
F4081.04.55.81.513.24.3
F20085.62.34.41.110.01.5
C1* * *
C2ns ns ns
C3ns ns ns
C4* ns ns
Layer 0.2–0.40 m
Cc86.24.02.50.711.33.7
Co88.11.93.90.68.02.2
Cs84.72.84.52.210.72.0
F4077.55.05.70.616.84.7
F20086.53.63.81.19.63.7
C1ns * *
C2ns * ns
C3ns ns ns
C4ns * *
Cc = conventional citrus; Cs = agroforestry citrus; Co = organic citrus; F40 = forest with 40 years of regeneration; and F200 = forest with 200 years of regeneration. * Orthogonal contrast significant at 5%; ns = not significant; C1 = Forests vs. Citrus; C2 = Co + Cs vs. Cc; C3 = Cs vs. Co; and C4 = F200 vs. F40.
Table 4. Soil physical properties (averages and standard deviations): bulk density (Bd), total porosity (Tp), microporosity (Mip), and icroporosity (Map) of the sites with different land use (citrus or forest) and orchard management, in three soil layers.
Land UseBdTpMipMap
g cm−3m3 m−3m3 m−3m3 m−3
x ¯ σ x ¯ σ x ¯ σ x ¯ σ
Layer 0–0.05 m
Cc1.400.080.470.030.270.030.200.04
Co0.980.140.630.060.350.050.270.06
Cs0.960.190.640.070.400.060.230.05
F401.220.130.540.050.300.050.240.05
F2001.160.110.560.040.300.040.260.04
C1* ns ns ns
C2* ns ns ns
C3ns ns ns ns
C4* ns ns ns
Layer 0.05–0.20
Cc1.640.070.380.030.210.020.170.03
Co1.550.070.420.030.190.030.230.04
Cs1.590.090.400.030.200.030.200.04
F401.550.080.420.030.230.030.190.04
F2001.390.110.480.040.240.030.230.04
C1* * * *
C2ns ns ns ns
C3ns ns ns ns
C4ns ns ns ns
Layer 0.20–0.40
Cc1.660.080.370.030.200.020.170.03
Co1.600.080.400.030.180.020.210.03
Cs1.750.040.340.020.180.020.160.02
F401.570.110.410.040.240.050.170.05
F2001.400.080.470.030.220.030.250.04
C1* * * *
C2ns ns ns ns
C3ns ns ns ns
C4ns ns ns ns
Cc = conventional citrus; Cs = agroforestry citrus; Co = organic citrus; F40 = forest with 40 years of regeneration; and F200 = forest with 200 years of regeneration. * Orthogonal contrast significant at 5%; ns = not significant; C1 = Forests vs. Citrus; C2 = Co + Cs vs. Cc; C3 = Cs vs. Co; and C4 = F200 vs. F40.
Table 5. Means and standard deviations of aggregate stability for periods 1 and 3, for sites with different land use (citrus or forest) and orchard management.
Land UseAggregate Stability (AS)
Period 1 (Spring 2014)Period 3 (Winter/Spring 2015)
%%
x ¯ σ x ¯ Σ
Layer 0–0.05 m
Cc97.34.497.34.3
Co98.02.899.80.7
Cs99.40.998.42.6
F4084.022.345.04.2
F20097.34.899.40.9
C1ns *
C2ns ns
C3ns ns
C4ns *
Layer 0.05–0.20
Cc31.128.834.022.9
Co45.129.133.415.6
Cs49.626.344.923.3
F4039.227.728.56.6
F20078.223.957.218.1
C1ns ns
C2ns ns
C3ns ns
C4* *
Layer 0.20–0.40
Cc7.47.88.710.5
Co19.07.517.58.5
Cs11.67.18.96.9
F408.05.913.06.3
F20026.310.130.08.0
C1ns *
C2ns ns
C3ns ns
C4* *
Cc = conventional citrus; Cs = agroforestry citrus; Co = organic citrus; F40 = forest with 40 years of regeneration; and F200 = forest with 200 years of regeneration. * Orthogonal contrast significant at 5%; ns = not significant; C1 = Forests vs. Citrus; C2 = Co + Cs vs. Cc; C3 = Cs vs. Co; and C4 = F200 vs. F40.
Table 6. Content of fluorescein diacetate in soils under different systems of land use and management: averages and standard errors of the four periods.
Land UseFluorescein (µg Fluorescein g−1 Dried Soil h−1)
Period 1 (Spring
2014)
Period 2 (Summer
2015)
Period 3 (Winter/Spring 2015)Period 4 (Spring/Summer 2015)
x ¯ Sx x ¯ Sx x ¯ Sx x ¯ Sx
Layer 0–0.05
Cc75.86.988.25.596.34.6109.53.5
Co93.85.6111.73.4126.65.2110.22.8
Cs97.82.3100.91.7130.72.6110.25.7
F40103.26.7109.33.3117.13.8126.92.8
F20097.92.4109.86.5139.61.8131.60.9
C1ns ns ns *
C2* * * ns
C3ns ns ns ns
C4ns ns ns ns
Layer 0.05–0.20
Cc49.16.120.12.127.22.334.33.9
Co23.02.723.44.222.66.813.73.3
Cs30.65.412.72.020.23.515.21.4
F4076.57.928.71.439.16.540.28.8
F20057.33.749.19.9106.210.7114.74.3
C1ns ns ns ns
C2ns ns ns ns
C3ns ns ns ns
C4ns ns ns ns
Layer 0.2 to 0.40
Cc19.11.521.02.323.88.440.06.9
Co10.11.65.01.06.21.712.02.9
Cs3.21.01.30.65.30.84.45.7
F4045.912.923.01.925.05.421.86.1
F20034.24.346.812.267.213.686.09.3
C1ns ns ns ns
C2ns ns ns ns
C3ns ns ns ns
C4ns ns ns ns
Cc = conventional citrus; Cs = agroforestry citrus; Co = organic citrus; F40 = forest with 40 years of regeneration; and F200 = forest with 200 years of regeneration. * Orthogonal contrast significant at 5%; ns = not significant; C1 = Forests vs. Citrus; C2 = Co + Cs vs. Cc; C3 = Cs vs. Co; and C4 = F200 vs. F40.
Disclaimer/Publisher’s Note: The statements, opinions and data contained in all publications are solely those of the individual author(s) and contributor(s) and not of MDPI and/or the editor(s). MDPI and/or the editor(s) disclaim responsibility for any injury to people or property resulting from any ideas, methods, instructions or products referred to in the content.

