Abstract
Climate change is harmful to ecosystems and public health, so the concern about climate change has been aroused worldwide. Studies indicated that greenhouse gas emission with as the main component is an important factor for climate change. Countries worldwide are on the same page that low-carbon development is an effective way to combat climate change. Enhancing public concern about low-carbon development and climate change has a positive effect on universal participation in carbon emission reduction. Therefore, it is significant to study the trend of public concern about low carbon and its relationship with emissions. Currently, no related studies are available, so this research explores the relationship between the public concern about low carbon and emissions of China, as well as the respective trends of each. Based on the daily data of Baidu-related keyword searches and emission, this research proposes the GMM-CEEMD-SGIA-LSTM hybrid model. The GMM is utilized to construct a comprehensive Baidu index (CBI) to reflect public concern about low carbon by clustering keywords search data. CEEMD and SGIA are applied to reconstruct sequences for analyzing the relationship between CBI and emissions. Then LSTM is utilized to forecast CBI. The reconstructed sequences show that there is a strong correlation between CBI and emissions. It is also found that CBI affects emissions, with varying effect lag times for different periods. Compared to LSTM, RF, SVR, and RNN models, the proposed model is reliable for forecasting public concern with a 46.78% decrease in MAPE. The prediction results indicate that public concern about low carbon shows a fluctuating upward trend from January 2023 to January 2025. This research could improve understanding of the relationship between public concern about low carbon and emissions to better address climate change.
1. Introduction
Climate change is a major challenge for countries worldwide today. Glacial melting, sea level rise, extreme weather, and mass extinction of marine life caused by climate change will endanger the ecosystem [1,2,3,4]. At the same time, heat exposure, food-borne diseases, and infectious diseases caused by climate change will pose a severe threat to public health [5,6,7]. Studies have shown that greenhouse gas emission with as the main component is a major cause of climate change [8], so reducing emissions is the key to address climate change.
In response to climate change, countries formulated a series of low-carbon development policies to reduce emissions. For example, the United States formulated the Clean Power Plan and the Inflation Reduction Act of 2022; the United Kingdom formulated Climate Change Act 2008; China proposed the goals of “carbon peaking” and “carbon neutrality” with related policies. In addition, countries worldwide signed and implemented the Paris Agreement to address climate change in an international cooperative manner. Reducing emissions requires effective low-carbon development policies from the government and active attention and daily practice from the public [9,10]. Low-carbon development policies are essential to achieving sustainable development goals, protecting public health and addressing climate change. Public concern about low carbon can trigger changes in their behavior and facilitate the participation of low-carbon actions in society. It is significant to study public concern about low carbon, which can contribute to form a low-carbon consensus in society, promoting low-carbon development and climate action [11].
Climate change has garnered much attention from governments and the public. At the same time, there has been a surge of scholarly research on climate change and public concern. The public’s perceptions and concerns about climate change were explored by many scholars. For example, Bergquist et al. [12] used public opinion survey data to study public understanding of climate change in various states in the U.S. The results indicated that a continued increase in environmental temperatures may lead to increased public concern about future climate change. Ballew et al. [13] found that most Americans can update their own climate change beliefs, risk perceptions, and policy support when the causes, impacts, and solutions to climate change are understood. Liu et al. [14] studied the public’s concern about global warming and climate change in China. The results show that the average public concern about global warming and climate change in China is low compared to other countries. Sandvik [15] utilized data from 46 countries/regions and found a negative correlation between per capita emissions and public concerns. Bakaki et al. [16] first theoretically argued and empirically examined the triangular relationship between concern among citizens about the environment, media attention to environ-mental issues, and policy output. Kvaløy et al. [17] argued that the majority of the public in all countries is concerned about global warming. Widespread concern meant that global warming has the potential to generate popular political participation and demand for political action. While numerous scholars have delved into public perceptions and concerns about climate change, a subset of researchers has focused on the public attention related to low-carbon initiatives. For example, Yang et al. [18] represented the public attention to low-carbon cities and studied the pattern of attention using data from Sina Weibo. The results showed that public attention to low-carbon development is more focused on low-carbon living, and this attention is concentrated in cities with higher political status and stronger policy support. Geels [19] suggested that a lack of public concern can impede a low-carbon transition.
Currently, scholars usually study the status of public concern through questionnaire surveys [20,21,22]. The questionnaire survey is a traditional method for conducting public opinion surveys. However, the data obtained from questionnaire surveys are vulnerable to the influence of collection scope and respondents’ subjective emotions, which may lead to inaccurate results [23]. While a national questionnaire can represent public concern well, it is true that it requires a significant investment of human, material, and financial resources. In contrast, utilizing internet data has emerged as an efficient and cost-effective method for studying public concerns, while search engine data is a good indicator of public concern [24]. For example, Li et al. [23] used internet data to study the correlation between 2.5-micrometer particulate matter pollution and public concern. Li et al. [25] used search engine query data to study the characteristics of public concern about haze and its relationship with air quality. Tu et al. [26] studied the public concern about air pollution using a gray model based on internet data.
The internet and search engine technology has rapidly advanced in China. China’s internet penetration rate has increased significantly from 34.3% in 2010 to 75.6% in 2022, and the internet users have reached 1.067 billion in 2022 [27], which indicates that the internet has become an essential way for Chinese to obtain information. Baidu is the largest Chinese-language search engine and occupied over 70% of the Chinese search engine in 2022 [28]. The Baidu Index is a data analysis tool based on Baidu internet users’ behavior data, which brings a large amount of keyword search information together. From the viewpoint of the Baidu Index, there is much research, such as tourist volume forecasting [29], stock market forecasting [30], and disease symptom investigation [31]. It is well known that China is the most populous country and the largest carbon emitter [32]. Therefore, it is significant to study the public concern about low carbon in China based on the Baidu Index for reducing carbon emissions and effectively addressing climate change.
Most current studies on public concern about low carbon focus on assessing the current status without actual environmental data or in-depth studies on its trends and changes [33,34]. At the same time, there is no study that investigates public concern and emissions from Chinese and the internet viewpoint. Therefore, based on the daily search data of Baidu keywords and daily emission data, this research constructs a comprehensive baidu index (CBI) to reflect public concern about low carbon, analyzes the relationship between CBI and emissions, and forecasts the development trend of public concern about low carbon.
The main contributions of this study are as follows:
- This research constructs CBI to reflect the level of public concern about low carbon in Chinese society. CBI can reduce the influence of anomalous keyword search data to better reflect the public concern about low carbon and its changing trend;
- This research explores the relationship between public concern and emissions. By applying the decomposition and reconstruction method, the changes in public concern and emissions are compared at different frequencies. It is found that public concern about low carbon affects emissions. This will help the government to develop dynamic low-carbon activities and optimize publicity strategies;
- This research applies the GMM-CEEMD-SGIA-LSTM hybrid model to construct and forecast the CBI. The prediction results indicate a fluctuating upward trend of public concern about low carbon in the future, which helps the government to better implement low-carbon policies and effectively address the challenges of climate change.
2. Data and Methods
2.1. Data Preparation and Processing
2.1.1. CO2 Emission Data
This research collects daily Chinese emission data in Carbon Monitor (https://www.carbonmonitor.org.cn/, accessed on 16 February 2023) from 1 January 2019 to 31 December 2022. Since this research studies the trend of public concern about low carbon and its relationship with emission, the influence of industrial factors is removed from the data.
2.1.2. Keywords Search Data
The user index data of search engines can reflect public concern [24]. With the public search volume of the Baidu search engine as the data base and keywords as the statistical object, the Baidu Index (https://index.baidu.com/, accessed on 15 February 2023) calculates the weighted sum of the search frequency of each keyword in the search engine, reflecting the public concern about a specific keyword. This research collects daily Baidu Index data for low-carbon-related keywords, from 1 January 2019 to 31 December 2022.
2.1.3. Construct Comprehensive Baidu Index (CBI)
In this research, the concepts of policy, economy, technology, life, and environmental protection are selected as the initial scope of low-carbon-related keywords. These five concepts are the main points in the explanation of low carbon on the Baidu Baike website. Therefore, when the public thinks of low carbon, they usually think of these five concepts. The keywords are expanded by using the Baidu Index demand mapping, Baidu drop-down menu, and Webmaster Tools (https://tool.chinaz.com/, accessed on 15 February 2023). The Baidu Index demand mapping analyzes people’s actual search behavior on the search engine to identify popular search terms and phrases that are closely related to low-carbon topics. The Baidu drop-down menu provides suggested search queries related to the keywords entered, thus further enriching our keyword list. In addition, Webmaster Tools is used to find popular low-carbon-related keywords. Through these tools, representative and research-worthy keywords are expanded. The keyword selection process is finalized by verifying whether the keywords are included in the Baidu Index. Some important low-carbon-related keywords are not included in the Baidu Index, so these keywords are excluded.
In order to better analyze public concern, this research constructs the CBI to reflect the public concern about low carbon, as shown in Figure 1. Firstly, the low-carbon-related keywords search data are used as inputs to the Gaussian mixture model. The Gaussian mixture model is able to statistically analyze and model the keyword search data, and then derive each keyword cluster and the weight it occupies. Through this step, we are able to better understand the correlation and distribution among keywords. After obtaining the keyword clusters and their weights, we will further carry out the calculation of CBI. Within each keyword cluster, keyword search data is directly summed. Among different keyword clusters, keyword clusters are summed according to their weights. In this way, the influence of different clusters can be taken into account. Finally, the CBI that reflects the public concern about low carbon is calculated.
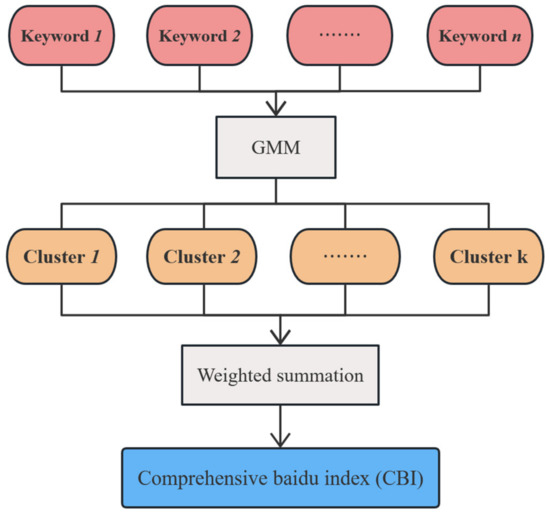
Figure 1.
The construction process for CBI.
CBI is more accurate and robust than directly summing the search data for all keywords. The weights in the CBI constructing process reflect the contribution of multiple keyword clusters overall. The more meaningful keyword clusters are taken into account more importantly. Meanwhile, the search volume of some keywords may be affected by unusual events. Direct summation of keyword search data may lead to dramatic fluctuations in results. The CBI can smooth out the dramatic fluctuation of search volume and reduce the influence of outliers.
2.2. Data Analysis Methods
2.2.1. Gaussian Mixture Model (GMM)
The GMM clusters and calculates the keywords search data to construct the CBI. Specifically, the GMM clusters multiple low-carbon-related keywords under different ranges and divides them into different keyword clusters. Then, the weights of each keyword cluster are combined to calculate the CBI. The GMM is an extension for the probability density function of a single Gaussian distribution to model real-world data sets [35]. Its single Gaussian distribution probability density function can be expressed as:
where is the mean, is the standard deviation.
The GMM expands the mean to a vector and the standard deviation to a covariance matrix and uses a k-dimensional Gaussian distribution to describe multidimensional features. It uses a combination of multiple Gaussian probability density functions to characterize the data distribution. The probability density function can be expressed as:
where denotes the total number of Gaussian distributions, representing the number of keyword clusters; is the weight coefficient of the Gaussian model, so there is ; is the probability density function of the kth Gaussian model; each cluster corresponds to a Gaussian distribution, which is considered as the weight for each keywords cluster; represents the mean of the Gaussian distribution, which can be considered as the average search volume per keyword cluster; is the covariance matrix, which reveals the variation of keyword search volume and the correlation between them.
For keyword search data, the GMM has many advantages over clustering methods used by other scholars such as K-medoids [36]. Keyword search data has a complex distribution and may have multiple trends or periodicities. The GMM, as a method based on probability distribution, can better adapt to this complexity. Baidu index data may be affected by seasonality, abnormal fluctuations, and other noise. The GMM is better able to handle these noises due to its probabilistic nature. The Baidu Index may have multiple keyword trends overlapping in time. The GMM can consider this overlap simultaneously in one model.
The Bayesian information criterion (BIC) is an important discriminant for model parameter selection [37]. The smaller the BIC score is, the better the model is. In the GMM, the categories of observed data are missing in clustering, and the maximum value of the log-likelihood function cannot be derived by derivation. Therefore, the BIC is used to judge the number of optimal keyword clusters. The model parameters are updated by the expectation maximum algorithm (EM) [38] until the likelihood function converges.
2.2.2. Complementary Ensemble Empirical Mode Decomposition (CEEMD)
In order to investigate the patterns in the CBI and emissions, and explore the relationship between them, CEEMD is used to decompose two data sets into different intrinsic mode functions (IMFs). CEEMD, proposed by Yeh et al. [39], is a time-frequency signal processing method that addresses the defects of EMD and EEMD. Empirical modal decomposition (EMD) is a time-frequency processing method characterized by overcoming the problem of non-adaptive basis functions. After EMD decomposes the original signal, the obtained signal components are called IMFs. However, EMD is prone to modal confusion, resulting in a scattered distribution of signals with different or the same feature scales. Ensemble empirical mode decomposition (EEMD) is the most common EMD improvement method, which solves the modal aliasing problem in EMD by adding white noise and averaging the decomposition results. However, when the number of processing is insufficient, the added white noise cannot reach the negligible level, and vice versa, it needs to increase the computational cost. In order to solve these problems, a more reasonable CEEMD method is proposed. CEEMD can solve the problems of modal aliasing and residual white noise, improve computational efficiency, and reduce computational costs. The main steps of CEEMD are as follows:
Step 1: Add a set of noise signals with opposite signs and the same amplitude to the original signal.
where is the original signal, is positive noise, is negative noise.
Step 2: and is decomposed by EMD.
where and are modal components.
Step 3: Calculate the average of and
Step 4: The original signal can be expressed as:
where each IMF contains components of original sequences from high to low frequencies, respectively. The residual represents the trend component.
2.2.3. Synthetic Grey Incidence Analysis (SGIA)
In this search, the synthetic degree of grey incidence between different IMFs is calculated and used as a basis for reconstruction. The IMFs with large degree and similar fluctuation frequencies are grouped into one category for reconstruction and defined as high frequency, middle frequency, and low frequency sequences. The residual representing the trend component is retained and defined as the trend sequence. The synthetic degree of grey incidence in SGIA is an indicator that more comprehensively characterizes whether the connection between the sequences is strong [40]. It is based on a combination of gray system theory and probability statistics methods, which is used to determine the correlation between several factors. The steps are as follows:
Step 1: Select and initialize the reference sequences and the comparison sequences . is defined as:
where
Step 2: Calculate the relative degree of grey incidence. Degree of grey incidence is defined as:
where is taken as 0.5
Step 3: Calculate the absolute degree of grey incidence.
Step 4: Calculate the synthetic degree of grey incidence. Where is taken as 0.5
2.2.4. Spearman Correlation Coefficient
Spearman correlation analysis is adopted to analyze the relationship between CBI and emissions. The Spearman correlation coefficient is a non-parametric statistical method used to assess the correlation between two time series variables [41]. The Spearman correlation coefficient is denoted by . The for sequence and sequence is calculated as shown below:
The Spearman correlation coefficient takes values in the range of [−1, 1]. A larger absolute value of indicates a stronger correlation. When is greater than 0, it implies a positive correlation between sequences and Y. Conversely, when is less than 0, it suggests a negative correlation. In this research, t-test is used to assess the statistical significance of the Spearman correlation coefficient [42]. The calculation of the t-statistic is as follows:
By comparing the computed p-value to the significance level = 0.01, the significance of could be determined. When the p-value is less than 0.01, we reject the null hypothesis at a significance level of 0.01, indicating that there is a significant correlation between the two sequences X and Y.
2.2.5. Long Short-Term Memory (LSTM)
LSTM is used to forecast the future trend of the CBI. It takes the high frequency, middle frequency, low frequency, and trend sequences of the CBI as input, learning and capturing the long-term dependencies to make predictions for each sequence. The predictions of all sequences are summed to obtain the future trend of the CBI. LSTM is a neural network model proposed by Hochreiter S and Schmidhuber J [43] to address the shortcomings of the recurrent neural network (RNN). The RNN is a neural network that processes time series and has loops to preserve information. Compared with general feedforward neural networks, the RNN can process time-series data of arbitrary length using neurons with self-feedback. However, since the model weights are shared among all layers, the long sequence training process can lead to gradient explosion or disappearance problems. To solve such problems, the LSTM was proposed.
The LSTM is a nonlinear model with high flexibility and generalization capability. This means the LSTM can adapt to patterns and trends in various data types and handle noise and anomalies. For data as complex and variable as the CBI, the LSTM can better adapt to the characteristics of the data and provide more accurate prediction results. A typical LSTM cell is shown in Figure 2.
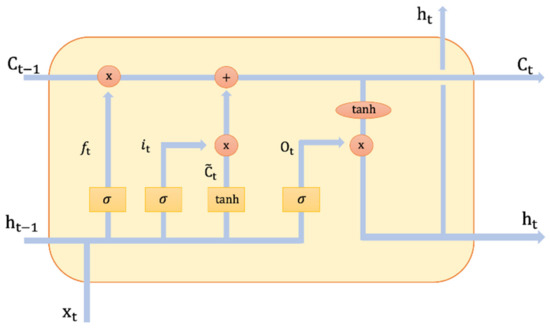
Figure 2.
LSTM cell structure.
Where and represent the activation function in the hidden layer of the neural network; and represent the state variables of the hidden layer and the state variables of the memory unit at the moment before any time , , and is the corresponding variable at time ; is the input information at the current moment; are forget gate, input gate, and output gate of the model;
Step 1. Calculate the forget gate, input gate, and output gate, and the output is calculated by the fully connected layer whose activation function is the sigmoid function:
Step 2. Calculate the candidate memory cells by using the tanh function with a range of [−1, 1] as the activation function:
Step 3. Compute and combine the information of the last time step memory cell and the current time step candidate memory cell, and control the flow of information through the forget gate and output gate:
Step 4. With the memory cells, the flow of information from the memory cells to the hidden state can also be controlled through the output gate:
where the , , , and are input weight, , , , and are the bias weight.
2.2.6. Evaluation Metrics
To better evaluate the GMM-CEEMD-SGIA-LSTM hybrid model, four evaluation metrics were introduced. Mean absolute error (MAE) is used to calculate the mean of the absolute error value between the predicted and actual values. Mean absolute percentage error (MAPE) assesses the accuracy of the prediction results. Mean square error (MSE) is evaluated by calculating how well the measured predicted value matches the actual value. The larger the error, the larger the value of MSE, indicating poorer model performance. Root mean square error (RMSE), one of the measures of prediction results for machine learning models, is commonly used to measure the deviation between the predicted and actual values. The four metrics are defined as follows:
where is the number of samples, is the actual value, is the predicted value.
2.3. GMM-CEEMD-SGIA-LSTM Hybrid Model Analysis Process
Based on daily data of keywords search data and emissions, the GMM-CEEMD-SGIA-LSTM hybrid model is proposed for analyzing the development trend of public concern about low carbon and its relationship with emissions. The detailed steps of the hybrid model are shown in Figure 3, and the main steps are as follows:
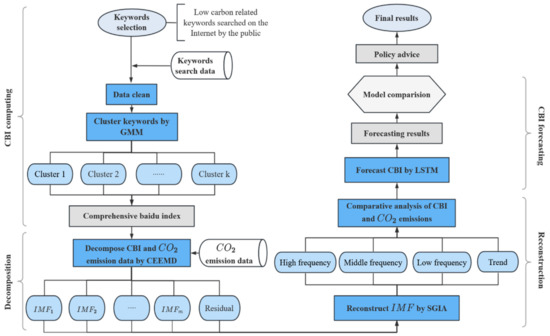
Figure 3.
Flowchart of GMM-CEEMD-SGIA-LSTM hybrid model.
Step 1: Data pre-processing. Collect daily keywords search data and emission data. Process the missing values and singular values in the data.
Step 2: Construction of the CBI. The BIC determines the number of keyword clusters, and the GMM clusters the keywords, and constructs the CBI according to cluster weights.
Step 3: Decomposition of the CBI and emission data. CEEMD decomposes CBI and emission data to get two sets of IMFs and residuals.
Step 4: Reconstruct the IMFs of the CBI and emission data. For the two sets of IMFs obtained, reconstruct the IMFs with a large synthetic degree of grey incidence and similar frequencies. Explore the relationship between the reconstructed CBI and emissions.
Step 5: Forecast the future trend of the CBI. The LSTM predicts the reconstructed CBI. Evaluate the proposed model by MAE, MAPE, MSE, and RMSE. The proposed model is compared with other models such as the RNN, Random Forest (RF), and Support Vector Regression (SVR).
Step 6: Discuss the results of Step 2, Step 3, Step 4, and Step 5. Analyze the implications in the context of reality and provide policy recommendations for the government to combat global warming.
3. Data Analysis and Results
3.1. Data Description
The low-carbon-related keywords are expanded based on the concepts of policy, economy, technology, life, and environmental protection. A total of 86 keywords are selected, as shown in Figure 4. The keywords and their ID are listed in Table 1.
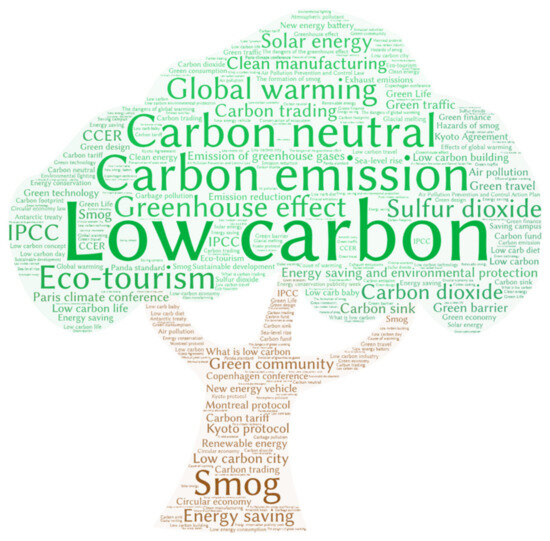
Figure 4.
Low carbon keywords word cloud.

Table 1.
Selected keywords.
3.2. Related Analysis of CBI
The BIC score is calculated for the number of GMM Gaussian distributions. As the number of clusters increases, the BIC score gradually decreases, reaching the minimum value when the number of Gaussian distributions is 44. To prevent overfitting, the number of clusters in the GMM is determined to be 44. As shown in Table 2, keywords are divided into 44 clusters, and the cluster weights are also shown. Most clusters have only one keyword, and a few contain multiple keywords. The keywords within each cluster have actual relevance. For example, Cluster 9 contains similar keywords, such as ’low-carbon city’, ‘green community’, and ‘low-carbon building’, indicating a cluster related to low-carbon urban development; Cluster 38 contains keywords related to the low-carbon industry, such as carbon trading and carbon fund. This indicates that the clustering results are related to the search volume of keywords and the actual relevance between keywords.
Table 2.
Clusters obtained by GMM and corresponding keywords ID.
Compared to the search data summation, the CBI is robust. In Figure 5, the summation result has many outliers, some of which even deviate from the normal value by 50%, making the overall trend relatively ambiguous, especially in 2021. The trend of the CBI from 2019 to 2022 is more obvious and the deviation of the outliers is significantly reduced.
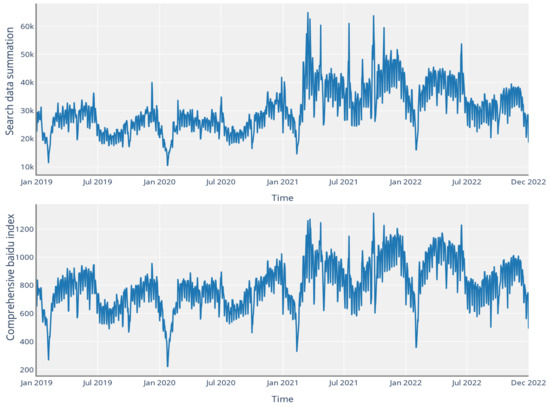
Figure 5.
The trend of keywords search data summation and CBI.
The CBI exhibits seasonality and trend (Figure 6). In January and February of each year, the CBI is lower than the other months, and even the lowest value of the year is observed. The CBI maintains a high level from March to June yearly, but declines from July to August. From August to December each year, the CBI gradually rises again and reaches a peak. From 2019 to 2022, the CBI shows an overall increasing trend.
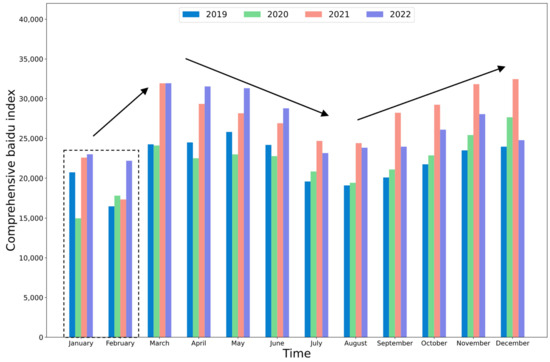
Figure 6.
Comparison of the monthly CBI from 2019 to 2022.
3.3. Analysis of Decomposed CBI
As shown in Figure 7, the CBI is decomposed into IMFs and the residual. Different IMFs reflect the fluctuation characteristics of the CBI at different frequencies. Expressly, IMF1, IMF2, IMF3, IMF4, and IMF5 indicate that the public concern about low carbon strongly fluctuates in the short-term. Media coverage of environmental and low-carbon issues may attract high public concern, especially in the case of unexpected events, major international conferences, or environmental disasters. This attention is often short-term, and public interest may wane once the news event subsides. IMF6, IMF7, and IMF8 indicate changes in the CBI over the medium to long-term, suggesting a pattern of monthly or seasonal fluctuations in public concern about low carbon, which may be caused by seasonal events or holidays. This fluctuation has a certain regularity. Once the season or holiday ends, the public concern about low carbon will drop accordingly. The residual indicates the trend characteristics of the CBI in the long-term, representing the overall trend of public concern about low carbon. From the residual, we can observe that the public concern about low carbon is increasing yearly, which aligns with China’s intense propaganda in low-carbon development.
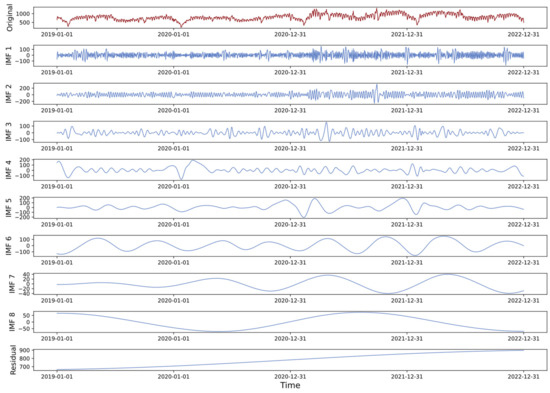
Figure 7.
CEEMD decomposition result of CBI.
3.4. Analysis of Reconstructed CBI and Emissions
To explore the relationship between the CBI and emission, both IMFs are reconstructed, and the results are shown in Table 3. From Figure 8, the high frequency, middle frequency, low frequency, and trend sequences have obvious characteristics. The high frequency sequence represents trend over a short time (daily) trend with large fluctuations, randomness, and less policy significance. The high frequency sequence contributes relatively less to the variance in emissions, indicating that its changes have a smaller impact. Therefore, the high frequency sequences are not analyzed in detail. The variance contribution rate is the proportion of the variance of each sequence to the sum of the variances of all sequences, which can determine the sequence significance.
Table 3.
Synthetic degree of grey incidence of CBI IMFs and emission IMFs.
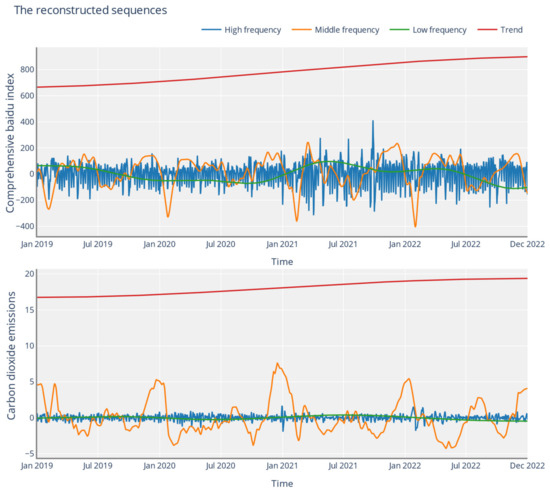
Figure 8.
The reconstructed CBI and emissions.
Among the reconstructed sequences in the CBI and emissions, the middle frequency sequence represents the trend over a medium-term (monthly), and its variance contribution rate is at the highest. Therefore, it is important to analyze and compare the middle frequency sequences. As shown in Table 4, there is a significant correlation between the CBI and emissions in the middle frequency sequence, which reaches the peak at 0.5797 and the lowest value at −0.4981. Furthermore, according to Figure 9, changes in the CBI always precede changes in emissions. When the CBI rises and remains high, emissions also rise and remain high in the subsequent period, such as period 1. Period 2 shows that when the CBI peaks, after a while, emissions also peak. Similarly, when the CBI falls to a low point, emissions also fall to a low point, such as period 3. This suggests a relationship between the CBI and emissions; changes in the CBI affect changes in emissions. It is important to note that there are different lag times for the effects. In detail, each interval time between the change in CBI and the change in emissions is different.
Table 4.
Correlation analysis between emissions with differences in lag time and CBI in middle frequency sequence.
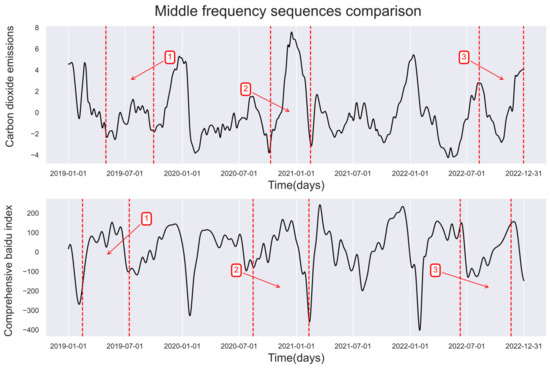
Figure 9.
Comparison of middle frequency sequences about emission and CBI in different periods 1–3.
The low frequency (LF) and trend sequences have relatively high variance contributions, and their analysis helps to better understand the relationship between the CBI and emissions over long periods (season and year). Based on the results of the analysis for low frequency sequences (Table 5, Figure 9), it is found that the correlation coefficient between emissions and the CBI is 0.715, indicating a strong relationship with similar overall trends. However, the CBI has a more pronounced fluctuation characteristic, with a slight increase before the onset of summer. From the trend sequences (Table 5, Figure 10), the correlation between emissions and the CBI is 1.000, indicating not only a strong positive correlation, but also that the CBI and emissions have the same long-term growth trend. These findings are important for better understanding the relationship between the CBI and emissions, and provide a theoretical basis for further analysis in the context of practice.
Table 5.
Correlation analysis between emissions and CBI in middle frequency and trend sequence.
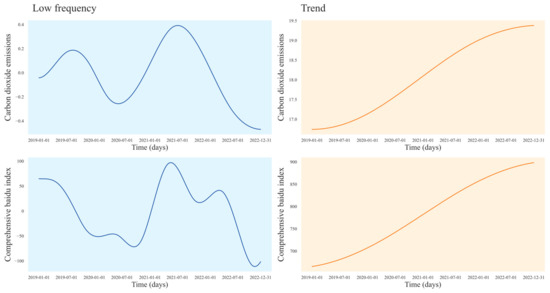
Figure 10.
Comparison of emissions and CBI in low frequency and trend sequences.
3.5. Comparison of Forecasting Precision
After proposing the GMM-CEEMD-SGIA-LSTM hybrid model, this research uses the keywords search data from 1 January 2019 to 14 March 2022 as the training set to test the predictive performance from 15 March 2022 to 31 December 2022. The actual values are shown in Figure 11 with the predicted values of six models. Other models include the LSTM, RF, SVR, RNN CEEMD-SGIA-RF, CEEMD-SGIA-SVR, and CEEMD-SGIA-RNN.
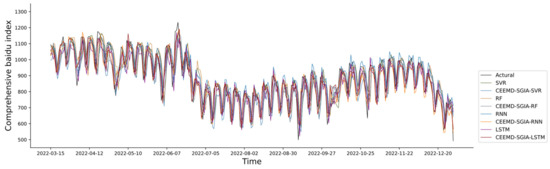
Figure 11.
Comparison results of actual CBI with those of LSTM, RF, SVR, RNN, CEEMD-SGIA-RF, CEEMD-SGIA-SVR, CEEMD-SGIA-RNN, and CEEMD-SGIA-LSTM.
The predictive performance of all models is shown in Table 6. Compared with machine learning models such as RF, SVR, and RNN, the LSTM has better results in predicting time series with MAPE, MSE, MAE, and RMSE of 6.73%, 5177.54, 56.74, and 71.96, respectively. Compared with the RF and SVR, the LSTM has 24.80% and 23.35% lower MAPE, 44.53% and 41.70% lower MSE, 24.17% and 23.11% lower MAE, and 25.71% and 23.64% lower RMSE. Comparing the LSTM and CEEMD-SGIA-LSTM, the latter has a better predictive performance with MAPE, MSE, MAE, and RMSE of 3.78%, 1903.30, 32.38, and 43.63, which are reduced by 43.83%, 63.24%, 42.93%, and 39.37%, respectively. CEEMD-SGIA-LSTM consistently outperforms the LSTM regardless of the evaluation metric. Meanwhile, CEEMD-SGIA-SVR, CEEMD-SGIA-RF, and CEEMD-SGIA-RNN outperform SVR, RF, and RNN, respectively, indicating that CEEMD-SGIA can improve the model’s prediction accuracy. Moreover, by comparing CEEMD-SGIA-RF, CEEMD-SGIA-SVR, CEEMD-SGIA-RNN, and CEEMD-SGIA-LSTM, CEEMD-SGIA-LSTM consistently outperforms the other models with a MAPE of only 3.78%. Therefore, the GMM-CEEMD-SGIA-LSTM hybrid model is an effective method for forecasting CBI.
Table 6.
Performance comparison of CEEMD-SGIA-LSTM and other models in forecasting CBI.
3.6. Future Trends of CBI
Based on the GMM-CEEMD-SGIR-LSTM hybrid model, the CBI trend from January 2023 to January 2025 is forecasted. According to the forecast results (Figure 12), the CBI shows a fluctuating upward trend in the next 25 months. Specifically, January and February of 2023 and 2024 will show lower values, while April and May will again reach higher values. Then in July and August, the CBI will drop to low values again and finally fluctuate to higher values in October and November. At the same time, a 95% confidence interval is calculated for the forecasting values due to the susceptibility of keyword search data. The 95% confidence interval for the future values is ±7938.589, which indicates a 95% confidence that future values will fluctuate within this range. It is worth noting that the overall CBI from January 2023 to January 2025 is higher than the previous three years. This indicates that public concern about low carbon will rise in the future, and the fluctuation cycle of public concern is similar to past years.
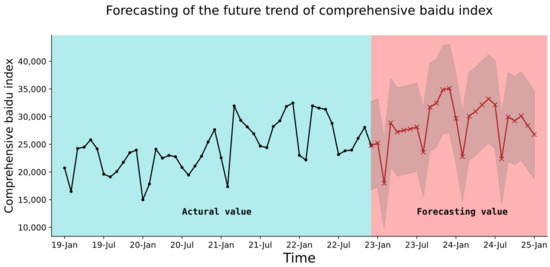
Figure 12.
Future trend of CBI with 95% confidence interval.
4. Discussions
Climate change is harmful to ecosystems and public health. China, as the world’s largest emitter of greenhouse gases, bears a huge responsibility to address this challenge. China has issued the National Adaptation and Mitigation Policy on Responding to Climate Change, launched a national carbon emissions trading market, and signed the Paris Agreement to combat climate change. The purpose of this study is compatible with China’s low-carbon policy.
The CBI indicates the search trend of 86 low-carbon-related keywords over time and the relative search volume, reflecting the public concern about low carbon in society. A higher CBI indicates a higher public concern for low carbon, while a lower CBI indicates a lower concern. By observing the change in the CBI, we can understand the attention to low-carbon-related topics. Therefore, the CBI can serve as an indicator of public concern about low carbon.
Public concern about low carbon and emissions have seasonal trends. In summer, people often use air conditioners and other electrical devices to lower indoor temperatures. In winter, people usually need natural gas or other fuels to heat their homes due to the cold weather. As a result, emissions are higher in summer and winter. Spring and fall are the seasons with the most dramatic weather changes. During spring and autumn, the effects of climate change are more likely to be felt, for example, when temperatures rise in the spring and fall in the autumn. This makes the public more concerned about climate change and low carbon. Governments and environmental organizations usually increase their efforts to promote energy saving and low-carbon living in spring and autumn, remind the public of energy conservation and emission reduction, and provide related guidance and advice. Such publicity campaigns are likely to draw greater public attention to low carbon. Therefore, spring and fall will witness increased public interest in low carbon than previous seasons. It is important to keep in mind that as the Spring Festival approaches, public interest will change and become less focused on low carbon. The lowest value of both will occur close to the Spring Festival since the social shutdown will simultaneously cause a fall in emissions. The government can act nimbly when making judgments based on the varying qualities of public concern during various seasons. Publicity and education can be boosted during times of year when there is a low level of public awareness of low carbon, such as in January and July. The public can be guided to move from theory to practice and support low-carbon development while reducing wasteful expenditure when there is a high level of public concern about low carbon. This can be done by holding more practical environmental protection-related events. Governments might create various schemes in response to the seasonal variation in emissions. For instance, during the peak tourist season and Spring Festival, the pertinent departments should concentrate on promoting low-carbon travel, step up their traffic flow and tailpipe pollution monitoring, and mandate the prompt tailpipe treatment of subpar vehicles. Coal burning should be minimized, the use of renewable energy should be encouraged, and energy consumption efficiency should be increased in areas and during seasons that require warmth. It is also a recommendation of the Energy Peak Carbon Neutrality Standardized Enhancement Action Plan in China. It is possible to spread awareness of the sensible use of air conditioners and various heat avoidance techniques in summer.
Public concern about low carbon shows a similar long-term trend with emissions. Several reasons may contribute to this phenomenon: Firstly, it is likely that the public is concerned about low carbon, but takes no action. Secondly, in today’s complicated internet information era, misinformation misleads the public and thus, influences their behavior. Thirdly, the existing publicity and education methods may be stereotyped and rigid, failing to give the public an in-depth understanding of the meaning of low-carbon causes. Fourthly, the public may have a fluke mentality or believe that low-carbon living comes at a price and worry about the impact on their lifestyles. Finally, the growth in public demand for low-carbon products and services exceeds the capacity for sustainable supply. For example, when public demand for electric vehicles increases, the manufacturing process of batteries and electric vehicles may lead to more emissions. The government can strengthen the guidance of the online environment, extensively solicit public opinion, and create more empathetic and transparent methods of publicizing and educating the public. People will comprehend more clearly that living sustainably and participating in environmental activities do not conflict with their interests, which will improve the social climate and encourage low-carbon development. In addition, the government can create reasonable regulations and add corresponding reward and punishment mechanisms, such as fines for illegal emission of waste gas and improving the profit model of low-carbon enterprises. Through funding and technical assistance, the government can encourage the creation of low-carbon production and supply chain technologies. At the same time, a corresponding certification and standard system can be established to provide the public with a trustworthy selection of low-carbon products and services.
The public concern about low carbon reflects the formation of social awareness of energy conservation and emission reduction. Different ideologies will lead to different behaviors or policies impacting emissions. However, this effect may not immediately lead to changes in emissions. The lag time depends on the public awareness of low carbon, education level, and effectiveness of communication channels. Accordingly, the government should take measures to fully mobilize the public and increase participation in carbon emission reduction to promote low-carbon development. The government can use new media platforms to enhance the publicity of “carbon peak” and “carbon neutrality” policies and organize more activities with the theme of energy saving and emission reduction to raise people’s awareness of low carbon. In addition, the government can also establish a monitoring mechanism to forecast the trend of emissions by observing public concern so that it can carry out low-carbon work dynamically.
5. Conclusions and Recommendations
With the intensification of climate change, low-carbon development has become a hot topic worldwide. Therefore, it is important to study the status of public concern about low carbon and its relationship with emissions. Due to a lack of relevant research, this research explores the trend of public concern about low carbon and its relationship with emissions in China. This research provides an essential reference for countries worldwide to better combat climate change.
Based on the 86 selected low-carbon-related search keywords, this research constructs the CBI to reflect the overall level of public concern about low carbon in China. The results show that the Chinese public concern about low carbon has a clear periodic trend, with higher levels in spring and autumn and lower levels in summer and winter. From 2019 to 2022, public concern about low carbon shows an increasing trend. Combining with emissions data, this research found that public concern does affect emissions. Compared with other models, the proposed GMM-CEEMD-SGIA-LSTM hybrid model is reliable for forecasting public concern with a MAPE below 4%. The forecast results suggest that the public attention to low carbon in China will exhibit a fluctuating upward trend over the next 25 months. When formulating low-carbon policies, the government should: fully mobilize public enthusiasm and increase public participation in carbon reduction actions; fully consider public needs and interests to foster an excellent social culture of low-carbon development; flexibly adjust programs according to seasonal changes.
This research fills a gap in current research on the relationship between public concern about low-carbon issues and emissions, providing valuable data analysis for the field. Meanwhile, an innovative GMM-CEEMD-SGIA-LSTM hybrid model is introduced in this study, which effectively analyzes the dynamic relationship between public concern about low carbon and emission and possesses high prediction accuracy. Finally, through the relationship analysis between public concern about low carbon and emissions, it provides theoretical support for the formulation of low-carbon development strategies, and helps to promote the implementation and promotion of low-carbon development.
Although the GMM-CEEMD-SGIA-LSTM hybrid model is reliable, it still has some limitations in other aspects. The Baidu search engine occupies most of the search market in China, but this only partially represents the public access to low-carbon information, much less covering the activities on social media commonly used by the public. To expand the scope of the data, future studies can add data sources from more frequently used media, such as Tik Tok, Weibo, and Zhihu. In addition, public concern is influenced by multiple factors. Other influencing variables, such as news events, weather changes, and geographic location, can be combined to improve the model effectiveness in future studies.
Author Contributions
Conceptualization, W.D., R.C. and S.Z.; methodology, W.D. and R.C.; software, W.D. and R.C.; validation, W.D. and R.C.; investigation, W.D., R.C. and X.B.; data curation, W.D. and R.C.; writing—original draft preparation, W.D., R.C. and X.B.; writing—review and editing, W.D., R.C. and S.Z.; visualization, W.D. and R.C.; supervision, S.Z.; project administration, S.Z. All authors have read and agreed to the published version of the manuscript.
Funding
This work is partially supported by Fundamental Research Funds for the Central Universities (Grant No. lzujbky-2022-16); Lanzhou University Student Innovation and Entrepreneurship Action Plan (No. 20220250005).
Institutional Review Board Statement
Not applicable.
Informed Consent Statement
Not applicable.
Data Availability Statement
The data that support the findings of this study are available on request from the corresponding authors.
Conflicts of Interest
The authors declare that they have no known competing financial interest or personal relationships that could have appeared to influence the work reported in this paper.
References
- Raper, S.C.; Braithwaite, R.J. Low sea level rise projections from mountain glaciers and icecaps under global warming. Nature 2006, 439, 311–313. [Google Scholar] [CrossRef] [PubMed]
- Pielke, R.A., Jr.; Landsea, C.; Mayfield, M.; Layer, J.; Pasch, R. Hurricanes and global warming. Bull. Am. Meteorol. Soc. 2005, 86, 1571–1576. [Google Scholar] [CrossRef]
- Hedhly, A.; Hormaza, J.I.; Herrero, M. Global warming and sexual plant reproduction. Trends Plant Sci. 2009, 14, 30–36. [Google Scholar] [CrossRef]
- Alfonso, S.; Gesto, M.; Sadoul, B. Temperature increase and its effects on fish stress physiology in the context of global warming. J. Fish Biol. 2021, 98, 1496–1508. [Google Scholar] [CrossRef] [PubMed]
- Bi, P.; Saniotis, A. Global warming and Australian public health: Reasons to be concerned. Aust. Health Rev. 2009, 33, 611–617. [Google Scholar] [CrossRef]
- Calleja-Agius, J.; England, K.; Calleja, N. The effect of global warming on mortality. Early Hum. Dev. 2021, 155, 105222. [Google Scholar] [CrossRef]
- Khasnis, A.A.; Nettleman, M.D. Global warming and infectious disease. Arch. Med. Res. 2005, 36, 689–696. [Google Scholar] [CrossRef]
- Yoro, K.O.; Daramola, M.O. emission sources, greenhouse gases, and the global warming effect. In Advances in Carbon Capture; Woodhead Publishing: Sawston, UK, 2020; pp. 3–28. Available online: https://www.sciencedirect.com/science/article/abs/pii/B9780128196571000013 (accessed on 10 June 2023).
- Lagerkvist, J. The rise of online public opinion in the People’s Republic of China. China Int. J. 2005, 3, 119–130. [Google Scholar] [CrossRef]
- Luo, Y. The Internet and agenda setting in China: The influence of online public opinion on media coverage and government policy. Int. J. Commun. 2014, 8, 24. [Google Scholar]
- Milfont, T.L. The interplay between knowledge, perceived efficacy, and concern about global warming and climate change: A one-year longitudinal study. Risk Anal. Int. J. 2012, 32, 1003–1020. [Google Scholar] [CrossRef]
- Bergquist, P.; Warshaw, C. Does Glob. Warm. Increase Public Concern About Clim. Change? J. Politics 2019, 81, 686–691. [Google Scholar] [CrossRef]
- Ballew, M.T.; Marlon, J.R.; Goldberg, M.H.; Maibach, E.W.; Rosenthal, S.A.; Aiken, E.; Leiserowitz, A. Changing minds about global warming: Vicarious experience predicts self-reported opinion change in the USA. Clim. Chang. 2022, 173, 19. [Google Scholar] [CrossRef]
- Liu, X.; Hao, F.; Portney, K.; Liu, Y. Examining public concern about global warming and climate change in China. China Q. 2020, 242, 460–486. [Google Scholar] [CrossRef]
- Sandvik, H. Public concern over global warming correlates negatively with national wealth. Clim. Chang. 2008, 90, 333–341. [Google Scholar] [CrossRef]
- B Bakaki, Z.; Böhmelt, T.; Ward, H. The triangular relationship between public concern for environmental issues, policy output, and media attention. Environ. Politics 2020, 29, 1157–1177. [Google Scholar] [CrossRef]
- Kvaløy, B.; Finseraas, H.; Listhaug, O. The public’s concern for global warming: A cross-national study of 47 countries. J. Peace Res. 2012, 49, 11–22. [Google Scholar] [CrossRef]
- Yang, W.; Cai, B.; Wang, J.; Cao, L.; Li, D. Study on the focus of low-carbon cities in China. Chin. Popul. Resour. Environ. 2017, 27, 22–27. [Google Scholar]
- Geels, F.W. The impact of the financial-economic crisis on sustainability transitions: Financial investment, governance and public discourse. Environ. Innov. Soc. Transit. 2013, 6, 67–95. [Google Scholar] [CrossRef]
- Liu, X.; Zhu, H.; Hu, Y.; Feng, S.; Chu, Y.; Wu, Y.; Lu, Y. Public’s health risk awareness on urban air pollution in Chinese megacities: The cases of Shanghai, Wuhan and Nanchang. Int. J. Environ. Res. Public Health 2016, 13, 845. [Google Scholar] [CrossRef]
- Wang, Y.; Sun, M.; Yang, X.; Yuan, X. Public awareness and willingness to pay for tackling smog pollution in China: A case study. J. Clean. Prod. 2016, 112, 1627–1634. [Google Scholar] [CrossRef]
- Egondi, T.; Kyobutungi, C.; Ng, N.; Muindi, K.; Oti, S.; Van de Vijver, S.; Rocklöv, J. Community perceptions of air pollution and related health risks in Nairobi slums. Int. J. Environ. Res. Public Health 2013, 10, 4851–4868. [Google Scholar] [CrossRef] [PubMed]
- Li, W.; Yang, G.; Li, X. Correlation between PM2.5 pollution and its public concern in China: Evidence from Baidu Index. J. Clean. Prod. 2021, 293, 126091. [Google Scholar] [CrossRef]
- Scheitle, C.P. Google’s insights for search: A note evaluating the use of search engine data in social research. Soc. Sci. Q. 2011, 92, 285–295. [Google Scholar] [CrossRef]
- Li, C.; Ma, X.; Fu, T.; Guan, S. Does public concern over haze pollution matter? Evidence from Beijing-Tianjin-Hebei region, China. Sci. Total Environ. 2021, 755, 142397. [Google Scholar] [CrossRef]
- Tu, L.; Chen, Y. An unequal adjacent grey forecasting air pollution urban model. Appl. Math. Model. 2021, 99, 260–275. [Google Scholar] [CrossRef]
- China Internet Network Information Center. The 51st Statistical Report on Internet Development in China. CNNIC, Beijing. 2023. Available online: https://www.cnnic.net.cn/n4/2023/0302/c199-10755.html (accessed on 10 June 2023).
- StatCounter. Web Traffic Analysis Report. StatCounter, Dublin. 2023. Available online: https://gs.statcounter.com. (accessed on 10 June 2023).
- Li, S.; Chen, T.; Wang, L.; Ming, C. Effective tourist volume forecasting supported by PCA and improved BPNN using Baidu index. Tour. Manag. 2018, 68, 116–126. [Google Scholar] [CrossRef]
- Fang, J.; Gozgor, G.; Lau, C.K.M.; Lu, Z. The impact of Baidu Index sentiment on the volatility of China’s stock markets. Financ. Res. Lett. 2020, 32, 101099. [Google Scholar] [CrossRef]
- Qiu, H.J.; Yuan, L.X.; Wu, Q.W.; Zhou, Y.Q.; Zheng, R.; Huang, X.K.; Yang, Q.T. Using the internet search data to investigate symptom characteristics of COVID-19: A big data study. World J. Otorhinolaryngol. Head Neck Surg. 2020, 6, S40–S48. [Google Scholar] [CrossRef]
- Liu, Z. China’s Carbon Emissions Report. 2016. Available online: https://dash.harvard.edu/handle/1/29916843 (accessed on 26 June 2023).
- Wu, Y.; Martens, P.; Krafft, T. Public awareness, lifestyle and low-carbon city transformation in China: A systematic literature review. Sustainability 2022, 14, 10121. [Google Scholar] [CrossRef]
- Etim, E.E.; Asuquo, J.E.; Gabriel, F.A. Public awareness of low-carbon economy in Nigeria: A case study of Akwa Ibom State. J. Appl. Sci. Environ. Manag. 2012, 16, 21–25. [Google Scholar]
- Reynolds, D.A. Gaussian mixture models. Encycl. Biom. 2012, 741, 659–663. [Google Scholar]
- Zheng, E.; Xue, C.; Chen, G.; Zhang, Y.; Zou, J. Unveiling urban marathon development characteristics and urban growth strategies in China: Insights from time series analysis of Baidu Search Index. PLoS ONE 2023, 18, e0287760. [Google Scholar] [CrossRef]
- Vrieze, S.I. Model selection and psychological theory: A discussion of the differences between the Akaike information criterion (AIC) and the Bayesian information criterion (BIC). Psychol. Methods 2012, 17, 228. [Google Scholar] [CrossRef] [PubMed]
- Moon, T.K. The expectation-maximization algorithm. IEEE Signal Process. Mag. 1996, 13, 47–60. [Google Scholar] [CrossRef]
- Yeh, J.R.; Shieh, J.S.; Huang, N.E. Complementary ensemble empirical mode decomposition: A novel noise enhanced data analysis method. Adv. Adapt. Data Anal. 2010, 2, 135–156. [Google Scholar] [CrossRef]
- Julong, D. Introduction to grey system theory. J. Grey Syst. 1989, 1, 1–24. [Google Scholar]
- Spearman, C. The proof and measurement of association between two things. Am. J. Psychol. 1987, 100, 441–471. [Google Scholar] [CrossRef]
- Yu, H.; Hutson, A.D. A robust Spearman correlation coefficient permutation test. Commun. Stat. Theory Methods 2022, 1–13. Available online: https://www.tandfonline.com/doi/full/10.1080/03610926.2022.2121144 (accessed on 10 June 2023). [CrossRef]
- Hochreiter, S.; Schmidhuber, J. Long short-term memory. Neural Comput. 1997, 9, 1735–1780. [Google Scholar] [CrossRef]
Disclaimer/Publisher’s Note: The statements, opinions and data contained in all publications are solely those of the individual author(s) and contributor(s) and not of MDPI and/or the editor(s). MDPI and/or the editor(s) disclaim responsibility for any injury to people or property resulting from any ideas, methods, instructions or products referred to in the content. |
© 2023 by the authors. Licensee MDPI, Basel, Switzerland. This article is an open access article distributed under the terms and conditions of the Creative Commons Attribution (CC BY) license (https://creativecommons.org/licenses/by/4.0/).