Abstract
To study the change in drought characteristics, it is helpful to explore the dynamics of drought, analyze the rules of drought, and prevent drought. The annual and seasonal standardized precipitation evapotranspiration index (SPEI) was calculated based on the meteorological data of the temperate steppe region of China from 1960 to 2020, and the spatio-temporal variation of drought characteristics was analyzed by combining the run-course theory to identify drought characteristics. The results show that: (1) During 1960–2020, the SPEI of the temperate steppe region fluctuated in the range of −1.5 to 1.5 and decreased significantly at a rate of −0.02·a−1 (p < 0.01). In general, there is an increasing trend of drought in the temperate steppe region. (2) There is little difference in the duration of drought in the four seasons, and the very low duration of drought is about 2 months. The cumulative drought intensity was higher in the semi-arid and semi-humid zones of the temperate zone. (3) The very low value of drought frequency occurred in summer, and the very high value of drought frequency occurred in winter. From SPEI-3 to SPEI-12, that is, from seasonal scale to interannual scale, with the increase of time scale, the distribution of the extreme value of drought frequency moved to the southwest, semi-arid, and arid areas. The frequency of the four drought levels showed light drought > middle drought > severe drought > extreme drought in all time scales and all zones.
1. Introduction
With global warming, the proportion of drought events occurring worldwide continues to grow [1]. The Sixth Assessment Report of the Intergovernmental Panel on Climate Change (IPCC) reveals that climate change is far more complex than “getting hotter”. Extreme drought events are increasingly the most important threat to global warming, and continued warming in the future will increase the frequency of extreme droughts. There has been a significant increase in droughts and flash droughts. In regions with higher levels of drought (such as northern China, western India, and parts of Africa), evet is limited by water, and the decrease in evet at the initial stage indicates that insufficient precipitation is the main driver of droughts and flash droughts [2,3]. Semi-arid regions replaced the sub-humid/humid regions where the climate became dry. The climate change in the dry and semi-arid regions of East Asia is mainly affected by the weakening of the East Asian summer monsoon [4]. With global temperatures already rising by 1.1 °C, extreme heat, heavy rainfall, and regional droughts will become more frequent and severe. Semi-arid regions will become drier due to reduced precipitation and increased demand for evaporation. Similarly, drought duration or severity may increase [5,6,7], and for drought, there are significant differences in drought recurrence periods at different time scales [8]. Since 1961, China has experienced a process from wetter to drier, with nearly 60% of meteorological stations in China showing a trend of humidification, with the areas of arid and humid regions decreasing while those of semi-arid and sub-humid regions increasing [9,10,11]. Due to the increase in precipitation and decrease in ET0 in most parts of southern China and northwestern Xinjiang, the climate has become wetter. Due to the decrease in annual precipitation and the increase in ET0, the climate in most parts of northwest and southwest China showed a significant drying trend [12,13,14,15,16,17]. Wu [18] pointed out that since 1961, the northwest, east, and southeast regions have shown a trend of wetting, while the central region has shown a trend of drying. The drought period in northwest China is longer than that in other regions, and north China and northeast China are two drought-sensitive regions.
Under the conditions of global change, drought is the main meteorological disaster for agriculture and animal husbandry in China, and it is also the extreme climatic event with the widest range, the deepest impact, and the highest frequency for temperate grassland in China. Grassland is the largest terrestrial ecosystem in China and has important ecological functions. As an important base for breeding biodiversity, developing animal husbandry, and regulating regional climate change, temperate grassland areas in China have important ecological benefits and agricultural and animal husbandry production values [19]. Its dry and wet changes are of great significance to the response to extreme climatic events such as drought, drought characteristics, rational utilization, and ecological protection. The frequency of drought events has increased significantly, leading to damage to the ecosystem function of temperate grassland in China, which not only greatly restricts the benign development of animal husbandry but also poses a serious threat to the ecological barrier in northern China. Di et al. [20] analyzed the spatial-temporal variation trend of wetness in China’s grassland areas during 1982–2018 based on the drought index and pointed out that China’s grassland areas experienced a process of first becoming dry and then gradually becoming wet, and the Inner Mongolia grassland region dominated the changes in dry and wet conditions in China’s grassland areas. The variation of wetness and dryness in the grassland region of China was dominated by precipitation. Meteorological drought has a great impact on vegetation growth in arid and semi-arid areas, and the impact of drought on vegetation has a lag effect. Different grassland types have different responses to drought at different scales. The influence of precipitation or temperature changes on grassland vegetation varies with vegetation type and season. The correlation between grassland vegetation and annual precipitation is low in meadow steppe and some areas of typical steppe, while the correlation between grassland vegetation and temperature shows a certain spatial differentiation [21,22,23]. During the growing season, the NDVI of temperate grassland vegetation showed an increasing trend, but there were some spatial differences. In addition to the time lag, the growth of temperate grassland vegetation in June and July has a higher demand for precipitation in the same period. In other words, precipitation is the most important factor affecting the growth of temperate grassland vegetation in China during the growing season. In the context of future climate change, the response of NDVI to drought in the typical grassland of Inner Mongolia will be more sensitive [24,25,26,27,28,29].
Relevant studies have shown that the overall temperature in temperate grassland areas has increased significantly, the precipitation region has a significant difference, and there is a trend of increasing drought years and increasing drought [30]. The inter-annual drought in Inner Mongolia showed an increasing trend; the drought in the eastern region was aggravated, while the drought in the western region showed a decreasing trend. The frequency of light drought is higher, and the southeast drought is more frequent. In the future, the drought in Inner Mongolia will maintain the current trend and continue for some time [31]. From 1982 to 2019, climatic drought in northern China has been worsening, mainly in central and eastern Xinjiang, northern Qinghai, and eastern Inner Mongolia [11,32]. At present, drought studies in different regions and temperate steppe areas of China are mostly focused on drought changes in different regions and river basins. Studies on the spatio-temporal evolution and driving factors of drought dynamics [24,33,34,35,36,37,38,39,40,41,42]. The analysis of drought characteristics in the whole temperate steppe region and different grassland types in the temperate steppe is still lacking. This paper analyzes the spatio-temporal variation of drought characteristics in temperate grassland in the past 61 years by using long-term climate data in order to find and summarize the drought evolution characteristics of the whole temperate grassland and different grassland types and provide a theoretical basis for further understanding of dry and wet climate changes in temperate grassland.
2. Materials and Methods
2.1. Study Area
China’s temperate steppe is a part of Eurasian grassland region and the third-largest steppe distribution area in the world, mainly distributed in the Loess Plateau, Inner Mongolia Plateau, and Songliao Plain. It is distributed in the semi-arid to semi-humid climate of the temperate zone, with an average annual temperature of −5–10 °C and annual precipitation of 250–650 mm, with high precipitation variability. The vegetation structure of grassland is relatively simple, and the seasonal changes are obvious. It plays an important role in breeding biodiversity and regulating regional climates. According to the vegetation zoning map of China compiled by the Geographical Atlas of China, the temperate steppe region was selected as the study area. Refs. [43,44] studied the types and distribution of grassland in China and divided the grassland types in the study area into three categories: temperate meadow steppe, temperate steppe, and temperate desert steppe, as shown in Figure 1b. Temperate meadow steppe, which grows under moderately humid conditions and is characterized by humus-rich meadow soil, is mainly distributed in the piedmont plain on the east side of the Greater Hinggan Mountains, the northeast plain, and the piedmont plain of Taihang Mountain. The temperate steppe is mainly distributed in the temperate semi-arid and semi-humid climate zones, mainly in Hulunbuir Plateau, the east of Northeast Plain, the west of Inner Mongolia Plateau, and the north of Loess Plateau. Desert steppe is distributed in the transition zone to desert. It is a kind of temperate steppe with relatively dry, simple species and low primary productivity. It is mainly distributed in the west of Inner Mongolia Plateau, Ulan Buh Desert, and other areas.
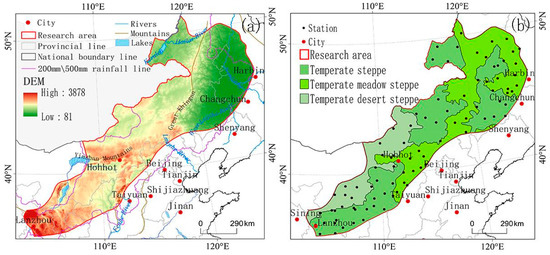
Figure 1.
Overview (a) and subdivision (b) of the study area.
2.2. Data
In this study, the daily observation data of meteorological stations in the temperate steppe region of China were used. After processing outliers and screening unmeasured data stations, data from 88 meteorological stations in the study area were selected. Meteorological factors included precipitation, daily mean temperature, average minimum temperature, average maximum temperature, sunshine duration, average wind speed, and relative humidity. Meteorological data from the National Oceanic and Atmospheric Administration’s website (https://www.ncei.noaa.gov/data (accessed on 5 March 2022)), download data set points years, time span is 1960–2020, based on ARCGIS, MATLABs and SPASS platforms for data preprocessing. To calculate the monthly value of meteorological data so as to facilitate subsequent research.
The statistics used in this study were obtained from the National Data Center for Meteorological Sciences (http://data.cma.cn/ (accessed on 21 March 2023)). In addition, the information of meteorological disaster ceremonies and grass-roots meteorological stations in the provinces and regions involved in the study area, such as Inner Mongolia Autonomous Region, Northeast Three Provinces, Shanxi, Shaanxi, and Gansu, etc., is selected as auxiliary data for comparative analysis, providing certain and reliable realistic support for the research results and enhancing the realistic persuasibility of the research results.
2.3. Methods
2.3.1. Calculation of Standardized Precipitation Evapotranspiration Index
Calculate potential evapotranspiration (). The potential evapotranspiration was calculated using the Penman–Monteith model (P–M model), recommended and revised by FAO in 1998. The formula and elements are as follows:
where is the potential evapotranspiration, is the net radiation, is the soil heat flux, is the psychrometer constant, is the average air temperature at a surface height of 2 m, is the average wind speed at a surface height of 2 m, is the saturated water vapor pressure, is the actual water vapor pressure, and is the slope of the saturated water vapor pressure curve at the current air temperature.
To calculate the difference between precipitation and sum of last month at different time scales, the specific formula is as follows:
where is the net precipitation on different time scales and the of month in year depends on the selected time scale . For example, the formula for calculating the cumulative difference in month of year on the 12-month time scale is:
where is the difference between and in month of the year , mm.
The exponential sequence is obtained by standardizing the D sequence using the log-logistic probability distribution. Probability density function:
where and are scale, shape, and position parameters, respectively.
The probability distribution function of the sequence is calculated by the following formula:
The value of can be calculated from the standardized value of :
where, when , , is the probability of exceeding the value of , . Then, , is replaced by , and then inverts the obtained value. The constant , , , , , and . According to the national standard for meteorological drought rating (GB/T 20481-2017), the drought rating is divided into 5 levels, as shown in Table 1. In general, SPEI values on different time scales have different sensitivity to drought or humid conditions. In this study, SPEI values from May, August, November, and February of the following year in SPEI-3 were selected to represent seasonal drought. That is, spring (March to May), summer (June to August), autumn (September to November), winter (December to February of the following year), and December of SPEI-12 were used to represent the interannual drought. At present, most studies at home and abroad use this index, and multi-time-scale SPEI can better characterize drought characteristics.

Table 1.
Drought classification of SPEI index.
2.3.2. Run Length Theory
Run-course theory was proposed by Yevjevich [45] and has been widely used in drought identification and characterization. A run course refers to the part of all the values in the time series that is lower than or above a truncation threshold. The part higher than the truncation threshold is a positive run, while the part lower than the truncation threshold is a negative run. Based on the calculated SPEI value, two characteristic variables, duration and intensity, were separated from the SPEI series by the run-course theory. Drought duration represents the duration of a drought event from its occurrence to its end, and drought intensity is the cumulative value of the SPEI in the course of the drought event. Set 3 truncation levels, X0, X1, and X2 (X represents SPEI value), and the identification process of a drought event is as follows:
- (1)
- When the SPEI value is less than X1, the drought event is preliminarily determined in this month.
- (2)
- For a drought event with a duration of 1 month, when its SPEI value is greater than X2, it is considered that there is no drought in this month, and it is eliminated.
- (3)
- When the time interval of two adjacent drought processes is only 1 month and the SPEI value in that month is less than X0, the two adjacent drought processes are combined into one drought event; the drought duration is the sum of the two drought durations plus 1, and the drought intensity is the sum of the intensity of the two drought events; otherwise, it is two independent drought processes.
The drought event is actually a negative run, so the first truncation level is set to X0 = 0 (monthly average SPEI value); based on the SPEI classification criteria, when the SPEI value is less than −0.5, light drought occurs, and the second truncation level is set to X2 = −0.5 (the SPEI value when light drought occurs). When the SPEI value for 1 or more time periods is continuously between −0.5 and −0.3, drought is also considered to occur, so the third truncation level is set as X1 = −0.3.
2.3.3. Inverse Distance-Weighted Interpolation (IDW)
Inverse distance weight interpolation is a direct interpolation method of spatial surfaces based on the assumption that all the sample points have local influence on the prediction of the predicted point value, and its influence decreases with the increase in distance. In this study, spatial interpolation of wetness index was conducted based on ArcGIS10.7 so as to carry out spatial differentiation analysis.
3. Results
3.1. Analysis of Drought Trend in Temperate Steppe
3.1.1. Analysis of Inter-Annual Drought Change Trend
The temporal variation characteristics and trends of drought events and drought index in the temperate steppe region of China during 1960–2020 were analyzed (Figure 2). During 1960–2020, the SPEI of the temperate steppe region fluctuated in the range of −1.5–1.5 and decreased significantly at a rate of −0.02·a−1 (p < 0.01). In the temperate steppe region of China, during the past 61 years, there has been an overall trend of worsening drought. Specifically, the drought years were the most significant in 1965, 1972, 1982, 1997, 2000–2001, 2004–2007, and 2017. The year 2000 is the most prominent year, which is highly consistent with records such as the Meteorological Disaster Festival and the government portal website of the China Meteorological Administration. Take the year 2000 as an example: a large-scale spring and summer drought occurred in temperate grassland areas and northern China. It is recorded that the precipitation in most northern areas in the spring and summer of 2000 was significantly less than that in the same period of the year, and the temperature was higher than that in the same period, resulting in a large-scale spring drought. In 2000, the drought affected a wide range, had a long duration, and was serious, notably in Inner Mongolia, Gansu, Shaanxi, the three northeast provinces, Hebei, and so on. The drought-affected area in China reached 4054 × 104 hm2, which was the largest since the founding of the People’s Republic of China.
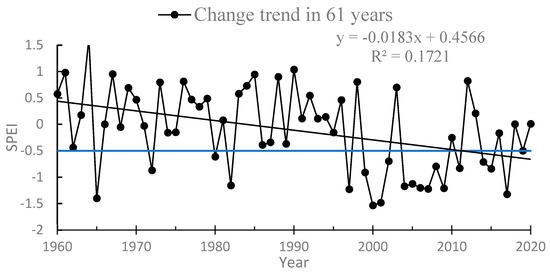
Figure 2.
Temporal variation and trend of SPEI in temperate grasslands during 1960–2020.
On the interdecadal scale, the rates increased significantly in the 1970s and 1980s at 0.058·a−1 (p < 0.01) and 0.057·a−1 (p < 0.01), respectively, showing a trend of relative wetness. Other decadal periods showed a significant decline trend, with the most significant decline in the 1990s, which fluctuated sharply and the decline rate was −0.126·a−1 (p < 0.01), followed by the end of the 20th century and the beginning of the 21st century, and relatively moderate in the 1960s and the beginning of the 21st century (Figure 3).
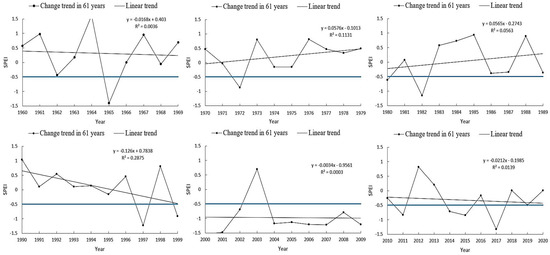
Figure 3.
Temporal variation and trend of interdecadal SPEI in temperate steppe during 1960–2020.
3.1.2. Trend Analysis of Seasonal Drought
From the perspective of seasonal scale, summer drought and winter drought in temperate steppe showed a significant decreasing trend, with decreasing rates of −0.0145·a−1 (p < 0.01) and −0.0147·a−1 (p < 0.01), respectively, followed by spring with a decreasing rate of −0.0081·a−1 (p < 0.01). As can be seen from the figure, the SPEI values in the four seasons in the study area showed a downward trend. Summer and winter showed a significant drought trend, and the decline was relatively less obvious in autumn. This is consistent with the actual record. Take the great drought of 2000 as an example. In 2000, widespread drought occurred in north China and the study area, mainly in the spring and summer. In North China and the eastern Northwest, the drought mainly occurred from February to July, during which the central and western parts of Inner Mongolia, Ningxia, and western Gansu reached the standard of great drought. In 1997–1998, a severe summer drought occurred in the study area, with continuous low rainfall and high temperatures. The fact of drought is consistent with the trend change of seasonal scale drought in this study, which has certain practical basis and theoretical significance (Figure 4).
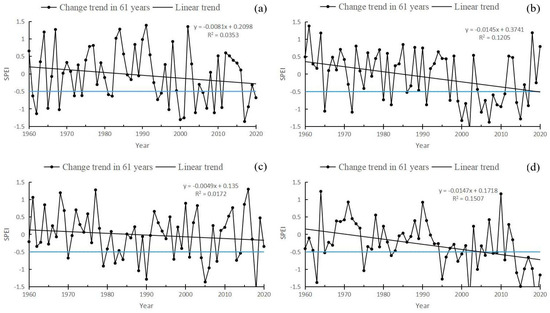
Figure 4.
SPEI time changes and trends in spring (a), summer (b), autumn (c), and winter (d) of temperate steppe from 1960 to 2020. (The threshold for drought occurs when the blue line SPEI equals −0.5).
3.2. Analysis of Spatial-Temporal Variation of Drought Duration in Temperate Steppe
3.2.1. Analysis of Duration of Interannual Drought
As shown in Figure 5, during 1960–2020, under the SPEI-12 scale, the duration of drought in the west of the Hulunbuir Plateau, from Ulanhot to Xilin Hot, Tongyu, Tongliao, and Chifeng, had a higher value, with the maximum duration reaching 13 months. The duration of drought in other areas of the study area is lower. In different grassland types, the maximum duration of drought appeared in temperate grassland and relatively humid meadow grassland, and the maximum duration of drought was as long as 13 months, and the minimum duration of drought was about 2 months in the three grassland types. The maximum duration of drought in temperate desert steppe is 8 months, mainly distributed in the southwest of Erenhot, Inner Mongolia, which is nearly half a year less than that in temperate steppe and temperate meadow steppe. The reason may be that different grassland vegetation types have different response times and sensitivity to climate factors such as temperature and precipitation. For example, temperate desert steppe is a kind of grassland that transits from grassland to desert. Precipitation is relatively scarce in the region, and the plants growing there are mainly drought-tolerant plants with few leaves and deep roots. Therefore, this type of grassland cannot respond to drought events in time.
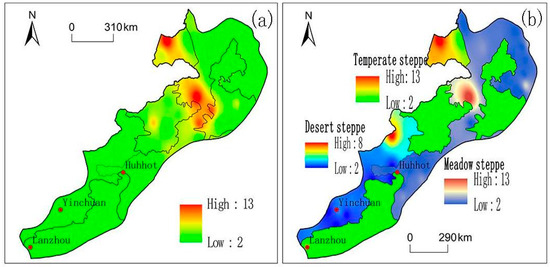
Figure 5.
Spatial distribution of interannual drought duration for the whole (a) and subregions (b) of temperate grasslands during 1960–2020 (unit: month).
3.2.2. Analysis of Duration of Seasonal Drought
As far as the four seasons are concerned, there is little difference in the duration of drought in the four seasons in the study area, and the very low value of drought duration is about 2 months. As shown in Figure 6d, the highest extreme value was 8 months in winter, and the lowest extreme value was 4 months in autumn. The extreme value of drought duration in spring and summer was the same, but the spatial distribution was different. The high value of drought duration in spring was mainly distributed in Ulanhot, Inner Mongolia; Qian’an, Jilin; Tongliao, Inner Mongolia; East Ujumuqin, Inner Mongolia; Xilinhot, Inner Mongolia; Guyuan, Ningxia; and Lanzhou, Gansu. Comparatively, the high summer drought duration was mainly concentrated in the northeast of the study area in Inner Mongolia: Manzhouli, Erguna, Hulunbuir (Hailar), Qiqihar in Heilongjiang, Anda to Tongyu in Jilin, and Wengniute Banner in Inner Mongolia. The high duration of the autumn drought was mainly distributed in the areas of Mandula, Sunite Left Banner, and Zhurihe in Inner Mongolia, and Yulin to Hengshan in Shaanxi. Although the high value of winter drought duration was high, its distribution range and region were limited; it was mainly distributed in Duolun and Huade of Inner Mongolia, Zhangbei of Hebei Province, and Dongsheng of Inner Mongolia.
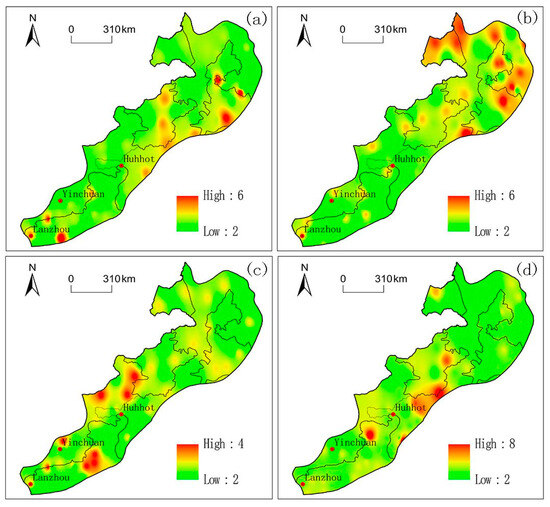
Figure 6.
Spatial distribution of drought duration in spring (a), summer (b), autumn (c), and winter (d) of temperate steppe from 1960 to 2020 (unit: month).
3.3. Spatio-Temporal Variation of Drought Time in Temperate Steppe
3.3.1. Analysis of Interannual Drought Time
The overall spatial distribution of drought time in the temperate grassland region during 1960–2020 is shown in Figure 7. Among them, SPEI-3 has the largest extreme value of drought time, as shown in Figure 7a, while SPEI-12 has the smallest extreme value of drought time, as shown in Figure 7b. The indices of drought time on the two timescales show great differences. The regions with higher SPEI-3 drought times are concentrated in the west of the Nenjiang River to the north of the West Liaohe River, the west of the Inner Mongolia Plateau, and the south of the 500 mm iso-precipitation line. Ulanhot, Baicheng, and Tongyu—the areas with high SPEI-12 drought times—were mainly concentrated in the southwest end of the study area, the eastern Qilian Mountains, the junction of Ningxia, Inner Mongolia, and Gansu, and the Zhongwei area; semi-arid and arid confluence areas were more frequent. In summary, with the increase in time scale, the extreme distribution of drought time moves to the southwest, semi-arid, and arid areas.
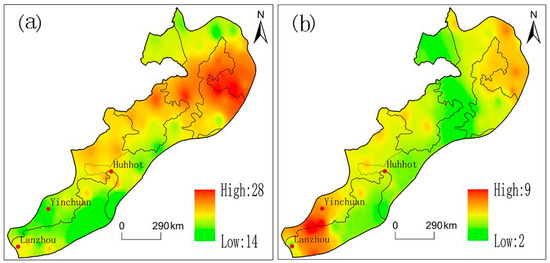
Figure 7.
Spatial distribution of drought time on the overall SPEI-3 (a) and SPEI-12 (b) time scales in temperate steppe region.
At the level of each station in the study area, according to the station time ratio of different drought grades each year (Figure 8). Since 61 years, drought conditions have been more severe in some years, and the stations and regions with no drought account for 77%; among the stations’ time ratio, the proportion of light drought and middle drought is larger, and the proportion of severe drought and extreme drought in some abnormal years is expanding. Since 1960, the proportion of light drought stations was the largest at 47% in 2015, and the proportion of extreme drought stations was the largest at 36% in 2007. Around 2000, the drought grade increased and the drought scope expanded, and the drought frequency ratio of no drought stations decreased to its lowest level, while the drought time ratio of severe drought stations reached about 51%. Meteorological disaster records show that in 2000, there was a national drought disaster in China, especially in the north of the Yangtze River. The drought scope was wide, the duration was long, and the drought grade showed a worsening trend.
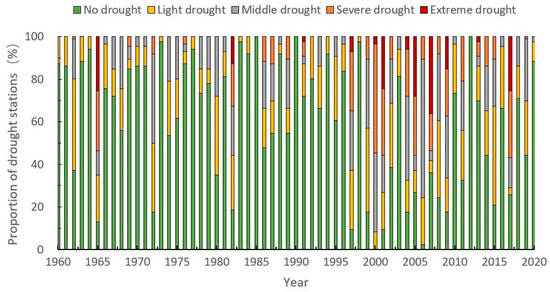
Figure 8.
Inter-annual ratio of different drought-grade stations in temperate steppe region during 1960–2020.
3.3.2. Analysis of Seasonal Drought Time
On the seasonal scale, the time of drought was also different according to different grassland types. As shown in Figure 9, the very low time of drought occurred in summer, ranging from two to seven times, and the low time areas were mainly concentrated in Hulunbuir Plateau, the southern end of the Greater Hinggan Mountains, Qingyang in Gansu Province, and central Shaanxi Province. The extremely high drought time occurred in winter and was concentrated in the eastern part of the Inner Mongolia Plateau, the western part of the Greater Hinggan Mountains, the northern part of the Hunshandak Sandy Land, and the Xilinhot area. The drought time from Songnen Plain to the Lesser Hinggan Mountains also showed a slightly higher state; the temperate steppe near the northeast Plain, the Songliao watershed, and the Horqin Sandy land had the highest drought time in summer, and even the phenomenon and situation of autumn drought appeared. The very low drought time of temperate meadow steppe appeared in autumn and concentrated in the north of the Northeast Plain, the west of the Lesser Khingan Mountains, and the area of Ilhuli Mountain. The extremely high value appeared in winter, distributed in the south of Ulanhot, Baicheng, and Songyuan, which was consistent with the extreme value of the drought time in temperate grassland. In general, the high value of drought time in temperate meadow steppe moved from north to south from spring to autumn, and the high value moved back to north again after autumn. From spring to autumn, the high value of drought time in temperate desert steppe gradually moved from Erenhot in the northeast of Inner Mongolia Plateau to the southwest of Hetao Plain and Ordos Plateau to Yinchuan, and then returned to the northwest after autumn. The high and low drought times in spring and winter were the same, 3–8 times, while the difference between the high and low drought times in autumn decreased, and the high drought times were concentrated in Bayannur and Baotou.
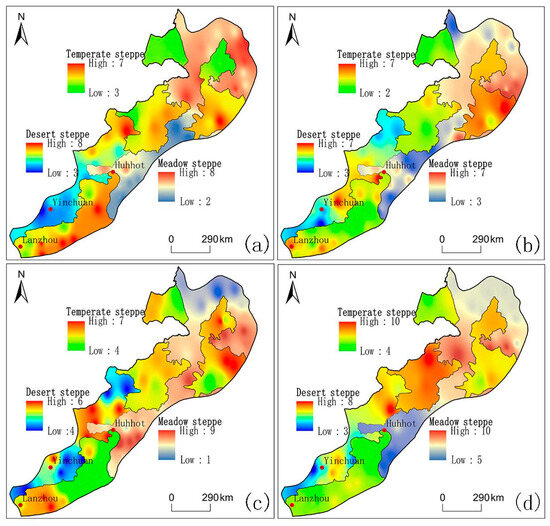
Figure 9.
Spatial distribution of drought frequency in spring (a), summer (b), autumn (c), and winter (d) in different regions.
3.4. Spatio-Temporal Variation of Drought Intensity in Temperate Steppe
3.4.1. Analysis of Interannual Drought Intensity
As shown in Figure 10, during 1960–2020, the places with strong drought intensity under the SPEI-12 scale are mainly concentrated in Inner Mongolia, including Manzhouli, Holingol, Zarout Banner, Balinzuo Banner, and Abaga Banner in Inner Mongolia, with the highest drought intensity reaching −19.1. In general, the areas with strong drought intensity are roughly located from Hulunbuir Sandy Land to the north of Horqin Sandy Land and extend to the Hunshandak Sandy Land in the southwest; that is, the temperate semi-arid and semi-humid boundary zones such as the southwest of Songliao Plain and the south of the Greater Khingan Mountains have high cumulative drought intensity when drought occurs. In addition, the cumulative drought intensity in the Tongyu area of Jilin Province is relatively higher than that in other areas.
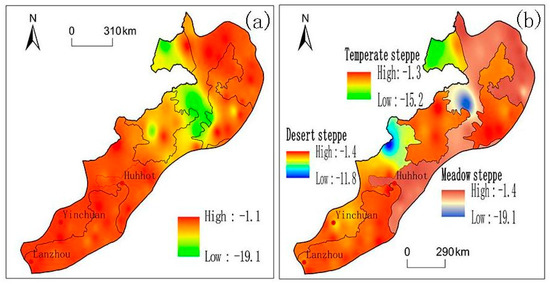
Figure 10.
Inter-annual distribution of drought intensity in temperate steppe as a whole (a) and in subregions (b) during 1960–2020.
In each grassland type zone, the highest drought intensity appeared in temperate meadow steppe, and the highest drought intensity value was −19.1, mainly in the Huolingole area of Inner Mongolia, which was consistent with the overall spatial distribution of drought intensity. The temperate steppe followed, with a maximum value of −15.2, and the temperate desert steppe, with a maximum value of −11.8, appeared in Erenhot, Inner Mongolia. The very low value of drought intensity was not different among the three steppe types.
3.4.2. Analysis of Seasonal Drought Intensity
The spatial distribution of drought intensity in different seasons is very different. The maximum value of drought intensity appears in winter, and the range of higher drought intensity is wide. The maximum value of drought intensity is −12.3. It is widely distributed in a wide range of areas in the middle of the study area, including Xiwuqin Banner in Inner Mongolia, Huadou to Zhangbei in Hebei Province, Dongsheng in Inner Mongolia, Damao Banner to Baotou in Inner Mongolia, and Wuqi, Hengshan, and Suide in Shaanxi Province. It is mainly distributed along the dividing lines of arid, semi-arid, and sub-humid. The highest value of summer drought intensity was −8.9, which was widely distributed in the northeast of the study area, including Erguna, Hulunbuir of Inner Mongolia, Baicheng, Tongyu, and Changling of Jilin Province. Other weather sites and regions with high drought intensity are scattered, such as Wengniute Banner, Sunite Left Banner, and Xiwuzhumuqin Banner in Inner Mongolia. The highest drought intensity in spring is −7.6. High drought intensity mainly occurs in East Uzhumuqinqi, Xilin Hot, Ulanhot, Tongliao, and Guyuan in Ningxia. The difference in the threshold of drought intensity in autumn is small, and the distinction of spatial distribution is fuzzy. The maximum value of drought intensity in autumn is the smallest among the four seasons, which is −5.2. The maximum value of drought intensity in autumn is highly consistent with the distribution region of the total maximum value of drought intensity in the study area on an inter-annual scale. In addition, the very low value of drought intensity on the four-season scale had little difference, ranging from −1.1 to −1.4, and the distribution was relatively dispersed and extensive (Figure 11).
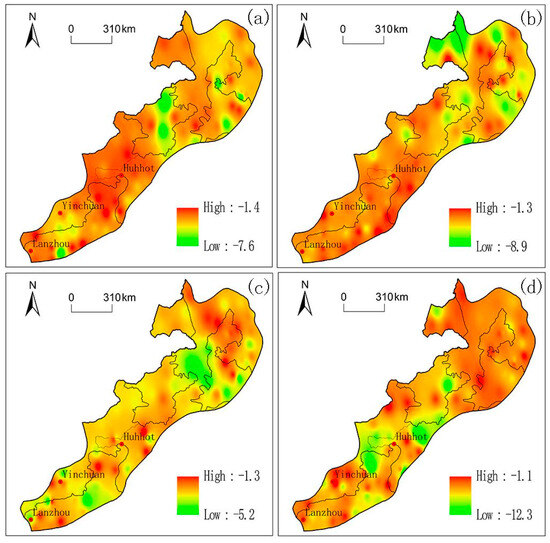
Figure 11.
Spatial distribution of drought intensity in spring (a), summer (b), autumn (c), and winter (d) of temperate steppe.
3.5. Spatio-Temporal Variation of Drought Frequency in Temperate Steppe
3.5.1. Analysis of Interannual Drought Frequency
Based on the SPEI value, the severity of the drought was divided into four levels: light drought, middle drought, severe drought, and extreme drought. It is worth confirming that the frequency of the four drought levels showed light drought > middle drought > severe drought > extreme drought in all time scales and all zones. On the interannual scale, the frequency of light drought was 7–28%. The regions with a high frequency of light drought were mainly located in Erguna and Hulunbuir of Inner Mongolia, Zhaozhou of Heilongjiang Province, Qian ‘an of Jilin Province, and Qianguoros of Jilin Province, as well as the regions of Narenbaolig, Sunit Left Banner, and Erenhot of Inner Mongolia, which were located in the middle of the study area. The frequency of medium drought was between 5 and 21%, and Lanzhou of Gansu to Yinchuan of Ningxia had the highest frequency of medium drought in the study area, followed by Ulanhot to Baicheng and extending to Xilinhot to Chifeng. The extremely high frequency of severe drought was 15%, which was concentrated in the vast areas from Holingol to Zalute Banner in Inner Mongolia, and the frequency of severe drought was 0% in some areas. The frequency of extreme drought was the lowest; the threshold was between 0% and 7%, and it occurred from Sunit Right Banner to Xilin Hot and from Heilongjiang Rich Yu to Zhalantun of Inner Mongolia, with a lower frequency and more concentrated occurrence (Figure 12).
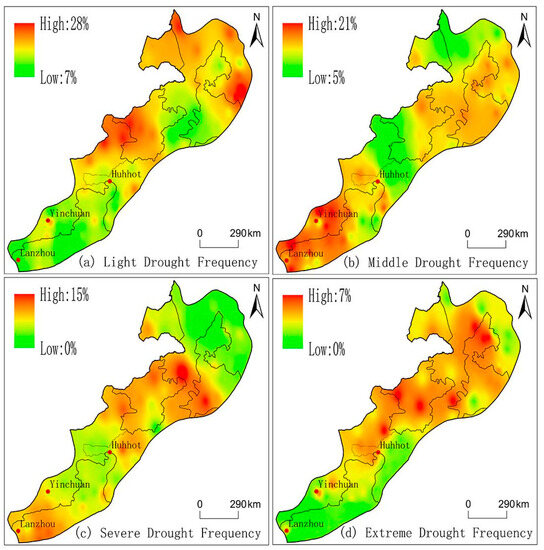
Figure 12.
Spatial distribution of drought frequency in different drought grades at interannual scale.
3.5.2. Analysis of Seasonal Drought Frequency
According to the occurrence frequency of different drought grades, the occurrence frequency and spatial distribution of the season are also different. In Figure 13, the four figures in the upper left corner (a, b, c, and d) show the frequency of each drought grade in spring, and the four figures in the upper right corner (e, f, g, and h) show the frequency of summer, etc. The high value of light drought occurs in winter, with a frequency of 33%, and is concentrated in Linxi, Inner Mongolia; the very low value of light drought frequency is 5%, which occurs in winter and summer. The distribution of the very low value of light drought frequency in winter is relatively narrow, mainly distributed in the Hulunbuir region, while the spatial distribution is relatively wide in summer. The extremely high value of medium drought frequency also appeared in autumn and winter, with a frequency of 28%, which was concentrated but distributed in different regions. The extremely high value of medium drought frequency in autumn mainly appeared in Qian’an and Ningxia of Jilin Province, while the extremely high value of medium drought frequency mainly appeared in Keshan of Heilongjiang Province and the southwest of New Barhuyou Banner in winter. The extremely high frequency of severe drought also occurred in winter (18%), followed by spring and summer (16%). The high frequency of severe drought basically moved from the northeast of the study area to the southwest from spring to winter, and the distribution was loose in autumn. The frequency of extreme drought was the lowest, and there was little difference in the four seasons. Except for the high frequency of extreme drought in winter, the spatial distribution of spring, summer, and autumn was relatively concentrated, and there was overlap with other drought grades.
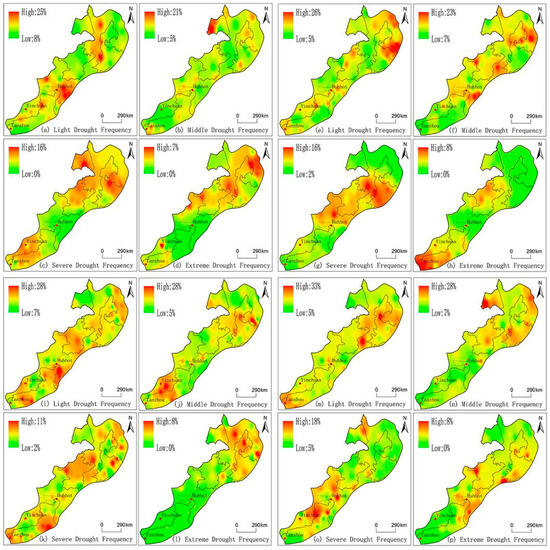
Figure 13.
Spatial distribution of occurrence frequency of different drought grades at seasonal scale.
4. Discussion
The SPEI index is used to study the variation of drought characteristics in the temperate steppe region. The results show that drought has been increasing significantly since 1960. This is consistent with the results of Na et al.’s study [46], which showed that extreme cold weather events showed a significant downward trend while extreme warm weather events showed an upward trend in Inner Mongolia, which may lead to enhanced evaporation and enhanced aridification. Zhang et al. [47] analyzed the annual and seasonal climate change and drought characteristics and trends of Hulunbuir Grassland in the past 58 years and showed that the trend of aridification in Hulunbuir Grassland in the past 58 years was significant against the background of a significant increase in temperature and decrease in precipitation, which was consistent with the results of this paper. However, it is worth mentioning that Zhang et al. believed that the SPEI index and the drought events in Hulunbuir Grassland after 2000 both showed that the trend of aridity in this region was more significant, which was different from the conclusion of this paper that the drought trend was the most significant after 1990. The reason for this is that Zhang’s research scope was limited to Hulunbuir Grassland. However, the scope of this study is slightly larger, and the conclusions obtained are the synthesis of the whole temperate grassland region, so there are slight differences in some inter-annual scales, but the overall trend is consistent. Jiao et al. took a representative arid and semi-arid desert steppe in Sunit Youqi as the study area [48] and compared and analyzed the spatio-temporal dynamic changes of vegetation indicators in the whole steppe over the past 10 years and their responses to climate changes. The results showed that the climate in the study area showed a trend of cooling and drying, and the annual changes in temperature and precipitation showed a unimodal pattern. Jiao’s research conclusion on the climate drying in the study area is consistent with the research results of this paper on the trend toward aridity. However, since this study did not involve the change of specific meteorological factors such as temperature, the specific leading factors of drought in the temperate steppe region need to be further analyzed.
There were differences in drought frequency, duration, and intensity among different grassland regions and seasons in the study area. According to Zhang et al., in the early 21st century (2000–2017), the total frequency of drought and the frequency of severe drought and extreme drought were significantly higher than those in other years. The seasonal distribution of drought of different grades was significantly different. Among them, winter, summer, and autumn were the seasons with the highest frequency of middle drought, severe drought, and extreme drought, respectively, which was consistent with the research results of increasing drought grade, expanding drought scope, decreasing the drought-free station ratio to the lowest before and after 2000, and the seasonal and regional differences of drought frequency of different grades being significant. However, the seasons corresponding to the high frequency values of different drought grades are different from the results of Zhang et al. According to this study, the highest frequency of severe drought occurs in winter rather than autumn, and the frequency of extreme drought has little difference in summer, autumn, and winter. Guo et al. [31] pointed out that in Inner Mongolia, the distribution characteristics of light drought, middle drought, severe drought, and extreme drought are the same in the four seasons, and they all show the characteristics of light drought > middle drought > severe drought > extreme drought. Extreme drought occurs in a wide range in spring, summer, and autumn, while light drought and middle drought are widely distributed in winter. Their distribution characteristics are highly consistent with the study in this paper, but their spatial distribution on the seasonal scale is slightly different, mainly due to the differences in the study area scope and study period. Luo et al. [49] showed that the response of semi-arid grasslands to periodic drought was related to community functional composition. Li et al. studied the impact of climate change on the vegetation of temperate grasslands in northern China [23], and the results showed that there were obvious differences in the time-lag effect of vegetation growth on precipitation in grasslands. In the order of desert steppe—typical steppe—meadow steppe, that is, from east to west, the time lag gradually increased. The temporal and spatial changes of vegetation cover in temperate steppe, the response effects to wet and dry climate changes, and their mechanisms will be strengthened in subsequent studies.
5. Conclusions
This paper analyzes the spatio-temporal changes of drought characteristics in the temperate steppe regions and subregions of China on the SPEI interannual and seasonal time scales during 1960–2020. The main conclusions are as follows:
(1) During 1960–2020, the SPEI in the temperate steppe region fluctuated between −1.5 and 1.5 and decreased significantly at a rate of −0.02·a−1 (p < 0.01). In the temperate steppe region of China during the 61 years, there was an overall trend of worsening drought, but there were slight differences in different decades. The SPEI values for the four seasons in the study area showed a downward trend. The trend of drought in the summer and winter is obvious.
(2) The difference in drought characteristics in the study area is obvious. The maximum duration of drought appeared in the temperate steppe and relatively humid meadow steppe, and the maximum duration reached 13 months. The drought duration of the three steppe types was at least about 2 months, and there was little difference between the four seasons of drought duration in the study area. The cumulative drought intensity is high in the semi-arid and semi-humid zones of the temperate zone, such as the southwest of the Songliao Plain and the south of the Greater Khingan Mountains. From SPEI-3 to SPEI-12, that is, from seasonal scale to interannual scale, the distribution of extreme drought frequency moved to the southwest, semi-arid, and arid regions with the increase in time scale. In all time scales and in all regions, the frequency of drought grade showed the order of light drought > medium drought > severe drought > extreme drought, and the highest value of medium severe drought occurred in winter, which was more consistent with other drought characteristics such as drought intensity.
Author Contributions
Methodology, J.C.; software, J.C.; resources, J.C. and J.Z.; writing—original draft preparation and writing—review and editing, J.C. and F.G.; supervision, B.Z. All authors have read and agreed to the published version of the manuscript.
Funding
This research received no external funding.
Institutional Review Board Statement
Not applicable.
Informed Consent Statement
Not applicable.
Data Availability Statement
Not applicable.
Conflicts of Interest
The authors declare no conflict of interest.
References
- Yuan, X.; Wang, Y.M.; Ji, P.; Wu, P.L.; Justin, S.; Jason, A.O. A global transition to flash droughts under climate change. Science 2023, 380, 187–191. [Google Scholar] [CrossRef]
- Yao, N.; Li, Y.; Lei, T.; Peng, L.L. Drought evolution, severity and trends in mainland China over 1961–2013. Sci. Total Environ. 2018, 616–617, 73–89. [Google Scholar] [CrossRef]
- Xu, C.J.; Dou, Y. Analysis of drought characteristics in Xinjiang in recent 60 years based on standardized precipitation evapotranspiration index. Gansu Water Resour. Hydropower Technol. 2023, 59, 22–28. [Google Scholar]
- Huang, J.P.; Ji, M.X.; Xie, Y.K.; Wang, S.S.; He, Y.L.; Ran, J.J. Global semi-arid climate change over last 60 years. Clim. Dyn. 2015, 46, 1131–1150. [Google Scholar] [CrossRef]
- Wang, L.; Zhang, B.C.; Shi, Y.; Han, Z.Y.; Lu, B. Interpretation of the IPCC AR6 on the impacts and risks of climate change. Clim. Chang. Res. 2022, 18, 389–394. [Google Scholar]
- Jiang, D.B.; Wang, X.X. A brief interpretation of drought changes from IPCC Sixth Assessment Report. Trans. Atmos. Sci. 2021, 44, 650–653. [Google Scholar]
- Jiang, T.; Zhai, J.Q.; Luo, Y.; Su, B.D.; Chao, Q.C.; Wang, Y.J.; Wang, G.J.; Huang, J.L.; Xu, R.H.; Gao, M.N.; et al. Understandings of assessment reports on climate change impacts, adaptation and vulnerability: Progress from IPCC AR5 to IPCC AR6. Trans. Atmos. Sci. 2022, 45, 502–511. [Google Scholar]
- Yonca, C.; Hafzullah, A. Critical drought severity/intensity-duration-frequency curves based on precipitation deficit. J. Hydrol. 2020, 584, 124312. [Google Scholar]
- Chen, J.; Zhang, B.; Yao, R.; Zhang, X.; Zhang, Y.; Zhou, J. Dry and Wet Changes and Vegetation Time-Delay Responses in Western China. Atmosphere 2022, 13, 2013. [Google Scholar] [CrossRef]
- Gao, G.; Li, Y.; Chen, Y.X.; Feng, A.Q. The evolution characteristics of drought spatio-temporal law in China in the recent 30 years. China Flood Drought Manag. 2023, 33, 1–8. [Google Scholar]
- Li, S.F.; Ge, W.Y.; Wang, F. Characteristics of Drought Events and Their Impacts on Vegetation in Northern China from 1982 to 2019. Res. Soil Water Conserv. 2023, 30, 251–259. [Google Scholar]
- Xie, N.X.; Xiong, L.H.; Li, J.Y.; Wang, T.Y. On the Spatio-Temporal Characteristics of Meteorological Drought in Yangtze River Basin based on SEPI. Hydropower New Energy 2023, 37, 30–35. [Google Scholar]
- Ge, Y.K.; Zhao, L.L.; Chen, J.S.; Ren, Y.N.; Li, H.Z. Spatio-temporal evolution trend of meteorological drought and identification of drought events in southwest China from 1983 to 2020. Ecol. Environ. Sci. 2023, 32, 920–932. [Google Scholar]
- Hu, Q.; Dong, B.; Pan, X.B.; Jiang, H.F.; Pan, Z.H.; Qiao, Y.; Shao, C.X.; Ding, M.L.; Yin, Z.W.; Hu, L.T. Spatiotemporal variation and causes analysis of dry-wet climate over period of 1961–2014 in China. Trans. Chin. Soc. Agric. Eng. 2017, 33, 124–130. [Google Scholar]
- Chai, R.F.; Chen, H.S.; Sun, S.L. Attribution analysis of dryness/wetness change over China based on SPEI. J. Meteorol. Sci. 2018, 38, 423–431. [Google Scholar]
- Liu, H.; Jiang, L.L.; Liu, B.; Liu, R.; Xiao, Z.L. Characteristics of drought in China and its effect on vegetation change in recent 40 years. Acta Ecol. Sin. 2023, 43, 1–14. [Google Scholar]
- Wang, L.; Xie, X.Q.; Li, Y.S.; Tang, D.Y. Changes of humid index and borderline of wet and dry climate zone in northern China over the past 40 years. Geogr. Res. 2004, 23, 45–54. [Google Scholar]
- Wu, M.J. Spatiotemporal Variability and Driving Mechanisms of Drought Based on Standardized Precipitation Evapotranspiration Index; Northwest Agriculture & Forestry University: Xianyang, China, 2020. [Google Scholar]
- Sun, C.Z.; Tang, S.M.; Wang, Z.; Li, N.; Xu, X.B.; Yuan, F.Q.; Wang, C.J.; Li, Y.H.; Zhang, Y.J.; Li, S.C.; et al. Effects of the Enclosure on Plant Communities in Temperate Grassland. Acta Agrestia Sin. 2023, 31, 1481–1489. [Google Scholar]
- Di, K.; Hu, Z.M.; Hao, G.C.; Cao, R.C.; Liang, M.Q.; Han, D.R.; Wu, G.N. Spatial and temporal variation characteristics of the drought index in China grasslands in the recent 40 years (1982–2018). Natl. Remote Sens. Bull. 2022, 26, 2629–2641. [Google Scholar] [CrossRef]
- Shen, X.J.; Zhou, D.W.; Li, F.; Zhang, H.Y. Vegetation Change and Its Response to Climate Change in Grassland Region of China. Sci. Geogr. Sin. 2015, 35, 622–629. [Google Scholar]
- Tong, S.Q.; Bao, Y.H.; Te, R.; Ma, Q.Y.; Ha, S.; Lusi, A. Analysis of Drought Characteristics in Xilingol Grassland of Northern China Based on SPEI and Its Impact on Vegetation. Math. Probl. Eng. 2017, 2017, 5209173. [Google Scholar] [CrossRef]
- Li, X.; Li, X.B.; Wang, H.; Yu, F.; Yu, H.J.; Yang, H. Impact of Climate Change on Temperate Grassland in Northern China. J. Beijing Norm. Univ. Nat. Sci. 2006, 42, 618–623. [Google Scholar]
- Piao, S.; Mohammat, A.; Fang, J.; Cai, Q.; Feng, J.M. NDVI-based increase in growth of temperate grasslands and its responses to climate changes in China. Glob. Environ. Chang. 2006, 16, 340–348. [Google Scholar] [CrossRef]
- Ma, M.Y.; Wang, Q.M.; Liu, R.; Zhao, Y.; Zhang, D.Q. Effects of climate change and human activities on vegetation coverage change in northern China considering extreme climate and time-lag and accumulation effects. Sci. Total Environ. 2023, 860, 160527. [Google Scholar] [CrossRef] [PubMed]
- Shen, X.J.; Liu, B.H.; Li, G.D.; Zhou, D.W. Impact of Climate Change on Temperate and Alpine Grasslands in China during 1982–2006. Adv. Meteorol. 2015, 2015, 180614. [Google Scholar] [CrossRef]
- Te, N.W. Response of Vegetation Productivity to Precipitation Change in Temperate Steppe of Inner Mongolia; Inner Mongolia Agricultural University: Hohhot, China, 2022. [Google Scholar]
- Yuan, Y.M.; Liu, J.Y.; Gao, X.L.; Xue, J.; Wang, R.Z. Root traits of seven Stipa species and their relations with environmental factors in temperate grasslands. Acta Ecol. Sin. 2022, 42, 8784–8794. [Google Scholar]
- Yue, X.Y.; Zuo, X.A.; Chang, X.L.; Xu, C.; Lu, P.; Zhang, J.; Zhao, S.L.; Cheng, Q.P. NDVI of Typical Steppe and Desert Steppe in Inner Mongolia in Response to Meteorological Factors. J. Desert Res. 2019, 39, 25–33. [Google Scholar]
- Ding, Y.; Hou, X.Y.; Leonid, U.; Wu, X.H.; Yi, Y.T.; Li, X.L.; Yun, X.J. An Overview of Climate Change of Temperate Grassland and Its Impacts on Vegetation. Chin. Agric. Sci. Bull. 2012, 28, 310–316. [Google Scholar]
- Guo, X.M.; Tong, S.Q.; Bao, Y.H.; Ren, J.Y. Spatial and Temporal Variation Trend Analysis of Drought in Inner Mongolia in the Past 55 Years Based on SPEI. Geomat. World 2021, 28, 42–79. [Google Scholar]
- Zhao, Z.Z.; Zhang, B.L.; Pan, L.J.; Niu, P.T.; Guo, J.P. Droughts diagnosis and prediction using SPEI in eastern Inner Mongolia. Environ. Ecol. 2023, 5, 39–48. [Google Scholar]
- Ma, R.; Xia, C.L.; Zhang, J.Q.; Shen, X.J. Spatiotemporal variation of vegetation NDVI and its response to climate change in the temperate grassland region of China. Chin. J. Ecol. 2023, 42, 395–405. [Google Scholar]
- Ndayiragije, J.M.; Li, F. Monitoring and Analysis of Drought Characteristics Based on Climate Change in Burundi Using Standardized Precipitation Evapotranspiration Index. Water 2022, 14, 2511. [Google Scholar] [CrossRef]
- Dao, R.N.; Bao, Y.H. Dynamic of the Drought Based on the Ecological Partition in Inner Mongolia During 1980–2015. Res. Soil Water Conserv. 2019, 26, 159–165. [Google Scholar]
- Feng, S.Y.; Chun, P.P.; Yao, X.; Yi, D.J.; Guo, Y. Spatial and Temporal Distribution Characteristics and Cause of Drought in Northwest China Based on SPEI. Pearl River 2021, 42, 38–48. [Google Scholar]
- Lian, H.L.; Han, X.Y.; Liu, Y.L.; Han, Y.Q.; Yang, W.B.; Xiong, W. Study on spatiotemporal characteristics of atmospheric drought from 1981 to 2020 in the Mu Us Sandy Land of China based on SPEI index. J. Desert Res. 2022, 42, 71–80. [Google Scholar]
- Liang, S.Z.; Sui, X.Y.; Wang, M.; Li, X.H.; Dong, H.Y.; Yao, H.M.; Ma, W.D. Multiple Time Scales Analysis of Dryness and Wetness Changes of the Yellow River Basin in the Past 50 Years Based on SPEI Data. Res. Soil Water Conserv. 2022, 29, 231–241. [Google Scholar]
- Liu, Y.W.; Xu, X.H.; Zhang, X.P.; Zhou, X.W.; Lei, S.; Han, H.M. Drought Characteristics and Impact on Crop Affected Area in Jiangxi Province Based on SPEI. Water Resour. Power 2023, 41, 17–21. [Google Scholar]
- Teng, H.Y.; Feng, K.P. Temporal and spatial distribution of drought in northwest China based on SPEI drought index. Agric. Technol. 2021, 41, 87–93. [Google Scholar]
- Wang, X.D.; Zhang, B.; Ma, B.; Huang, H. Spatial and Temporal Evolution of Drought in Northeast China in Recent 58 Years Based on Daily SPEI. Plateau Meteorol. 2021, 16, e0259774. [Google Scholar]
- Xu, D.W. Distribution Change and Analysis of Different Grassland Types in Hulunber Grassland; Chinese Academy of Agricultural Sciences: Beijing, China, 2019. [Google Scholar]
- Ma, R.; Shen, X.J.; Zhang, J.Q.; Xia, C.L.; Liu, Y.W.; Wang, Y.J.; Jiang, M.; Lu, X.G. Variation of vegetation autumn phenology and its climatic drivers in temperate grasslands of China. Int. J. Appl. Earth Obs. Geoinf. 2022, 114, 103064. [Google Scholar] [CrossRef]
- Bai, Y.F.; Zhao, Y.J.; Wang, Y.; Zhou, K.L. Assessment of Ecosystem Services and Ecological Regionalization of Grasslands Support Establishment of Ecological Security Barriers in Northern China. J. Chin. Acad. Sci. 2020, 35, 675–689. [Google Scholar]
- Yevjevich, V. An objective approach to definitions and investigations of continental hydrologic droughts. J. Hydrol. 1969, 7, 353. [Google Scholar]
- Li, N.; Risu, N.; Zhang, J.Q.; Tong, S.Q.; Shan, Y.; Ying, H.; Li, X.Q.; Bao, Y.L. Vegetation Dynamics and Diverse Responses to Extreme Climate Events in Different Vegetation Types of Inner Mongolia. Atmosphere 2018, 9, 394. [Google Scholar]
- Zhang, Q.; Tang, H.P.; Cui, F.Q.; Dai, L.W. SPEI-based analysis of drought characteristics and trends in Hulun Buir grassland. Acta Ecol. Sin. 2019, 39, 7110–7123. [Google Scholar]
- Jiao, Y.J. Temporal and Spatial Variation of Desert Steppe Vegetation and Its Response to Climate Change—Taking Sonid You qi as an Example; Chinese Academy of Forestry: Beijing, China, 2021. [Google Scholar]
- Luo, W.T.; Muraina, T.O.; Griffin-Nolan, R.J.; Ma, W.; Song, L.; Fu, W.; Yu, Q.; Knapp, A.K.; Wang, Z.W.; Han, X.G.; et al. Responses of a semiarid grassland to recurrent drought are linked to community functional composition. Ecology 2023, 104, e3920. [Google Scholar] [CrossRef]
Disclaimer/Publisher’s Note: The statements, opinions and data contained in all publications are solely those of the individual author(s) and contributor(s) and not of MDPI and/or the editor(s). MDPI and/or the editor(s) disclaim responsibility for any injury to people or property resulting from any ideas, methods, instructions or products referred to in the content. |
© 2023 by the authors. Licensee MDPI, Basel, Switzerland. This article is an open access article distributed under the terms and conditions of the Creative Commons Attribution (CC BY) license (https://creativecommons.org/licenses/by/4.0/).