Article

Climate Change Exposure and Firm Performance: Does Managerial Ability Matter?

by
Khadija S. Almaghrabi
Business Department, The Applied College, King Abdulaziz University, Jeddah 21589, Saudi Arabia
Sustainability 2023, 15(17), 12878; https://doi.org/10.3390/su151712878
Submission received: 22 June 2023 / Revised: 11 August 2023 / Accepted: 23 August 2023 / Published: 25 August 2023

Abstract

:
Using a firm-level measure of climate change exposure, this study examines the role of managerial ability in the association between climate change exposure and corporate performance. Based on a sample of 43,620 firm-year observations over the period between 2001 and 2021, the study documents that although increased climate change exposure reduces corporate performance, managerial ability moderates this relationship. Specifically, this study shows that higher managerial ability mitigates the negative effect of climate change risk on financial performance and cash flow volatility reported by prior studies. These results hold across different specifications and when addressing the potential endogeneity issue concerning managerial ability. The findings of this study are essential to build a complete picture of the effect of climate change exposure on corporate performance. A key implication of the findings is that firms exposed to climate change risk are encouraged to enhance their managerial ability to overcome the negative impact of climate change exposure on corporate performance.

1. Introduction

It is well established that climate change adversely affects performance and economic activities at the country level [1,2,3] as well as at the firm level( e.g., [4,5,6]). A recent report by the World Economic Forum highlights that extreme environmental events constitute a significant global threat to corporations. For example, climate change could affect supply chains by disrupting the distribution and delivery of goods and services [7]. Moreover, it can affect political stability and adversely affect firms’ operations [8,9]. Furthermore, climate change, particularly extreme weather, can physically damage firms’ fixed assets, diminishing earnings that might be generated from them [10]. Such possibilities exist because firms cannot obtain full climate-risk insurance coverage [10]. Given these possibilities, prior studies have made significant progress in examining the effects of climate change exposure on corporate activities and market consequences (e.g., [4,5,6]). This includes firm valuation and performance (e.g., [10,11]). For example, Huang et al. [10] show that firms in countries with higher climate risk have lower performance and higher cash flow volatility. The negative effect of climate change risk on corporate performance is also supported by Ozkan et al. [7].
Despite the focus of prior studies on the effect of climate change risk on corporate performance, there is no evidence on the role of managerial ability, which represents the ability of managers to generate revenue under resource constraints from this effect. In other words, prior studies have assumed that managerial ability is homogeneous across firms and years. Hence, we fill the gap in the literature by examining whether the ultimate effect of climate change exposure on corporate performance is contingent on managerial ability, that is, whether the impact of climate change exposure on a firm’s performance is dependent on the level of managerial ability. This examination is essential to build a complete understanding of the effects of climate change exposure on corporate performance. To the best of our knowledge, this is the first study that considers the role of managerial ability in such a setting.
Based on the upper echelon theory [12,13], which posits that managers play an important role in achieving certain firm-level outcomes, we argue that managerial ability can reduce the negative effect of climate change risk on corporate performance. Specifically, managerial ability can help mitigate the negative effect of climate change risk on corporate performance as better able managers tend to have, inter alia, deep knowledge of the firm, the market, technology, and human capital [14,15,16]. Moreover, they are more capable of handling difficult situations and mitigating the risk of firm failure, transferring corporate resources into higher revenues [17], and synthesizing information in their investment decisions [15]. More importantly, as managers make important decisions that are linked to firms’ sustainability [18], when they are highly able, they are more likely to better deal with climate change exposure and mitigate its effects.
Using a firm-level measure of climate exposure, we document evidence consistent with the upper echelon theory that managers play an important role within firms, as their abilities reduce the negative effects of climate change exposure on financial performance and cash flow volatility. Specifically, we find that firms exposed to climate change risk with more able managers have higher economic performance as measured by return on assets, net income over assets, and cash flows from operations over assets. Moreover, they have lower cash flow volatility than firms exposed to climate change risk with less able managers. These results hold across different specifications and when addressing the potential endogeneity issue. These findings highlight that firms exposed to climate change risk are encouraged to improve their managers’ ability to overcome the negative impact of climate change exposure. More importantly, when appointing new managers, firms exposed to climate change should consider the ability of potential candidates as an important factor in appointing them.
This study makes two significant contributions to the literature. First, it complements prior studies on the effect of climate change exposure on corporate performance (e.g., [7,10]) by documenting that climate change risk impacts are heterogeneous across firms. Specifically, climate change exposure has limited negative effects on the performance of firms with better able managers. Second, the findings of this study add to the literature on the role of managerial ability in shaping corporate activities (e.g., [19,20,21]) by highlighting that managerial ability plays an important role when firms are exposed to climate change risk as it enables managers to handle such risk.
The remainder of this paper is structured as follows: Section 2 reviews the literature and presents the hypotheses. Section 3 describes the research design of the study. Section 4 presents the main results, and Section 5 addresses the potential endogeneity issue and presents sensitivity tests. Finally, Section 6 concludes the study.

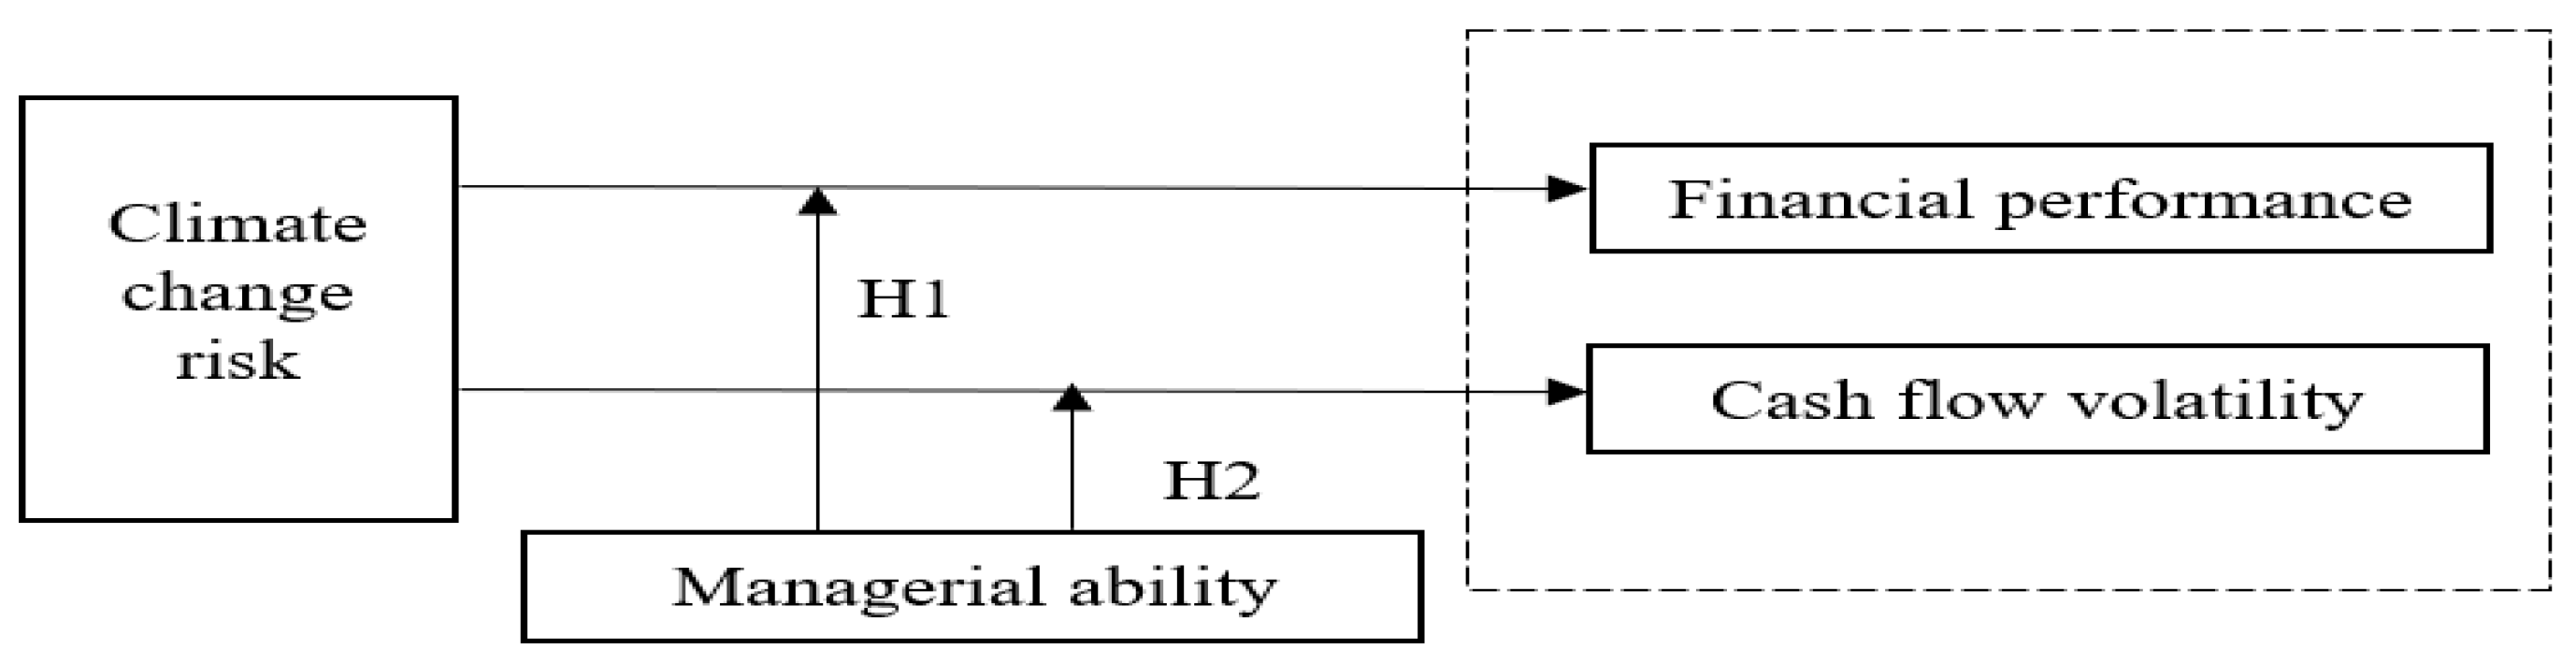
2. Literature Review and Hypotheses Development

Climate change has a detrimental effect on corporate performance and firm operations because of the disruption it causes to business operations. This includes the damage to corporate resources or the disruption to the distribution and delivery of goods and services resulting from extreme weather events. Consistent with the detrimental effect of climate change exposure, Cao and Wei [22] find that higher temperatures are associated with lower stock returns. Similarly, Novy-Marx [23] reports the effect of New York City temperature on stock returns. Ahmad et al. [24] demonstrate a negative association between firm-level exposure to climate change and working capital. More closely related to the current study, Huang et al. [10] document that firms with higher climate exposure have poorer financial performance and more volatile operating cash flows. The negative effect of climate change risk on corporate financial performance is also supported by Ozkan et al. [7], using an international sample. Overall, prior studies document that climate change exposure is negatively associated with financial performance and positively associated with cash flow volatility. However, prior studies do not consider the idiosyncrasies of top management or the role of variation in management ability in handling firms’ climate change exposure.
We complement the above studies by exploring whether the ultimate effect of climate change exposure on firm performance is contingent on managerial ability; that is, whether the impact of climate change exposure on a firm’s performance is dependent on the level of managerial ability. From a theoretical perspective, the upper echelon theory emphasizes the role of managers in achieving certain firm-level outcomes [12,13]. Specifically, the theory predicts that, due to the complexity of decision-making, the idiosyncrasies of top management represent a crucial part in achieving corporate objectives. Accordingly, prior studies have examined the importance of managers for firm outcomes, suggesting that managerial competencies, such as ability, directly influence corporate outcomes. For example, Bertrand and Schoar [25] document that top managers directly influence changes in organizations’ behavior over time. Beatty and Liao [26] document that banks managed by better able managers tend to accurately forecast loan losses and, as a result, recognize the loss in a timely manner. Andreou et al. [21] document that banks with better able managers have more capacity to manage higher risks and facilitate increased liquidity. Andreou et al. [16] find that managerial ability is valuable during difficult times, particularly during the financial crisis, as firms with enhanced pre-crisis managerial ability invest at higher levels during the crisis. Hmaittane et al. [14] find that corporate social responsibility (CSR) significantly reduces firms’ cost of equity only when firms are managed by more able managers. Krishnan and Wang [17] document that managerial ability reduces audit fees and the likelihood of receiving a going concern opinion. Demerjian et al. [15] find that firms with more able managers have fewer subsequent restatements, higher earnings and accrual persistence, lower errors in bad debt provision, and more accurate accrual estimations. Chen et al. [27] highlight that more able managers produce more successful innovations.
When considering the effect of managerial ability on corporate performance, Leverty and Grace [28] find that managerial ability directly influences firm performance, as it reduces the amount of time a firm spends in distress, the likelihood of a firm’s failure, and the cost of failure. Chang et al. [19] find that differences in management actions and styles, including CEOs’ abilities, explain variations in financial performance across firms. Carmeli and Tishler [20] find that managerial ability is positively associated with subsequent financial performance. Demerjian et al. [29] find that firms with more able managers generate higher stock returns and financial performance. Chen and Lin [30] document that acquiring firms with better able managers have greater long-term buy-and-hold returns and lower acquisition premiums. Other studies also support this evidence by documenting a positive relationship between managerial quality and IPO/SEO performance (e.g., [31,32]). Overall, prior studies highlight the significance of managerial ability in corporate outcomes, particularly corporate performance.
Accordingly, based on the upper echelon theory and the above evidence that emphasizes the benefits of managerial ability, we conjecture that managerial ability helps moderate the negative impact of climate risk on financial performance and cash flow volatility. In our context, managerial ability can help mitigate the negative effect of climate change risk on corporate performance as better able managers tend to have, inter alia, a higher inherent knowledge of the firm and its clients, an in-depth understanding of the market, technology, industry, and macro-economic conditions; and more effective human capital management [14,15,16]. Moreover, they are likely to have a better ability to handle difficult situations, transfer corporate resources into higher revenues relative to other firms [15,17], and synthesize information in their investment decisions [15]. Furthermore, based on an overall understanding of the market and business environment, better able managers could predict the future, thereby improving corporate performance [33]. These characteristics lead more able managers to mitigate the risk of poor performance and firm failure [17,33]. More importantly, as managers make important decisions linked to firms’ sustainability [18] when they are highly able, they are more likely to better deal with climate change exposure and mitigate its effect. Hence, compared with firms managed by less able managers, firms with more able managers could better handle the impact of climate change exposure on corporate performance by effectively utilizing and distributing the internal resources or capabilities of a firm to manage the risk of climate change.
Thus, we develop the hypotheses (presented in Figure 1) as follows:
Hypothesis  1.
Managerial ability moderates the association between climate change risk and financial performance, that is, the higher the managerial ability, the lower the negative effect of climate change risk on firms’ financial performance.
Hypothesis  2.
Managerial ability moderates the association between climate change risk and cash flow volatility, that is, the higher the managerial ability, the lower the increase in cash flow volatility caused by climate change risk.

3. Research Design

3.1. Data and Sample

The sample starts with all U.S. firms in the Compustat database over the period between 2001 and 2021. The study focuses on this period, as it is when information on climate change exposure is available. Similar to prior studies, financial firms are excluded (Standard Industrial Classification (SIC) codes 6000–6999), as their data are less comparable to other firms. The data are then merged with the measure of climate change exposure developed by Sautner et al. [34], as discussed below. The data are then merged with the measure of managerial ability developed by Demerjian et al. [29], as discussed below.
This sample selection resulted in 43,620 firm-year observations with non-missing data on measures of financial performance, as well as measures of climate change exposure and managerial ability. To examine the effect of climate change exposure on future cash flow volatility, the estimation requires data on cash flow over subsequent years. As such, the data are reduced to 40,252 firm-year observations, with data available on cash flows over subsequent years.

3.2. Model Specification

To test our hypotheses, we estimate the following regressions:
F i n a n c i a l   P e r f o r m a n c e i , t + 1 = β o + β 1   C l i m a t e   R i s k i , t + β 2   M a n g .   A b i l i t y i , t + β 3   C l i m a t e   R i s k i , t M a n g .   A b i l i t y i , t + B 4   δ i , t + B Y e a r + B I n d .   + ε i , t ,
t + 1 t + n C F   V o l a t i l i t y i , t + 1 = β o + β 1   C l i m a t e   R i s k i , t + β 2   M a n g .   A b i l i t y i , t + β 3   C l i m a t e   R i s k i , t M a n g .   A b i l i t y i , t + B 4   δ i , t + B Y e a r + B I n d .   + ε i , t ,
where Financial Performance in Equation (1) represents one of the three measures of financial performance, ROA, which is earnings before interest, taxes, and depreciation divided by total assets; NI, which is net income divided by total assets; and CF, which is cash flow from operations divided by total assets [35,36]. CF Volatility in Equation (2) represents the volatility of cash flows over the next three (CF Volatility3) or five years (CF Volatility5).
Climate Risk is the measure of climate change exposure developed by Sautner et al. [34], which is widely used in the literature to quantify firm-level climate change risk (e.g., [24,37]). Sautner et al. [34] consider that some firms face costs from physical climate change or are negatively affected by regulations implemented to combat global warming. In contrast, other firms obtain opportunities from climate change (e.g., those operating in renewable energy, electric cars, or energy storage). Additionally, given the differences in how firms embrace renewable energy and the net-zero transition in their business models, even firms within the same industry are exposed to varying degrees of climate change risk over time. Hence, they developed a disaggregated measure that captures the variation in both exposure to climate change and the effect of climate change risk across firms, using transcripts of earnings conference calls. More specifically, they developed a measure of climate change exposure, based on the share of the conversation in a conference call transcript devoted to climate change to capture market participants’ attention to and assessment of the effect of climate change on individual firms. This measure has several advantages, including capturing firm-level exposure to climate change risk. In other words, it captures within-industry variations in the exposure to climate change. Moreover, it constitutes a time-varying measure of climate change exposure. Furthermore, it reflects “soft” information that arises from conversations between managers and analysts [34]. Sautner et al. [34] validated their measure using several tests, including face validation of climate change bigrams, a structured human audit, and exclusion of one keyword at a time from the initial keywords list. These and other validation tests conducted by Sautner et al. [34] proved that the developed measure reliably captures variations in climate change exposure within and across firms.
Mang. Ability is the efficiency of managers relative to industry peers in transforming corporate resources into revenues and maximizing profitability (i.e., maximizing the efficiency of the resources used by managers relative to market peers). This measure was developed by Demerjian et al. [29] and is widely used in the literature to quantify managerial ability (e.g., [14,16,17]). Demerjian et al. [29] first employed a data envelopment analysis (DEA) to model firm efficiency by solving an optimization model where the output is sales and the inputs are firm resources (e.g., net property, plant, and equipment; net operating leases; net R&D; and purchased goodwill). The DEA assigns a score of one to firms with the highest level of revenue from the given set of inputs, and the score decreases as firms move away from the highest level. As the efficiency scores obtained from this estimation are attributable to both the firm and its managers, Demerjian et al. [29] then separated the managerial component from the firm component to obtain the managerial ability score. To ensure that the measure of managerial ability reflects manager-specific efficiency drivers, Demerjian et al. [29] performed a Tobit estimation by regressing firm efficiency scores on several firm characteristics, including size, age, market share, free cash flow, complex multi-segment, and international operations, as well as the effects of industry and time fixed effects. Following this, they obtained residuals from the estimated regression to capture the managerial efficiency component (i.e., the measure of managerial ability). Demerjian et al. [29] validated their measure using several tests, including testing whether it is associated with manager fixed effects, announcement returns to CEO turnover, and subsequent performance at CEOs’ new appointments. These and other validation tests conducted by Demerjian et al. [29] proved that the developed measure reliably captures within-firm and across-firm variations in managerial abilities. Moreover, Demerjian et al. [29] find that this measure outperforms several alternative measures of managerial ability.
δi,t represents a set of control variables that determine corporate performance, based on evidence from prior studies (e.g., [7,10]). These variables are the natural logarithm of total assets (Size), a firm’s market-to-book ratio (MB), propriety, plants, and equipment by total assets (Tangibility), and sales growth from year t − 1 to year t (Sales growth). Table 1 presents the definition and sources of these variables.
To control for shifts in financial performance and volatility over time caused by changes in general economic conditions as well as differences across industries, we include time fixed effects, βYear, and industry fixed effects, βInd. We winsorize all continuous variables at the 1st and 99th percentiles to reduce the effect of outliers, and we use heteroskedasticity robust standard errors, adjusted to account for correlations within firms’ clusters.
The main variable of interest in Equations (1) and (2) is the coefficient B3 on the interaction between climate change exposure and managerial ability (Climate Risk ∗ Mang. Ability). If Hypothesis 1 holds true, we expect the interaction to be positive, implying that managerial ability reduces the negative association between climate change exposure and future performance documented in prior studies. If Hypothesis 2 holds true, we expect the interaction to be negative, implying that managerial ability reduces the documented increase in cash flow volatility induced by climate change exposure (i.e., the positive association between climate change exposure and cash flow volatility).

4. Results and Discussion

Table 2 presents the descriptive statistics. Based on sample firms, the mean (median) return on assets is 11.2% (10.7%), and the mean (median) net income to total assets is 0.1% (3.2%). The mean (median) cash flow to total assets for the sample firms is 7.2% (10.7%). Moreover, the mean (median) climate change exposure is 0.2% (0.2%), and the mean (median) managerial ability is −0.2% (−3.5%). These descriptive statistics are comparable to those of prior studies.
Table 3 presents the pairwise correlations. Climate change exposure has a negative and significant correlation with the measures of financial performance and a positive and significant correlation with the measures of cash flow volatility. Specifically, columns 1, 2, and 3 show that the correlation coefficients between Climate Risk and ROA, NI, and CF are −8%, −5%, and −8%, respectively (p < 0.01). Moreover, columns 4 and 5 show that the correlation coefficients between Climate Risk and CF Volatility3 and CF Volatility5 are 2% and 2%, respectively (p < 0.01). This is consistent with the negative effect of climate change exposure on financial performance and cash flow volatility documented by prior studies. Furthermore, the correlation matrix shows that managerial ability has a positive and significant correlation with the measures of financial performance and a negative and significant correlation with the measures of cash flow volatility. This is consistent with the positive effect of managerial ability on financial performance and cash flow volatility documented in prior studies.
The correlation coefficients between the independent variables are below the critical value of 0.80, which could lead to serious multicollinearity issues ([38], p. 359). Moreover, variance inflation factor (VIF) values for the independent variables, which are reported in the last column, are below the critical value of 10 ([39], p. 86), which suggests that multicollinearity is not an issue.
Table 4 presents the results of testing Hypothesis 1 on the role of managerial ability in the association between climate change exposure and corporate financial performance. Columns 1, 2 and 3 present a basic specification that regresses the financial performance measures (ROA, NI, and CF) on the interaction between climate change exposure and managerial ability without control variables. The simple models show that climate change exposure is negatively associated with firms’ financial performance. This is consistent with prior studies that show that climate change exposure adversely affects financial performance. For example, Huang et al. [10] and Ozkan et al. [7] provide strong evidence that climate change exposure decreases financial performance. Nevertheless, our results show that the interaction between climate change risk and managerial ability is positive and statistically significant at the 1% level (e.g., the corresponding coefficient of the interaction term, Climate Risk ∗ Mang. Ability, in column 1 is 5.85; p < 0.01). This provides initial evidence that is consistent with the moderating effect of managerial ability on the association between climate change exposure and financial performance.
Columns 4, 5 and 6 present the results of the baseline specification that regresses the financial performance measures (ROA, NI, and CF) on the interaction between climate change exposure and managerial ability with the control variables. Again, consistent with prior studies [7,10], the results show that climate change exposure is negatively associated with firms’ financial performance when controlling for firms’ specific variables (e.g., the corresponding coefficient of Climate Risk in column 4 is −1.27; p < 0.01). More importantly, we find that the interaction between climate change risk and managerial ability is positive and statistically significant at the 5% level (e.g., the corresponding coefficient of the interaction term, Climate Risk ∗ Mang. Ability, in column 4 is 5.10; p < 0.05). This finding implies that managerial ability moderates the negative effect of climate change exposure on financial performance. Specifically, given that the main effect (the effect of climate change exposure on financial performance) is negative and the interaction effect (the interaction between high climate change exposure and high managerial ability) is positive, this suggests that managerial ability mitigates the negative effect of climate change exposure on financial performance. In other words, as managerial ability increases, the negative association between climate change exposure and financial performance decreases.
In order to provide additional insight into whether high managerial ability can fully eliminate the negative effect of climate change exposure, we directly test the joint effect of managerial ability and climate change exposure on financial performance. Specifically, we test whether the sum of the coefficient of climate change exposure and that of the interaction term is equal to zero (H0: Climate Risk + Climate Risk ∗ Mang. Ability = 0). If the null hypothesis is true (i.e., restrictions are satisfied), then climate change exposure has no effect on financial performance for firms with high managerial abilities (i.e., managerial ability, in this case, mitigates the effect of climate change risk on financial performance). The F-tests reported at the bottom of Table 4 indicate that the sum of the coefficients is zero (we fail to reject the null hypothesis). This finding confirms that higher levels of managerial ability mitigate the negative effect of climate change exposure on financial performance.
The adjusted R2 values reported at the bottom of the table indicate that our models (with control variables) explain between 22% and 23% of the variation in financial performance. These values are higher than those in prior studies that examined the effect of climate change exposure on financial performance (e.g., [10]). This implies that accounting for managerial ability enhances the predictability of model estimation (i.e., the model better explains the variation in financial performance when accounting for managerial ability).
Overall, the results presented in Table 4 support Hypothesis 1, that managerial ability mitigates the reduction in financial performance caused by climate change exposure. Moreover, they support the positive effect of managerial ability documented by prior studies (e.g., [15,20,21,27,29]). Our results shed light on the role of managerial ability in improving financial performance when firms are exposed to climate change risk. Moreover, the results are consistent with the upper echelon theory, which predicts that, due to the complexity of decision making, the distinctive characteristics of top management represent a crucial part in achieving corporate objectives [12,13]. Our results highlight that the role played by top managers is even more important when firms are exposed to climate change risk.
Table 5 presents the results of testing Hypothesis 2 on the role of managerial ability in the association between climate change exposure and cash flow volatility. Columns 1 and 2 show a basic specification that regresses the measures of cash flow volatility (CF Volatility3 and CF Volatility5) on the interaction between climate change risk and managerial ability without control variables. The simple models show that climate change exposure increases cash flow volatility over short- and long-term periods (three and five years). This is consistent with the evidence from prior studies that climate change exposure adversely affects the stability of cash flows. For example, Huang et al. [10] provide evidence that climate change exposure increases cash flow volatility. However, our results show that the interaction between climate change risk and managerial ability is negative and statistically significant at the 1% level (e.g., the corresponding coefficient of the interaction term, Climate Risk ∗ Mang. Ability, in column 1 is −8.74; p < 0.01). This provides initial evidence that is consistent with the moderating effect of managerial ability on the association between climate change exposure and cash flow volatility.
Columns 3 and 4 present the results of the baseline specification that regresses the cash flow volatility measures (CF Volatility3 and CF Volatility5) on the interaction between climate change risk and managerial ability with the control variables. Again, consistent with prior studies [7,10], the results show that climate change exposure increases cash flow volatility over the short- and long-term when controlling for firms’ specific variables (e.g., the corresponding coefficient of Climate Risk in column 3 is 0.55; p < 0.01). More importantly, the interaction between climate change risk and managerial ability is positive and statistically significant at the 1% level (e.g., the corresponding coefficient of the interaction term, Climate Risk ∗ Mang. Ability, in column 3, is −9.12; p < 0.10). Given that the main effect (the effect of climate change risk on cash flow volatility) is positive and the interaction effect (the interaction between high climate change exposure and high managerial ability) is negative, the results suggest that managerial ability mitigates the negative effect of climate change exposure on cash flow volatility (i.e., the increase in cash flow volatility caused by climate change exposure). In other words, as managerial ability increases, the positive association between climate change exposure and cash flow volatility decreases.
In order to provide additional insight into whether high managerial ability can fully eliminate the increase in cash flow volatility caused by climate change exposure, we directly test the joint effect of managerial ability and climate change exposure on cash flow volatility. Specifically, we test whether the sum of the coefficient of climate change risk and that of the interaction term is equal to zero (H0: Climate Risk + Climate Risk ∗ Mang. Ability = 0). If the null hypothesis is true (i.e., restrictions are satisfied), then climate change exposure has no effect on cash flow volatility for firms with high managerial abilities. The F-tests reported at the bottom of Table 5 indicate that the sum of the coefficients is zero (i.e., we fail to reject the null hypothesis). This finding confirms that managerial ability mitigates the negative effect of climate change exposure on cash flow volatility (i.e., the increase in cash flow volatility).
The adjusted R2 values reported at the bottom of the table indicate that our models (with control variables) explain between 27% and 29% of the variation in cash flow volatility. Again, these values are higher than those in prior studies that examined the effect of climate change exposure on cash flow volatility (e.g., [10]). This implies that accounting for managerial ability enhances the predictability of model estimation (i.e., the model better explains the variation in cash flow volatility when accounting for managerial ability).
Overall, the results presented in Table 5 support Hypothesis 2, that managerial ability mitigates the increase in cash flow volatility caused by climate change exposure. Again, these results support the positive effect of managerial ability documented in prior studies (e.g., [15,20,21,27,29]). These results shed additional light on the role of managerial ability in cases of exposure to climate change risk. Moreover, these results are also consistent with the upper echelon theory [12,13].

5. Addressing the Endogeneity Issue and Robustness Checks

5.1. Addressing the Endogeneity Issue

If the characteristics of firms managed by better able managers are essentially different from those of firms managed by less able managers, there might be an endogeneity issue present in our study. Specifically, the effect of managerial ability on the association between climate change risk and corporate performance might be a statistical artifact stemming from model misspecifications. To ensure that our results are not driven by a potential endogeneity issue, we follow Andreou et al. [16] and implement a propensity-score matching (PSM) technique to identify treatment and control groups that are similar in various dimensions of firm-specific characteristics but differ in managerial ability. This matching process minimizes observable differences and increases confidence that our results stem from managerial ability rather than sample heterogeneity. Similar to Andreou et al. [16], we define more able managers (High Able Managers) using a binary variable based on the median value of ability measures, and then we match each firm from the treatment group (firms with more able managers) with the nearest neighboring firm within a caliper distance of 0.05 from the control group (firms with less able managers) [40,41,42,43,44,45]. We rely on matching without replacement as “matching with replacement may lower the representativeness of the control group, and thereby reduce the generalizability of the inferences” ([46], p. 3630). This approach is used in prior studies to avoid overmatching on dimensions unrelated to the outcome variable that would generate matched samples that are not representative of the respective population of treatment and control firms. Consequently, no firm in the treatment group is assigned to more than one firm from the control group. This matching is performed based on firm-level variables by estimating a logit model that regresses the dummy variable for high managerial ability (High Able Managers, defined above) on the firm-level variables (i.e., Size, MB, Tangibility, Sales growth, and year and industry fixed effects). We then derive the propensity scores (i.e., the likelihood of having a better able manager). The tests of differences (unreported for brevity) indicate no significant differences between the treatment and control groups in the matching variables, which confirms correct matching [47]. We then run a second-stage regression on the matched sample.
We present the PSM results in Panel A of Table 6 and Table 7. Table 6 shows the results for the role of managerial ability in the association between climate change exposure and financial performance, whereas Table 7 shows the results for the role of managerial ability in the association between climate change exposure and future cash flow volatility. For the sake of brevity, the tables show the results for the main variables of interest (the full results are available from the author upon request).
The results in Panel A of Table 6 and Table 7 indicate that our inferences remain valid when accounting for the potential heterogeneity between firms with more and less able managers using PSM design. Specifically, the interaction term Climate Risk ∗ Mang. Ability is positive in the financial performance regression (Table 6) and negative in the future cash flow volatility regression (Table 7). Hence, consistent with the main findings, managerial ability reduces the negative effect of climate change exposure on financial performance and future cash flow volatility.

5.2. Robustness Checks

We perform several sensitivity tests to verify the robustness of our findings. First, as our regressions are conducted at the firm-year level, we test the sensitivity of the results against a more conservative assumption of the correlation structure of the residuals by clustering the residuals at the industry-year level. This clustering accounts for the potential autocorrelation within firms and cross-sectional correlations within each industry. Second, we test the sensitivity of the results by controlling for time-series overall changes in public attention to climate change risk using the index developed by Engle et al. [48], which is constructed using the intensity of climate news in the Wall Street Journal (the index is available only until 2018; hence, the analyses here are restricted to 2018). Third, we test the sensitivity of the results by controlling for additional firm-level variables, including intangibility (the proportion of tangible assets to total assets) and R&D (the ratio of R&D expenditure to total assets). Lastly, we consider that our sample period covers the financial crisis and COVID−19 periods, which might have affected our inferences. Hence, we test the sensitivity of our results by excluding these periods (i.e., firm-year observations in the years 2008, 2009, 2020, and 2021). The results of these tests are presented in Panels B, C, D, and E of Table 6 and Table 7.
The results in the two tables indicate that our inferences are similar under these robustness checks. Climate change exposure is particularly negatively associated with financial performance (across the panels in Table 6) and positively associated with future cash flow volatility (across the panels in Table 7). However, the interaction term Climate Risk ∗ Mang. Ability is positive and statistically significant in the financial performance regression (across the panels in Table 6) and negative and statistically significant in the future cash flow volatility regression (across the panels in Table 7). These findings imply that managerial ability reduces the negative effect of climate change exposure on financial performance and future cash flow volatility, which is consistent with the main results.

6. Conclusions

This study examines the effect of managerial ability on the association between climate change exposure and financial performance and cash flow volatility. We document that while climate change exposure negatively affects financial performance and cash flow volatility, managerial ability reduces these negative effects. These findings are essential to build a complete picture of the effect of climate change exposure on corporate performance. In addition, they are consistent with the upper echelon theory [12,13] as they highlight that managerial ability can significantly influence the link between firm’s climate change exposure and its performance.
This study complements prior studies on the effect of climate change exposure on corporate performance by documenting that the effect of climate change risk on corporate performance is heterogeneous across firms and that managerial ability is essential for reducing the documented negative effect of climate change exposure on corporate performance. The findings of this study also add to the literature on the role of managerial ability in corporate activities by highlighting that in addition to other benefits of managerial ability, it plays a crucial role when firms are exposed to climate change risk.
The results of the study have several important implications. Specifically, the findings of the study support the role of upper management, which is emphasized by the upper echelon theory. Our findings suggest that top managers’ abilities play an important role, particularly during crucial times. The findings highlight that firms exposed to climate change risk are encouraged to improve their managers’ ability to overcome the negative impact of climate change exposure on corporate performance. Moreover, when appointing new managers, firms exposed to climate change should consider the ability of potential candidates as an important factor in appointing them. In addition, our findings provide evidence that managerial ability is a moderating factor that influences firms’ ability to handle the effect of climate change exposure, which implies that future research should consider managerial ability when studying the effects of climate change risk.
Naturally, the study is subject to several caveats. First, similar to prior studies on managerial ability (e.g., [14,16,17]), this study focuses on firms for which measures of managerial ability and climate change exposure are available. Hence, the sample could represent larger firms in which managerial ability is expected to be high. This notwithstanding, similar to prior studies, there is high variation in the levels of managerial ability within the sample, which implies that the sample is representative of firms with different levels of managerial ability. Second, similar to recent studies, the sample covers the financial crisis and COVID-19 periods, which might confound our results. Nonetheless, the robustness checks show that our results are robust when we exclude the financial crisis and COVID-19 periods from the sample.
This study opens up several avenues for future research. For example, this study examines the effect of managerial ability on the association between climate change risk and corporate performance. Future research could examine the effect of managerial ability on the association between climate change risk and other firm- or industry-level outcomes. Moreover, while this study focuses on a developed market, future research could consider the characteristics of emerging markets and the prevalence of family-owned firms within such markets. In particular, future research could examine whether managerial attributes within emerging markets affect the association between climate change risk and firm performance.

Funding

This research received no external funding.

Institutional Review Board Statement

Not applicable.

Informed Consent Statement

Not applicable.

Data Availability Statement

Not applicable.

Conflicts of Interest

The author declares no conflict of interest.

References

  1. Dell, M.; Jones, B.F.; Olken, B.A. What do we learn from the weather? The new climate-economy literature. J. Econ. Lit. 2014, 52, 740–798. [Google Scholar] [CrossRef]
  2. Dell, M.; Jones, B.F.; Olken, B.A. Temperature and income: Reconciling new cross-sectional and panel estimates. Am. Econ. Rev. 2009, 99, 198–204. [Google Scholar] [CrossRef]
  3. Gallup, J.L.; Sachs, J.D.; Mellinger, A.D. Geography and economic development. Int. Reg. Sci. Rev. 1999, 22, 179–232. [Google Scholar] [CrossRef]
  4. Berkhout, F.; Hertin, J.; Gann, D.M. Learning to adapt: Organisational adaptation to climate change impacts. Clim. Chang. 2006, 78, 135–156. [Google Scholar] [CrossRef]
  5. Gasbarro, F.; Pinkse, J. Corporate adaptation behaviour to deal with climate change: The influence of firm-specific interpretations of physical climate impacts. Corp. Soc. Responsib. Environ. Manag. 2016, 23, 179–192. [Google Scholar] [CrossRef]
  6. Linnenluecke, M.K.; Griffiths, A.; Winn, M.I. Firm and industry adaptation to climate change: A review of climate adaptation studies in the business and management field. Wiley Interdiscip. Rev. Clim. Chang. 2013, 4, 397–416. [Google Scholar] [CrossRef]
  7. Ozkan, A.; Temiz, H.; Yildiz, Y. Climate risk, corporate social responsibility, and firm performance. Br. J. Manag. 2022. [Google Scholar] [CrossRef]
  8. Henderson, P.R.M.; Reinert, S.A. Climate Change in 2018: Implications for Business; Harvard Business School Background Note; Havard University: Cambridge, MA, USA, 2015. [Google Scholar]
  9. Jia, J.; Li, Z. Does external uncertainty matter in corporate sustainability performance? J. Corp. Financ. 2020, 65, 101743. [Google Scholar] [CrossRef]
  10. Huang, H.H.; Kerstein, J.; Wang, C. The impact of climate risk on firm performance and financing choices: An international comparison. J. Int. Bus. Stud. 2018, 49, 633–656. [Google Scholar] [CrossRef]
  11. Klasa, S.; Ortiz-Molina, H.; Serfling, M.; Srinivasan, S. Protection of trade secrets and capital structure decisions. J. Financ. Econ. 2018, 128, 266–286. [Google Scholar] [CrossRef]
  12. Hambrick, D.C.; Mason, P.A. Upper Echelon: The organization as a reflection of its top managers. Acad. Manag. Rev. 1984, 9, 193–206. [Google Scholar] [CrossRef]
  13. Hambrick, D.C. Upper echelons theory: An update. Acad. Manag. Rev. 2007, 32, 334–343. [Google Scholar] [CrossRef]
  14. Hmaittane, A.; Bouslah, K.; M’Zali, B.; Ibariouen, I. Corporate sustainability and cost of equity capital: Do managerial abilities matter? Sustainability 2022, 14, 1363. [Google Scholar] [CrossRef]
  15. Demerjian, P.; Lev, B.; Lewis, M.F.; McVay, S.E. Managerial ability and earnings quality. Account. Rev. 2013, 88, 463–498. [Google Scholar] [CrossRef]
  16. Andreou, P.C.; Karasamani, I.; Louca, C.; Ehrlich, D. The impact of managerial ability on crisis-period corporate investment. J. Bus. Res. 2017, 79, 107–122. [Google Scholar] [CrossRef]
  17. Krishnan, G.V.; Wang, C. The relation between managerial ability and audit fees and going concern opinions. Audit. J. Pract. Theory 2015, 34, 139–160. [Google Scholar] [CrossRef]
  18. Lee, K.Y.; Yoon, S.M. Managerial ability and tax planning: Trade-off between tax and nontax costs. Sustainability 2020, 12, 370. [Google Scholar] [CrossRef]
  19. Chang, Y.Y.; Dasgupta, S.; Hilary, G. CEO ability, pay, and firm performance. Manag. Sci. 2016, 56, 1633–1652. [Google Scholar] [CrossRef]
  20. Carmeli, A.; Tishler, A. The relationships between intangible organizational elements and organizational performance. Strateg. Manag. J. 2004, 25, 1257–1278. [Google Scholar] [CrossRef]
  21. Andreou, P.C.; Philip, D.; Robejsek, P. Bank liquidity creation and risk-taking: Does managerial ability matter? J. Bus. Financ. Account. 2016, 43, 226–259. [Google Scholar] [CrossRef]
  22. Cao, M.; Wei, J. Stock market returns: A note on temperature anomaly. J. Bank. Financ. 2005, 29, 1559–1573. [Google Scholar] [CrossRef]
  23. Novy-Marx, R. Predicting anomaly performance with politics, the weather, global warming, sunspots, and the stars. J. Financ. Econ. 2014, 112, 137–146. [Google Scholar] [CrossRef]
  24. Ahmad, M.F.; Aktas, N.; Croci, E. Climate risk and deployment of corporate resources to working capital. Econ. Lett. 2023, 224, 111002. [Google Scholar] [CrossRef]
  25. Bertrand, M.; Schoar, A. Managing with style: The effect of managers on firm policies. Q. J. Econ. 2003, 118, 1169–1208. [Google Scholar] [CrossRef]
  26. Beatty, A.; Liao, S. Do delays in expected loss recognition affect banks’ willingness to lend? J. Account. Econ. 2011, 52, 1–20. [Google Scholar] [CrossRef]
  27. Chen, Y.; Podolski, E.J.; Veeraraghavan, M. Does managerial ability facilitate corporate innovative success? J. Empir. Financ. 2015, 34, 313–326. [Google Scholar] [CrossRef]
  28. Leverty, J.T.; Grace, M.F. Dupes or incompetents? An examination of management’s impact on firm distress. J. Risk Insur. 2012, 79, 751–783. [Google Scholar] [CrossRef]
  29. Demerjian, P.; Lev, B.; McVay, S. Quantifying managerial ability: A new measure and validity tests. Manag. Sci. 2012, 58, 1229–1248. [Google Scholar] [CrossRef]
  30. Chen, S.S.; Lin, C.Y. Managerial ability and acquirer returns. Q. Rev. Econ. Financ. 2018, 68, 171–182. [Google Scholar] [CrossRef]
  31. Chemmanur, T.J.; Paeglis, I.; Simonyan, K. Financial and investment quality, management information policies, and asymmetric. J. Financ. Quant. Anal. 2009, 44, 1045–1079. [Google Scholar] [CrossRef]
  32. Chemmanur, T.J.; Paeglis, I. Management quality, certification, and initial public offerings. J. Financ. Econ. 2005, 76, 331–368. [Google Scholar] [CrossRef]
  33. Park, W.; Byun, C.G. Effect of sme’s managerial ability and executive compensation on firm value. Sustainability 2021, 13, 1828. [Google Scholar] [CrossRef]
  34. Sautner, Z.; Van Lent, L.; Vilkov, G.; Zhang, R. Firm-level climate change exposure. J. Financ. 2023, LXXVIII, 1449–1498. [Google Scholar] [CrossRef]
  35. Almustafa, H.; Nguyen, Q.K.; Liu, J.; Dang, V.C. The impact of COVID-19 on firm risk and performance in MENA countries: Does national governance quality matter? Gaeta GL, editor. PLoS ONE 2023, 18, e0281148. [Google Scholar] [CrossRef]
  36. Ibhagui, O.W.; Olokoyo, F.O. Leverage and firm performance: New evidence on the role of firm size. N. Am. J. Econ. Financ. 2018, 45, 57–82. [Google Scholar] [CrossRef]
  37. Sautner, Z.; van Lent, L.; Vilkov, G.; Zhang, R. Pricing climate change exposure. Manag. Sci. 2023; in press. [Google Scholar] [CrossRef]
  38. Gujarati, D. Basic Econometrics; McGraw-Hill: New York, NY, USA, 2003. [Google Scholar]
  39. Wooldridge, J.M. Introductory Econometrics: A Modern Approach, 6th ed.; Cengage Learning: Boston, MA, USA, 2016. [Google Scholar]
  40. Dougal, C.; Rettl, D.A. Firm listing status and the investment home bias. J. Corp. Financ. 2021, 71, 102095. [Google Scholar] [CrossRef]
  41. Asker, J.; Farre-Mensa, J.; Ljungqvist, A. Corporate investment and stock market listing: A puzzle? Rev. Financ. Stud. 2015, 28, 342–390. [Google Scholar] [CrossRef]
  42. Leuven, E.; Sianesi, B. PSMATCH2: Stata Module to Perform Full Mahalanobis and Propensity Score Matching, Common Support Graphing, and Covariate Imbalance Testing; Boston College Department of Economics: Boston, MA, USA, 2003. [Google Scholar]
  43. Almaghrabi, K.S. Borrowing during periods of policy uncertainty: The role of foreign lenders. Int. Rev. Financ. Anal. 2021, 77, 101860. [Google Scholar] [CrossRef]
  44. Almaghrabi, K.S. Non-operating risk and cash holdings: Evidence from pension risk. J. Bank. Financ. 2023, 152, 106878. [Google Scholar] [CrossRef]
  45. Almaghrabi, K.S. COVID-19 and the cost of bond debt: The role of corporate diversification. Financ. Res. Lett. 2022, 46, 102454. [Google Scholar] [CrossRef] [PubMed]
  46. DeFond, M.; Erkens, D.; Zhang, J. Do client characteristics really drive the big N audit quality effect? New evidence from propensity score matching. Manag. Sci. 2017, 63, 3628–3649. [Google Scholar] [CrossRef]
  47. Shipman, J.E.; Swanquist, Q.T.; Whited, R.L. Propensity score matching in accounting research. Account. Rev. 2017, 92, 213–244. [Google Scholar] [CrossRef]
  48. Engle, R.F.; Giglio, S.; Kelly, B.; Lee, H.; Stroebel, J. Hedging climate change news. Rev. Financ. Stud. 2020, 33, 1184–1216. [Google Scholar] [CrossRef]
Figure 1. Research hypotheses.
Sustainability 15 12878 g001
Table 1. Variable definitions.
VariableDefinitionSource
ROAEarnings before interest, taxes, and depreciation divided by total assets (date items: ebitda/at).Compustat
NINet income divided by total assets (date items: ni/at).Compustat
CFCash flow from operations divided by total assets (date items: (oibdp-xint-txt)/at).Compustat
Climate RiskFirm-level climate change exposure.Sautner et al. [34]: https://climatechangelab.info/publications/firm-level-climate-change-exposure (accessed on 20 June 2023)
Mang. AbilityThe efficiency of managers in transforming corporate resources into revenues and maximizing profitability relative to industry peers.Demerjian et al. [29]: https://peterdemerjian.weebly.com/managerialability.html (accessed on 20 June 2023)
SizeThe natural logarithm of total assets (date item: at).Compustat
MBA firm’s market-to-book ratio (date items: (prcc_f*csho)/ceq).Compustat
TangibilityProperty, plants, and equipment by total assets (date items: ppent/ceq).Compustat
Sales growthSales growth from year t − 1 to year t (date item sale).Compustat
CF Volatility3Volatility of cash flows over the next three years (date items: (oibdp-xint-txt)/at).Compustat
CF Volatility5Volatility of cash flows over the next five years (date items: (oibdp-xint-txt)/at).Compustat
The table presents variable definitions and sources.
Table 2. Summary Statistics.
Countsd.Meanp10p25p50p75p90
ROA43,6200.0870.1120.000.0450.1070.1600.223
NI43,6200.2090.001−0.140−0.0100.0320.0750.123
CF43,6200.1810.072−0.110.0450.1070.1600.223
CF Volatility340,2520.0980.0590.010.0120.0250.0600.140
CF Volatility540,2520.1320.0780.010.0170.0330.0780.179
Climate Risk43,6200.0040.0020.0000.0010.0020.0030.005
Mang. Ability43,6200.147−0.002−0.14−0.088−0.0350.0400.175
Size43,6201.9406.6104.125.3076.5857.8689.109
MB43,6206.0213.3010.691.3052.2413.9677.388
Tangibility43,6200.2310.2430.030.0690.1580.3460.629
Sales growth43,6200.4320.151−0.16−0.0240.0720.2050.453
The table presents the descriptive statistics for the sample firms. All continuous variables are winsorized at the 1st and 99th percentiles.
Table 3. Correlation matrix.
(1)(2)(3)(4)(5)(6)(7)(8)(9)(10)(11)VIF
(1) ROA1.00
(2) NI0.59 ***1.00
(3) CF0.76 ***0.85 ***1.00
(4) CF Volatility3−0.21 ***−0.47 ***−0.49 ***1.00
(5) CF Volatility5−0.21 ***−0.46 ***−0.49 ***0.83 ***1.00
(6) Climate Risk−0.08 ***−0.05 ***−0.08 ***0.02 ***0.02 ***1.00 1.58
(7) Mang. Ability0.19 ***0.12 ***0.12 ***−0.06 ***−0.08 ***−0.08 ***1.00 1.46
(8) Size0.27 ***0.39 ***0.41 ***−0.40 ***−0.42 ***−0.03 ***0.09 ***1.00 1.23
(9) MB0.07 ***0.02 ***−0.000.06 ***0.07 ***−0.02 ***0.10 ***−0.001.00 1.05
(10) Tangibility0.17 ***0.09 ***0.18 ***−0.10 ***−0.12 ***0.04 ***−0.12 ***0.23 ***−0.09 ***1.00 2.37
(11) Sales growth0.02 *0.06 *0.01 *0.040.050.000.13 ***−0.11 ***0.09 ***−0.04 ***1.001.10
The table presents the correlation matrix. All variables are defined in Table 1. ***, **, and * denote significance at the 1%, 5%, and 10% levels, respectively.
Table 4. Climate change exposure and financial performance: The role of managerial ability.
(1)(2)(3)(4)(5)(6)
ROANICFROANICF
Climate Risk−1.14 ***
(−4.71)
−3.19 ***
(−4.36)
−4.48 ***
(−5.78)
−1.27 ***
(−5.36)
−2.39 ***
(−3.57)
−3.77 ***
(−6.45)
Mang. Ability0.14 ***
(39.29)
0.22 ***
(26.56)
0.25 ***
(26.69)
0.12 *
(1.79)
0.16 *
(1.78)
0.17 ***
(24.15)
Climate Risk ∗ Mang. Ability5.85 ***
(2.93)
16.96 ***
(2.82)
15.58 ***
(2.72)
5.10 **
(2.45)
12.91 **
(2.32)
11.07 **
(2.35)
Size 0.01 ***
(48.72)
0.04 ***
(58.86)
0.04 ***
(61.60)
MB 0.00 ***
(12.86)
0.00 ***
(4.23)
0.00 ***
(2.59)
Tangibility 0.07 ***
(26.71)
0.04 ***
(7.10)
0.12 ***
(26.51)
Sales growth −0.00
(−0.26)
−0.01
(−1.44)
−0.02 ***
(−5.98)
Constant0.11 ***
(288.16)
−0.02 ***
(−24.81)
0.07 ***
(63.65)
0.02 ***
(14.06)
−0.31 ***
(−56.30)
−0.20 ***
(−42.85)
Year FEYesYesYesYesYesYes
Industry FEYesYesYesYesYesYes
Observations43,62043,62043,62043,62043,62043,620
Adjusted R20.1470.0940.1010.2170.2250.229
Test [Climate Risk + Climate Risk ∗ Mang. Ability] = 01.051.010.980.920.900.75
The table presents the results for examining Hypothesis 1 on the role of managerial ability in the association between climate change exposure and corporate financial performance. Columns 1 and 4 present the results for regressing returns on assets (ROA) on the interaction between climate change exposure and managerial ability, columns 2 and 5 present the results for regressing net income (NI) on the interaction between climate change exposure and managerial ability, and columns 3 and 6 present the results for regressing cash flow from operations (CF) on the interaction between climate change exposure and managerial ability. All continuous variables are winsorized at the 1st and 99th percentiles. All variables are defined in Table 1. In parentheses, we report the t-statistics based on firm clusters and heteroskedasticity-corrected standard errors. ***, **, and * denote significance at the 1, 5, and 10%, respectively.
Table 5. Climate change exposure and cash flow volatility: The role of managerial ability.
(1)(2)(3)(4)
CF Volatility3CF Volatility5CF Volatility3CF Volatility5
Climate Risk1.94 ***
(5.26)
1.44 **
(2.39)
0.55 *
(1.68)
1.68 ***
(3.27)
Mang. Ability−0.00
(−0.97)
0.03
(1.57)
0.02
(1.10)
0.04
(1.55)
Climate Risk ∗ Mang. Ability−8.74 ***
(−2.99)
−7.97 ***
(−2.74)
−9.12 ***
(−3.72)
−8.37 **
(−2.03)
Size −0.02 ***
(−57.57)
−0.03 ***
(−59.04)
MB 0.00 ***
(3.72)
0.00 ***
(2.63)
Tangibility −0.05 ***
(−13.46)
−0.07 ***
(−15.85)
Sales growth 0.03 ***
(15.19)
0.05 ***
(16.67)
Constant0.06 ***
(127.47)
0.08 ***
(121.34)
0.20 ***
(68.86)
0.28 ***
(69.92)
Year FEYesYesYesYes
Industry FEYesYesYesYes
Observations40,25240,25240,25240,252
Adjusted R20.1120.0720.2720.293
Test [Climate Risk + Climate Risk ∗ Mang. Ability] = 01.221.221.071.07
The table presents the results for examining Hypothesis 2 on the role of managerial ability on the association between climate change exposure and cash flow volatility. Columns 1 and 3 present the results for regressing cash flow volatility over the following 3 years on the interaction between climate change exposure and managerial ability, and columns 2 and 4 present the results for regressing cash flow volatility over the following 5 years on the interaction between climate change exposure and managerial ability. All continuous variables are winsorized at the 1st and 99th percentiles. All variables are defined in Table 1. In parentheses, we report the t-statistics based on firm clusters and heteroskedasticity-corrected standard errors. ***, **, and * denote significance at the 1, 5, and 10%, respectively.
Table 6. Climate change exposure and financial performance: The role of managerial ability.
(1)(2)(3)
ROANICF
Panel A: PSM results
Climate Risk−1.48 ***
(−6.58)
−3.04 ***
(−5.54)
−4.71 ***
(−10.18)
Mang. Ability0.12 ***
(44.36)
0.17 ***
(24.88)
0.18 ***
(32.85)
Climate Risk ∗ Mang. Ability4.21 **
(2.23)
9.42 **
(2.14)
9.79 **
(2.51)
ControlsYesYesYes
Year FEYesYesYes
Industry FEYesYesYes
Panel B: Clustering the standard errors at the industry level
Climate Risk−1.27 ***
(−4.04)
−2.39 ***
(−2.93)
−4.07 ***
(−4.96)
Mang. Ability0.12 ***
(23.70)
0.16 ***
(11.92)
0.19 ***
(11.49)
Climate Risk ∗ Mang. Ability5.10 *
(1.69)
12.91 *
(1.74)
10.91 *
(1.76)
ControlsYesYesYes
Year FEYesYesYes
Industry FEYesYesYes
Panel C: Controlling for time-series changes in public attention to climate change
Climate Risk−0.85 ***
(−3.13)
−1.40 *
(−1.80)
−3.49 ***
(−4.10)
Mang. Ability0.14 ***
(33.14)
0.19 ***
(20.92)
0.23 ***
(21.39)
Climate Risk ∗ Mang. Ability13.31 ***
(4.98)
37.57 ***
(4.85)
35.21 ***
(4.34)
ControlsYesYesYes
Year FEYesYesYes
Industry FEYesYesYes
Panel D: Controlling for additional firm-level variables
Climate Risk−1.86 ***
(−8.15)
−5.09 ***
(−8.50)
−6.98 ***
(−11.33)
Mang. Ability0.15 ***
(45.98)
0.26 ***
(36.94)
0.32 ***
(40.18)
Climate Risk ∗ Mang. Ability3.97 **
(2.02)
6.15 *
(1.77)
4.59 **
(1.99)
ControlsYesYesYes
Year FEYesYesYes
Industry FEYesYesYes
Panel E: Excluding the financial crisis and COVID−19 periods
Climate Risk−1.25 ***
(−4.69)
−2.10 ***
(−2.69)
−4.24 ***
(−4.87)
Mang. Ability0.12 ***
(31.85)
0.16 ***
(17.61)
0.19 ***
(19.02)
Climate Risk ∗ Mang. Ability6.92 ***
(2.83)
12.32 *
(1.77)
12.84 *
(1.83)
ControlsYesYesYes
Year FEYesYesYes
Industry FEYesYesYes
The table presents the robustness tests of Hypothesis 1, which examines the role of managerial ability on the association between climate change exposure and corporate financial performance. Column 1 presents the results for regressing returns on assets (ROA) on the interaction between climate change exposure and managerial ability, column 2 presents the results for regressing net income (NI) on the interaction between climate change exposure and managerial ability, and column 3 presents the results for regressing cash flow from operations (CF) on the interaction between climate change exposure and managerial ability. Unless otherwise indicated, the control variables are the same as in the baseline regressions. All continuous variables are winsorized at the 1st and 99th percentiles. In parentheses, we report the t-statistics based on firm clusters and heteroskedasticity-corrected standard errors. ***, **, and * denote significance at the 1, 5, and 10%, respectively.
Table 7. Climate change exposure and financial performance: The role of managerial ability.
(1)(2)
CF Volatility3CF Volatility5
Panel A: PSM results
Climate Risk0.85 *
(1.84)
2.11 **
(2.21)
Mang. Ability−0.03 ***
(−5.43)
−0.04 ***
(−5.22)
Climate Risk ∗ Mang. Ability−10.33 ***
(−3.21)
−16.81 **
(−2.10)
ControlsYesYes
Year FEYesYes
Industry FEYesYes
Panel B: Clustering the standard errors at the industry level
Climate Risk0.02 **
(2.06)
1.61 ***
(2.86)
Mang. Ability0.03
(1.57)
0.04
(1.21)
Climate Risk ∗ Mang. Ability−9.97 ***
(−3.80)
−8.72 **
(−2.16)
ControlsYesYes
Year FEYesYes
Industry FEYesYes
Panel C: Controlling for time-series changes in public attention to climate change
Climate Risk0.18 *
(1.66)
1.36 **
(2.16)
Mang. Ability0.00
(0.77)
0.02
(0.91)
Climate Risk ∗ Mang. Ability−14.10 ***
(−3.93)
−12.95 **
(−2.06)
ControlsYesYes
Year FEYesYes
Industry FEYesYes
Panel D: Controlling for additional firm-level variables
Climate Risk0.49 **
(1.99)
1.48 ***
(2.98)
Mang. Ability−0.01 *
(−1.66)
−0.00
(−0.32)
Climate Risk ∗ Mang. Ability−9.57 ***
(−3.82)
−8.53 **
(−2.12)
ControlsYesYes
Year FEYesYes
Industry FEYesYes
Panel E: Excluding the financial crisis and COVID-19 periods
Climate Risk0.16 *
(1.75)
1.34 **
(2.14)
Mang. Ability0.03
(0.98)
−0.04 *
(−1.69)
Climate Risk ∗ Mang. Ability−10.16 ***
(−3.66)
−8.78 *
(−1.90)
ControlsYesYes
Year FEYesYes
Industry FEYesYes
The table presents the robustness tests of Hypothesis 2, which examines the role of managerial ability on the association between climate change exposure and future cash flow volatility. Column 1 presents the results for regressing cash flow volatility over the following 3 years on the interaction between climate change exposure and managerial ability, and column 2 presents the results for regressing cash flow volatility over the following 5 years on the interaction between climate change exposure and managerial ability. Unless otherwise indicated, the control variables are the same as in the baseline regressions. All continuous variables are winsorized at the 1st and 99th percentiles. In parentheses, we report the t-statistics based on firm clusters and heteroskedasticity-corrected standard errors. ***, **, and * denote significance at the 1, 5, and 10%, respectively.
Disclaimer/Publisher’s Note: The statements, opinions and data contained in all publications are solely those of the individual author(s) and contributor(s) and not of MDPI and/or the editor(s). MDPI and/or the editor(s) disclaim responsibility for any injury to people or property resulting from any ideas, methods, instructions or products referred to in the content.

