Abstract
Qinghai is rich in mineral resources, but frequent and large-scale mineral mining has caused secondary damage to the fragile primary surface and produced a large number of landslide disasters. In complex geological environments such as glacier ablation and frequent tectonic movements, a complete quantitative evaluation method for landslide risk in high-cold mining areas has not yet been formed. In view of this, this article uses the field survey and remote sensing data of the Datong mining area in Qinghai Province in 2012 as the basic data. We comprehensively considered five first-level factors (13 s-level factors) including topography, lithological structure, mining engineering activities, land use, and dynamic deformation as evaluation indicators for landslide susceptibility in mining areas, and used the Topographic Wetness Index (TWI) and the Human Engineering Activity Intensity (HEAI) to quantitatively estimate the hazard of landslide according to the landslide trigger mechanism. The weight-of-evidence approach was used for landslide hazard and risk mapping under different landslide--inducing conditions. The results indicate that the extremely high-hazard areas induced by human engineering activities account for 14% of the total area, and the extremely high-risk areas account for 13% of the total area in the Datong mining area, and the area of the extremely high-risk area is large; the landslide risk assessment mapping model constructed in this study can effectively evaluate the probability of slope instability caused by rainfall and human engineering activities. The effective value of the receiver operating characteristic (ROC) curve of the sensitivity assessment model reaches 0.863, and the evaluation results are consistent with reality; using the weight-of-evidence model for landslide risk assessment is more in line with the actual situation in alpine mining areas, and is more suitable for guiding landslide risk management and disaster prevention and mitigation in mining areas.
1. Introduction
China has the largest number of heavy mine tailings ponds in the world, and mining activities have created 20,000 km2 of tailings wasteland and induced a large number of landslides [1]. Landslides in mining areas mainly include collapses, slides, debris flows, ground collapses, and ground fissures [2], especially in the alpine mining area in Northwest China. As of 2019, the number of mining landslides in this area reached 2334 [3]. Qinghai is located in the northeast of the Tibet Plateau known as the roof of the world, and its area above 3000 m above sea level accounts for 84.1% of the total area of Qinghai Province [4]. The massive melting of glaciers and frequent tectonic movements in these areas make their geological environments particularly complex and fragile. At the same time, due to the rich mineral resources such as coal and precious metals in Qinghai, the frequent and large-scale mining of minerals has caused secondary damage to the fragile surface, and seriously threatens the lives of local people and the construction of a sustainable ecological environment [5].
Taking Datong coal-mining area of Qinghai Province as an example, the opencast mining method has created a large number of high and steep slopes, while the underground mining method has caused numerous ground collapses; the gangue mountains that have accumulated around the mine pits form potentially unstable slopes, posing a serious threat to the production facilities and construction workers in the mine. A large area of soil vegetation and coal gangue mountain were stripped away in the Datong mining area, resulting in a large amount of “black” pollution. It causes great harm to the local ecological environment [6]. Therefore, how to evaluate the landslide risk caused by mining in alpine mining areas in complex environments and provide an information basis for the subsequent ecological restoration and governance of abandoned mining areas is an urgent problem to be solved at present.
The concept of landslide risk was proposed by Varnes [7], who stated that landslide risk refers to the possibility of landslides causing damage to the surrounding environment, land and buildings, and has strong social attributes. According to the specific norms and related definitions of natural disaster risk issued by the United Nations Department of International Humanitarian and Social Affairs, risk is the expected value of the loss of human life and other economic activities directly caused by a specific natural disaster within a certain time and space range. The related formula is as follows: “Risk (R) = Hazard (H) × Vulnerability (V)”. This definition has been recognized by scholars and relevant institutions [8]. Since the 1980s, as research on landslide risk continues to develop, the content of research has become richer, the means of research have become more varied, and disaster risk evaluation has begun to break through the traditional qualitative model and move into the stage of data-driven quantitative research [9,10,11,12,13,14].
Mine landslide risk mapping needs to combine human mining activities and disaster-predisposing background. There are many types of landslides, and most evaluation methods draw on the relevant theories and methods of landslide-disaster risk assessment. Duzgun and Einstein studied coal mine roof collapse by counting 1141 coal mine roof collapse events from 12 mines in the Appalachian region, proposed a risk decision method for coal mine roof collapse, and summarized the probability distribution function and expected loss model of roof collapse [15]. Palei et al. established the risk of roof collapse in coal mines due to underground road column mining through a logistic regression model [16]. Su et al. comprehensively analyzed the validity of the three models of support vector machine (SVM), logistic regression (LR), and artificial neural network (ANN) models for landslide risk mapping in mining areas, and verified that coal mining has a significant effect on the occurrence of landslides in coal mining areas [17]. Arca et al. established a multi-factor evaluation model for risk prediction based on an analysis of the formation mechanism and development law of major landslides, such as goaf subsidence, debris flow, landslide, and karst subsidence, in underground mining areas and evaluated the ecology and economy of mine landslides [18]. In summary, many scholars have made indelible contributions to landslide risk evaluation, making a major step forward in landslide evaluation internationally. However, in recent years, most scholars have focused on the comparison of the effects of different data-driven models on landslide risk assessment in mining areas [19,20,21]. The risk assessment of the landslide-induced mechanism under the background of geological conditions in alpine mining areas is rarely considered, and most of the methods used are semi-quantitative methods such as expert knowledge-driven [22]. Therefore, according to the unique geological environment, structural conditions, and disaster characteristics of alpine mining areas, a complete quantitative evaluation method or standard for landslide risk in mining areas has not yet been formed.
Therefore, this article takes the Datong mining area in Qinghai Province as an example. Under the premise of fully analyzing the landslide development characteristics, geological formation conditions and disaster-bearing body characteristics in the mining area, innovatively selected landslide susceptibility evaluation factors with environmental characteristics of high-cold mining areas, such as goaf range, surface land reconstruction, InSAR dynamic deformation, and vegetation coverage index. Using the weight-of-evidence method to complete the geological environment risk assessment of mining areas, a set of quantitative landslide risk mapping method suitable for high-cold mining areas is proposed, aiming to provide information support for landslide risk assessment and ecological environment restoration in high-cold mining areas.
2. Research Area
The key coal mining subsidence area in Datong County is located in the southeast of Datong Hui Tu Autonomous County, Xining City, Qinghai Province, China, with a geographical location between 101°36′ and 101°40′ east longitude and 36°56′ and 36°55′ north latitude. The study area is located in the eastern part of the key coal mining subsidence area of Datong County, namely the low mountainous hilly area to the south of Yuanshu and Anmentan villages, covering an area of about 16.7 km2 (Figure 1). The Datong mining area is located in the northeastern part of the Qinghai–Tibet Plateau, which is a transition zone between the Loess Plateau and the Qinghai–Tibet Plateau, with a typical plateau continental climate, low and cold temperatures, and large diurnal temperature differences. Rainfall in the basin is abundant, with an annual average temperature of 2.8 °C, an average annual precipitation of 513.8 mm, and an annual average daily rainfall of 10 mm with 13.7 days of rainfall.
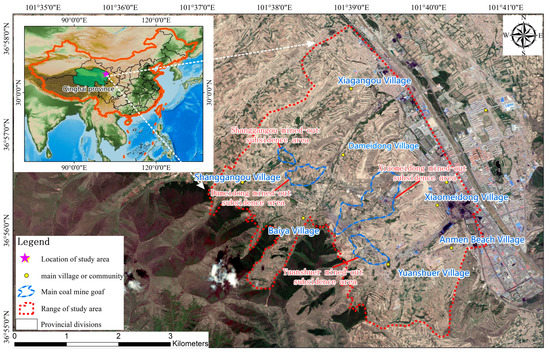
Figure 1.
Location map of the Datong coal mine.
The mining of Datong coal resources can be traced back to the Ming Dynasty in China. There were 12 private kilns with a mining scale from the 14th century to the 17th century. Since the 1960s, with the promotion of new coal mining methods, the output of the Datong coal mine has increased to about 1.2 million t/a. In the 1970s, there were 20 village collectives, township collectives, and state-owned coal mining enterprises in the Datong coal mines, which were independently developed by various economic entities. The geomorphic landscape in the area was destroyed, causing many environmental and geological problems, and resulting in the spread of pits and ponds, piles of spoils resembling mountains, and frequent secondary landslides (Figure 2).
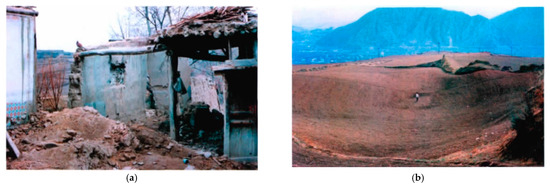
Figure 2.
Environmental damage impacts of disasters caused by coal mining at the Datong mine [23]. (a) Damage to houses around the mine. (b) Surface subsidence of cultivated land.
Due to the large amount of underground mining at the Datong mining area, which led to landslides and geological environmental problems, mining activities were stopped in 2012. According to the on-site investigation in 2012, there were four large-scale subsidence areas, including Yuanshuer, Xiaomeidong, Dameidong, and Shanggangou, in the Datong mining area. Landslide is the most serious type of disaster in the Datong mining area (the widest range of influence), and there are 38 landslides in the research area. It can be seen from Figure 3 that the eastern and central areas of the Datong mining area are high-incidence areas of landslide disasters, mainly involving Baiya Village, Dameidong, and Xiaomeidong. An analysis of landslide development in each community (Table 1) shows that most landslides have developed in the areas belonging to the villages of Xiaoxiadong and Yuanshuer, with seven and 10 landslides, respectively, accounting for 44.73% of the total number of landslides in the Datong mine area. This is followed by the village of Dabaiya with six landslides, accounting for 15.7% of the total. This study, therefore, aimed to complete a landslide risk assessment of the Datong mine area using the 2012 site survey and mapping data to provide technical support for subsequent ecological restoration and management of the mine area.
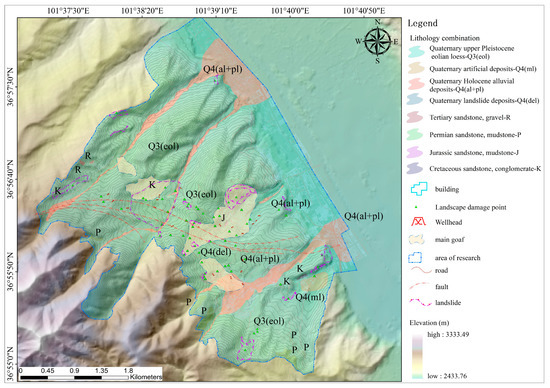
Figure 3.
Distribution of landslides at the Datong mine in 2012.

Table 1.
Statistics of landslide development features at the Datong mine in 2012.
3. Methods
Risk evaluation is mainly achieved through three steps, namely landslide susceptibility evaluation, hazard evaluation, and vulnerability evaluation. All the above steps are based on probabilistic statistics, and the weight of evidence of the data-driven model is used to determine the magnitude of the likelihood of occurrence of landslides in different geological units [24,25,26]. The landslide risk evaluation system established in this study is as follows: Firstly, complete basic data collection (including grid data of environmental conditions that induce landslides, landslide list, inducing factors, and threat objects), secondly, complete the selection and weight assignment of each evaluation factor. Thirdly, combine the rating factors and weights to calculate the spatial probability of landslide occurrence (that is, landslide susceptibility), fourthly, combine the landslide inducing factors to complete the hazard assessment on the basis of susceptibility, and finally, combined with the range of threatened objects and AHP weight (that is, landslide vulnerability), the landslide risk mapping in the mining area is completed. The specific process is shown in Figure 4.
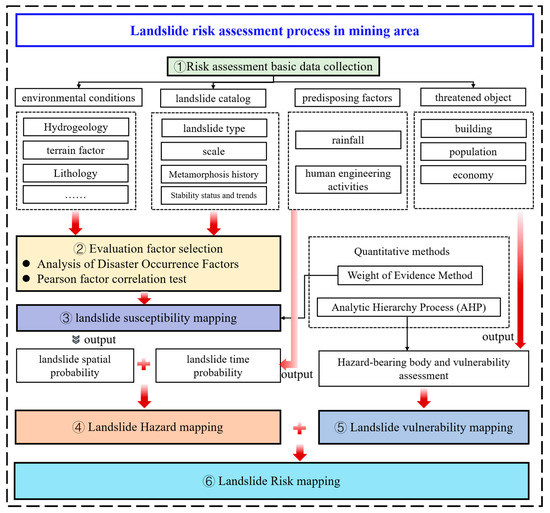
Figure 4.
Flow chart for landslide hazard risk mapping in mining areas.
3.1. Evaluation Units and Survey Scales
In the evaluation of landslide risk in mining areas, landslide development is influenced by many factors and shows significant variability and complexity in a local area; therefore, the first consideration in the susceptibility evaluation of the investigated area is to determine the evaluation cell. Common types of cells used in landslide risk assessment are grid cells, geographical cells, homogeneous condition cells, sub-catchment cells, and slope cells (several major evaluation units are shown in Figure 5). A grid cell is more regular in shape, which facilitates rapid disaggregation, and discrete data in the form of a matrix are useful for further calculations; however, it does not fully reflect the relief of the terrain and is not closely related to the geological environment. Homogeneous condition cells do not take into account the differences in the geological environment of different areas. A sub-catchment cell is suitable for debris-flow hazard zoning, but not for landslides and collapses. Considering that landslides are mainly manifested as surface deformation and rupture or deformation characteristics, the slope unit is the basic unit for landslide development. Therefore, the use of the slope unit as the evaluation unit can be closely related to the geological environmental conditions, and the role of various controlling or influencing factors can be reflected comprehensively, so that the evaluation results are closer to the actual situation.

Figure 5.
Diagram of common evaluation units. (a) Grid cells, (b) Basin unit, (c) Slope units.
It can be seen from Table 1 that most of the landslide disasters at the site are small- and medium-sized landslides. In order to complete the geological environmental risk assessment of the Datong mining area in a more refined manner, the survey scale of 1:2000 was used to ensure the survey accuracy of the entire key area of the mining area, and 1m pixel size raster data were selected as the basic element of the slope unit evaluation.
3.2. Evaluation Model
The most important step in risk rating is to determine the size of the weights under each hierarchical level of different evaluation factor layers. The weight-of-evidence method mainly used in this step was first proposed by the geologist Agterberg [27]. This method analyzes the impact probability of different factor layers on hazards using the fact that landslides have already occurred as an a priori probability condition, and it has been widely used in landslide risk assessment [28]; its basic assumption is that each element is independent of the others, and from there, a prediction method can be quantified based on the Bayesian conditional probability formula.
3.2.1. Susceptibility Evaluation
For the practical application of susceptibility evaluation, it is assumed that the study area can be divided into T cells of equal size, where D cells are the hazard cells and cells are the non-hazard cells, and for any one impact factor, its weight is defined as follows:
The above equation indicates that are the weight values for the presence and absence of the impact factor, respectively, with a weight of 0 for the absence of the original data; B is the number of cells in the presence of the impact factor; and is the number of cells in the absence of the impact factor. means that the evidence layer is present, whereas means that it is not present; is the integrated weight value to measure the correlation between the evidence layer and the disaster.
The magnitude of the weight is relative and is a dimensionless value determined by the ratio between the area of all hazard points falling into a particular layer and the area of all hazards to the ratio between the area of the feature layer and the area of the entire study area. A positive correlation between the evidence layer and hazard points is expressed as > 0, < 0; a negative correlation is expressed as > 0, < 0; the weight is 0 when there is no correlation; the weight is also considered as 0 when the data are missing; and the susceptibility result is obtained using the calculation method of Equation (3) to obtain the weight of each factor and to complete the weighted superposition calculation.
3.2.2. Hazard Evaluation
- Calculation of the hazard of rainfall-induced disasters
Based on the results of the susceptibility evaluation and the spatial distribution of rainfall in the survey area, a weighted linear evaluation model for hazard assessment was constructed by combining the normalized results of the hazard vulnerability assessment and the spatial distribution of rainfall at different times in the work area, as shown below:
indicates the magnitude of the hazard value; indicates the slope-type hazard susceptibility weight of the survey area; and indicates the weight of the normalized rainfall spatial distribution calculated based on the weight-of-evidence method.
According to the model, the relative size values of different terrains eroded by rainfall in the same area can be obtained, and then the results are normalized separately. The normalization method is shown in Equation (5), and the results are reclassified according to the normalized values obtained by recalculation. The reclassification results include four categories: low hazard, medium hazard, high hazard and very high hazard areas.
- 2.
- Calculation of the hazard of disasters induced by human engineering activities
Similar to the results of the rainfall-induced hazard assessment, the magnitude of the hazard under different intensive human engineering activities was calculated in accordance with Equation (6) under the condition that the density of human engineering activities in the study area was known; the normalized value results were calculated in accordance with Equation (6):
indicates the disaster susceptibility of the study area, and indicates the spatial distribution of the weight of evidence for human engineering activities.
3.2.3. Risk Evaluation
Risk refers to the likelihood and severity of damage to various types of hazard-bearing bodies due to landslides in a certain area and at a certain period of time, including casualties, economic losses, and environmental damage [29]. Therefore, risk assessment should be based on the vulnerability of the threatened objects, where vulnerability should be assessed quantitatively and qualitatively by experts according to the social context. Risk evaluation should be based on the idea of people. Even if a disaster has a high probability, the risk caused by the disaster is very small when there is no obvious disaster target. Therefore, a superposition of landslide hazard and vulnerability evaluation results was adopted in this study to determine the risk level of sudden landslides. The classification of landslide risk levels is shown in Table 2.

Table 2.
Classification of landslide risk.
4. Results of Landslide Risk Evaluation
4.1. Spatial Analysis of Mine Landslides
The analysis of the spatial distribution law of landslides in mining areas was used as the basis for the risk assessment because we needed to understand the mechanism and law of landslide space disaster to select different evaluation indexes. The main method was to count the distribution of disasters and the correlation of disaster-predisposing background through the established landslide sample database, among which the disaster-predisposing geological environment factors mainly include five landslide-inducing factors: topographic factor, lithologic structure, mining engineering activity, land use, and dynamic deformation effect. Through the spatial statistical analysis function of a Geographic Information System (GIS), the result vector data of each geological environment problem were collected; then, the raster map layer of each factor was prepared to divide its range, and the correlation between the occurrence probability of disasters and the factor grading interval was measured through the disaster occurrence rate. The higher the occurrence rate of a certain factor grading value is, the stronger the positive correlation is with respect to each disaster-causing factor and the disaster occurrence under the grading level range. The calculation formula is as follows:
is the occurrence rate of disasters (environment), indicating the number density ratio of disasters that have occurred under a certain grading condition; m is the proportion of disaster quantity, indicating the ratio of the quantity of disaster markers contained in the above factor grading interval to the total disaster quantity; and s is the area proportion of the grading interval, indicating the ratio of the grid area included in the grading interval of disaster-inducing factors to the total grid area.
According to the data acquisition, this study examined the main disaster-predisposing background of landslides in the Datong mine area and accounted for the following factors and their information on disaster-inducing patterns: (1) topographic factors, including elevation, slope, slope direction, roughness, and profile curvature; (2) lithology and tectonics, including distance from the fault and engineering geological rock groups; (3) engineering activities in the mine area, including distance to underground mine excavation, engineering governance measures, and distance to roads; (4) land use, including types of land use and vegetation cover; and (5) dynamic deformation effect including InSAR deformation. Figure 6 shows the statistics of landslides and related disaster-predisposing background factors in the Datong mine area.
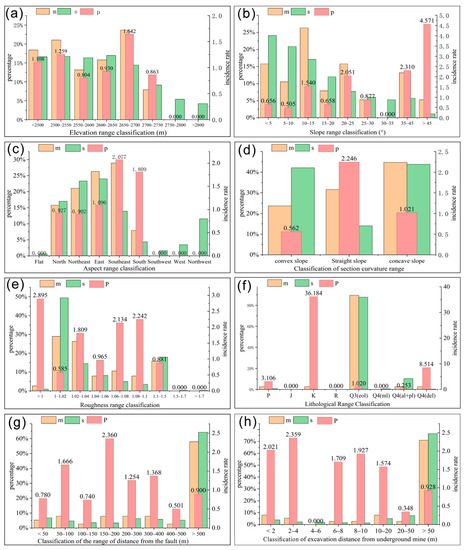
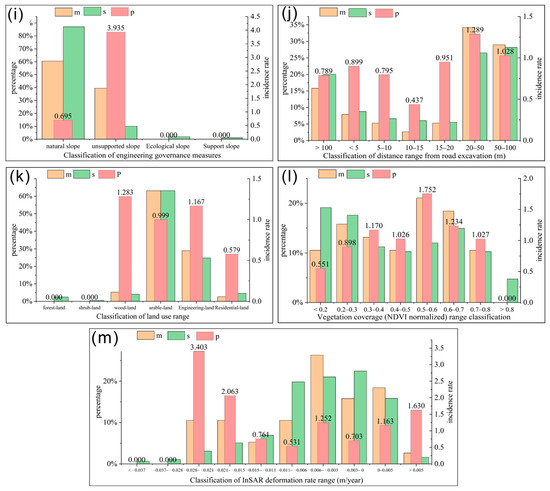
Figure 6.
Statistical map of the distribution of different impact factors and landslide development in the Datong mine area: (a–m) are the statistical plots of elevation, slope, slope direction, profile curvature, surface roughness, lithological combination, distance from the fault, distance to underground mine excavation, engineering governance measures, distance from road, types of land use, vegetation coverage, and INSAR-descending track deformation rate (2012–2017) for a total of 13 factors graded against landslide development characteristics (p-hazard incidence, m-zone interval area share, and s-hazard number share).
By analyzing the above statistical characteristics, the main spatial distribution rules of landslide disasters in the Datong mining area are as follows:
- Landslides are most influenced by topographic factors. Slope gradient and slope profile morphology are important factors that influence the occurrence of slopes.
- The distance between the tectonic faults and the occurrence of disasters is significantly negatively correlated, i.e., the closer the slope is to the fault, the more likely it is that damage and deformation will occur.
- The main material composition of landslide is soil. According to the causes and inducing factors, the landslides in the area can be divided into those caused by natural factors and those caused by human factors. The loosening of rock and soil in the central slope due to underground mining in the Datong mining area is a human factor that induces a landslide. Under the action of rainfall in the later period, the soil is saturated, which makes the slope deform and evolve into a landslide, which is a natural factor for the formation of the landslide.
- Human engineering activities and topography play a major role in controlling the occurrence of disaster, and the elevation, slope, and land-use type of the topography have a greater correlation with the occurrence of disaster. The order of influence on landslide occurrence is as follows: distance to underground mine excavation > engineering governance measures > distance to road > slope > distance from the fault > InSAR deformation rate > slope direction > engineering geological rock groups > elevation > normalized difference vegetation index (NDVI) > types of land use > curvature.
4.2. Susceptibility Evaluation
4.2.1. Selection and Quantification of Susceptibility Evaluation Indicators
The construction of an index system is a very important step for vulnerability evaluation. It is almost impossible to establish a model including all geological environmental factors to evaluate vulnerability in practical work. Because the parameters contained in some factors are sometimes difficult to obtain, there may be complex synergy or mutual influence among the parameters. Therefore, it is key to choose rational, stable and quantifiable evaluation factors that play a leading role in the evaluation objectives.
According to the distribution pattern of landslide development and geological background described in this study, the topography, geomorphology, stratigraphic lithology, and hydrogeology of the Datong mining area are relatively simple, and it can be observed that the whole geological background is mainly controlled by stratigraphic lithology and human engineering activities. In the vicinity of Shanggangou village, there are relatively few landslides due to less human engineering work. The distribution of lithological outcrops and the distribution of tectonic patterns are also somewhat related. The geological formations, the engineering geological formations, and the curvature of the profile can, therefore, be selected from this aspect. Human excavation has caused different degrees of damage to the geological environment of Datong County, and human engineering activities have an obvious influence on the occurrence of geological hazards; thus, the human engineering activity effect factor should be considered in the susceptibility assessment, and in this study, the engineered cut slope type and road distance are used to quantify this factor.
In addition, the Bayesian conditional probability theory in the calculation of factor weights requires that the selected factors be independent of each other in order to make the results more reliable. Pearson’s independence test was used to find out whether the factors were correlated [30]. The final results of the analysis are shown in Table 3, where the Pearson coefficient values range from -1 to 1, with negative values indicating a negative correlation and vice versa. A Pearson coefficient between two factors with an absolute value between 0 and 0.3 indicates a weak linear correlation, a value between 0.3 and 0.7 indicates a medium linear correlation, and a value above 0.7 indicates a strong linear correlation.

Table 3.
The results of the Pearson correlation test of landslide susceptibility evaluation factors.
According to the |R| characterization correlation shown in Table 4, one of the two factors with high correlation, roughness, was eliminated. Of course, this process cannot depend entirely on a mathematical method to eliminate selected factors, but it should still be combined with geological understanding and judgment of the development of geological hazards, such as the distance to the fault and the underground mine excavation on landslide hazards generated by different causal mechanisms, and with the occurrence of disasters with a stronger correlation, so neither G7 nor G8 is deleted. As shown in Table 4, the landslide-inducing factors in Datong coal mines are divided into five first-order factors: topographical factors, lithological structure, engineering activities in the mining area, land use, and dynamic deformation. For a more detailed analysis of the impact of different disaster-causing factors on landslides, the corresponding major categories are divided into 12 s-order factors in detail. The corresponding GIS layers and grading ranges for each factor are shown in Figure 7.

Table 4.
Selection of evaluation factors of landslide (unstable slope) susceptibility in the Datong mining area.
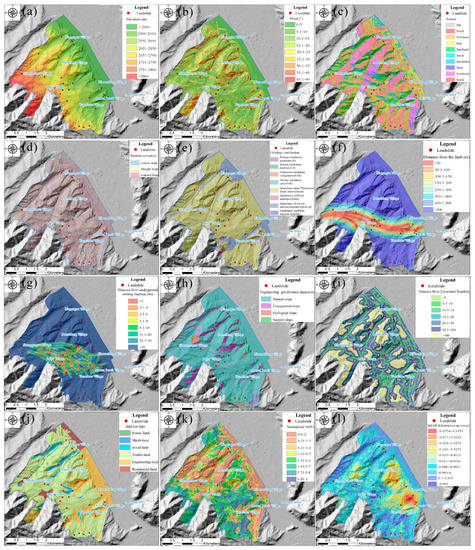
Figure 7.
Layer of assessment factors for assessment of susceptibility to geological disasters in the Datong mining are: (a–l) represent elevation, slope, slope direction, slope curvature, engineering geological rock groups, distance from the fault, distance from underground mine excavation, engineering governance measures, distance from road excavation, types of land use, normalized difference vegetation index (NDVI), and InSAR deformation rate for a total of 12 factor layers and grades.
4.2.2. Evaluation Results
Based on the 12 factors selected for the landslide susceptibility assessment, the number of rasters under the grading of each factor and the number of hazard rasters under the grading of each factor were counted separately; the positive evidence value W+ and negative evidence value W− under the grading of each factor were calculated separately based on Equations (1) and (2); and the probability values were derived according to the rules of the evidence weighting method, and for each factor layer, the corresponding new layer was generated in ArcGIS for each factor layer according to the probability value. As the evidence weighting method relies on the Bayesian probability theory to calculate from the priori probability of a hazard occurring to obtain the posteriori probability prediction of the engineering geological conditions of the whole mine area for the occurrence of a hazard, the relevance of each factor for the prediction of the hazard can be assessed based on the p-weight value for each factor obtained from Equation (3). Finally, the different factor layers were superimposed according to the probability weighting to generate the susceptibility values.
The 12 evaluation index weights were superimposed on the evaluation factors, and the values calculated using the natural break method were divided into four levels (Figure 8), which correspond to low, medium, high and very high landslide susceptibility areas (Figure 9).
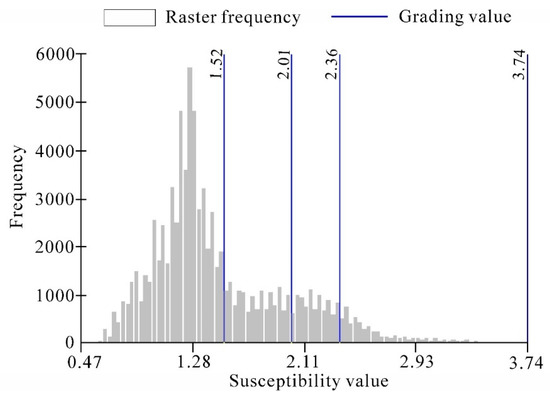
Figure 8.
Frequency distribution of landslide (unstable slope) susceptibility weight values and natural breakpoint classification for the Datong mining area.
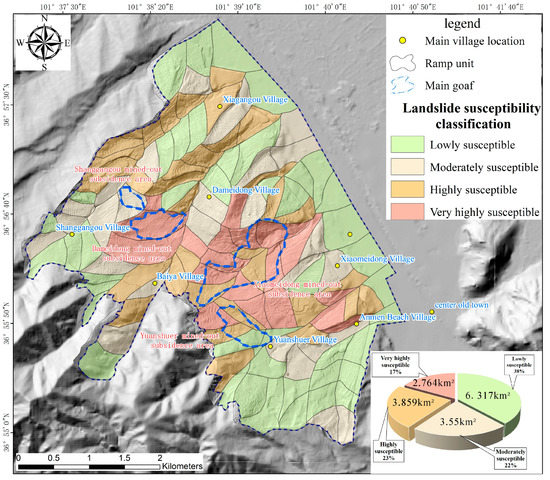
Figure 9.
Landslide susceptibility zoning map for the Datong mining area.
In order to evaluate the predictive ability of the model, the ROC curve test, which is widely used to test the predictive ability of landslide susceptibility assessment models [31], was used. The main method of this test is to use different thresholds to split the predicted values; the horizontal coordinate is the false positive rate of the unit with no disaster being predicted as positive, and the vertical coordinate is the true positive rate of the unit with disaster being predicted as positive. The closer the curve is to the upper left corner, the higher the accuracy of the model classification, as shown in Figure 10. The AUC (Area Under Curve) is defined as the area below the ROC curve to the horizontal coordinate, and the value ranges from 0.5 to 1. The higher the AUC value, the higher the accuracy of the model. The AUC of this evaluation model is 0.863, indicating a high degree of evaluation accuracy and a well-trained model.
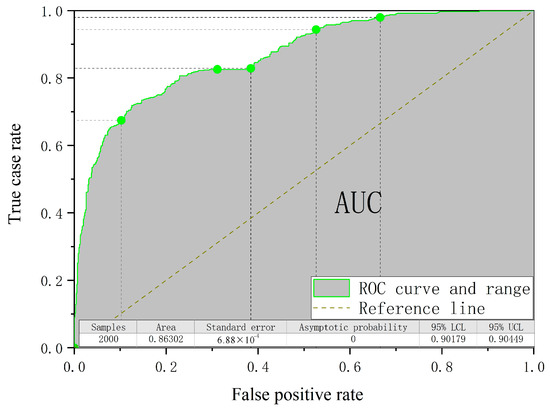
Figure 10.
Results of the ROC test for landslide susceptibility assessment at the Datong mine.
4.3. Hazard Evaluation
4.3.1. Selection and Quantification of Hazard Evaluation Indicators
Landslide hazard assessment refers to the consideration of the influence of various external factors that easily induce landslides on the basis of landslide susceptibility [32], and such an assessment further portrays and predicts the scope of landslide impact and the probability of occurrence, which generally includes three types of quantitative factors, including rainfall, earthquakes, and human engineering activities. Combined with the landslide development pattern in the Datong mining area in the past 10 years from 2012 to 2022, human engineering activities and rainfall are still the most important triggering factors. As earthquakes in the study area are characterized by continuous activity, the impact of historical strong earthquakes on the study area is small and not very destructive; thus, the impact of seismic activities is not considered in this risk assessment.
- Selection of rainfall factor index
Rainfall is one of the main triggers of landslides in mining areas during exceptionally heavy floods [33]. Continuous rainfall leads to an increase in surface water, and when it infiltrates into the geotechnical body, the cohesion and friction angle become smaller, thus leading to slope instability. As the overall scope of the study area is small and there is no obvious difference in the spatial distribution of rainfall in each area, it is difficult to quantify the area and classify the hazard risk of rainfall; therefore, the after-effect process of rainfall is mainly considered as the hazard evaluation index. From the mechanism of rainfall-induced landslides, it can be seen that when rainwater reaches the slope surface, it will move in two ways as surface water and groundwater, both of which will converge and gather along the depressions of the terrain, thus wetting the land to a greater extent and causing slope damage.
The Topographic Wetness Index (TWI) was chosen for this study to represent the magnitude of enriched water flow in the area [34]. The TWI is a physical indicator of the influence of regional topography on rainfall runoff direction and accumulation, and the distribution of the TWI in the study area is shown in Figure 11a. The TWI is a function of slope and upstream contributing area and is useful for identifying rainfall runoff patterns, areas of potential soil moisture content increase, and areas of waterlogging. The TWI, which quantifies the control of basic hydrological processes by topography, corresponds to the quantitative grading of hazard indicators shown in Table 5.
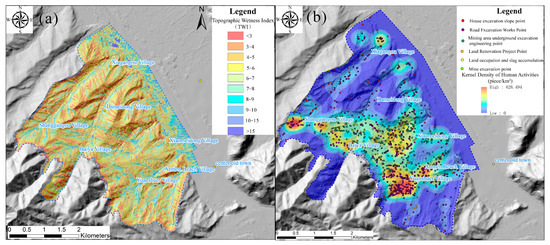
Figure 11.
Landslide risk assessment of human engineering activity-induced factor at the Datong mine: (a) shows the terrain moisture index and classification layer, and (b) shows the intensity of human engineering activities and classification layer.

Table 5.
Classification index and classification of rainfall-induced landslides.
- 2.
- Human engineering activity-induced evaluation factors
An evaluation factor of human engineering activities mainly refers to the quantification of the probability size of damage to natural slopes caused by irregular artificial disturbance [35]. In this study, it mainly includes underground mining, engineered slope cutting, slag accumulation, land suppression, etc. In order to measure the probability and frequency of the impact of human engineering activities at different sites, the kernel density of human engineering activities was, therefore, chosen as the induced evaluation factor. The kernel density of human engineering activities refers to the density magnitude of all human engineering activities in different spatial distributions calculated by the kernel density function, which expresses the frequency of occurrence of human engineering activities. In this study, the distribution of different human engineering activities in the Datong mining area was counted and quantified using the kernel density function in the ArcGIS toolbox, and the results are shown in Figure 11b. The corresponding quantified factors and grading are shown in Table 6.

Table 6.
Classification indicators and classification of human engineering activity-induced landslides.
4.3.2. Evaluation Results
According to Equation (4), the results of the susceptibility evaluation derived from the previous section were used for the hazard calculation according to the weighted superimposed rainfall pooling factor (TWI) or human engineering activity nuclear density, and the natural break method was still used to classify the superimposed calculated values into four levels, which correspond to low hazard zone, medium hazard zone, high hazard zone and very high hazard zone, forming a rainfall-induced landslide hazard evaluation map and a human engineering activity-induced landslide hazard evaluation map for the Datong mining area, as shown in Figure 12.
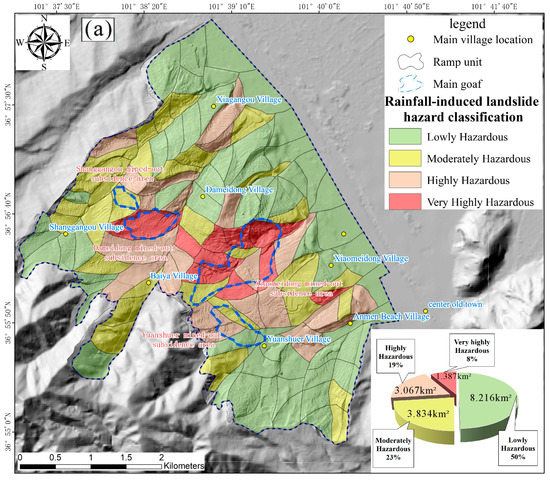
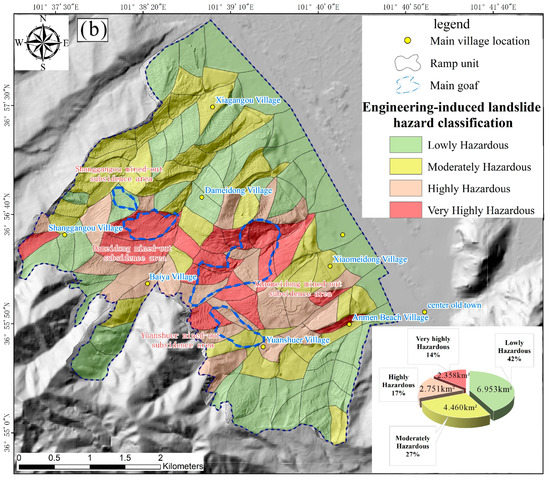
Figure 12.
Hazard evaluation zoning map of the Datong mining area: (a) hazard evaluation map of rain-induced landslides, and (b) hazard evaluation map of human engineering activity-induced landslides.
4.4. Risk Evaluation
4.4.1. Selection and Quantification of Vulnerability Evaluation Indexes
In order to establish an index system for evaluating the vulnerability to landslides in the study area, this study comprehensively analyzed all relevant data, such as the basic characteristics of landslides and their bearers in the Datong mining area. There are no other commercial and economic activities in the study area, except for mining activities that have ceased since 2012; thus, the vulnerability evaluation indicators were mainly divided into population vulnerability (C1) and material vulnerability (C2). Population vulnerability is measured via two indicators: population density and age structure. Material vulnerability indicators include housing value and road value. The specific data sources and classification basis are shown in Table 7.

Table 7.
Vulnerability evaluation factors and classification for the Datong mining area.
- Population vulnerability
Population factors are not only considered to be complex (population density, age structure, etc.), but also the value of human life cannot be directly measured in terms of money [36], so it is difficult to quantify population vulnerability.
There is no significant difference in education level among the different districts in the study area. This study selected population density (C11) and age structure (C12) to measure population vulnerability. In this study, the streets of the study area were selected as the unit; a higher value of population density in the evaluation unit indicates that the population is more concentrated and distributed in the area, and the population is also more vulnerable to landslides (as shown in Figure 13a). The age structure of the population is an important factor to determine the vulnerability of the population, with the elderly and children being significantly less able to cope with disasters than younger people. Population vulnerability is, therefore, positively correlated with the proportion of elderly and children, with the elderly being the population aged 65 years and over and children being the population under 14 years.
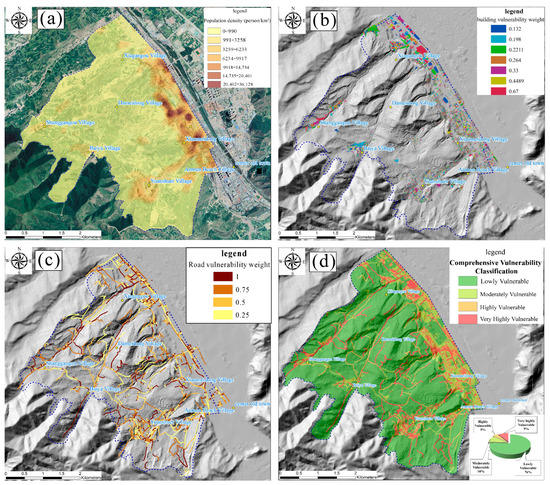
Figure 13.
Vulnerability factors and combined vulnerability results for the Datong mine site: (a) shows the distribution of population density; (b) shows the distribution of building weights; (c) shows the distribution of road weights; and (d) shows the distribution of combined vulnerability.
A population vulnerability model was developed for the study area by combining data from the official website of the Datong Hui Tujia Autonomous Prefecture and the latest census results. The relationship between population vulnerability (C1), population density (C11), and age structure of the population (C12) in the study area is shown in Equation (7):
where are the primary and secondary standardized values for the population density indicator, respectively, and and are the primary and secondary standardized values for the age structure indicator, respectively.
- 2.
- Material vulnerability
Material vulnerability is a major component of vulnerability assessment that is difficulty to assess in the study area. On the one hand, the frequent human engineering activities and the high level of material production in the study area have resulted in a large number of elements and types for use in material vulnerability assessment. Roads and some buildings are difficult to identify completely and accurately by means of on-site surveys and satellite optical remote sensing. Therefore, it is necessary to make full use of digital orthophotography and UAV imagery to generate 3D realistic models through SfM for material vulnerability surveys in mountainous areas. In this study, two factors, buildings (C21) and roads (C22), were considered to measure material vulnerability. For buildings, it has been found in previous studies that the vulnerability of houses is related to the likelihood of damage to houses and the value of houses. This study, therefore, focused on measuring the vulnerability of houses based on both the number of stories and the use of houses.
Based on the refined feature characteristics and information from the tilt photography 3D real-world model and digital orthophoto maps, the final material vulnerability evaluation model was built on this basis of Equation (8). The building and road distribution weights are shown in Figure 13b,c.
In this equation, are the primary and secondary normalized values for the building indicator, respectively, and and are the primary and secondary normalized values for the road indicator, respectively.
After obtaining the and vulnerability evaluation indicators, it is also necessary to determine the weight of each indicator. Since the vulnerability of the study area mainly expresses the size of the disaster-bearing capacity of different buildings and population structures, the weight indicators cannot be determined through the landslide distribution characteristics; here, we used the hierarchical analysis method to superimpose different vulnerability impact factors according to the corresponding weights, and the indicators of population vulnerability (C1) and material vulnerability (C2) were scored by experts. Considering the frequent geological activities of underground mining in the past, the main functions and positioning of the city should be in the field of mining and agriculture, and the development of these industries mainly depends on human labor; therefore, population vulnerability should be placed as being the most important, followed by urban housing and roads which are directly related to human survival, so material vulnerability is second in importance. The weights of the above indicators were obtained using the judgment matrix and hierarchical analysis. The results show that λmax = 4.0103 and CR = 0.0038 < 0.1, satisfying the consistency test results (Table 8).

Table 8.
AHP judgment matrix for the vulnerability evaluation factors.
The combined susceptibility results were then normalized, and then the combined susceptibility values were classified into four levels of low, medium, high and very high according to Table 9, the results of which are shown in Figure 13d.

Table 9.
Values for vulnerability of load-bearing bodies at different hazard levels.
4.4.2. Evaluation Results
In accordance with the calculation method in Table 3, the risk evaluation results derived from the previous analyses were used to perform matrix-superimposed risk calculations according to the vulnerability risk levels, using the raster function in the ArcGIS toolbox; the risk evaluation results, which correspond to low risk, medium risk, high risk, and very high risk zones, are differentiated by different colors for rainfall and human engineering activity-induced landslide hazard risk zoning, as shown in Figure 14.
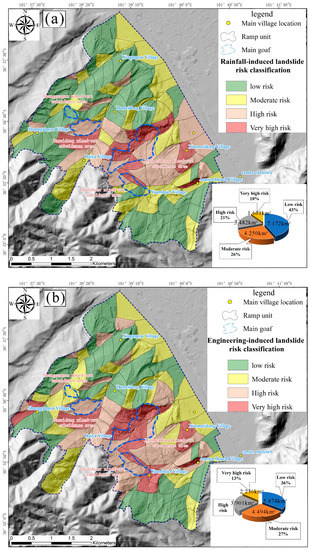
Figure 14.
Risk evaluation zoning map of the Datong mining area: (a) risk zoning of rain-induced landslides, and (b) risk zoning of human engineering activity-induced landslides.
5. Discussion
In this study, by analyzing the correlation characteristics between different disaster-causing factors and landslide elements, a probability calculation method for landslide area susceptibility is proposed, combining the evidence weighting method and GIS. The hazard of landslide occurrence in the study area is quantified by combining the TWI and the intensity of human engineering activities. Finally, a landslide hazard map is overlaid on the landslide vulnerability map to produce a landslide risk map.
The extremely high risk of landslides induced by rainfall and human engineering disturbances mainly occurs near the underground goaf of Yuanshuer Coal Mine, Dameidong Coal Mine, and Xiaomeidong Coal Mine. The main reason is that the mountain is strongly influenced by human engineering activities, and underground engineering mining damage leads to loose, broken, and deformed rock and soil on the slope. The terrain depression in this area is a typical gully catchment terrain, and low-lying areas such as catchment valleys are prone to water accumulation. Under the action of rainfall, the groundwater level rises, increasing pore water pressure, softening sliding surfaces and cracks, and damaging the stability of rock and soil. So much so that near the goaf, especially in high and steep valley terrain, it is the main area with extremely high susceptibility and danger of landslide disasters. Due to this fact, together with the high vulnerability of population and buildings, the risk of landslides near densely populated villages is concentrated.
The selection of evaluation models and indicators is crucial for the risk assessment of geological disasters. The geological environment of mining geological disasters is variable, and the disaster mechanism is complex. The risk assessment methods for mining geological disasters are still in the exploratory stage. Landslides are often difficult to predict due to the specificity of engineering conditions in high-cold mining areas, although landslide risk can be systematically assessed and managed through a risk evaluation model, as constructed in this study. This article adopts the evaluation method of evidence weight, selecting 12 influencing factors for susceptibility and two dynamic evaluation factors for hazard. In particular, we considered InSAR deformation rate in the susceptibility assessment factors. Due to the small overall scope of the study area, the TWI was used as a hazard assessment indicator for rainfall.
We use the occurrence rate of disasters as an indicator to measure the relative probability of disaster occurrence among different levels of impact factors, especially terrain factors such as slope and elevation, which have a significant control effect on the occurrence of landslide disasters. For example, landslide disasters are generally located in the elevation range of 2500–2750 m, mainly due to the intensive human engineering activities and sparse vegetation within this range, leading to serious land damage and difficulty in restoration. Landslides often occur on slopes with a gradient greater than 45°. The shear stress generated by high slope degree increases the probability of landslides. The higher the slope is, the more the stress also increases. The occurrence rate of disasters is the highest (4.571), accounting for 34.7% of the total occurrence rate of different slope grades.
We use two indicators, namely the excavation distance of mining tunnels and engineering control measures, to measure the promotion and suppression effect of human engineering activities on landslide occurrence. The results show that landslide disasters mainly occur within a range of 20 m from the underground goaf. The main reason is that a large amount of coal gangue piles are piled up near the goaf, and these loose waste piles provide a rich source of material for landslide occurrence. From the perspective of engineering treatment measures, slope cutting support ensures the stability of the slope. All landslides in the study area occur on manually excavated and unsupported slopes, accounting for 84.9% of the total occurrence rate of different treatment measures.
Our results indicate that in high-cold mining areas, terrain conditions and human engineering activities have a significant impact on the susceptibility of landslides. Through sensitivity subject curve (ROC) testing, the AUC of the evaluation model proposed in this study is 0.863. According to the experimental schemes of different researchers, the AUC of landslide susceptibility evaluation models is generally around 0.7–0.91 [12,37,38,39,40]. The accuracy of the predictive model is classified into five categories, and a value above 0.7 indicates that the predictive model is good [41]. It must be admitted that there are differences between AUC values, which are mainly due to three reasons: one is that the data quality of the inventory is not very high, one is the insufficient sample size, and the other is the limitations of the method. It was found that the weight-of-evidence method has high evaluation accuracy and a good effect in evaluating the susceptibility of landslides in high-cold mining areas, is a well-trained model.
Hazard and risk mapping are the end product of landslide mapping and the basis for decision making by managers. These results can be used as basic data to assist in slope management and land-use planning. The research area has undergone a governance process from 2012 to 2015, but there are still problems such as geological disasters and ecological environment damage within the area. The next step will be to conduct a dynamic risk assessment of the area based on changes in terrain lines and deformation data obtained from InSAR. In addition, we will continue to study the specificity of high-cold mining areas in terms of risk assessment and disaster mechanisms.
6. Conclusions
This article takes the Datong mining area in Qinghai Province as the research object, and uses GIS technology to divide the risk level of landslide disasters in the mining area from four aspects: susceptibility, hazard, vulnerability, and risk. The main conclusions are as follows:
The extremely high and high-risk areas are mainly distributed near the main underground goaf centered around Yuanshuer Village, Dameidong Village, and Xiaomeidong Village. The extremely high-hazard areas induced by rainfall account for 8% of the total area, and the extremely high-risk areas account for 10% of the total area; The extremely high-hazard areas induced by human engineering activities account for 14% of the total area, and the extremely high-risk areas account for 13% of the total area. There is a good correspondence between the risk assessment results and the actual investigation results, the area of the extremely high-risk area is large, and relevant prevention and control measures need to be taken immediately.
The landslide risk assessment mapping model constructed in this study can effectively evaluate the probability of slope instability caused by rainfall and human engineering activities, providing a comprehensive landslide risk assessment mapping for high-cold mining areas, and is more suitable for landslide risk assessment in high-cold mining areas under multiple factors. The methods used in this study are also applicable for general site planning and evaluation purposes; however, due to the widespread presence of local geological and geographical heterogeneity, they may be less useful on a specific site scale. In order to make the model more widely applicable, more and accurate landslide data are needed.
Author Contributions
H.Y. performed the study and wrote the paper; Q.W. conceived and designed the study; J.D. and F.X. provided guidance to the study; Q.Z. tidied up the data. All authors have read and agreed to the published version of the manuscript.
Funding
This work was financially supported by the Regional Innovation Cooperation Programs of Sichuan Province (Grant No. 2021YFQ0050), the Opening Fund of the State Key Laboratory of Geohazard Prevention and Geoenvironment Protection (Chengdu University of Technology) (Grant No. SKLGP2022K019), and the National Natural Science Foundation of China (Grant No. 41977255).
Institutional Review Board Statement
Not applicable.
Informed Consent Statement
Not applicable.
Data Availability Statement
Not applicable.
Conflicts of Interest
The authors declare no conflict of interest.
References
- Li, Y.; Jia, Z.; Sun, Q.; Zhan, J.; Yang, Y.; Wang, D. Ecological restoration alters microbial communities in mine tailings profiles. Sci. Rep. 2016, 6, 25193. [Google Scholar] [CrossRef]
- Lv, L.; Yu, D. Distribution Characteristics of Geological Disasters and Main Control Measures in Shandong Province. IOP Conf. Ser. Earth Environ. Sci. 2021, 692, 042084. [Google Scholar] [CrossRef]
- Shao, L. Geological disaster prevention and control and resource protection in mineral resource exploitation region. Int. J. Low Carbon Technol. 2019, 14, 142–146. [Google Scholar] [CrossRef]
- You, J.; Qin, X.; Ranjitkar, S.; Lougheed, S.C.; Wang, M.; Zhou, W.; Ouyang, D.; Zhou, Y.; Xu, J.; Zhang, W.; et al. Response to climate change of montane herbaceous plants in the genus Rhodiola predicted by ecological niche modelling. Sci. Rep. 2018, 8, 5879. [Google Scholar] [CrossRef]
- Wang, J.; Liang, S.; Shi, P. Natural Resources and Energy. In The Geography of Contemporary China; Springer International Publishing: Cham, Switzerland, 2022; pp. 153–181. [Google Scholar]
- Qian, D.; Yan, C.; Xing, Z.; Xiu, L. Monitoring coal mine changes and their impact on landscape patterns in an alpine region: A case study of the Muli coal mine in the Qinghai-Tibet Plateau. Environ. Monit. Assess. 2017, 189, 559. [Google Scholar] [CrossRef]
- Varnes, D.J. Landslide Hazard Zonation: A Review of Principles and Practice; The National Academies of Sciences, Engineering, and Medicine: Washington, DA, USA, 1984. [Google Scholar]
- Wilhite, D.A. Drought as a natural hazard: Concepts and definitions. In Drought: A Global Assessment; Routledge: London, UK, 2000; Volume 1, pp. 3–18. [Google Scholar]
- Anbalagan, R.; Singh, B. Landslide hazard and risk assessment mapping of mountainous terrains—A case study from Kumaun Himalaya, India. Eng. Geol. 1996, 43, 237–246. [Google Scholar] [CrossRef]
- Lee, C.F.; Li, J.; Xu, Z.W.; Dai, F.C. Assessment of landslide susceptibility on the natural terrain of Lantau Island, Hong Kong. Environ. Geol. 2001, 40, 381–391. [Google Scholar] [CrossRef]
- Martha, T.R.; van Westen, C.J.; Kerle, N.; Jetten, V.; Kumar, K.V. Landslide hazard and risk assessment using semi-automatically created landslide inventories. Geomorphology 2013, 184, 139–150. [Google Scholar] [CrossRef]
- Shu, H.; Guo, Z.; Qi, S.; Song, D.; Pourghasemi, H.R.; Ma, J. Integrating Landslide Typology with Weighted Frequency Ratio Model for Landslide Susceptibility Mapping: A Case Study from Lanzhou City of Northwestern China. Remote Sens. 2021, 13, 3623. [Google Scholar] [CrossRef]
- Chen, Z.; Song, D.; Juliev, M.; Pourghasemi, H.R. Landslide susceptibility mapping using statistical bivariate models and their hybrid with normalized spatial-correlated scale index and weighted calibrated landslide potential model. Environ. Earth Sci. 2021, 80, 324. [Google Scholar] [CrossRef]
- Rafiei Sardooi, E.; Azareh, A.; Mesbahzadeh, T.; Sardoo, F.S.; Parteli, E.J.R.; Pradhan, B. A hybrid model using data mining and multi-criteria decision-making methods for landslide risk mapping at Golestan Province, Iran. Environ. Earth Sci. 2021, 80, 487. [Google Scholar] [CrossRef]
- Duzgun, H.S.B.; Einstein, H.H. Assessment and management of roof fall risks in underground coal mines. Saf. Sci. 2004, 42, 23–41. [Google Scholar] [CrossRef]
- Palei, S.K.; Das, S.K. Logistic regression model for prediction of roof fall risks in bord and pillar workings in coal mines: An approach. Saf. Sci. 2009, 47, 88–96. [Google Scholar] [CrossRef]
- Su, Q.; Zhang, J.; Zhao, S.; Wang, L.; Liu, J.; Guo, J. Comparative assessment of three nonlinear approaches for landslide susceptibility mapping in a coal mine area. ISPRS Int. J. Geo Inf. 2017, 6, 228. [Google Scholar] [CrossRef]
- Arca, D.; Kutoğlu, H.Ş.; Becek, K. Landslide susceptibility mapping in an area of underground mining using the multicriteria decision analysis method. Environ. Monit. Assess. 2018, 190, 725. [Google Scholar] [CrossRef] [PubMed]
- Fang, H.; Shao, Y.; Xie, C.; Tian, B.; Shen, C.; Zhu, Y.; Guo, Y.; Yang, Y.; Chen, G.; Zhang, M. A New Approach to Spatial Landslide Susceptibility Prediction in Karst Mining Areas Based on Explainable Artificial Intelligence. Sustainability 2023, 15, 3094. [Google Scholar] [CrossRef]
- Chang, M.; Dou, X.; Tang, L.; Xu, H. Risk assessment of multi-disaster in Mining Area of Guizhou, China. Int. J. Disaster Risk Reduct. 2022, 78, 103128. [Google Scholar] [CrossRef]
- Zhang, Y.; Yang, Y.; Zhang, J.; Wang, Y. Sensitivity study of multi-field information maps of typical landslides in mining areas based on transfer learning. Front. Earth Sci. 2023, 11, 1105985. [Google Scholar] [CrossRef]
- Zhang, R.; Wu, S.; Xie, C.; Chen, Q. Risk Monitoring Level of Stope Slopes and Landslides in High-Altitude and Cold Mines. Sustainability 2022, 14, 7581. [Google Scholar] [CrossRef]
- Shi, Y. Rebirth after Exhaustion—Summary of Datong Coal Mine Geological Environment Control Demonstration Project in Xining City, Qinghai Province. Qinghai Land Resour. Strategy 2012, 2, 21–25. [Google Scholar]
- Dai, F.C.; Lee, C.F.; Ngai, Y.Y. Landslide risk assessment and management: An overview. Eng. Geol. 2002, 64, 65–87. [Google Scholar] [CrossRef]
- Lee, H.G.; Kim, G.H. Landslide risk assessment in Inje using logistic regression model. J. Korean Soc. Surv. Geod. Photogramm. Cartogr. 2012, 30, 313–321. [Google Scholar] [CrossRef]
- Wang, Y.; Wen, H.; Sun, D.; Li, Y. Quantitative assessment of landslide risk based on susceptibility mapping using random forest and GeoDetector. Remote Sens. 2021, 13, 2625. [Google Scholar] [CrossRef]
- Agterberg, F.P.; Bonham-Carter, G.F.; Cheng, Q.; Wright, D.F. Weights of evidence modeling and weighted logistic regression for mineral potential mapping. Comput. Geol. 1993, 25, 13–32. [Google Scholar]
- Lee, S.; Choi, J. Landslide susceptibility mapping using GIS and the weight-of-evidence model. Int. J. Geogr. Inf. Sci. 2004, 18, 789–814. [Google Scholar] [CrossRef]
- Yu, S.; Hou, J.; Lv, J.; Ba, G. Economic benefit assessment of the geo-hazard monitoring and warning engineering system in the Three Gorges Reservoir area: A case study of the landslide in Zigui. Nat. Hazards 2015, 75, 219–231. [Google Scholar] [CrossRef]
- Ahlgren, P.; Jarneving, B.; Rousseau, R. Requirements for a cocitation similarity measure, with special reference to Pearson’s correlation coefficient. J. Am. Soc. Inf. Sci. Technol. 2003, 54, 550–560. [Google Scholar] [CrossRef]
- Hajian-Tilaki, K. Receiver operating characteristic (ROC) curve analysis for medical diagnostic test evaluation. Casp. J. Intern. Med. 2013, 4, 627. [Google Scholar]
- Huang, F.; Chen, J.; Liu, W.; Huang, J.; Hong, H.; Chen, W. Regional rainfall-induced landslide hazard warning based on landslide susceptibility mapping and a critical rainfall threshold. Geomorphology 2022, 408, 108236. [Google Scholar] [CrossRef]
- Ma, J.; Tang, H.; Hu, X.; Bobet, A.; Zhang, M.; Zhu, T.; Song, Y.; Eldin, M.A.M.E. Identification of causal factors for the Majiagou landslide using modern data mining methods. Landslides 2017, 14, 311–322. [Google Scholar] [CrossRef]
- Sörensen, R.; Zinko, U.; Seibert, J. On the calculation of the topographic wetness index: Evaluation of different methods based on field observations. Hydrol. Earth Syst. Sci. 2006, 10, 101–112. [Google Scholar] [CrossRef]
- Gutiérrez, F.; Parise, M.; De Waele, J.; Jourde, H. A review on natural and human-induced geohazards and impacts in karst. Earth Sci. Rev. 2014, 138, 61–88. [Google Scholar] [CrossRef]
- Deevey, E.S., Jr. Life Tables for natural populations of animals. Q. Rev. Biol. 1947, 22, 283–314. [Google Scholar] [CrossRef]
- Camilo, D.C.; Lombardo, L.; Mai, P.M.; Dou, J.; Huser, R. Handling high predictor dimensionality in slope-unit-based landslide susceptibility models through LASSO-penalized Generalized Linear Model. Environ. Model. Softw. 2017, 97, 145–156. [Google Scholar] [CrossRef]
- Roccati, A.; Paliaga, G.; Luino, F.; Faccini, F.; Turconi, L. Gis-based landslide susceptibility mapping for land use planning and risk assessment. Land 2021, 10, 162. [Google Scholar] [CrossRef]
- Ge, R.; Lv, Y.; Tao, W. A Statistical Prediction Model for Healthcare and Landslide Sensitivity Evaluation in Coal Mining Subsidence Area. Comput. Intell. Neurosci. 2022, 2022, 1805689. [Google Scholar] [CrossRef] [PubMed]
- Zhuo, L.; Huang, Y.; Zheng, J.; Cao, J.; Guo, D. Landslide Susceptibility Mapping in Guangdong Province, China, Using Random Forest Model and Considering Sample Type and Balance. Sustainability 2023, 15, 9024. [Google Scholar] [CrossRef]
- Swets, J.A. Measuring the accuracy of diagnostic systems. Science 1988, 240, 1285–1293. [Google Scholar] [CrossRef]
Disclaimer/Publisher’s Note: The statements, opinions and data contained in all publications are solely those of the individual author(s) and contributor(s) and not of MDPI and/or the editor(s). MDPI and/or the editor(s) disclaim responsibility for any injury to people or property resulting from any ideas, methods, instructions or products referred to in the content. |
© 2023 by the authors. Licensee MDPI, Basel, Switzerland. This article is an open access article distributed under the terms and conditions of the Creative Commons Attribution (CC BY) license (https://creativecommons.org/licenses/by/4.0/).