1. Introduction
Over the years, the increasing global population and urbanization have fueled an exceptional demand for low-carbon energy infrastructure, metal supplies, and minerals. This demand has led to enormous pressure on land-based deposits, the source of mineral exploitation for centuries. Due to this pressure and the insatiable demand of humans, the quality of land-based ore has deteriorated over the years, and mining these ores has become unsustainable [
1]. With these limitations, attention has been focused on exploring sea-based minerals.
The oceans have a rich mix of natural resources comprising different species, flora, and fauna, and they are a significant food source for humanity. According to [
2], the seabed has a large abundance of richer mineral reserves than land-based ones. These reserves include a variety of fuel and nonfuel minerals that can be used to produce new technologies.
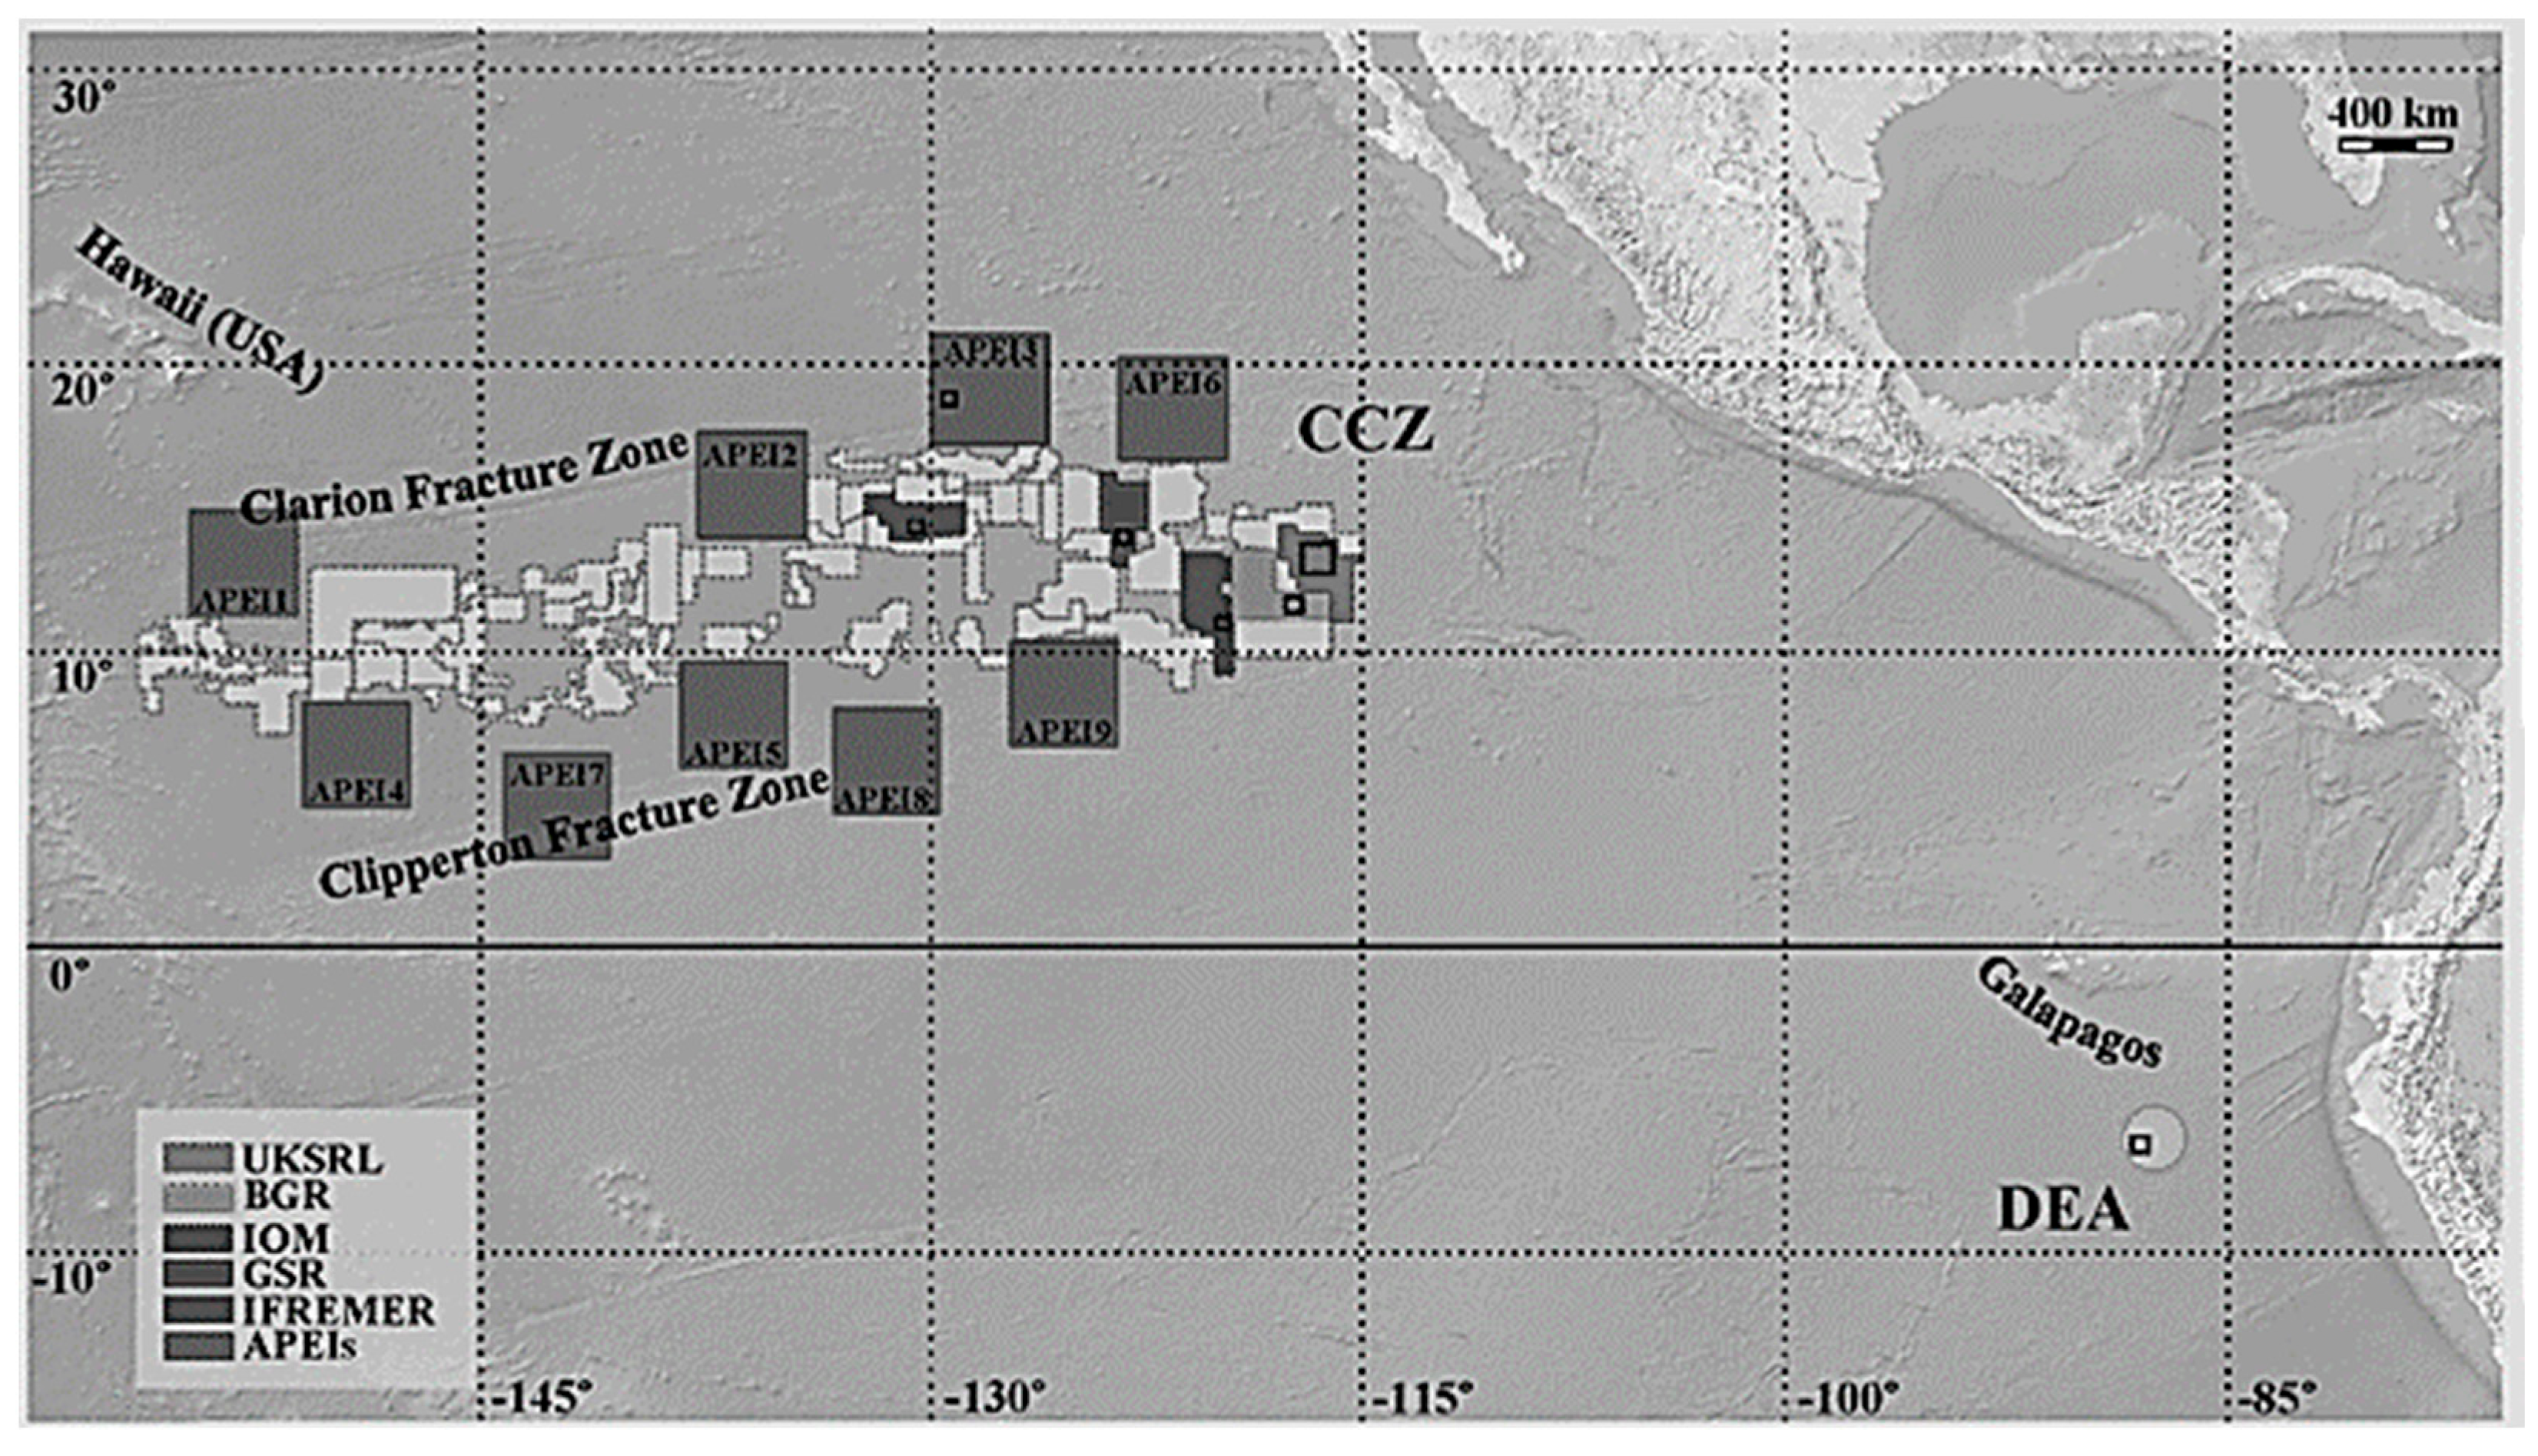
Industry and researchers have a good understanding of potential commercially viable locations for further exploration. One such location is the Clarion Clipperton Fracture Zone (CCFZ) in the North Pacific Ocean (
Figure 1). However, significant knowledge gaps exist regarding these nodules’ sustainable exploration, recovery, and transportation. These knowledge gaps can be classified into four main aspects, including the technical, environmental, economic, and logistical aspects [
2]. The technical aspect focuses on the technological requirements needed to recover the nodules from the seabed successfully. Some advanced studies have been conducted to address the knowledge gap related to these technical constraints [
2,
3,
4,
5,
6,
7,
8,
9,
10].
Similarly, the environmental aspect focuses on the impact of the exploration and recovery process on the marine environment, which has also been extensively researched in the literature [
2,
5,
6,
7,
12,
13,
14,
15,
16,
17,
18,
19,
20,
21,
22,
23] to address some of the challenges in this area. Meanwhile, the economic aspect focuses on the business models and the viability of the nodules for commercial purposes. To tackle the gaps in this domain, research has been conducted on technoeconomic assessments, economic challenges and implications, feasibility factors, and future economic considerations [
1,
2,
5,
6,
7,
13].
Finally, the logistical domain of sustainable transportation of these nodules focuses on the logistics involved in first recovering the nodules from the seabed, dewatering and storing these nodules on the production-support vessels, and the transshipment of these nodules from the offshore production site to the onshore location for further processing. This domain has, however, received less attention from the literature, with a few research only focusing on the logistical analysis from the seabed to the production-support vessel. The existing research in this domain primarily focus on the logistical challenges and operational strategies [
2] and are, thus, lacking indepth insight into the logistical and cost models and parameters that must be considered to achieve an efficient and effective transshipment and storage of these nodules.
Consequently, despite extensive research on the technological, environmental, and business domains of polymetallic nodules (
Table 1), there is still a knowledge gap on the logistical transshipment of these nodules to onshore locations for further processing. Specifically, limited information exists regarding the logistical requirements for selecting optimal onshore locations and the associated transportation costs. Based on this, there is a knowledge gap in developing optimized logistics and cost models capable of suggesting an efficient onshore location and selecting the optimal vessel size required for completing the transport to this location efficiently and effectively. The current study addresses this gap by developing a generic logistics and cost model infused in a simple multiobjective optimization (MOO) model to determine the optimal onshore location and vessel size, yielding a low transport cost for the transshipment of the polymetallic nodules. This model can serve as a basis for more detailed logistics and cost analyses tailored to specific cases. Specifically, the study focuses on three key issues:
- -
Specifying the logistics objective function for offshore–onshore transportation;
- -
Estimating the impact of this objective function on offshore storage, transport costs, total trips, the required number of vessels, and the required buffer;
- -
Outlining potential implications for organizational business strategies and operations.
This MOO logistics and cost model relies on the interaction between different dependencies based on different operational offshore and onshore profiles. To specify these profiles, it is essential to understand the fundamental processes involved in the recovery, storage, and transshipment of polymetallic nodules.
This simplified process is presented in
Figure 2, where the nodules are first recovered from the seabed. Afterward, the nodules are transported to the production-support vessel through a flexible riser. Here, the first dewatering stage is carried out, where some water content is removed from the nodules. After this first stage of dewatering, the nodules are then temporarily stored on the production-support vessels, pending when they would be transferred to a shuttle barge/bulk carrier that then transports them to an onshore processing location for further processing and market distribution.
In line with this, the rest of this paper is structured as follows: The case description is provided in
Section 2, while
Section 3 presents the MOO model.
Section 4 elaborates on the logistics and cost models. In
Section 5, the results of the analyses were presented and discussed.
Section 6 then discusses some practical implications and theoretical contributions of the study. Finally, some conclusions were proposed in
Section 7.
2. Case Description
As mentioned, the study focuses on a specific exploration area within the CCFZ zone. The aim is to achieve an annual production, handling, transport, and storage of 2.14 × 10⁶ tonnes of wet polymetallic nodules. Assuming 20 operational hours, and 250 operating days, this amounts to a production rate of 428 Toven-wet per hour and 8560 Toven-wet per day. Four alternative port locations regarding the onshore location have been specified for this study. The locations include Vancouver, Manzanillo, Tianjin, and Bergen. Assuming an average speed of 12 knots, Vancouver, located in Canada, has a distance of 2208 nautical miles (NM from the CCFZ location, thus, a sailing time of 8 days. Manzanillo, located in Mexico, has a distance of 1241 nautical miles and a sailing time of 5 days. Tianjin, located in China, has a distance of 6403 nautical miles and, subsequently, a sailing time of 22 days, while Bergen, located in Norway, has a distance of 7670 nautical miles (passing through Panama Canal) and, thus, a sailing time of about 27 days. It is, however, important to note that the capesize bulkers have restrictions on passing through the Panama Canal. For this vessel classification, the other option is to follow the Cape Horn route. This route is 13,009 nautical miles and would take around 45 days to sail (Searoutes.com). Each location is assumed to have continuous operation and 100% availability. This implies that the ports are available all day, week, and year.
Regarding vessel classification, these are classified according to their deadweight tonnes (DWT). For simplification purposes, the study uses the average of the minimum and maximum DWT of each classification of bulkers displayed in
Table 2. Each bulker classification has different specifications regarding vessel length, width, draught, and the fuel consumption of the main and auxiliary engines, as displayed in
Table 3 (The average fuel consumption of auxiliary engines is estimated to be 10% of the main engine fuel consumption.). These specifications are based on the study of [
25,
26]. For this specialized operation, the bulkers must have enhanced maneuverability capabilities. This implies that there would be higher fuel consumption than specified for the vessels and the operations. To take this into account and due to the limited data on the vessel, a delta was specified within the developed model that accounts for the additional fuel consumption of the operation. This is set to 50% of the initial fuel consumption. This can, however, be adjusted accordingly.
Based on these classifications, the gross tonnage (
GT) can be determined for each of the vessel classifications. This is specified as:
Each vessel classification is assumed to have a continuous operation and 100% availability throughout the year. Furthermore, the bulkers are considered to have a loading ratio of 90% of their respective average DWT. This implies that, for each completed trip, the transport is equal to 90% of the DWT of the respective bulkers.
For offshore cargo handling, it is specified that the bulkers use a conveyor belt. The loading rate of the conveyor belt into the cargo hold depends on the bulkers’ mooring and positioning method (fixed or dynamic). In this study, however, we assume an average loading rate of 1000 wet tonnes per hour into the cargo holds of the bulkers. The cargo discharge rate at the respective onshore location depends on the terminal’s crane-bucket capacity. The study assumes an average discharge rate of 1400 wet tonnes across the terminals at the ports. With these assumptions, the average handling days at sea and the onshore location can be calculated. The parameters of these formulations are presented in
Table 4; hence, this is specified as follows:
Finally, it is specified in the study that the bulkers, on average, spend an extra two days per trip waiting at the port for activities such as bunkering, maintenance, and other administrative duties. They also spend an additional two days waiting time per trip at sea due to unforeseen delays such as bad weather and operational disruptions. Having specified these elements, the total turnaround time can then be formulated. This is specified as:
The other input costs can then be specified based on the total turnaround time (
Table 5). These costs are divided into charter, storage, port, terminal handling, fuel, and other additional costs.
Charter costs are costs associated with renting the bulkers for a specified period. This is based on the daily bulker rate and the Baltic dry index (BDI) rate of the quarterly data between Q1 1999 and Q4 2019 from the data provided by Clarkson Research. However, to consider the additional rate applied to specialized vessels used in this type of operation, a delta rate of 30% was applied to the initial rate to take care of additional costs that might arise.
The storage cost comprises the unit cost of storage per tonne of wet nodules and the value of time of the nodules (the daily loss of capital for storing the nodules pending when they would be transported for further processing). The unit cost of storage is valued at 0.5 EUR/tonne/day, while the value of time is specified in line with the study of [
25] at 0.02 EUR/tonne/day.
For the port cost, several elements are identified. First, the port dues are specified. Port dues are charged per EUR GT of the vessel. The next element is the berthage fee. This fee is charged per EUR hour based on the vessel’s length. The third element is the wharfage fee, which is charged per EUR tonne of dry nodules. Next is the pilotage fee, which is paid for pilotage activities in the port. The final element under port costs is the towage fee. This fee is charged per EUR GT of the vessel, the number of tugboats needed to direct the vessel, and the number of times the tugboat services will be needed per trip (this is based on the entry and exit of the vessels in the port).
The next type of cost is terminal handling costs. Two main elements are considered in this cost: the cost of handling lines and terminal handling. While handling lines (tying up and letting go) are charged per vessel per trip, the cost of terminal handling is charged per EUR tonne. The next cost is fuel cost. This cost is charged per metric tonne of fuel consumed (main and auxiliary) daily at sea and in port. For this cost, the global average bunker price of very low-sulfur oil (VLSFO) is used (shipandbunker.com) to estimate the average fuel price value.
The final cost is the other additional costs that might be incurred in the transportation process. This is especially true for the onshore location (Bergen). The transportation of nodules from the offshore site to this location has to pass through the Panama Canal. In doing this, the canal dues and associated costs have to be paid for the respective bulkers.
3. Multiobjective Optimization Model
In line with the study’s overall objective, which aims to achieve effective and efficient logistical transport, multiple conflicting objectives must be considered simultaneously. A multiobjective optimization (MOO) model is employed to represent these conflicting objectives. This mathematical model provides a comprehensive approach to decision-making by simultaneously considering multiple conflicting objectives. This generates a set of solutions, also known as the Pareto optimal solutions [
27,
28]. These solutions present different options, where improving one objective may result in a tradeoff with another objective [
29,
30,
31]. Contextualizing this to the current study, the optimization model aims to find an optimal tradeoff solution that balances maximizing the number of trips per vessel, minimizing the number of vessels used, minimizing the transportation cost per tonne, and minimizing the temporary storage space required. Based on this, the model’s objective function combines the four identified objectives using weighted coefficients. By assigning weights to each objective, each objective’s relative importance and priority can be reflected, as the weights determine how much emphasis is placed on each objective during the optimization process. In line with this, the MOO function is expressed as:
Here, the objective function represents the weighted sum of the four objectives, where
,
,
, and
are the weights assigned to each objective. The model aims to find the optimal solution that minimizes the overall weighted sum of the objective functions while satisfying several constraints. In order not to restrict the possible results of the model, we have assumed a common weight across all four objectives to ensure that equal importance is given to all four objectives. However, the model has been designed to ensure that specific weight can be assigned to specific objectives depending on the strategy and priority of an organization. Based on this, some of the constraints are expressed as:
The first constraint ensures that the total transportation from all vessels does not exceed the annual production target . This guarantees that the vessels’ combined trips will not exceed the available capacity, considering the target production over a year. The second constraint is the vessel capacity constraint which ensures that the tonnes transported per vessel for each trip must be within the vessel’s capacity . Hence, a vessel cannot transport beyond the specified capacity. The third constraint is the temporary offshore storage space constraint that restricts the amount of temporary storage space required to be within the allowable maximum . This ensures that the temporary storage requirements remain feasible. It should, however, be noted that an infinite allowable maximum storage space has been assumed for this study. This gain gives the model some freedom on the location and vessel combinations that can be used. Here also, a definite number can be set depending on the operational strategy of an organization to restrict the model in the volume of tones that can be temporarily stored offshore. Finally, the non-negativity constraint ensures that the decision variables are non-negative; hence they cannot record negative values.
This simple optimization model is applied to the logistics and cost models presented in
Section 4 and was solved in Python using the pyomo library. This open-source optimization modeling language supports both linear and nonlinear optimization, including MOO. In addition, the programming language allows for a flexible way to formulate the MOO problems and offers different solvers to find solutions.
4. Logistics and Cost Models
The logistics and costs models are developed based on the MOO model. These models ensure that the transport, handling, and storage of the polymetallic nodules from the offshore site to the onshore processing location are assessed from the logistics and cost perspective. While the logistics perspective focuses on the logistical elements needed for the transportation and storage of the nodules, the cost perspective focuses on the associated costs involved in the transportation process. Based on this, two submodels have been developed. The logistics model and the cost model. The parameters and decision variables used in the model are presented in
Table 6.
The logistics model focuses on three elements. These are the total number of trips required for each vessel category to transport the yearly target, the average number of trips per vessel, and the average offshore storage capacity needed to store the nodules pending when they would be transported temporarily. These are mathematically specified as:
where;
The cost model, meanwhile, focuses on four elements. These are charter, port, fuel, and storage costs. A total cost function calculates the total costs per tonne for each port and vessel classification. This is represented as:
Charter costs are costs associated with renting the bulkers for a specified period. As stated earlier, the average daily charter rate was derived from the data from Clarkson’s research. The formula to calculate the charter cost per tonne transported is specified as:
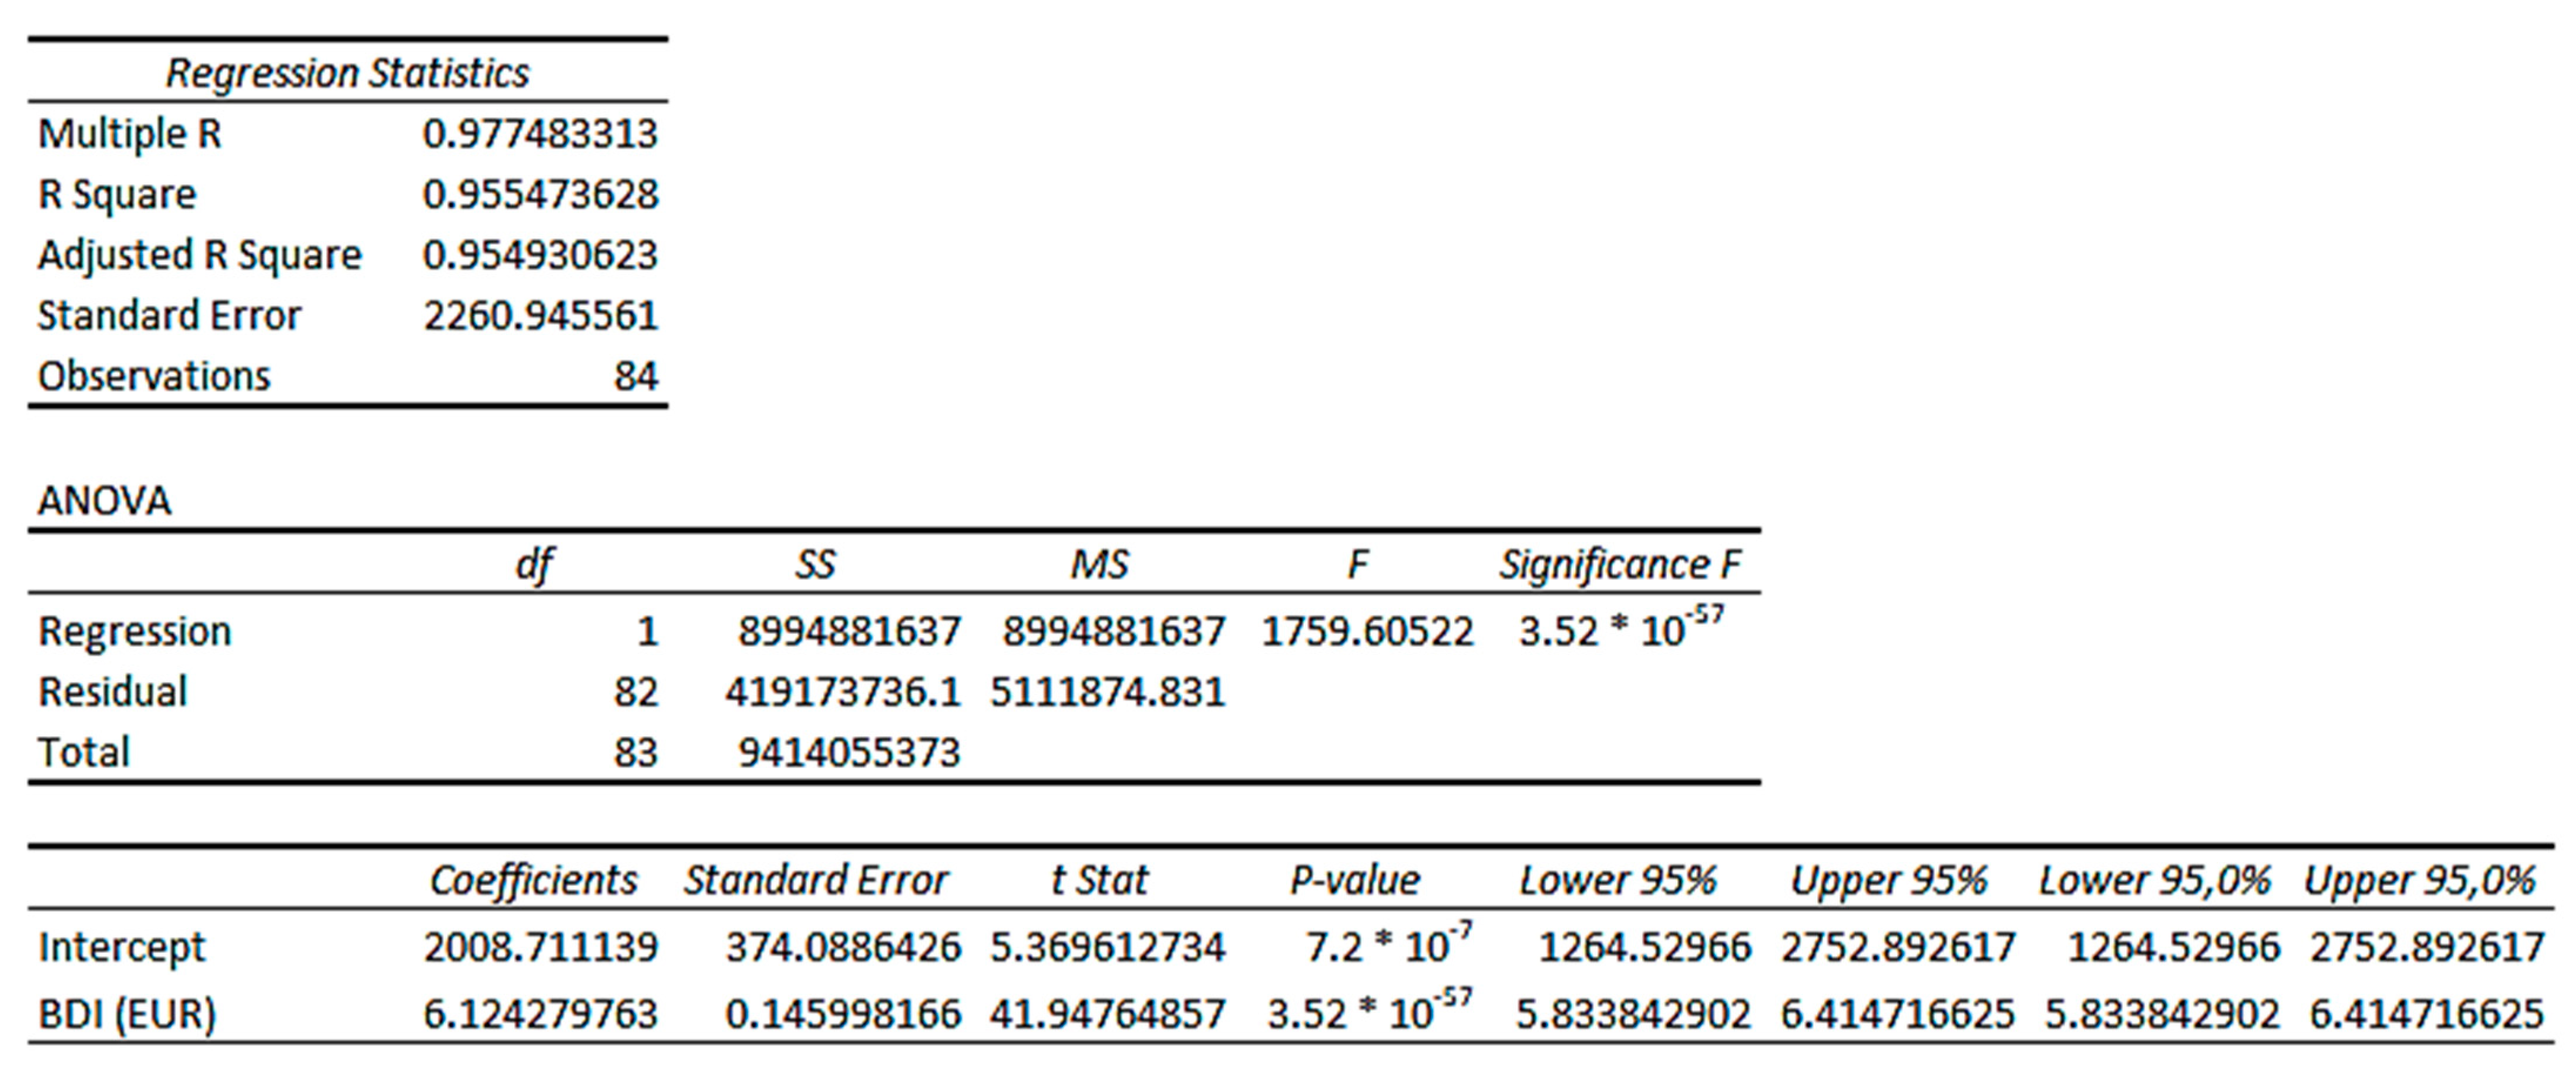
To estimate the future bulker rate, regression analysis (
Appendix B) is conducted on historical data of the bulker rate and Baltic dry index (BDI) rate, where the bulker rate is the dependent variable and the BDI the independent variable. This is used to determine the intercept and slope of BDI, which can then be used to estimate the charter rate (
Figure 3). Clarkson Research Services provides historical data in its quarterly charter rate report (
Appendix A). This study uses the average charter rate of bulkers from quarter one of 1999 to quarter four of 2019. The reason for selecting this period is to level out the economic boom-and-crash cycle for a bulker price.
Furthermore, the bulkers must have enhanced maneuverability capabilities for this specialized operation. This implies increased vessel operational costs. To take this into account, a delta rate of 30% was applied to the charter rate for the additional costs that might be incurred. Hence the equation for this is specified as:
Port costs are costs associated with using the port and third-party-related services in the port. These services include berthing, wharfage, pilotage, towage, terminal handling, and other port facilities. This study uses the port of Vancouver as the benchmark for estimating port costs [
32]. This is due to the data’s consistency, availability, and recency. The port cost per tonne transported is expressed as:
where;
These fees are further explained below:
Port dues: This is the charge levied on vessels for calling at a port. The port dues are charged based on the gross tonnage of the vessel. The formula for this is specified as follows:
Berthage fee: This is the fee charged for the berthing and mooring of a vessel in the port. In this study, the berthage fee is charged based on the overall length per hour the vessel is being moored. This is specified as:
Wharfage fee: This fee is charged to cover the port’s cost of using a wharf to unload and store cargo. This fee is charged per tonne unloaded and stored. The formula for this fee is specified as follows:
Pilotage fee: This is a fee paid for the services of a local pilot to navigate the vessel within the port area. This fee consists of pilot readiness and services. There are two types of pilotage fees specified in this study: the fee for vessels with an overall length of less than 226 m and the fee for vessels with an overall length above 226 m. The formulas for calculating these charges are specified as follows:
Towage fee: This is a fee charged for the services of a tugboat in maneuvering and towing the vessels for berthing and mooring. This fee is set on the gross tonnage and the number of tugboats needed.
Handling lines: This is the fee charged for tying up and letting go of lines by the line crew gang for the mooring and unmooring of vessels. The estimation of this fee is specified as follows:
Terminal handling fee: This fee aggregates costs associated with the terminal’s property and services. This fee is charged per tonne of cargo handled and is specified as follows:
Having specified the port costs, the next element in the total cost is the fuel cost per tonne transported. Fuel cost is the total amount spent on fuel consumption for the main and auxiliary engines. Fuel cost per tonne is specified as:
The global average bunker price of VLSFO is used for the fuel price. The main engine fuel consumption is calculated based on the metric tonne per day consumed for the different vessel classifications specified in
Table 3 of the input parameters, derived from the study of [
26]. Based on the daily consumption levels, the formula for the main engine propulsion for the whole trip can thus be specified as follows:
The auxiliary fuel consumption for this study is calculated based on the average percentage between the minimum and maximum (
Table 3) consumption of the main engine, also derived from the study of [
26]. The formulas for calculating the auxiliary engine fuel consumption at sea and port are specified as:
The last transport cost element is the storage cost per tonne. This deals with the cost of offshore temporary storage of nodules before being transported onshore. This is expressed as:
5. Analysis and Discussion
Based on the identified cases and the developed models, some analyses and iterations were conducted for the logistics and cost components of the cases. Before presenting the analysis, it is important to specify that an input–output method has been adopted for the study. This method is justified as it allows for the comprehensive representation of the interdependencies between the different components of the logistics and transport models [
33,
34,
35]. In doing this, it considers and generalizes various inputs and assumptions, such as the vessels’ sizes, the vessels’ average filling rate, the vessel’s sailing speed, the daily production rate of the nodules, and the annual operational days. All these are assumed based on the information from the literature; thus, the results rely heavily on the input parameters specified.
Nevertheless, this approach allows for systematically analyzing transport flows, costs, and storage capacities. By doing this, it becomes possible to identify opportunities for objective maximization. In line with this, The current section first presents and discusses the key results of the logistics solution, after which the cost implications of the solutions are presented and discussed.
5.1. Logistics Analysis
The result of the logistics analysis for the selected ports and vessel classifications are based on the input parameters specified. Based on the objective function of the MOO model, 16 possible vessel–port combinations can be explored for logistics solutions. Thus,
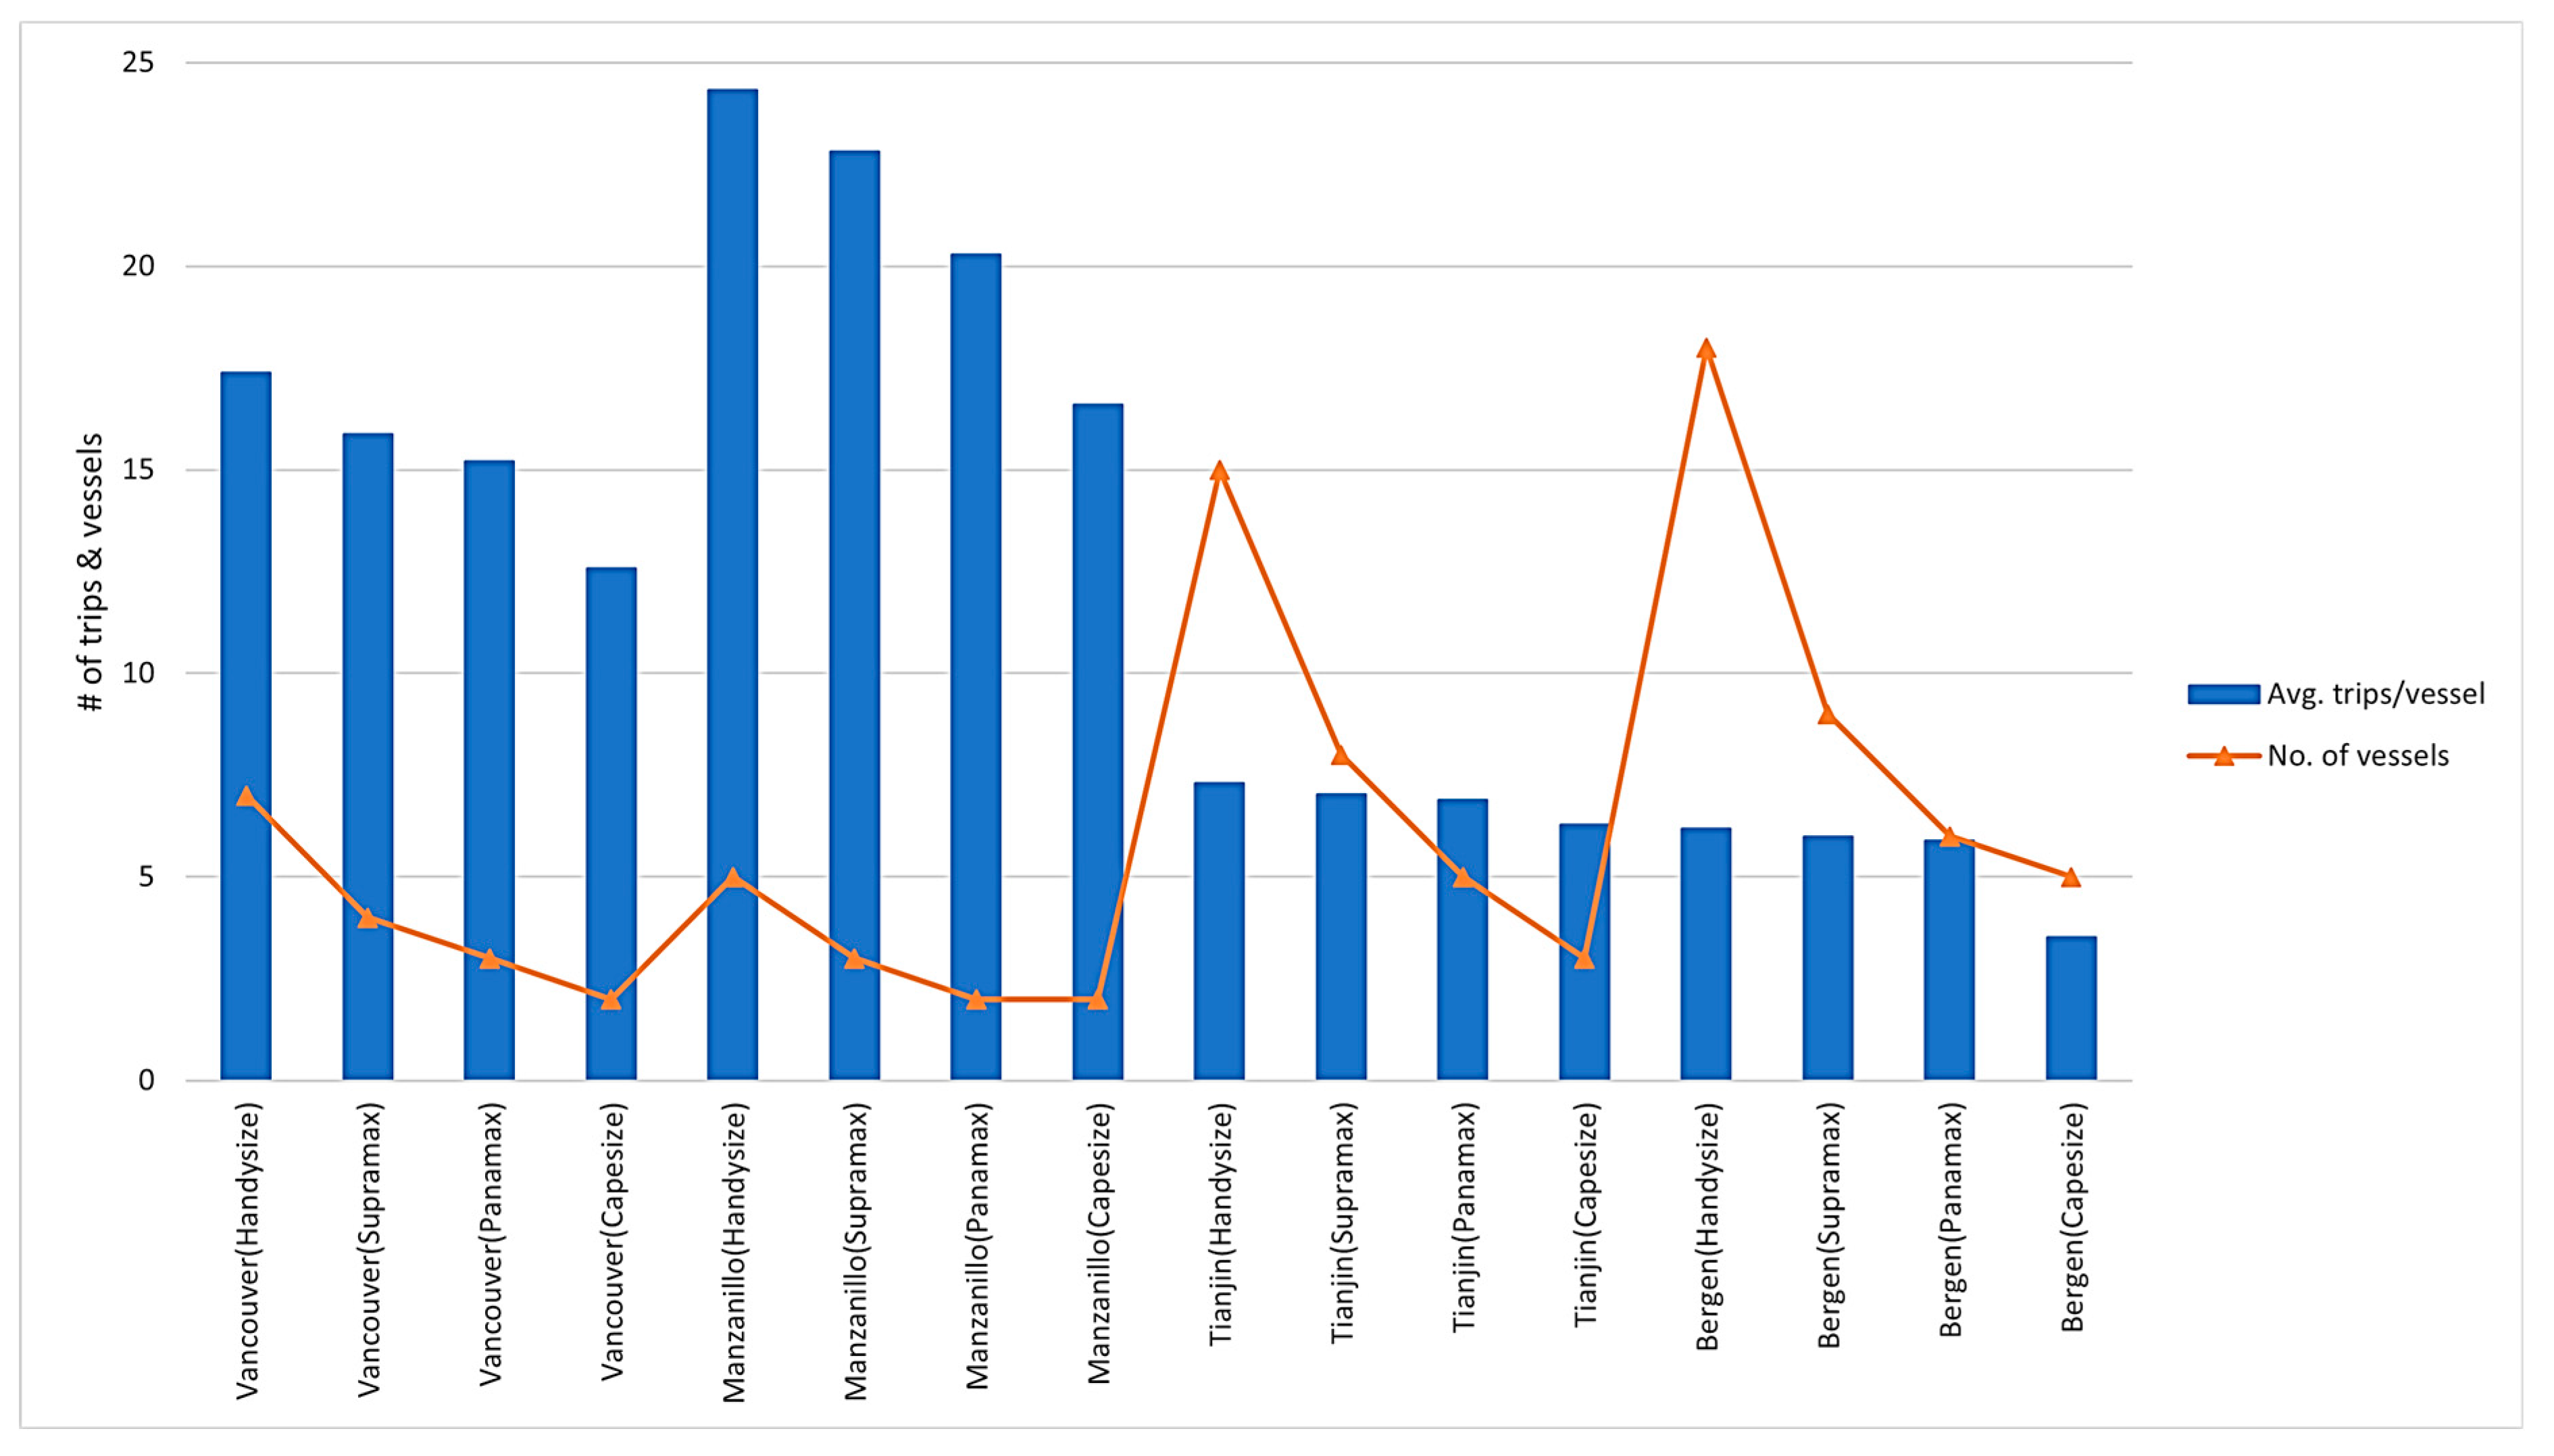
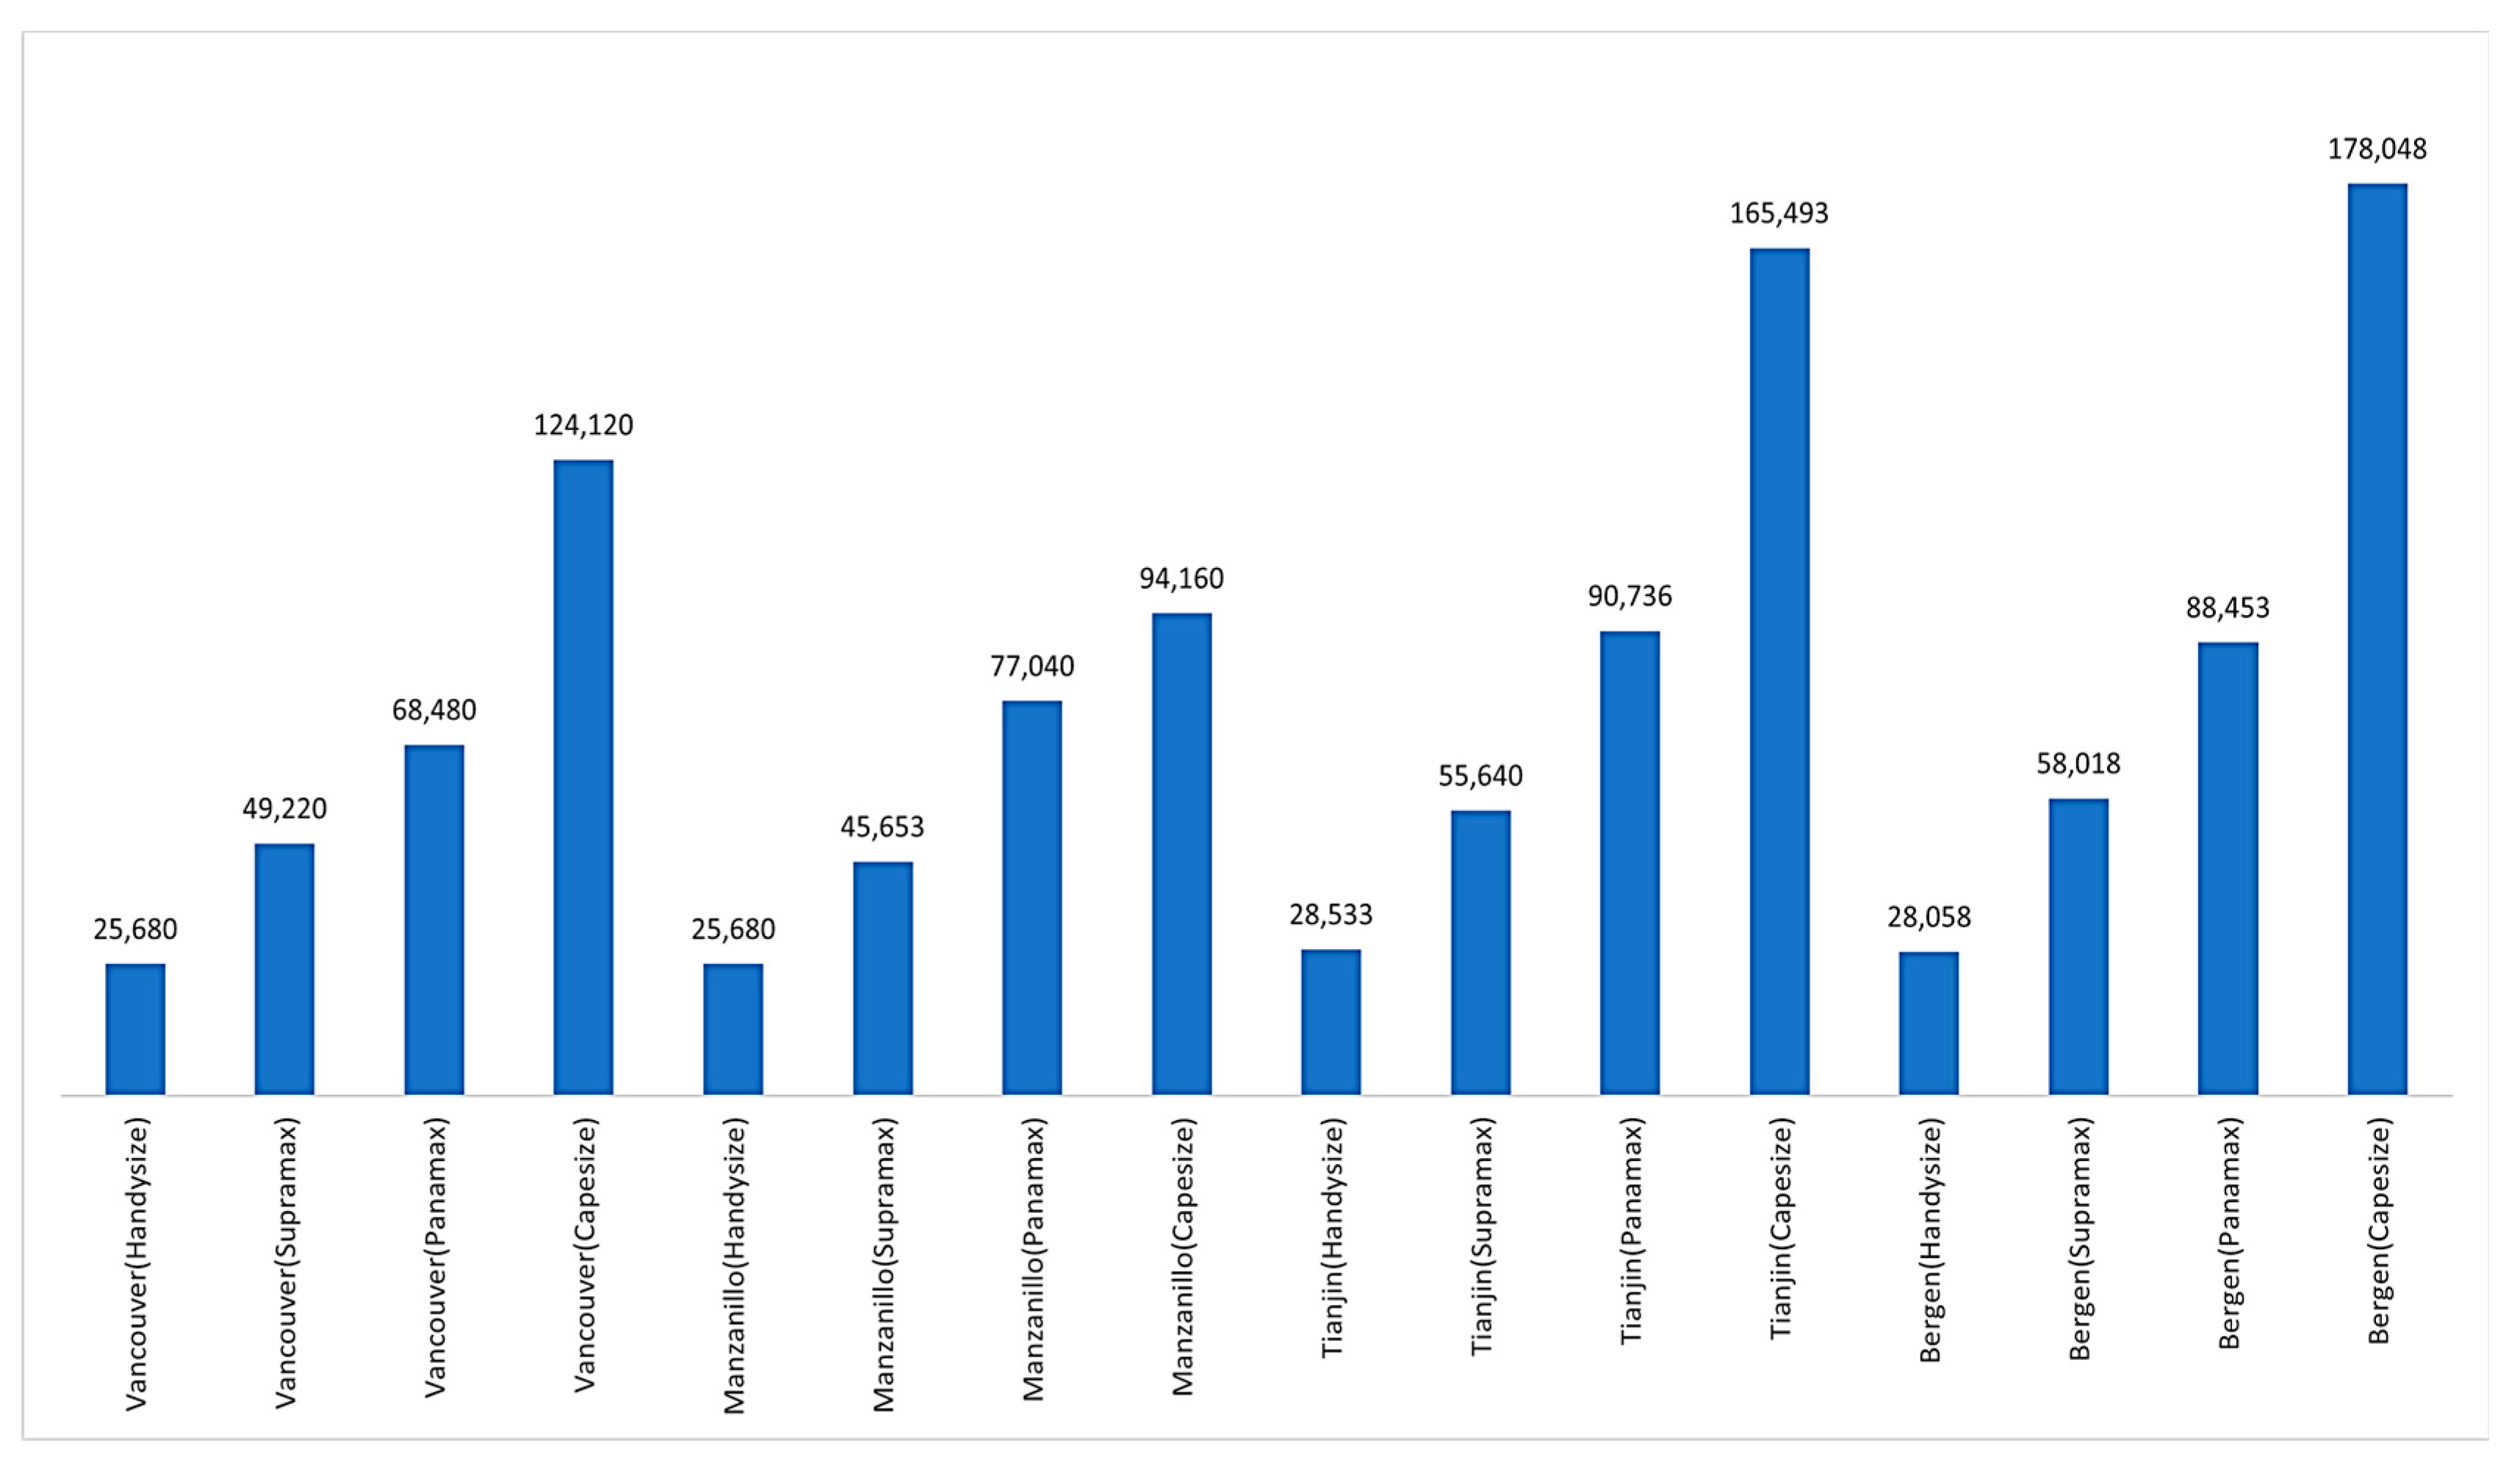
Figure 4 presents the number of vessels and the average number of trips per port–vessel combination. In contrast,
Figure 4 illustrates the temporary floating storage capacity required for each port–vessel combination.
From
Figure 4 and
Figure 5, it is revealed that the Vancouver–Handysize combination would require seven vessels to transport the yearly target of 2.14 × 10
6 T
oven-wet nodules. In doing this, 122 trips would be completed, averaging 17 trips per bulker. This combination will, however, require an average temporary floating storage space of 25,680 tonnes. The second (Vancouver–Supramax) combination would require four vessels, with 63 trips completed, at an average of 16 trips per vessel. For this combination, an average temporary storage space of 49,220 will be required for this operation. The third (Vancouver–Panamax) combination would require three bulkers. In doing this, 46 trips would be completed at an average of 15 trips per vessel. This would, however, require 68,480 tonnes of temporary floating storage space. The fourth (Vancouver–Capesize) combination would be possible with two vessels, totaling 25 trips completed at an average of 13 trips per vessel. However, a large temporary storage space of 124,120 tonnage capacity will be needed for this operation.
The Manzanillo–Handysize combination would require five bulkers with a total of 122 trips at an average of 24 trips per vessel to complete the transport of the yearly target. In doing this, temporary floating storage space with a capacity of 25,680 tonnes would be needed for this combination. The next combination (Manzanillo–Supramax) would require three bulkers with 68 trips, averaging 23 trips per vessel, with an average storage space of 45,653 tonnage capacity.
Manzanillo–Panamax combination would require two vessels, completing a total of 41 trips. This combination will require an average temporary floating storage capacity of 77,040 tonnes. Meanwhile, the Manzanillo–Capesize combination would require two vessels with 33 completed trips and an average storage space of 94,160 tonnage capacity.
The ninth (Tianjin–Handysize) combination would require fifteen bulkers with 110 trips completed at an average of 7 trips per vessel to transport the yearly target. There would, however, be the need to have a temporary floating storage space of 28,533 tonnes for this combination. The next combination (TianjinSupramax) would require eight bulkers to complete 56 trips at an average of 7 trips per vessel and an average storage capacity of 55,640 tonnages. Five vessels would be required to use the Tianjin–Panamax combination, with 34 trips at an average of 5 trips per vessel and a storage space of 90,736 tonnages. Meanwhile, the Tianjin–Capesize combination would require three bulkers with 19 trips, six trips per vessel, and a temporary storage space of 165,493 tonnages.
The thirteenth combination (Bergen–Handysize) would require eighteen vessels to complete 111 trips at an average of 18 trips per vessel and a temporary storage capacity of 28,058 tonnages. The Bergen–Supramax combination would require nine vessels, with 54 completed trips at an average of 6 trips per vessel and a temporary storage capacity of 58,018 tonnages. The next combination (Bergen–Panamax) would require six vessels to complete a total of 35 trips at an average of 6 trips per vessel and a storage capacity of 88,453 tonnages. The final combination would require five vessels with 18 trips completed at an average of 4 trips per vessel and a temporary storage capacity of 178,048 tonnages.
Three main conclusions can be drawn from a logistics analysis. First, based on the input parameters and the assumptions, ports closer to the offshore production site are better placed to achieve the annual logistics target of transporting the nodules. This is because more trips can be completed in this location with a reasonable number of vessels.
Specifically, the logistics analysis reveals that Manzanillo and Vancouver are optimal onshore locations for transporting the nodules. This is due to the proximity of the two ports to the offshore production site, thereby reducing the sailing time and the total turnaround time. With this, more round trips can be completed quickly, reducing the average offshore storage capacity needed for the nodules before transport, especially for the smaller vessels. This conclusion supports the notion that the closer the onshore location to the offshore site, the less complex the logistics and transport would be.
Second, concerning the vessel option, the analysis reveals that from the logistical point of view, Handysize and Supramax vessels are the most optimal for use in this type of operation. This is due to the reduced storage capacity required for these vessel classes.
Finally, the logistics analysis reveals that the farther the port, the higher the number of vessels that would be deployed to achieve the transport of the production target per year. Deploying additional vessels could automatically increase the cost of transportation. Thus, the higher the number of vessels deployed, the higher the running costs (such as charter, fuel, and port costs). With this finding, examining and analyzing the associated transport cost for the number of vessels deployed becomes necessary. This is examined in the cost analysis below.
5.2. Cost Analysis
Figure 6 reveals the ranking values of the location–vessel combinations. As seen in the figure, using the Manzanillo–Panamax combination would yield the lowest transport cost for the yearly nodules target. This combination would yield a total transport cost of EUR 16 per tonne. The charter and storage costs represent the largest share of the total transport cost for this combination, with almost 63%. The next least-cost combination is the Manzanillo–Supramax option. This combination would lead to a cost of EUR 17 per tonne. Here, the charter cost represents the highest cost for this combination, with about 41% of the total cost.
Manzanillo–Handysize occupies the third spot with the lowest transport cost. This combination leads to EUR 19 per tonne, with the charter cost again having the largest share of the cost for this combination. Vancouver–Panamax and Vancouver–Supramax combinations occupy the next two spots with a total transport cost of EUR 21 per tonne each. However, while the Vancouver–Panamax combination would need a total number of four vessels at an average of 63 trips per vessel, the Vancouver–Panamax combination would need a total of three vessels at an average of 46 trips per vessel. As seen in the analysis, the charter and fuel costs take the largest share of the total cost.
The first three combinations are well below the transport cost of EUR 20 per tonne, making them the cheapest among the sixteen combinations. It can be further seen in the figure that there are no representations of Tianjin and Bergen in the first eight options of the least-cost location–vessel combination. This can be attributed to the distance of both locations to the offshore mining location, thereby leading to a longer travel time. This longer travel time would bring about the need to have storage space and deploy more vessels to meet the transport of the annual target, thus increasing the overall transport cost of vessels.
The most expensive location-vessel combination is the Bergen–Handysize option, with a total transport cost of EUR 71 per tonne. For this combination, charter and fuel costs have the highest cost share in the total cost. This combination is costly for two main reasons; first, it has the highest number of vessels deployed to meet up with the transport of the annual nodules target, and, second, it has one of the lowest average numbers of trips completed per vessel. This can be attributed to the distance of the onshore location to the offshore mining site and the limited tonnes of nodules that can be transported per trip due to the vessel’s low carrying capacity.
In
Table 7, the buffer rate of the port–vessel combination is presented. This is the rate of disruptive reserve available for each option. The vessel buffer is the threshold rate available in case of breakdown or engine failures in one or more vessels within the port–vessel combination. The time buffer refers to the threshold rate of the total turnaround time in case of unexpected delays, such as bad weather, disruptions, and weather. The figure reveals that the first three combinations with the lowest transport costs also have a decent time and vessel buffers, thereby covering any disruption during the transport operation. This implies that the Manzanillo–Panamax combination, for instance, would be 88% successful in completing the transport trips in case of disruptions that might affect the turnaround time. In comparison, the combination has a 32% rate of still completing the total transport trips should there be a vessel breakdown during the transport operations.
Three main conclusions can be drawn from the cost analysis. First, depending on the distance to the final destination of the nodules, nearshoring is important to significantly reduce the cost of transporting the nodules. The analysis reveals that ports near the offshore production site record a significantly low transport cost compared to the port location far from the offshore site. The cost reduction is evident in the charter and fuel costs which are directly related to the sailing period, the extra vessel deployed, and the storage cost. Ports near the offshore site have little sailing period and can quickly make round trips with fewer vessels, significantly cutting these costs in the total transport cost.
The second conclusion from the analysis has to do with the cost elements. As seen from the analysis, charter, fuel, and storage costs are the three most important transport-cost elements that should be considered, as they make up a significant portion of the total transport cost. Thus, deploying an extra vessel will significantly increase the total transport cost of nodules per tonne. In this sense, a concerted effort should be made to enhance efficient logistics and transport operations with fewer vessels deployed and fewer storage requirements. Finally, the size of the vessel plays a significant role in relation to the onshore storage location. The analysis reveals that medium-sized vessels (Panamax and Supramax) are cheaper for locations close to the offshore location.
6. Discussion
This section discusses some practical and managerial implications of the analysis. It also highlights the theoretical contributions of the developed model and the theoretical insights from the analysis. From the practical perspective, some managerial implications can be derived. First, the findings suggest that the type of vessel used should be carefully considered depending on the specific transport requirements and the transport journey. Indeed, the analysis indicated that small- and medium-sized vessels are more suited to locations closer to the offshore site. This way, the vessels can complete more trips with fewer vessels. On the other hand, larger vessels are more effective for long-distance transport due to their large capacity.
Second, the analysis emphasizes the benefits of using an onshore location closer to the offshore production site. Some of such benefits include reduced transport costs and a simplified logistics operation. Based on this, a tradeoff should be evaluated between longer distances and the benefits of a shorter onshore distance. This depends on the operational strategy of the organization and the weights assigned to each logistics objective, suggesting their relative importance and priority to each of the logistical goals.
Finally, the study suggests a need to have a reasonable buffer when implementing transport operations. This is to account for potential disruptions that might occur during transport. Incorporating this into the logistical strategy of the organization would not only help in choosing the right location–vessel combination solution. Still, it would also help mitigate the impact of any unexpected event, thereby enhancing a smooth logistical operation to ensure that the production targets are successfully transported.
In line with the above, some theoretical contributions can be highlighted. First, the study contributes to the limited research in offshore logistics and transport by developing a MOO logistics and cost model for offshore–onshore transport. This model identifies four key objective functions and incorporates various parameters related to production targets, onshore storage, port distance, transportation options, vessel characteristics, and cost inputs. This model could be a practical tool for analyzing scenarios and making informed decisions. In addition, the model can be used as a basis for more detailed and complex logistics and cost calculations focused on specific cases.
Furthermore, the study provides insights into how vessel size and location section could impact logistics and cost operations. By analyzing different solutions and combinations, key factors that influence logistics efficiency and cost effectiveness are identified. These influencing factors form the basis for the theoretical understanding of logistics decision-making in offshore–onshore transportation.
Finally, the study’s findings contribute to how transport operations can be optimized through the simultaneous consideration of multiple factors. Through these factors, managers could optimize their decision-making by examining the various vessel classes and location combinations and balancing trip completion, storage capacity, transport costs, and logistics complexity.
7. Conclusions
The study examined the logistics analysis of transporting the annual production target of wet nodules from the offshore production site to the onshore location for further processing. In doing this, transport logistics and cost analysis to the identified onshore locations (Vancouver, Manzanillo, Tianjin, and Bergen) were examined using four main vessel classifications (Handysize, Supramax, Panamax, and Capesize).
A logistics and cost model infused in a MOO model was developed to examine this, where all possible locations and vessel combinations were developed. The combinations were analyzed with input parameters focused on production target, onshore storage, port distance and location, transportation options, vessel characteristics, and cost inputs. These parameters can be adapted and modified by the user of the model. With these parameters, a transport case was developed. From the analysis of this case, some general conclusions can be reached.
Small- and medium-sized vessels tend to complete more trips than bigger ones, leading to a lower required storage capacity for the vessel class. However, one disadvantage of using the smaller vessel is that, because of its size and limited capacity, more vessels will need to be deployed to achieve the transport of the annual production target. Unfortunately, for long-distance transport, the cost of lower storage space does not compensate for the cost of deploying an additional vessel for this type of vessel class, thus, making the transport cost of using smaller vessels more expensive for long-distance transport. However, these vessels are ideal for locations closer to the offshore site. This is because the vessels can complete more trips without increasing the number of vessels deployed. Thus, it can be said that these vessels are more suited for locations closer to the offshore site.
Furthermore, the analysis suggests having the onshore location as close to the offshore production site as possible. Doing this would reduce transport costs and make the transport and logistics operation of transferring the nodules less complex. Finally, the study suggests having a reasonable buffer rate in case of disruptions during transport operations. The medium-sized vessels also have reasonable time and vessel buffer rates in this case. In addition to their low transport costs, low required temporary storage, and optimal logistics solution, these vessel types offer the ideal solution for transport operations for onshore sites closer to the offshore production site.


