
Evaluation of Greenhouse Gas Emissions in Conflict Areas: Application to Palestine


Abstract
1. Introduction
2. Materials and Methods
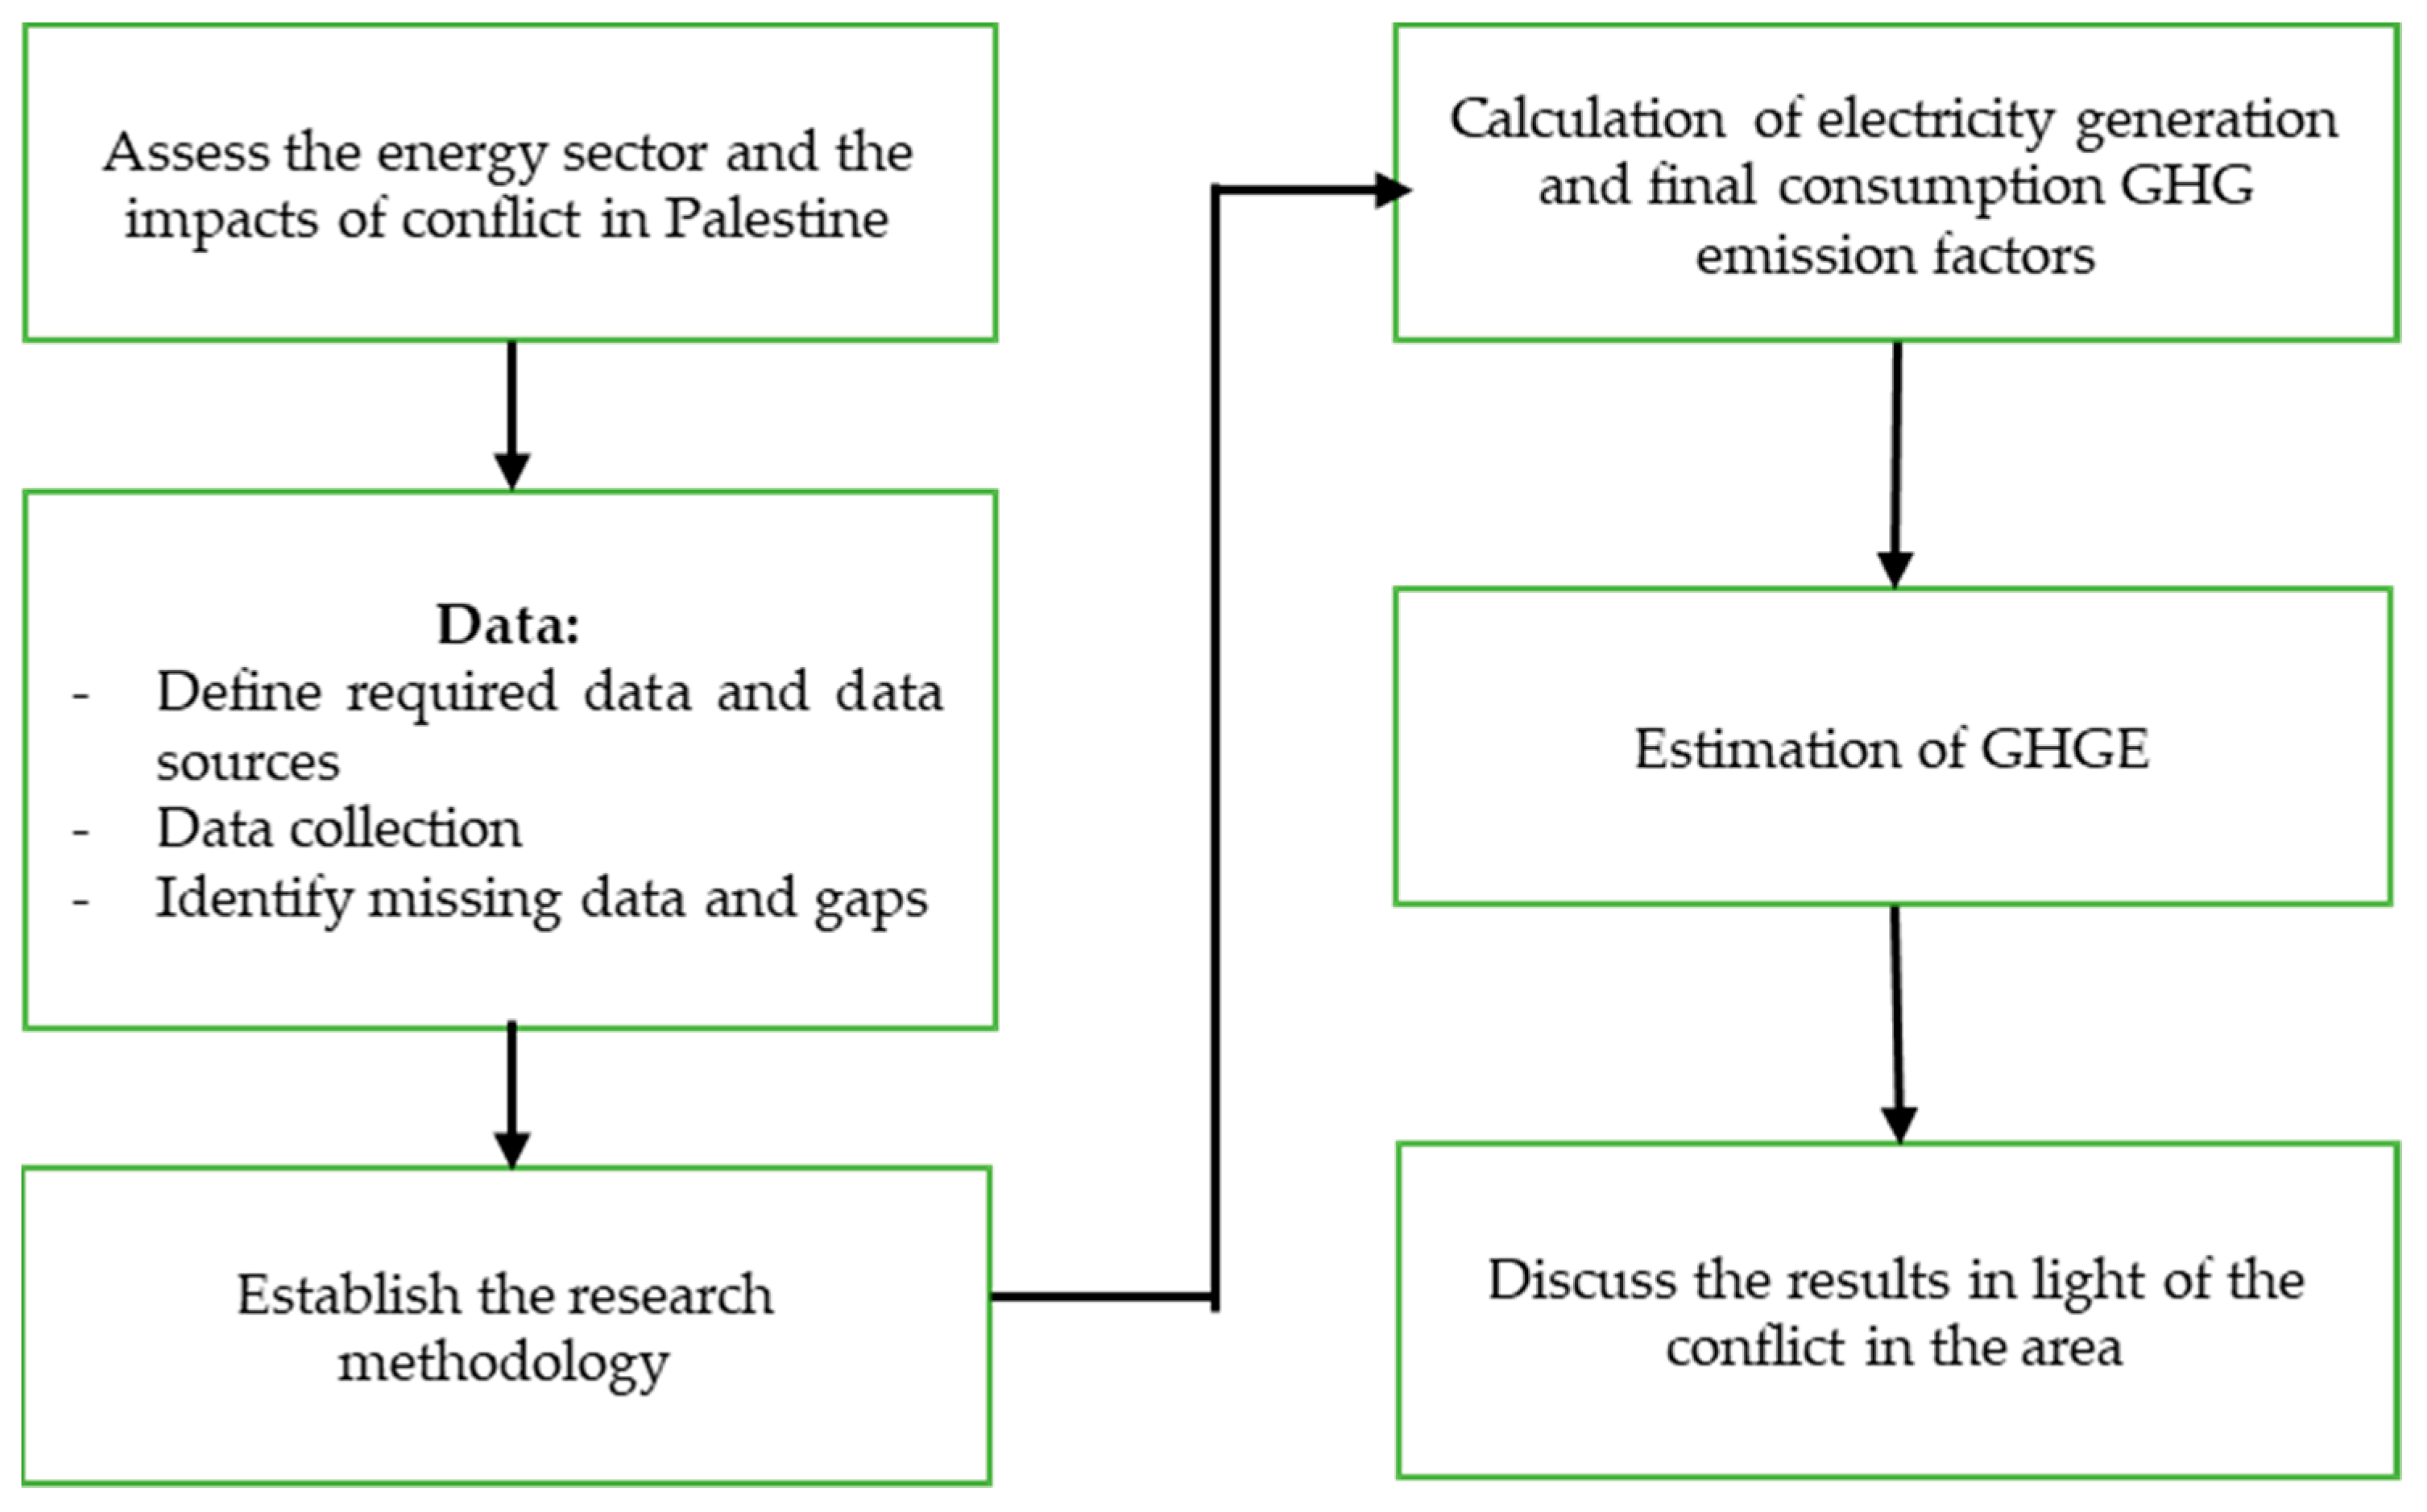
2.1. Overview
2.2. Study Area
2.3. Energy Sector
2.4. Data Source
- The technical losses in electricity in Palestine are considered to be 12%, according to the Palestinian Energy and Natural Resources Authority.
- The efficiency of the solar water heater was considered to be 45%, and the consumed energy was half of the produced quantity.
- In all accounts related to charcoal and wood, a unified calorific value was used for each charcoal and wood based on the weight of each type in the balance. The calorific value for both was considered to be 15.7 GJ/t.
2.5. Estimation of GHGEs
2.5.1. Fuel
2.5.2. Electricity
- (i)
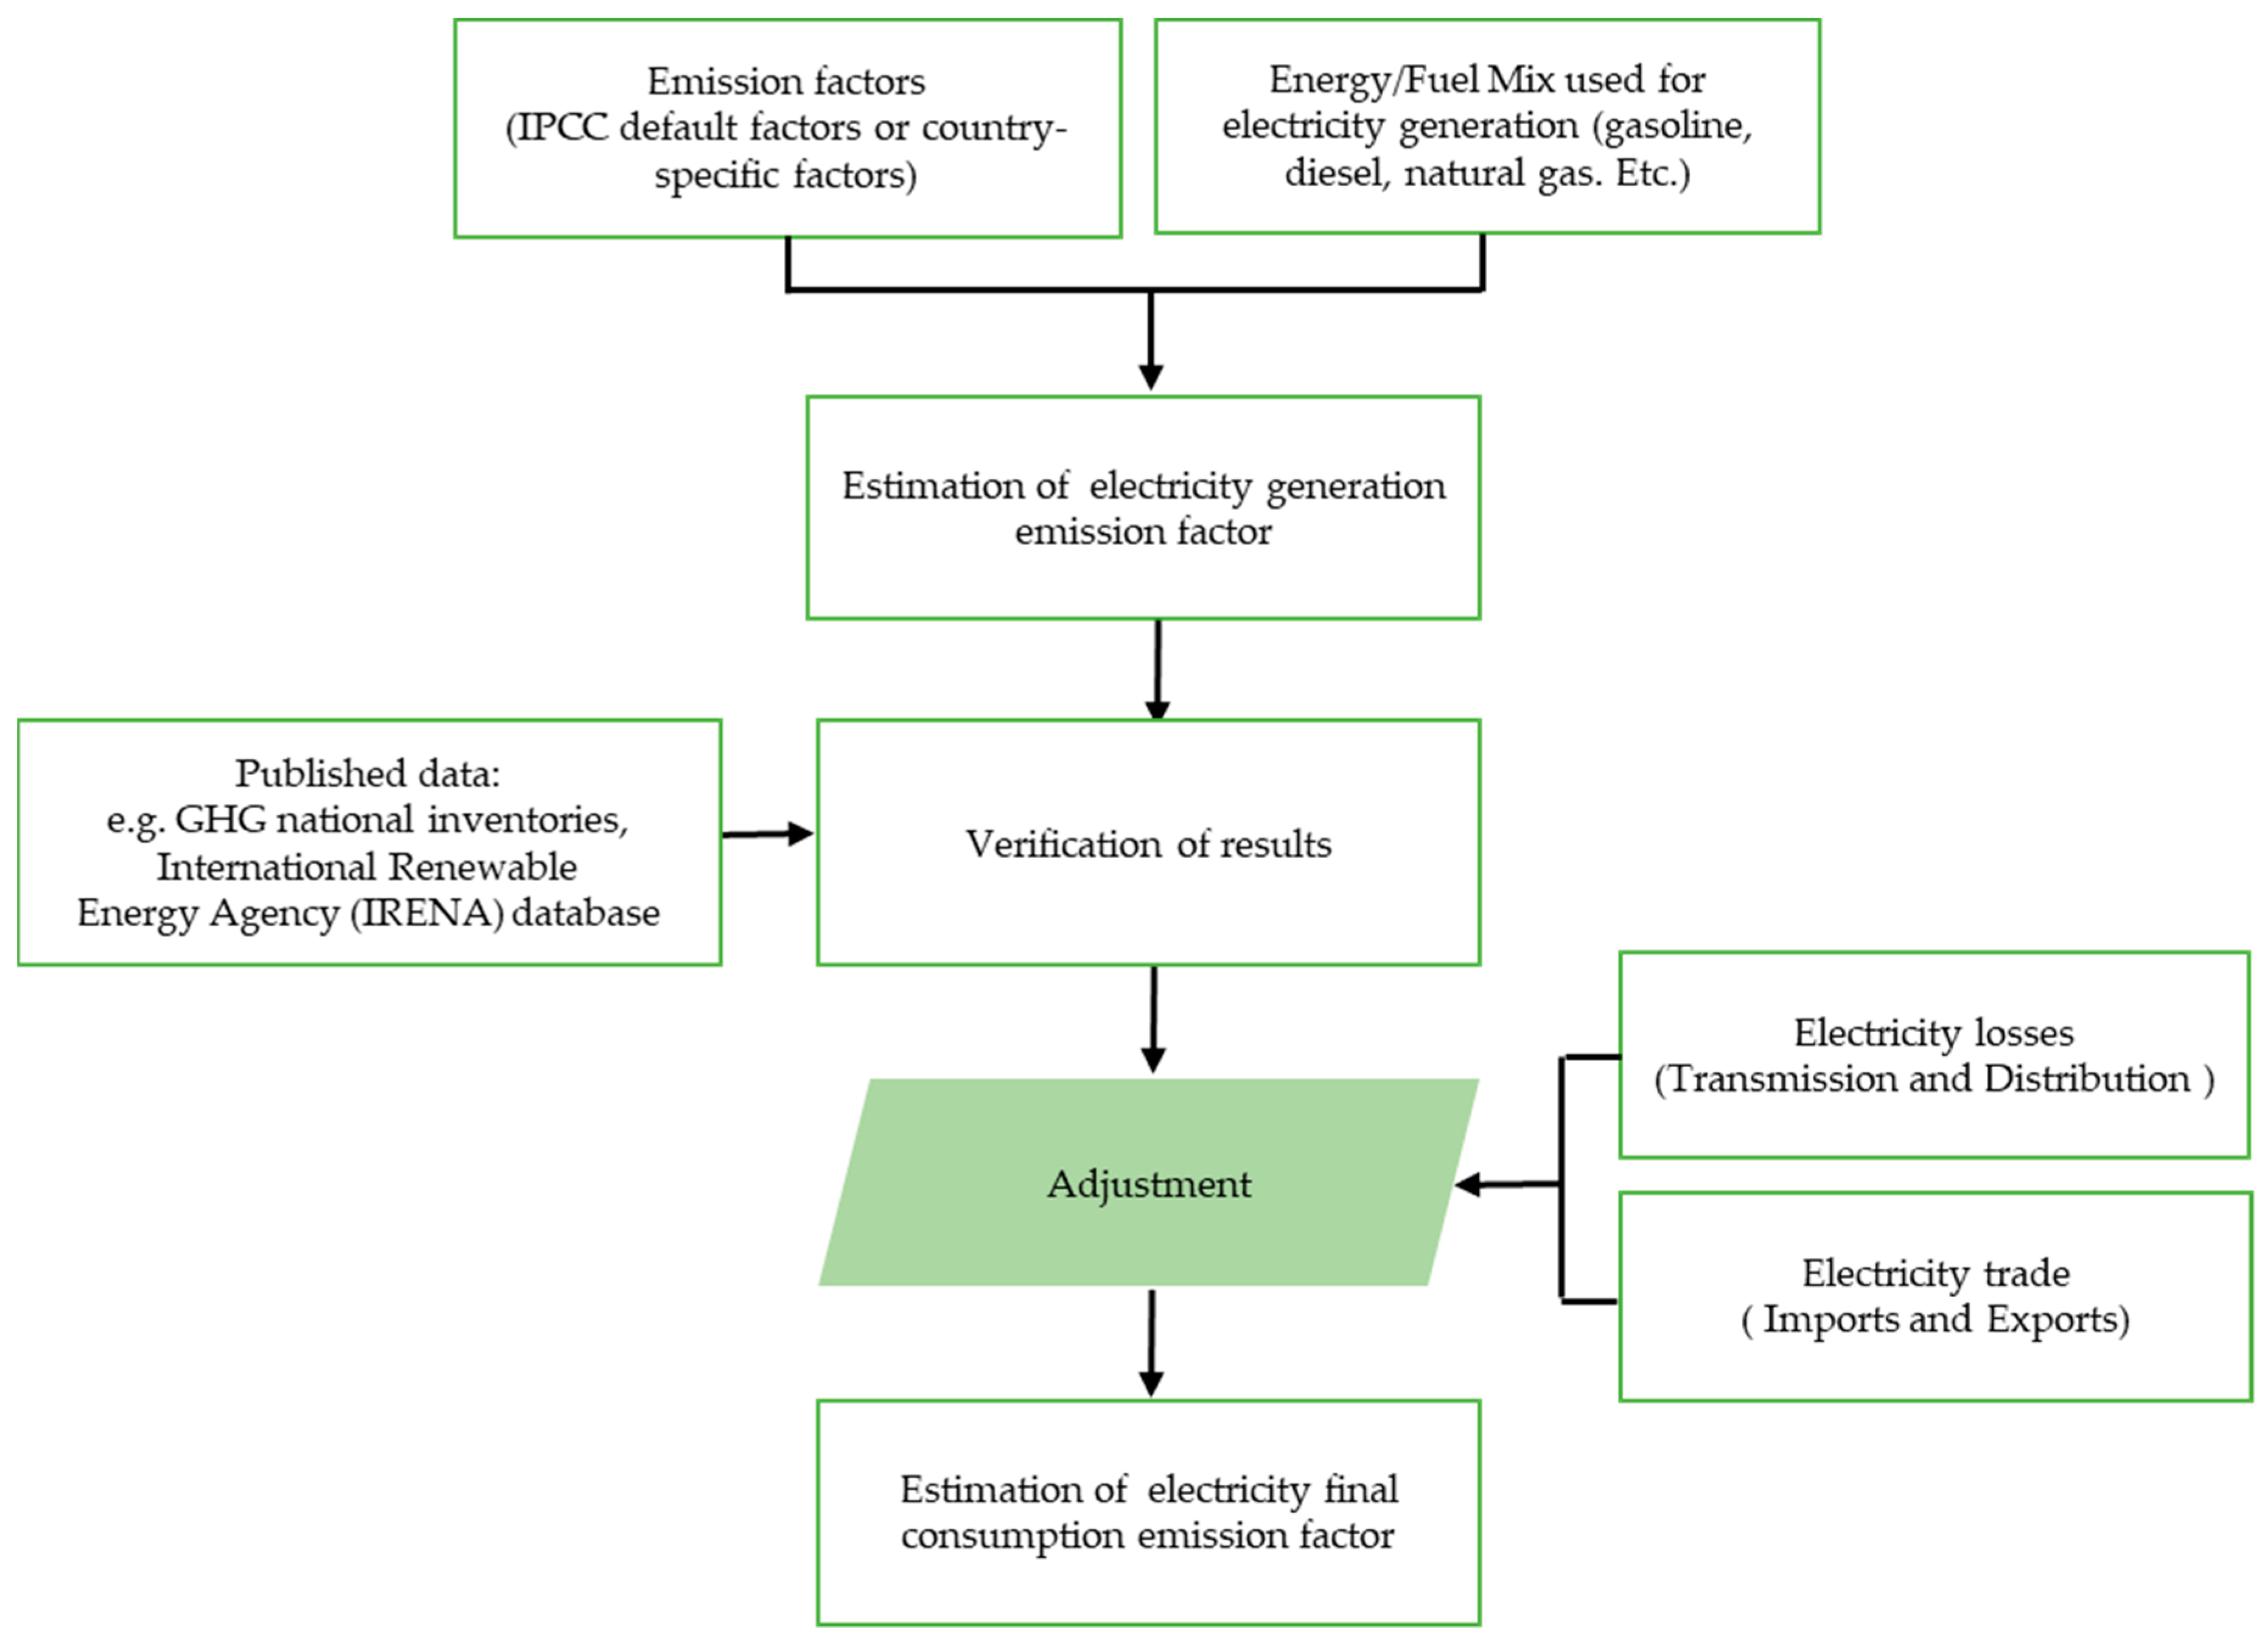
- Electricity generation mix: GHGEs from a single electricity generation point depend on the mix used for electricity generation at that point (fossil fuels, biofuels, geothermal, nuclear, solar. etc.); as a result, the emission factor of electricity generation varies from a year to another with the variation of the generation mix. According to the 2006 IPCC Guidelines and the IEA World Energy Balances data [44], the total CO2 emission factor for electricity generation was calculated as follows:where CO2 kWh is the carbon dioxide emission factor (in CO2/kWh) calculated at the generation point, ∑fuels is the sum of the different fuels used for electricity generation, and Inputplants is the fuel input into the plants (both main activity and auto producer) expressed in energy unit. , where CHP denotes the combined heat and power plants. ηheat is the efficiency of heat generation, which is usually assumed 90% similar to that of a typical heat boiler, except when the observed efficiency of CHP generation is higher than 90%, in which case emissions are allocated using the proportionality approach such that inputs are allocated on the basis of the output shares of electricity and heat, where equivalent efficiency is used for both electricity and heat [44]. . EFfuel is default emission factor of the corresponding fuel provided in the 2006 IPCC Guidelines. EleInland is the electricity generated from all sources including the non-emitting sources.
- (ii)
- Electricity trade: a country can either export or import electricity to/from another one. Thus, the emission factor should be adjusted for the trade of electricity; the adjustment can be positive or negative depending on the share of electricity exports and imports. It is calculated as follows:where CO2 kWhtrade is an adjustment of the carbon factor (in CO2/kWh) for emissions induced by the trade of electricity with partner countries, , where CO2 kWh Partner is the electricity generation emission factor at the partner country., and .
- (iii)
- Electricity transmission and distribution losses: about 5–15% of the electricity transmitted is usually lost through the electricity distribution and transmitting grid, which means that, for each kWh at the consumption point, a higher amount of electricity has to be generated to account for these losses. In the case of Palestine, the technical losses in electricity were considered to be 12% according to the Palestinian Energy and Natural Resources Authority (PENRA) [26].
3. Results and Discussion
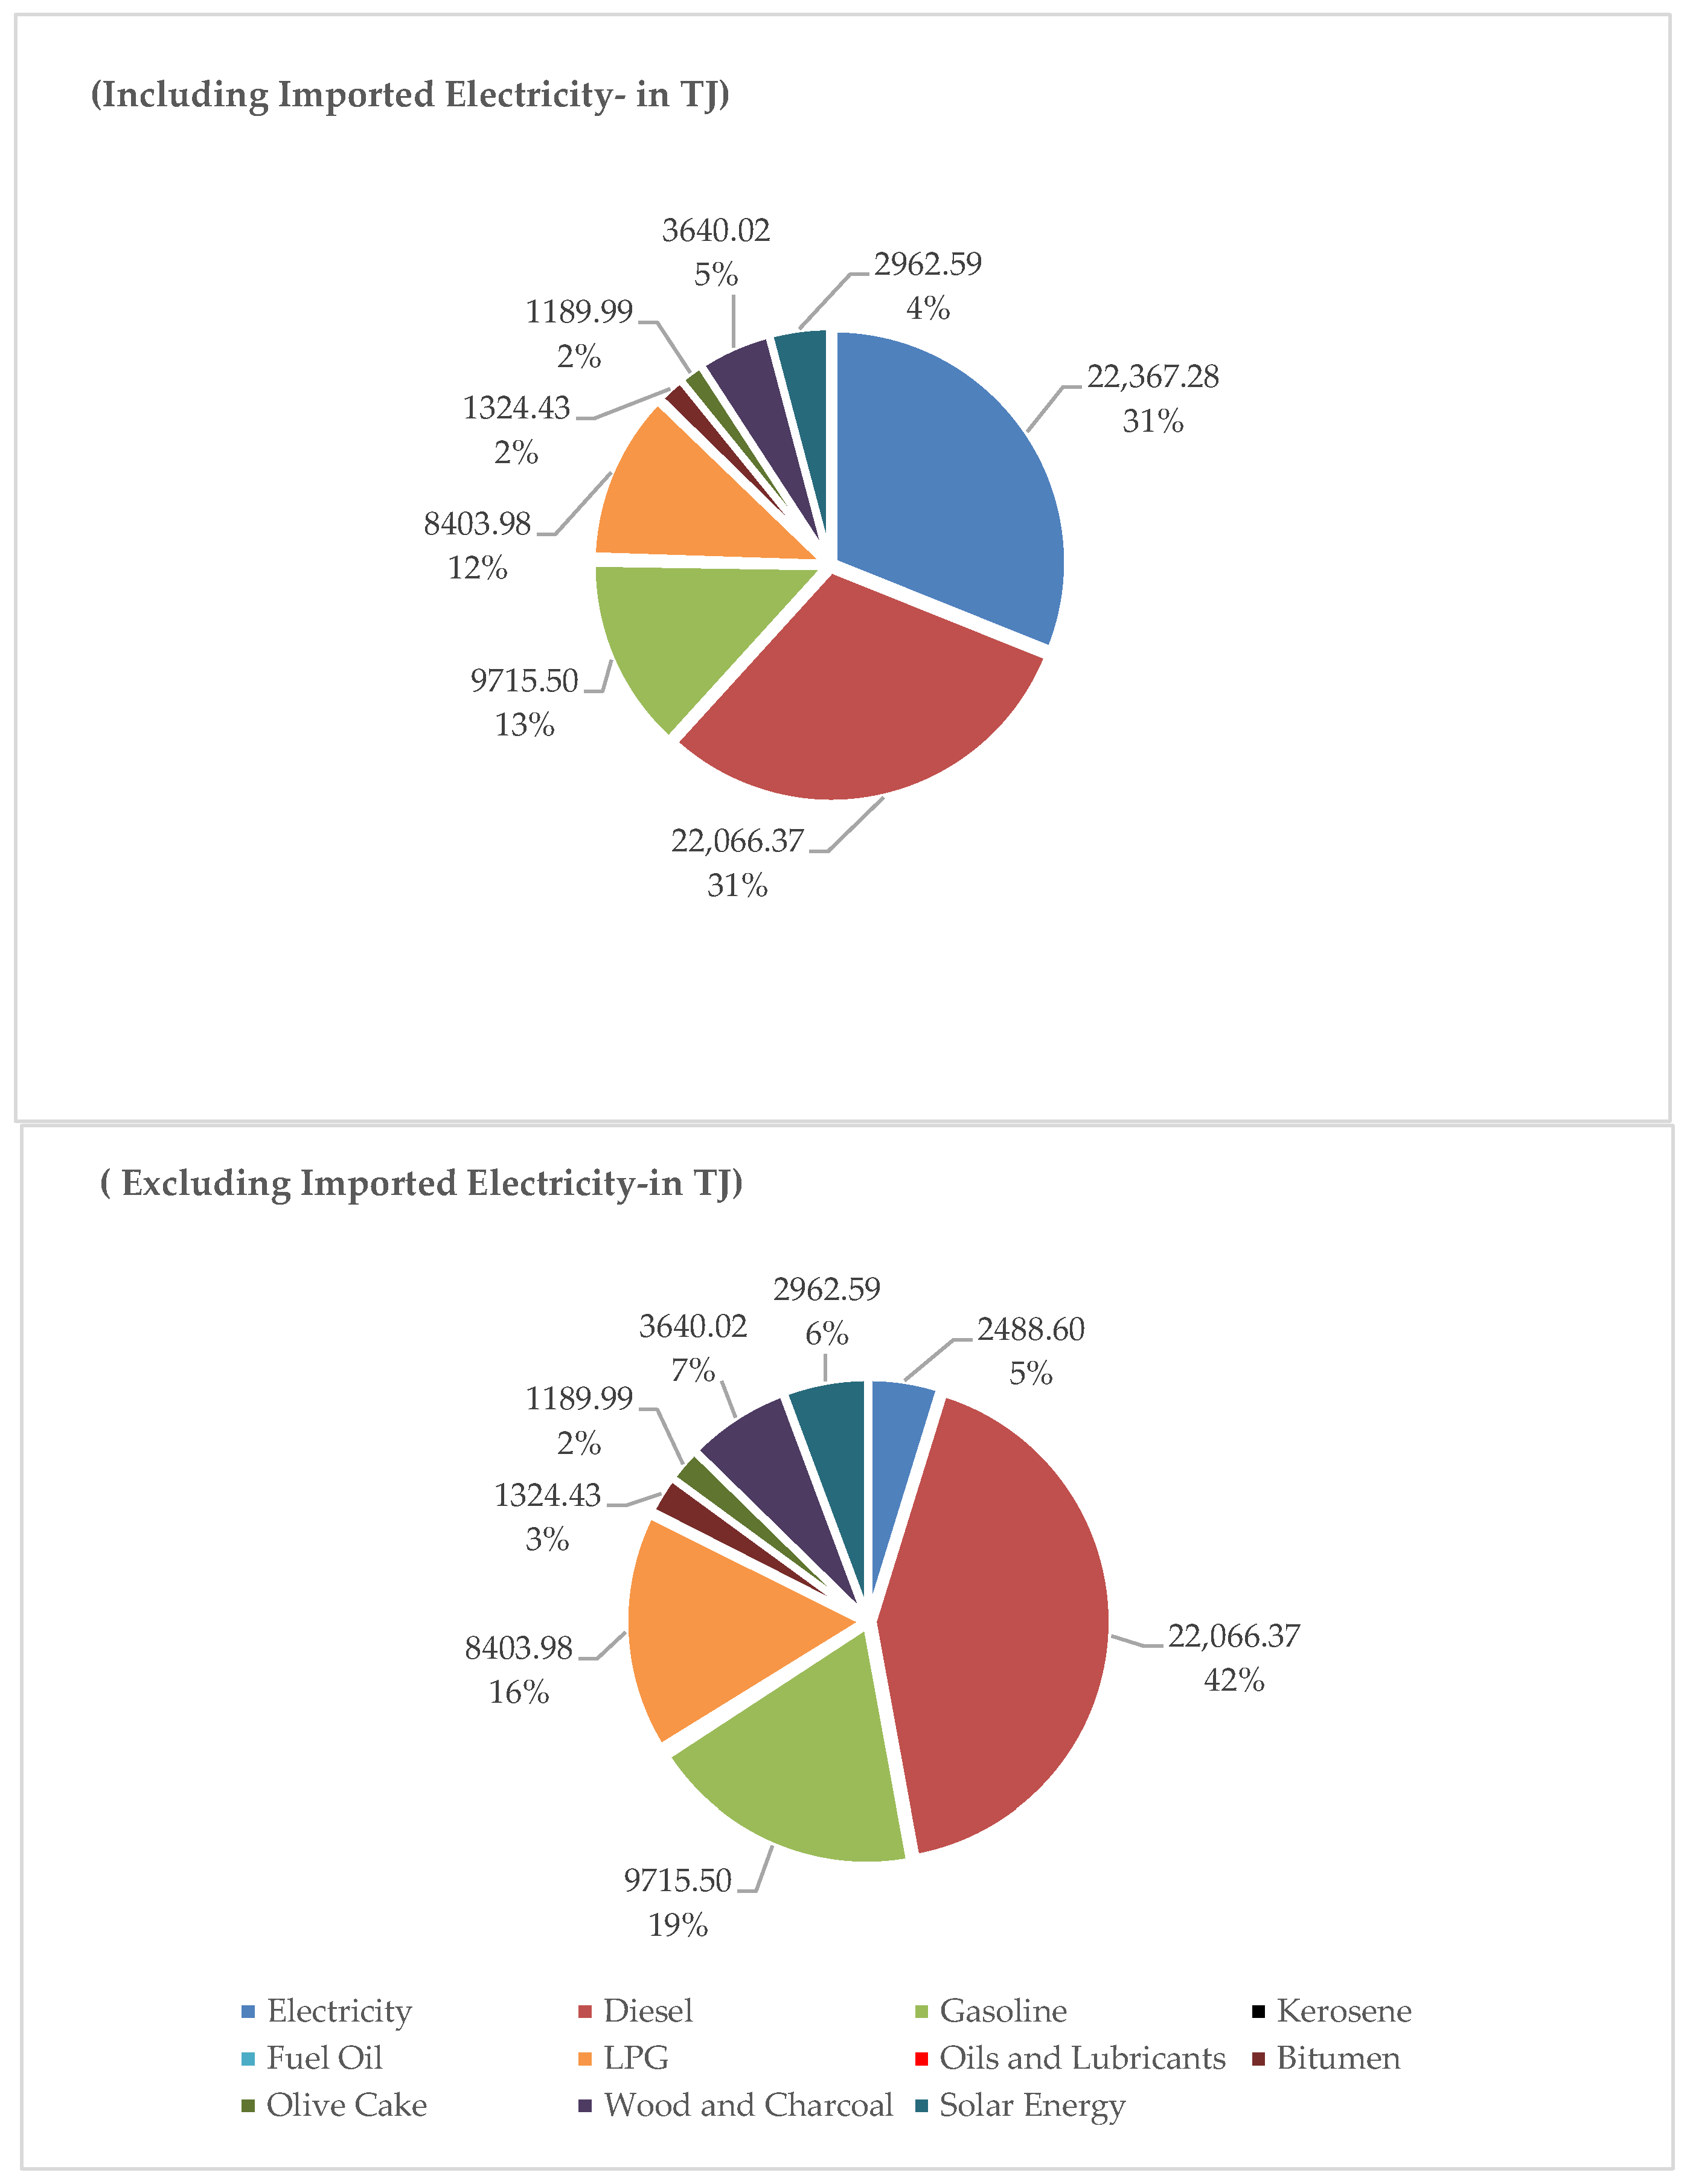
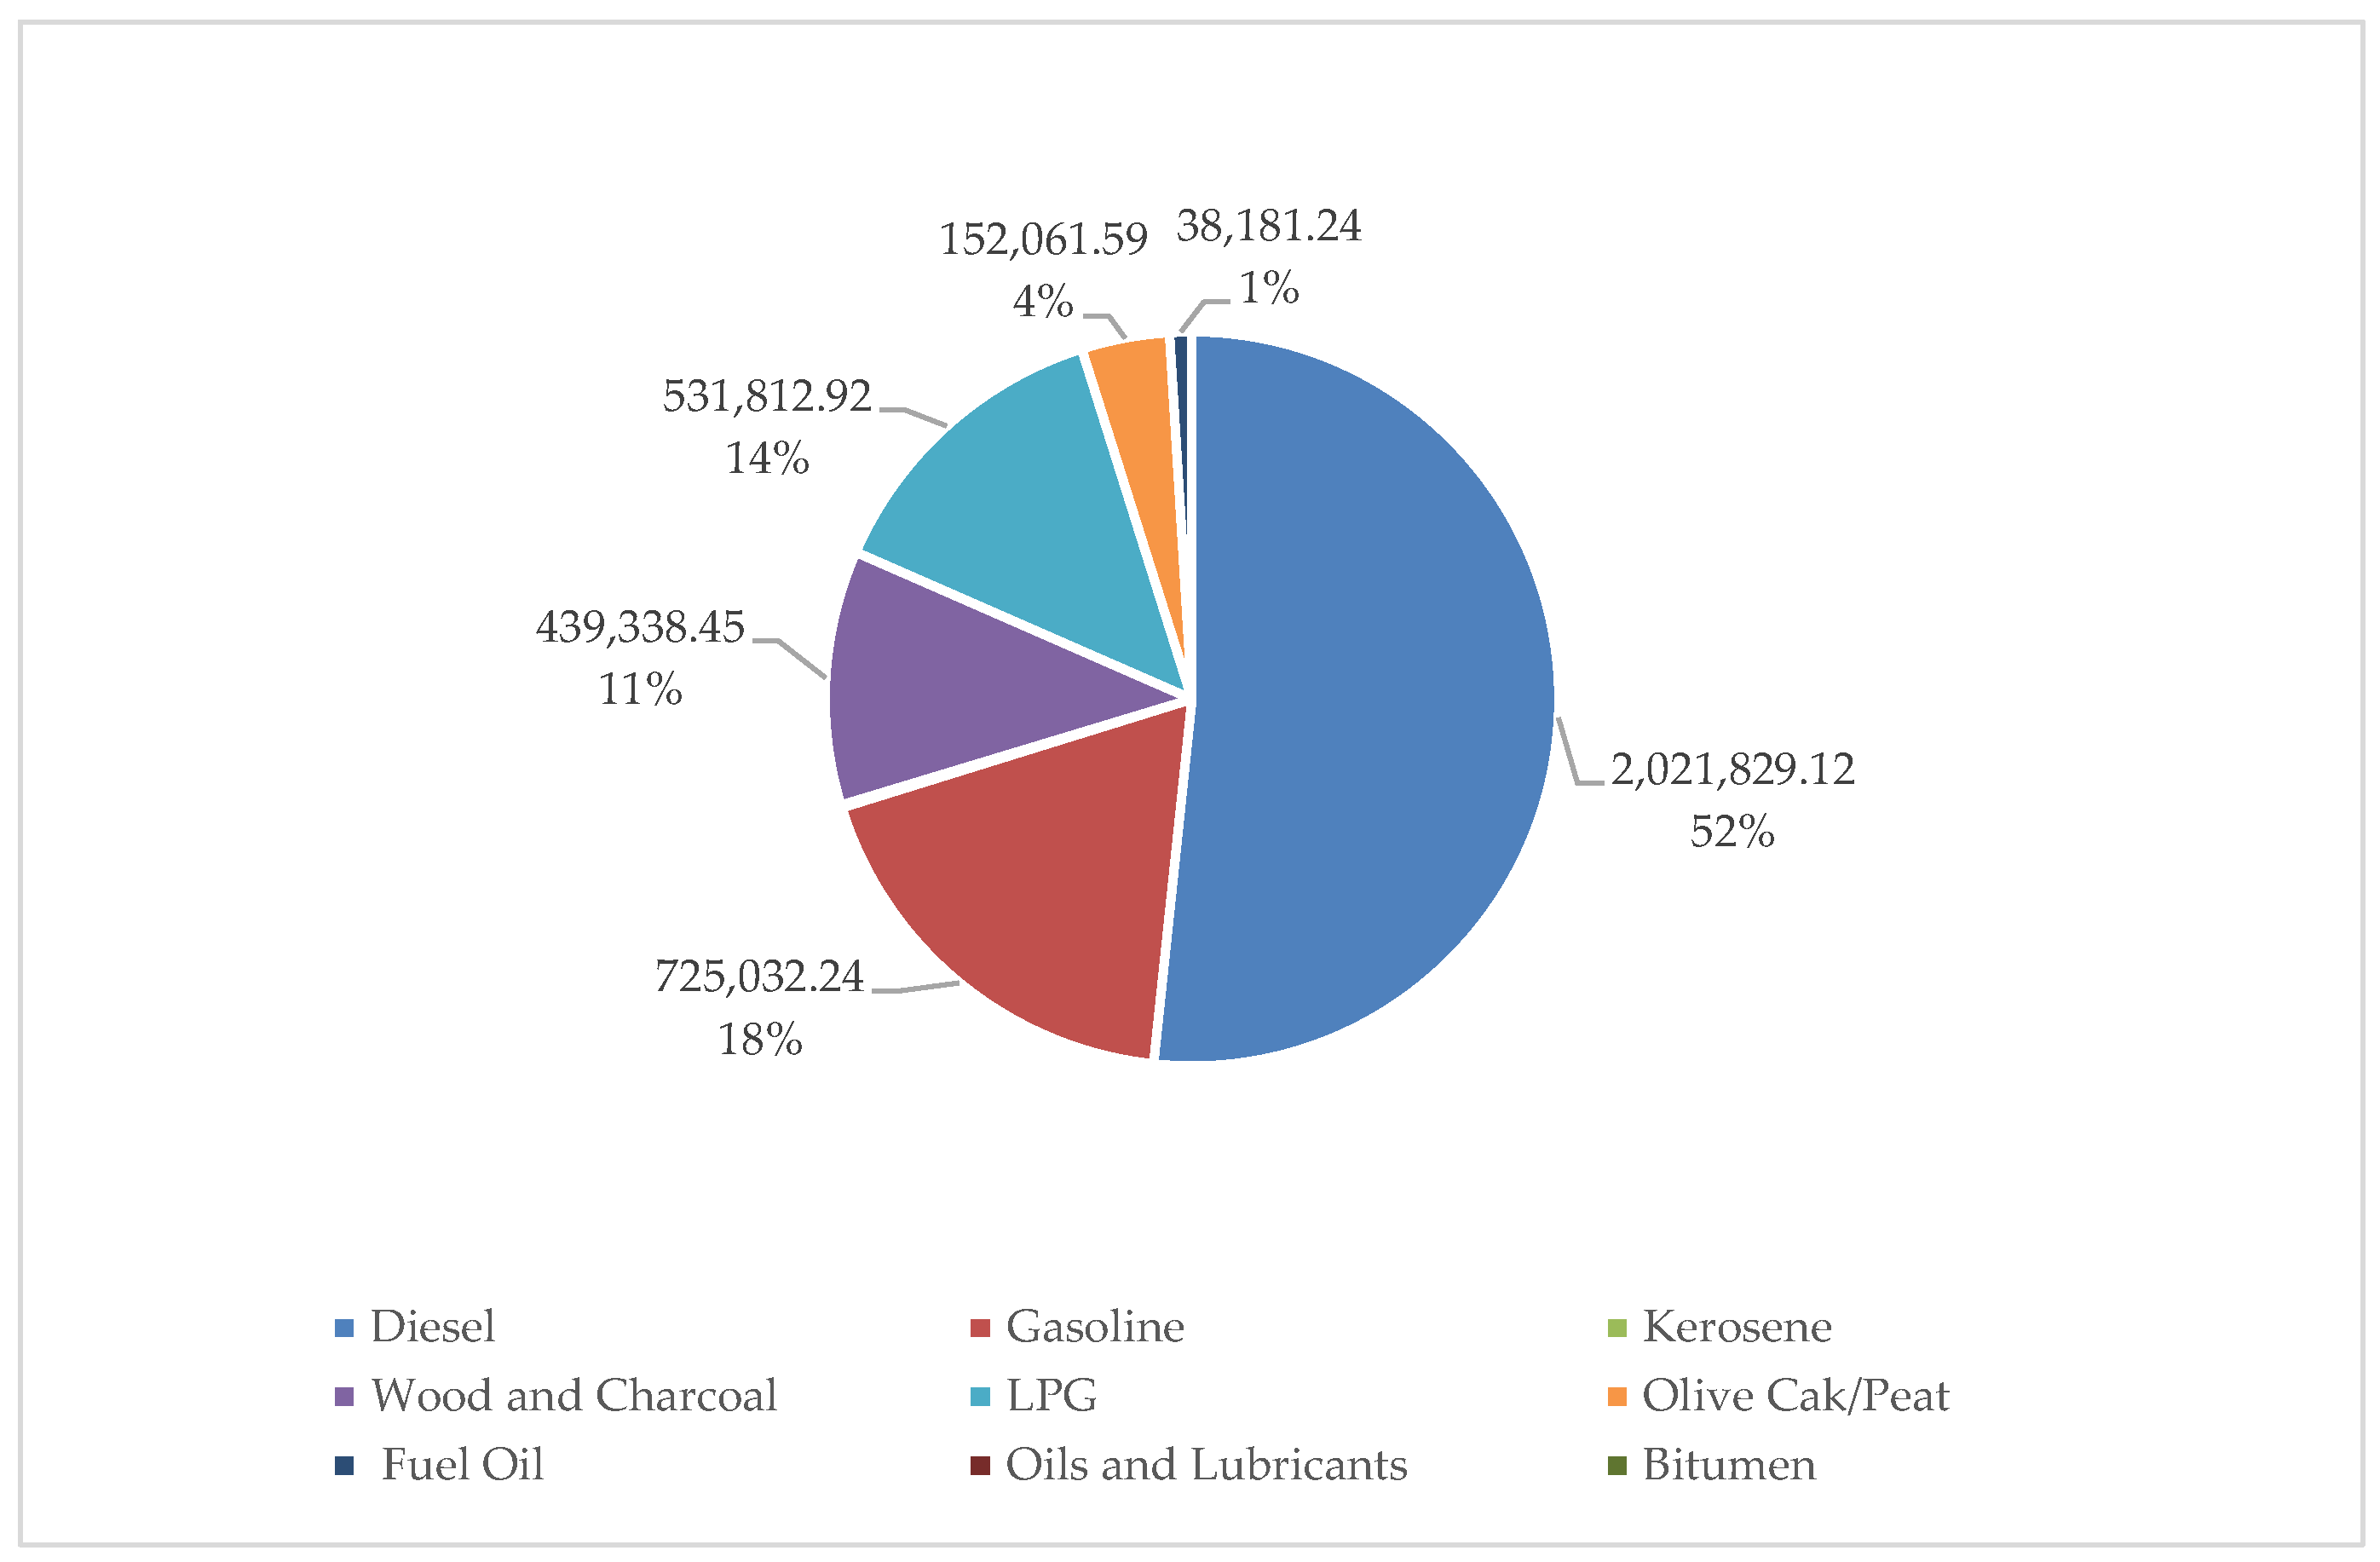
3.1. Fuel
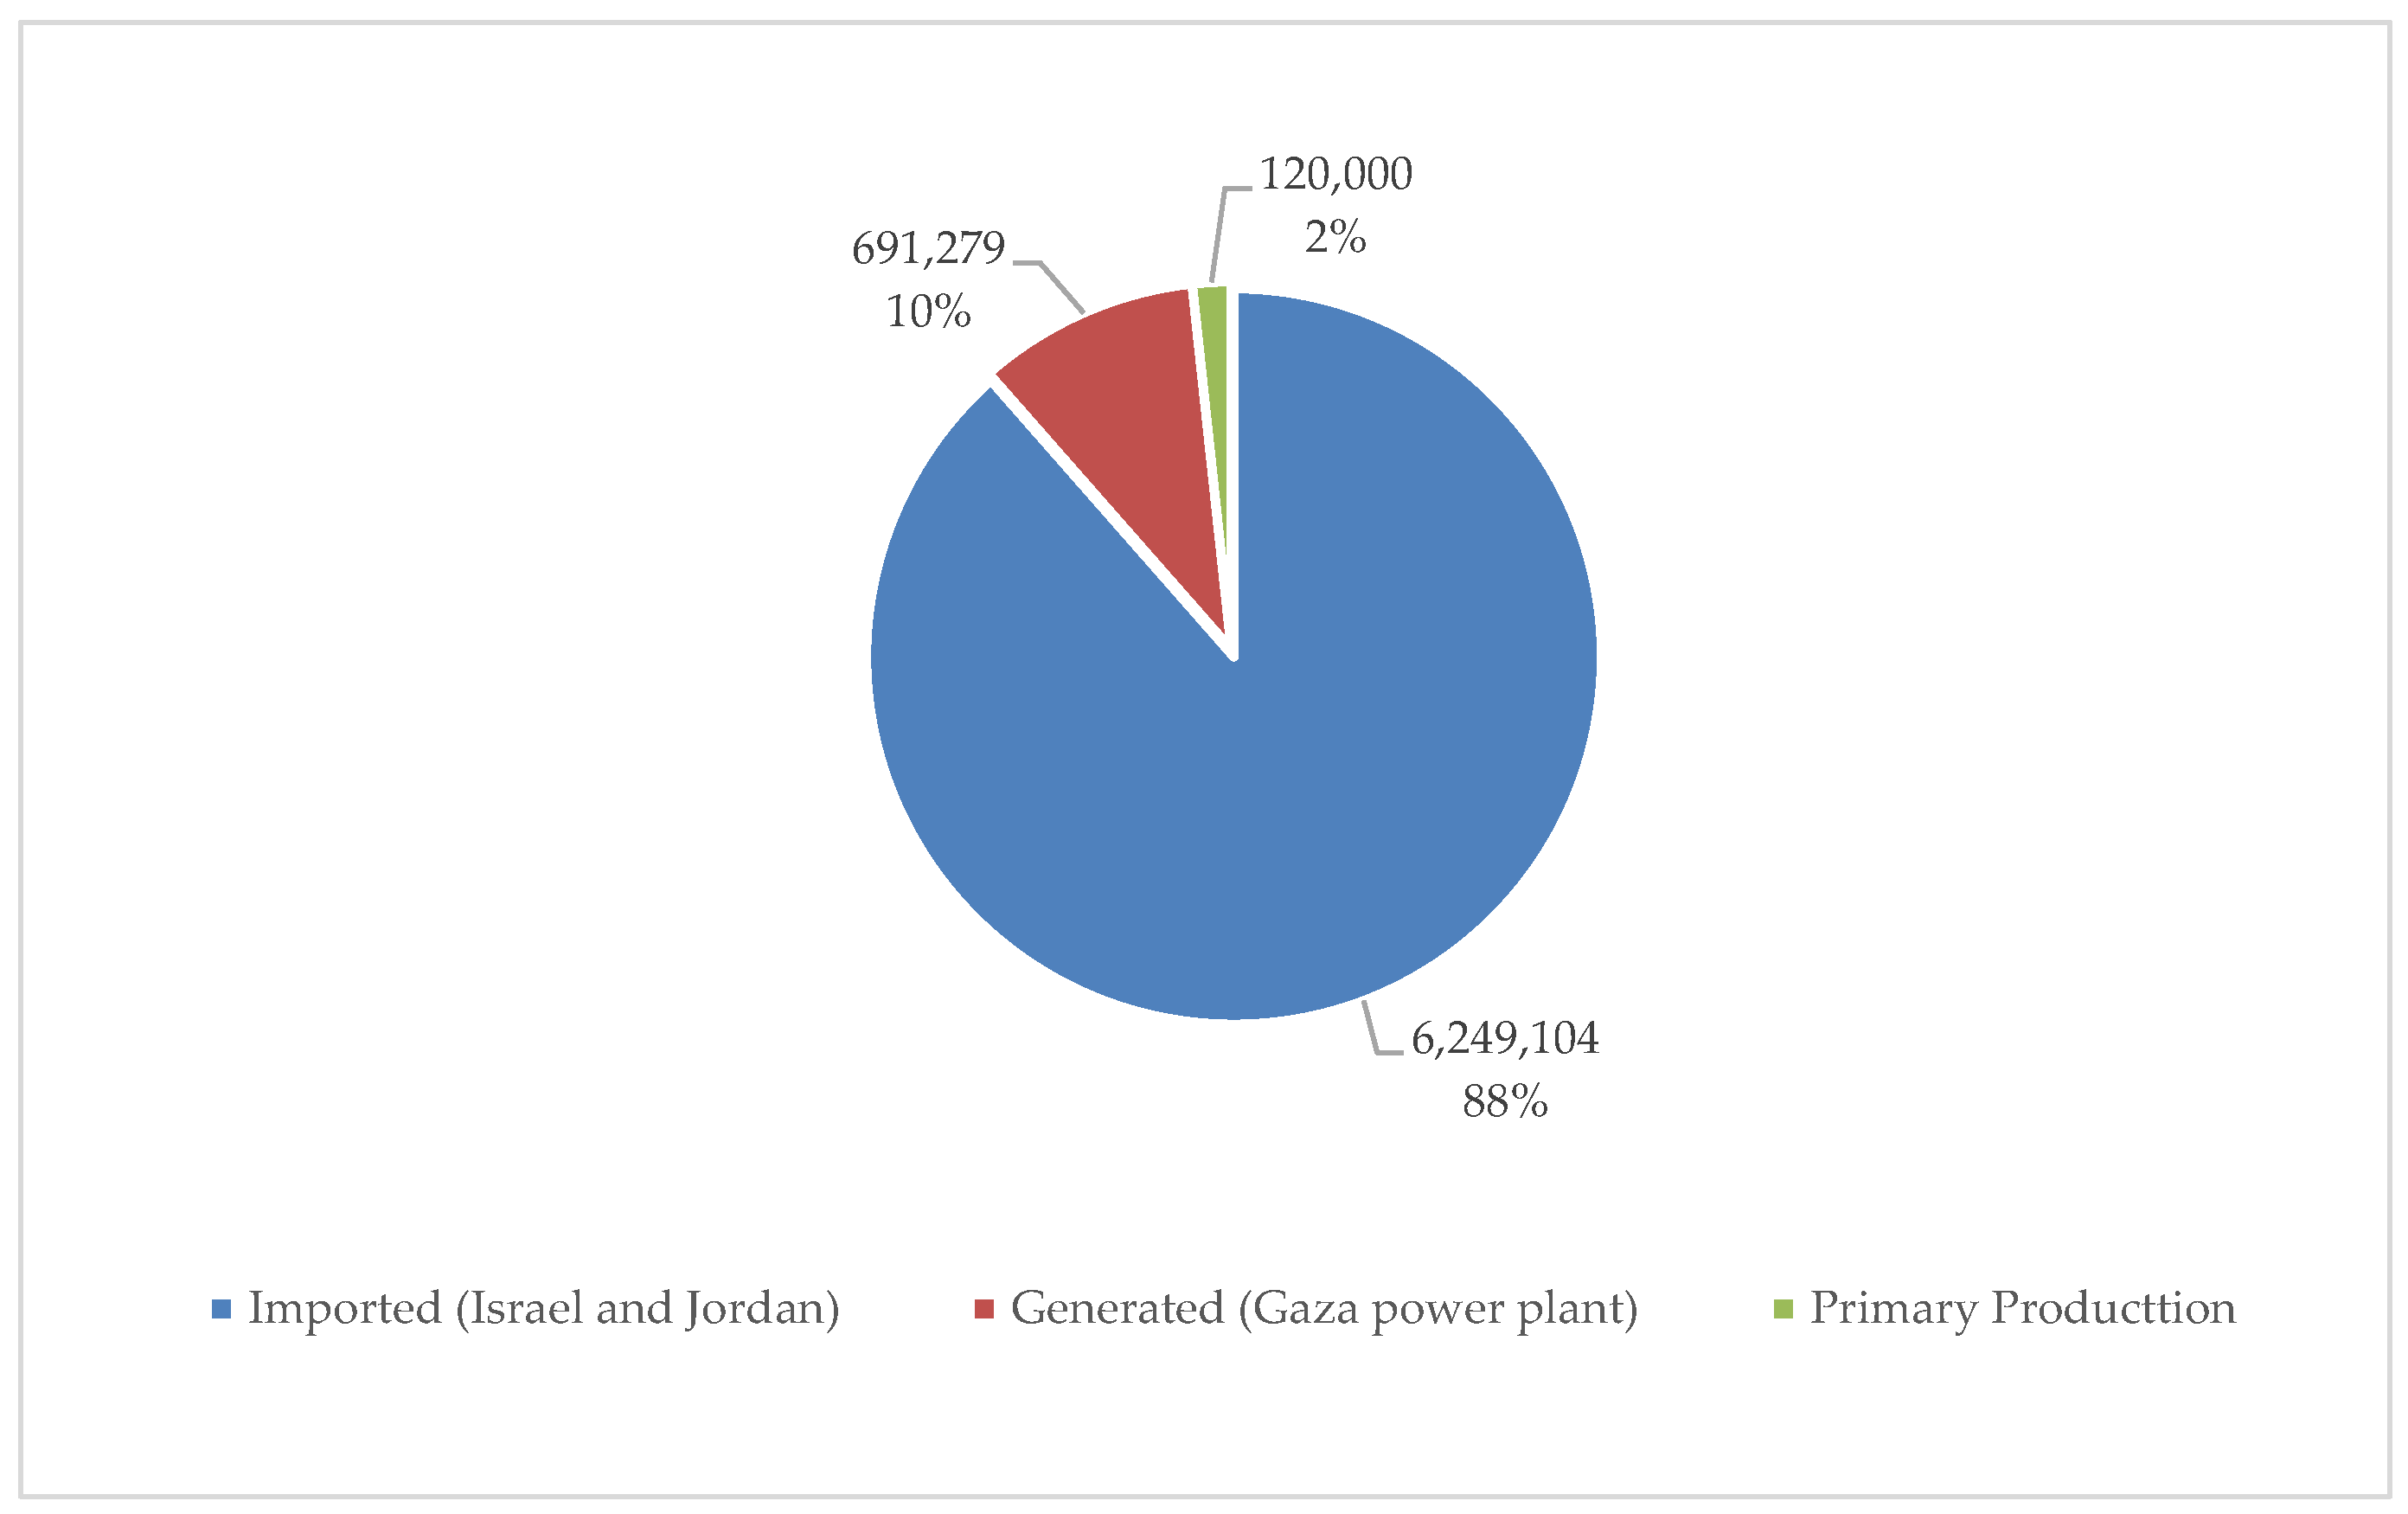
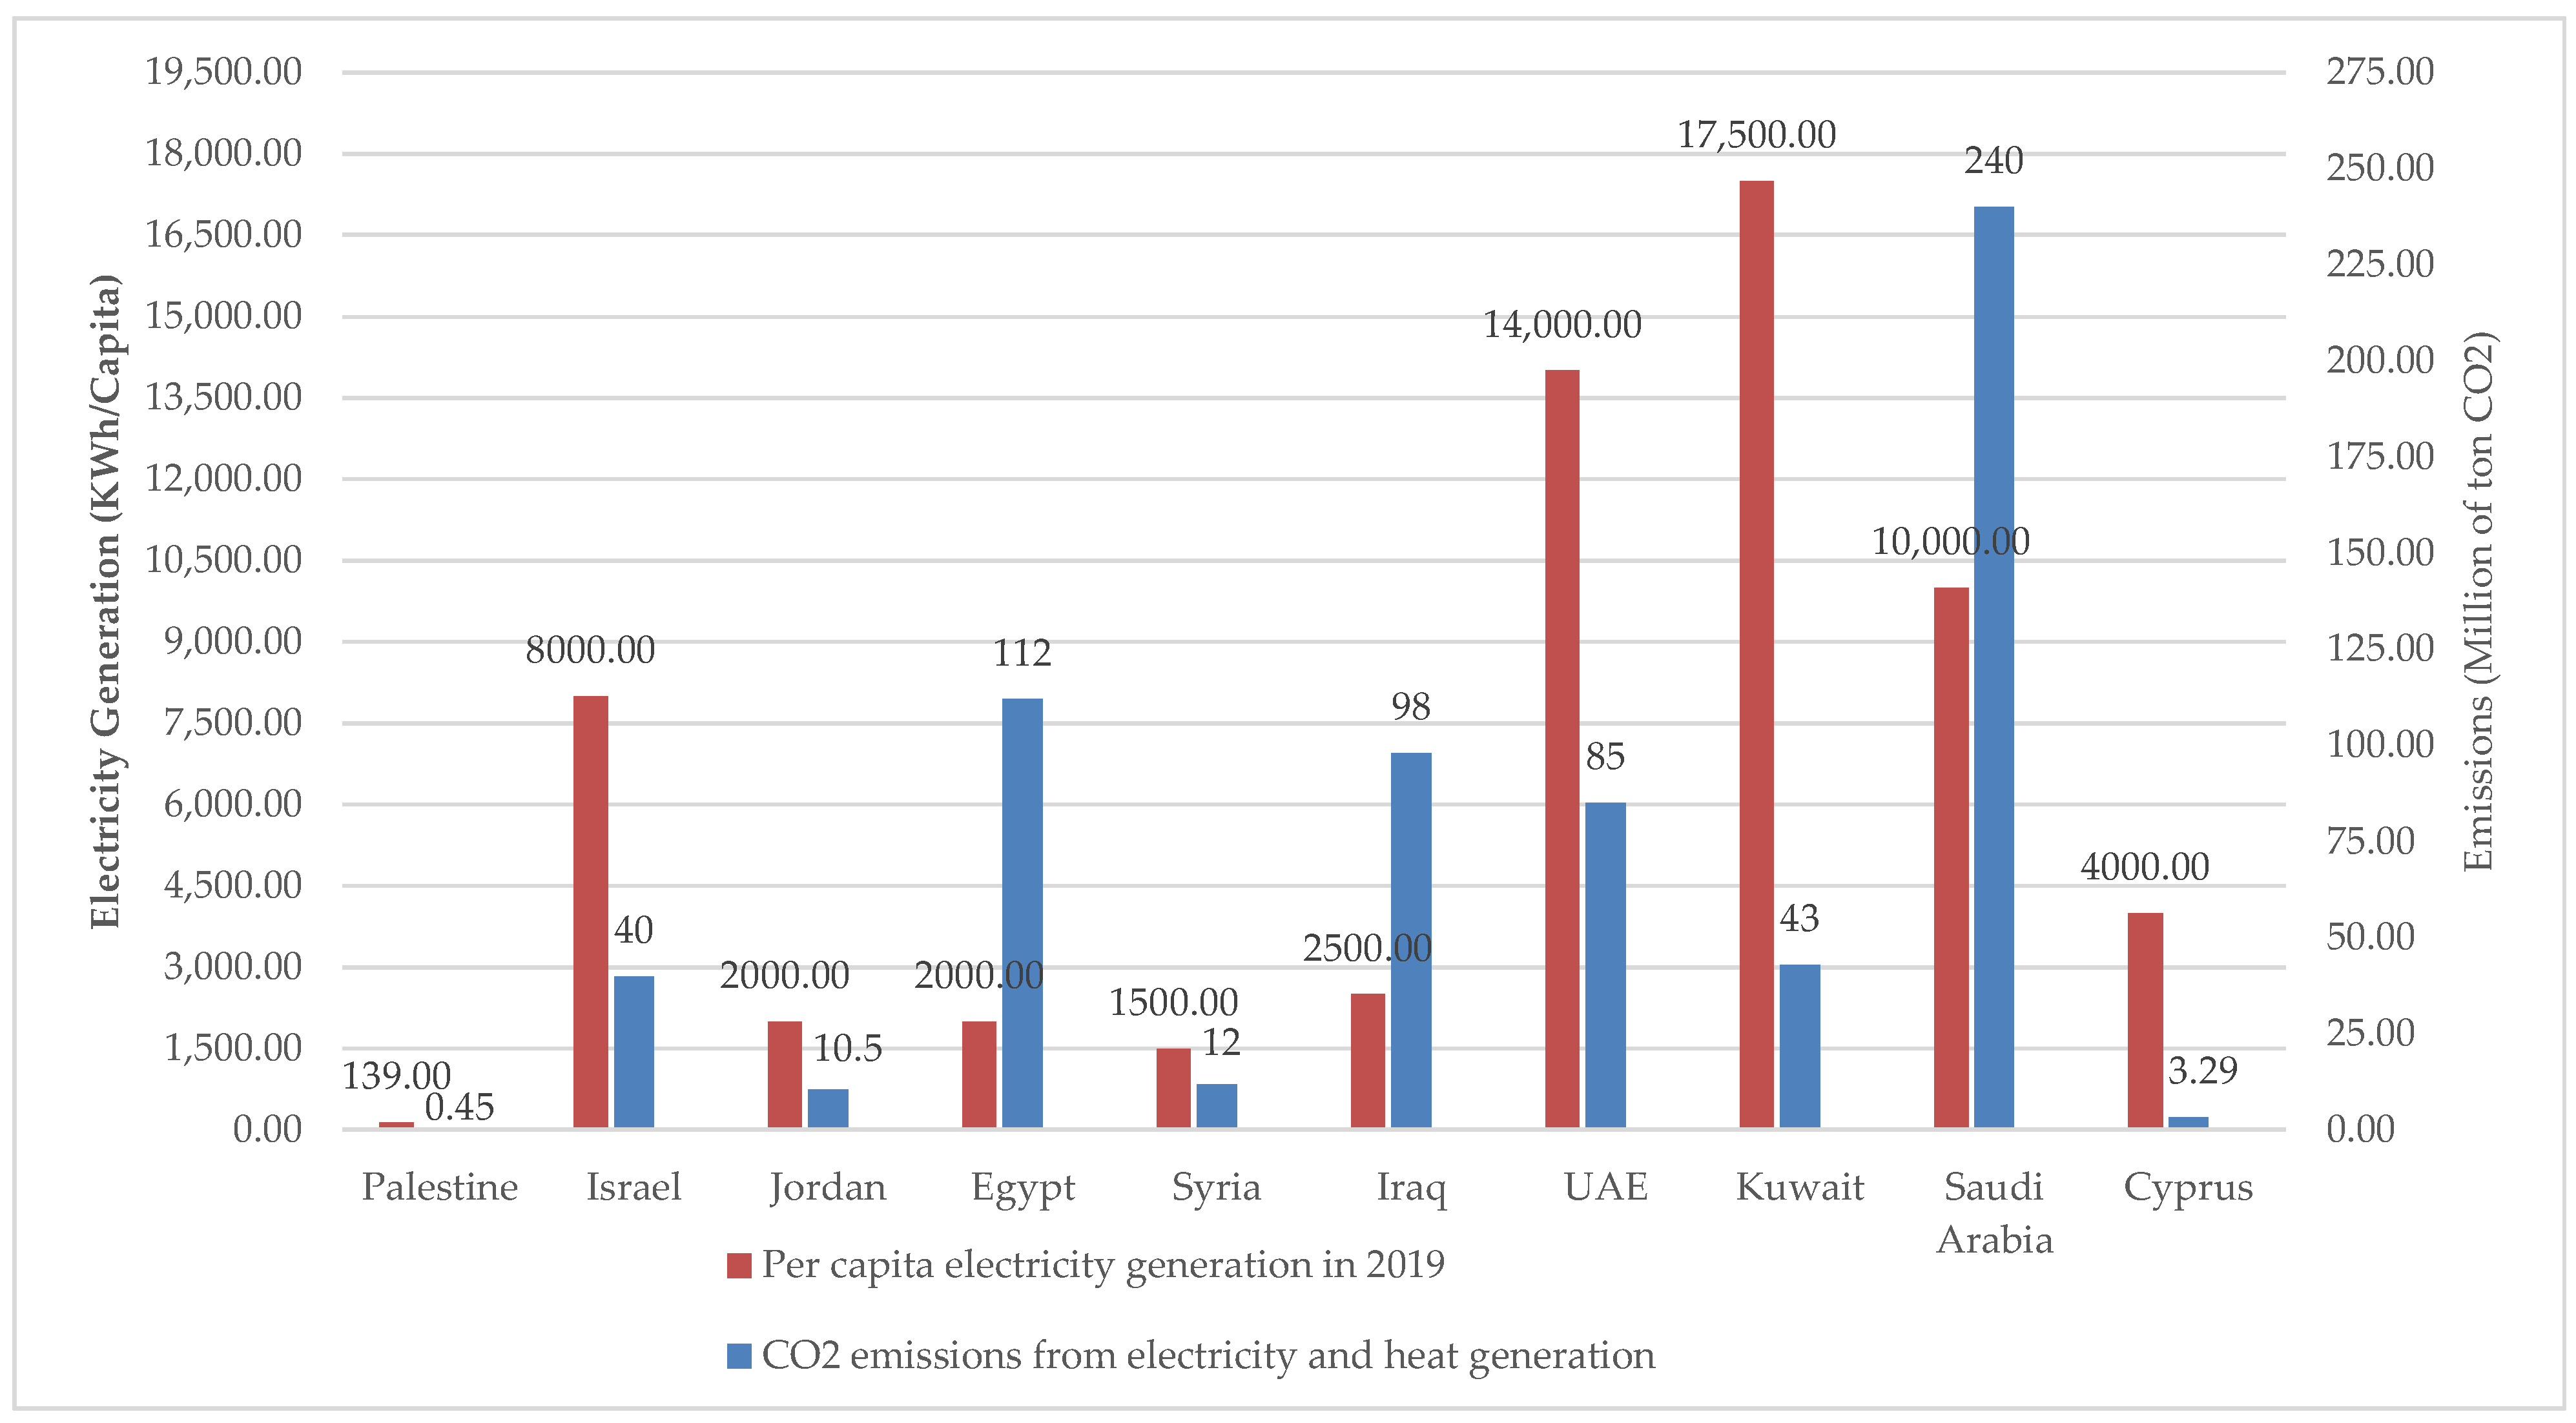
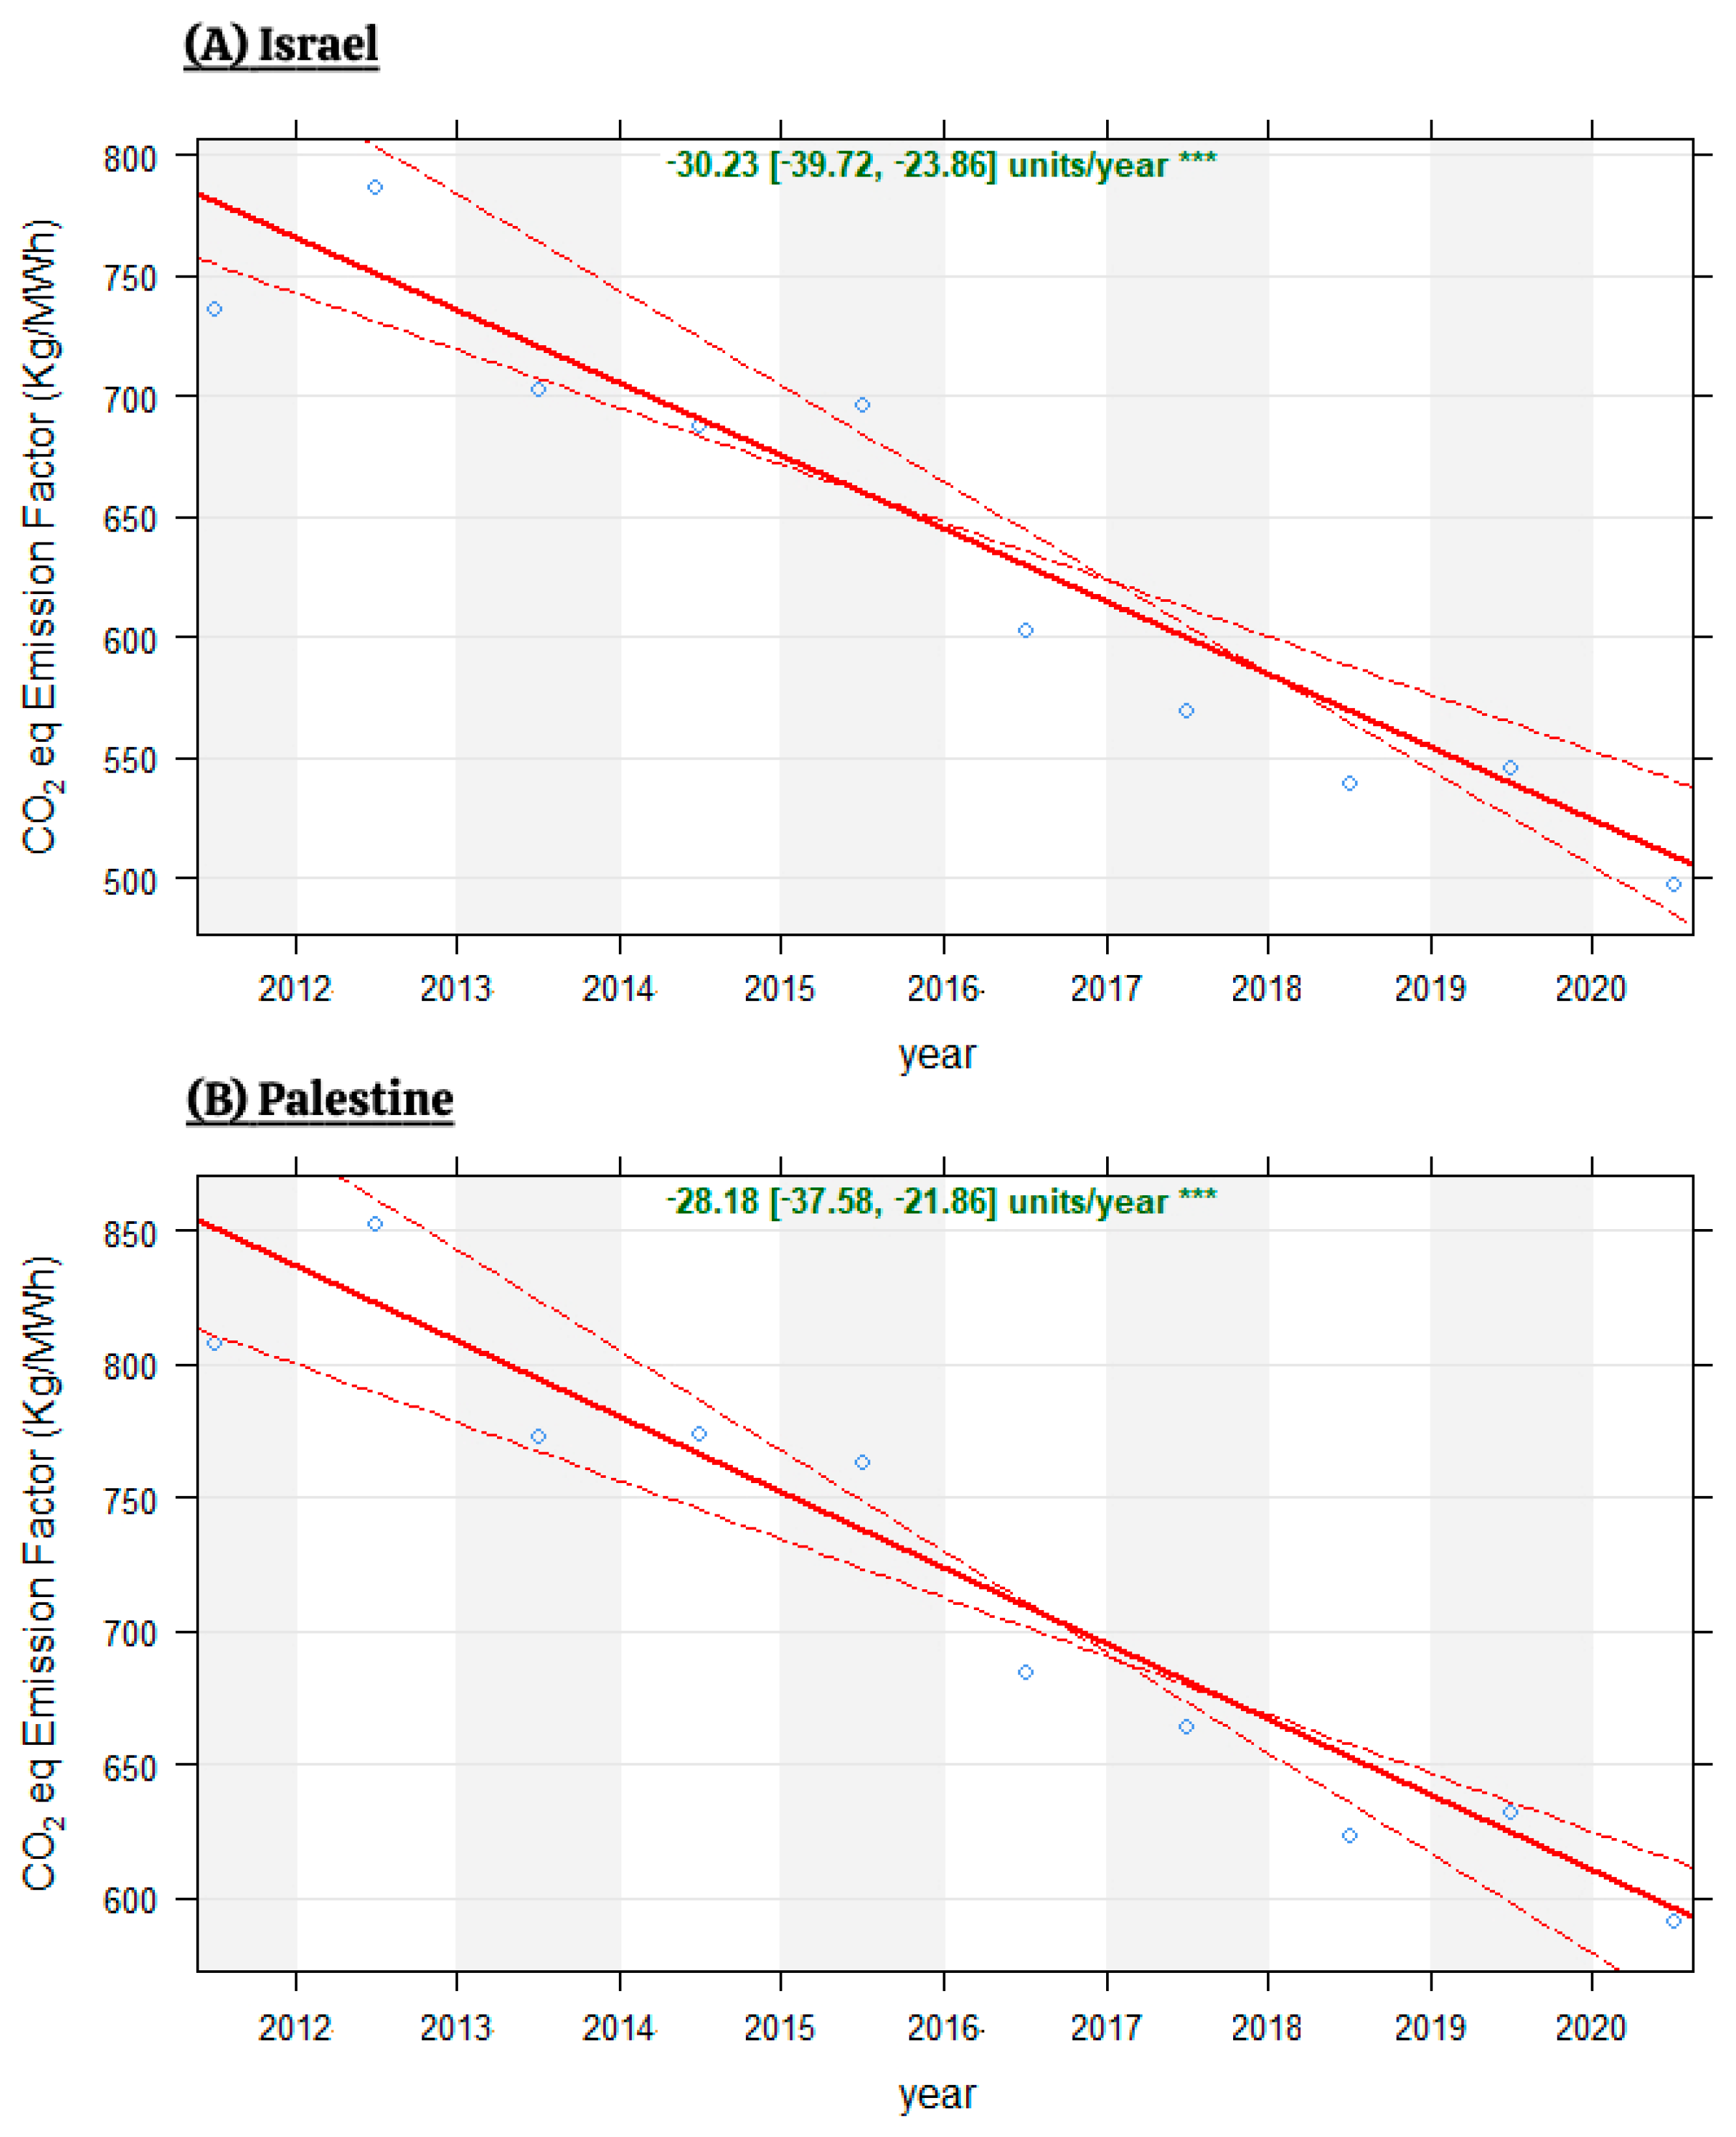
3.2. Electricity
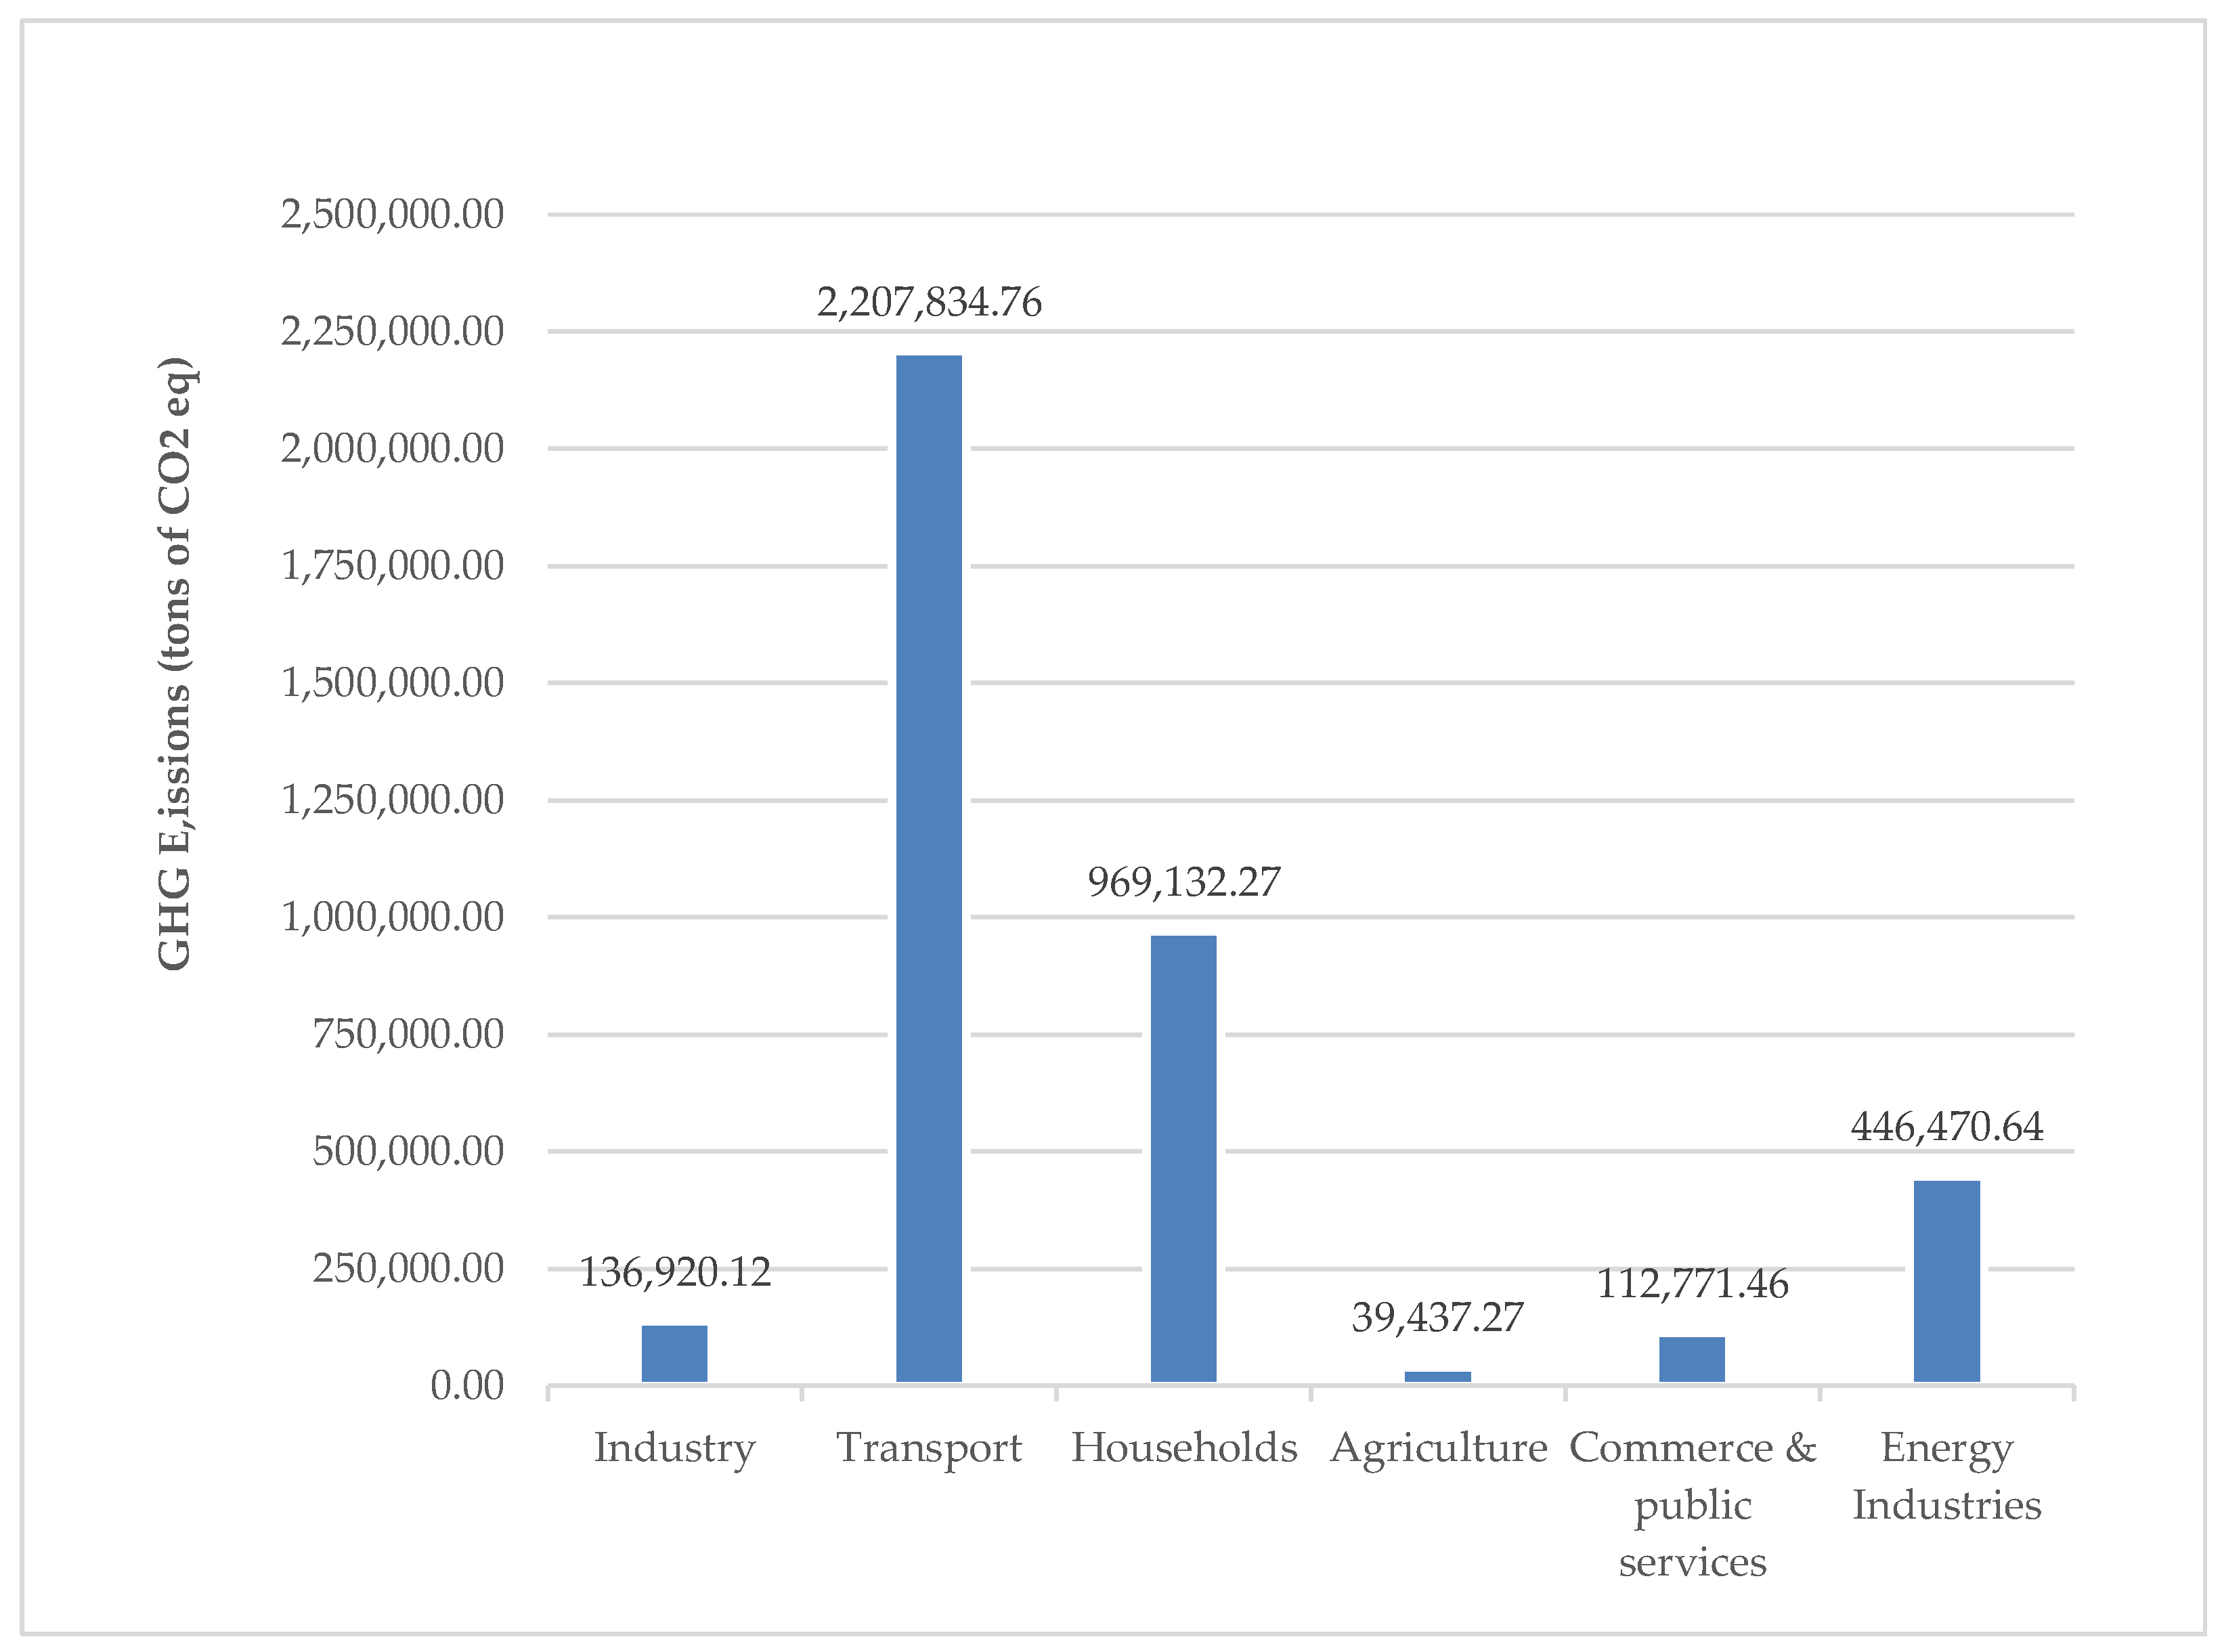
3.3. Total GHGEs
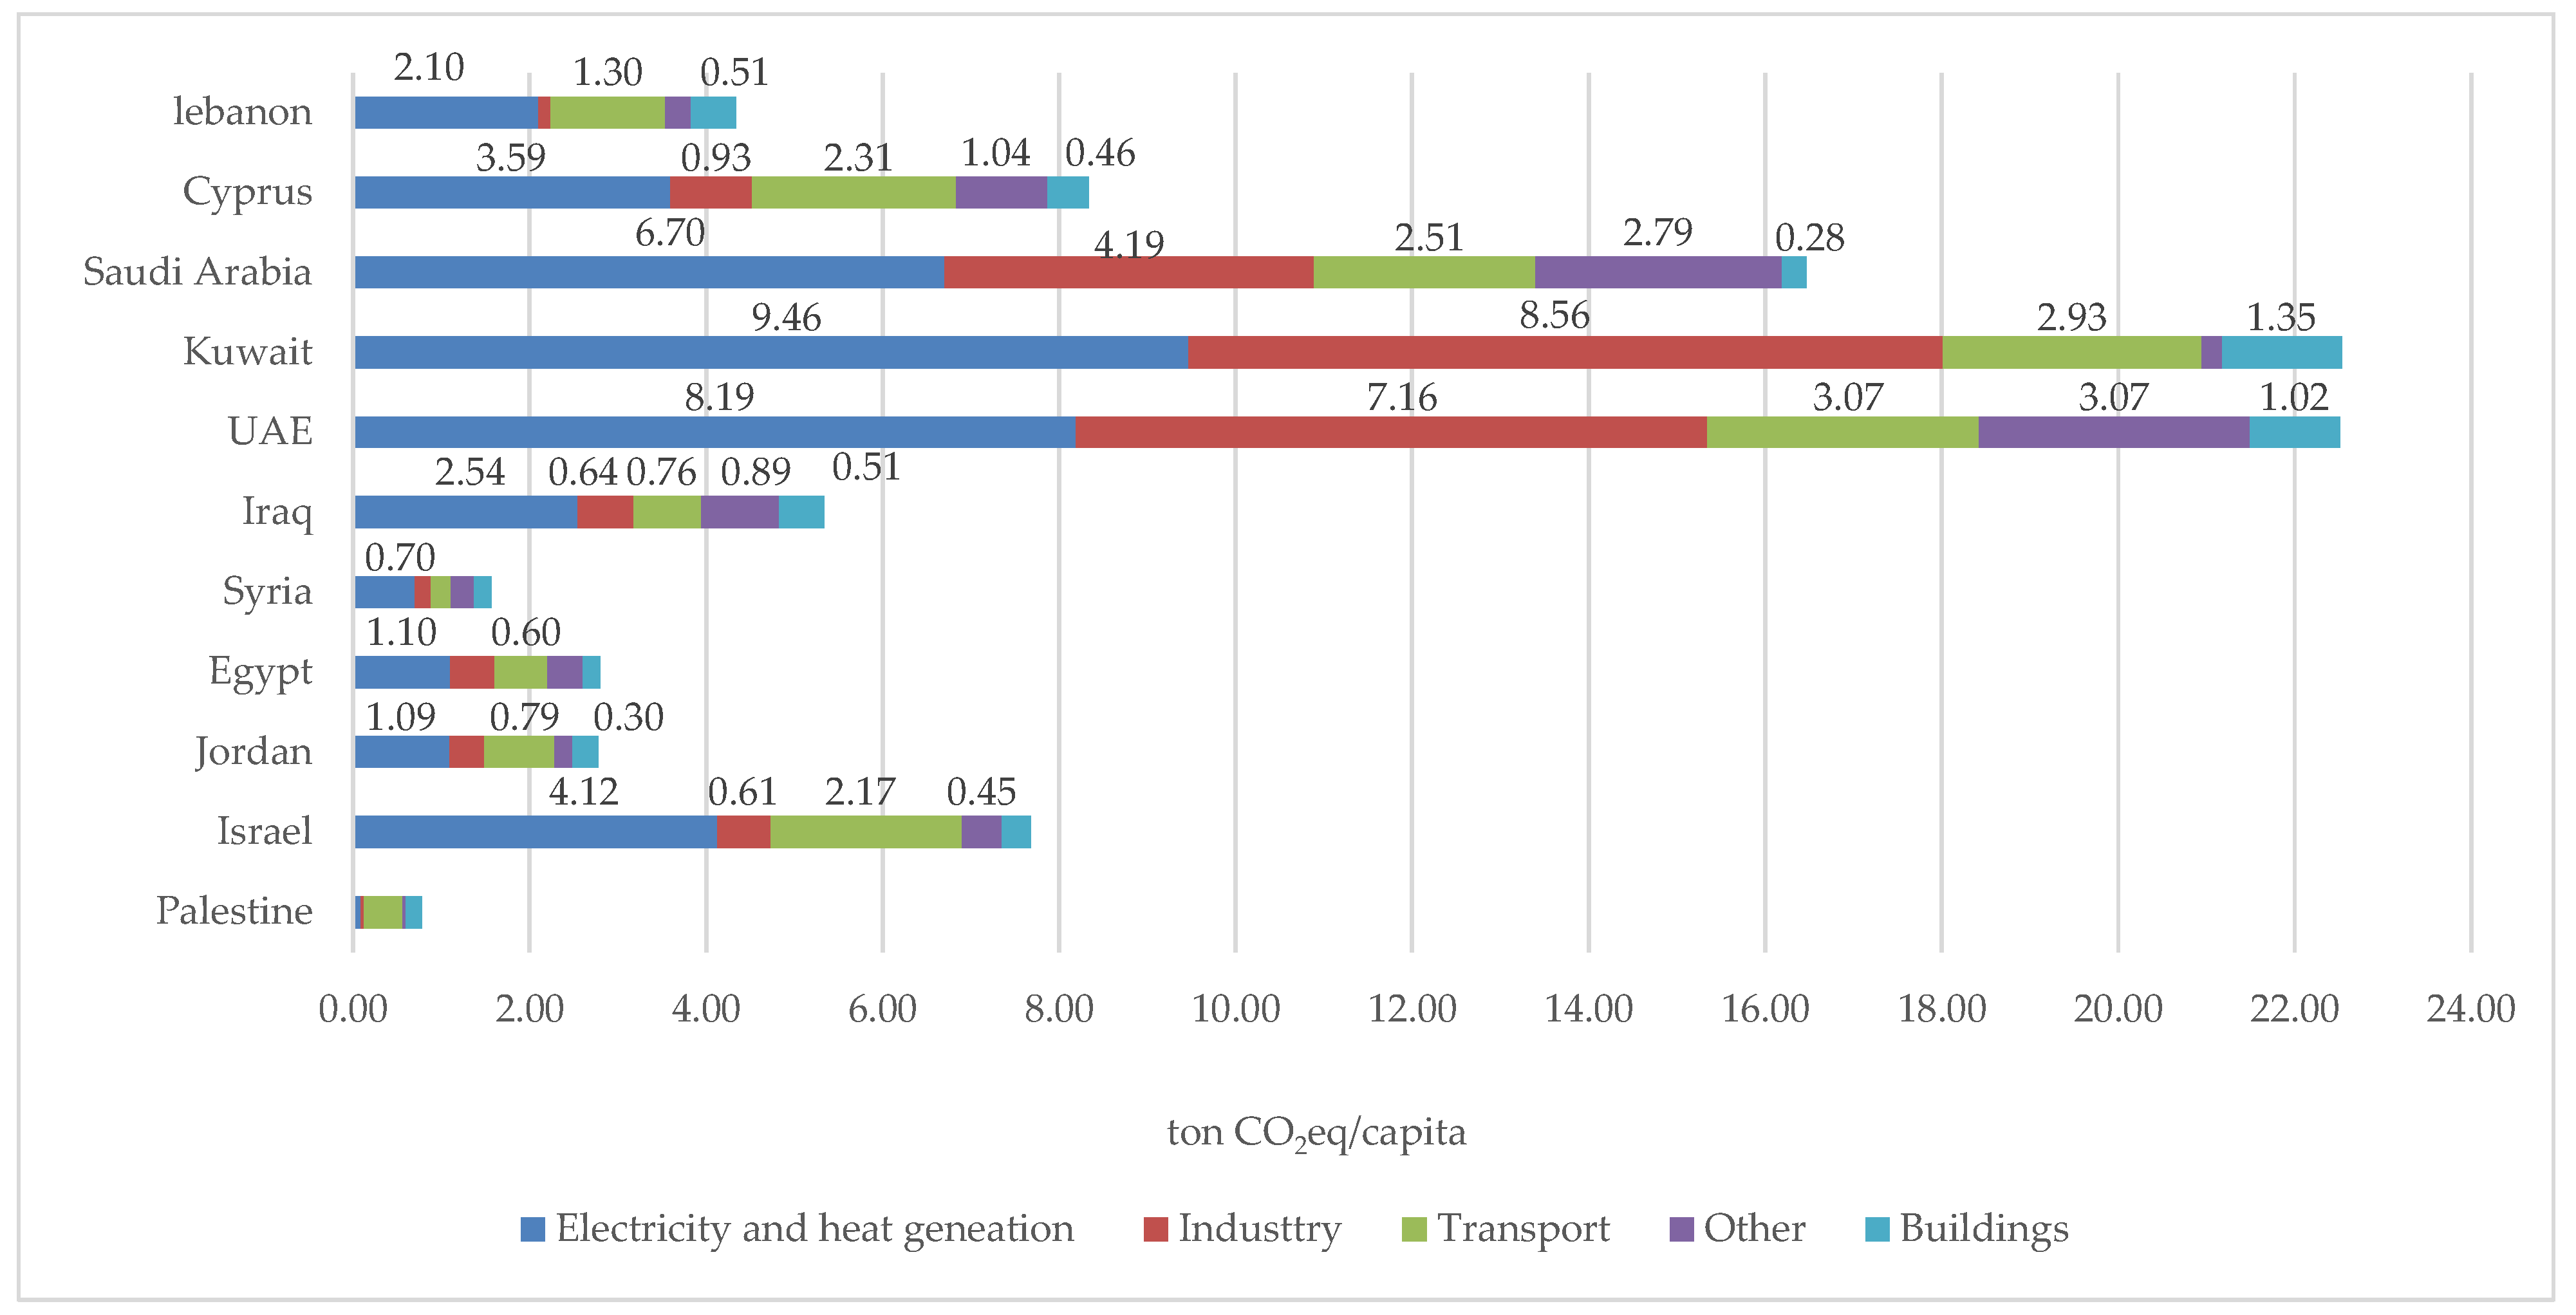
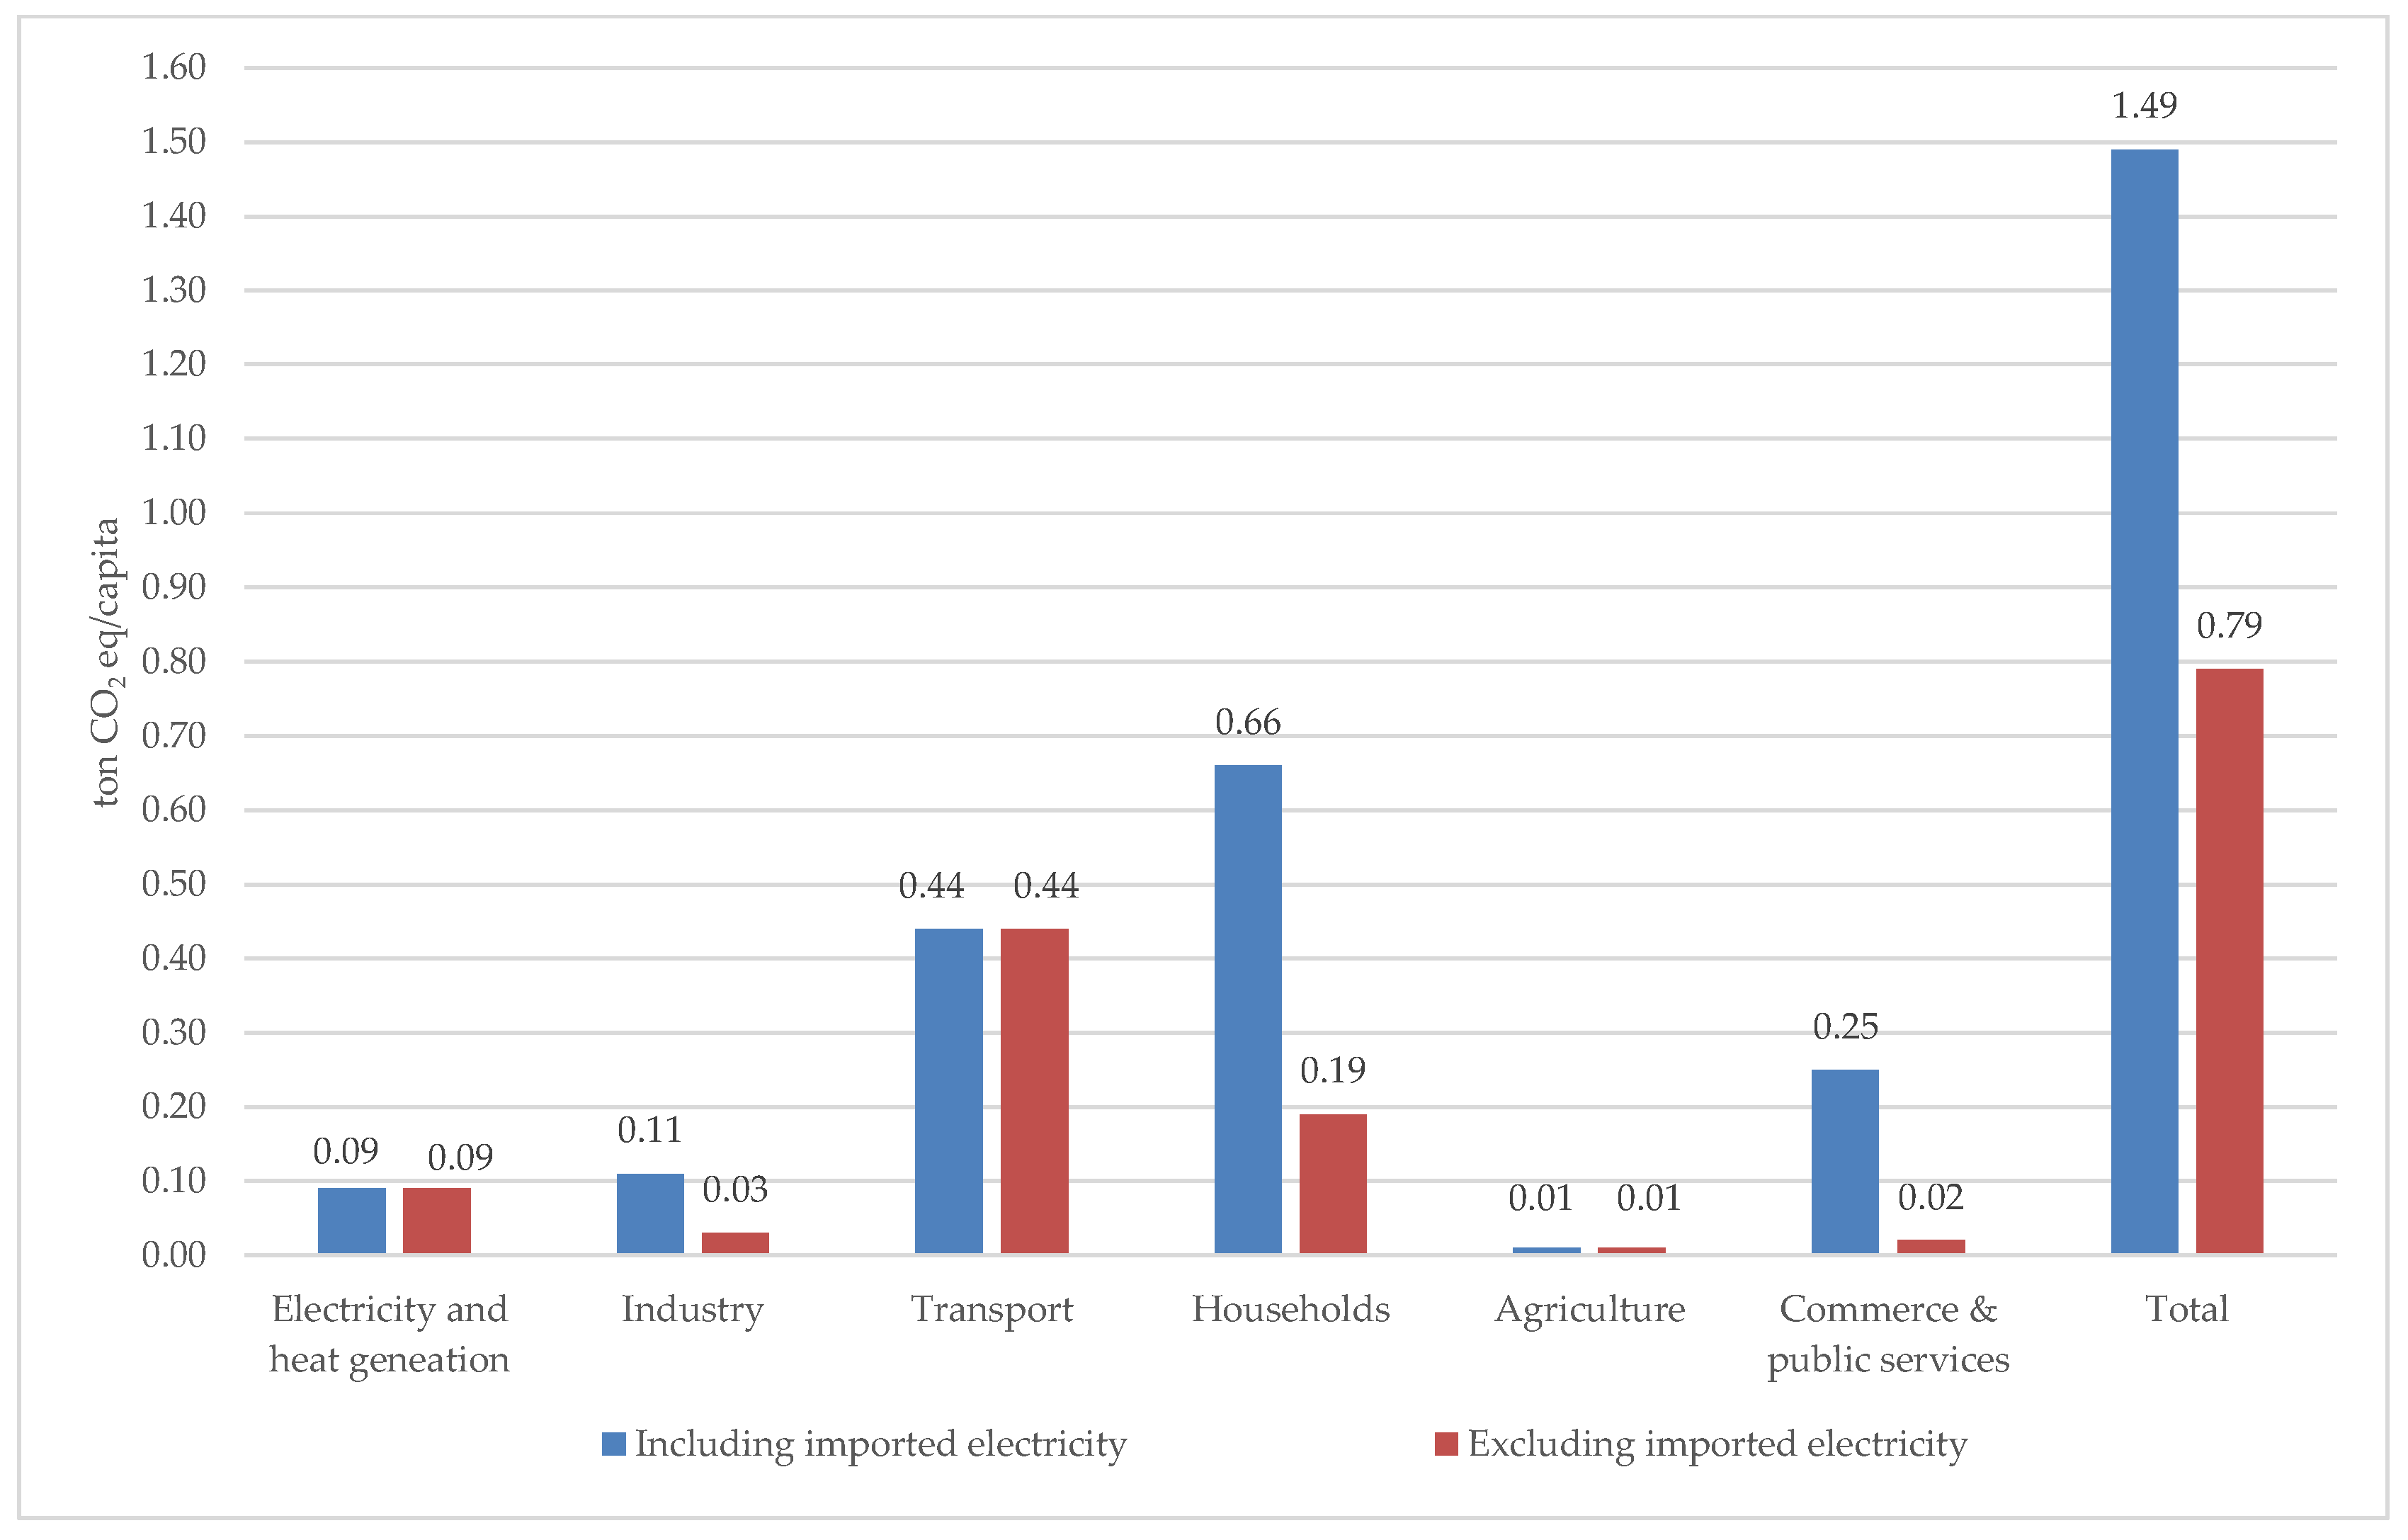
3.4. GHGEs per Capita
4. Conclusions
Author Contributions
Funding
Institutional Review Board Statement
Informed Consent Statement
Data Availability Statement
Conflicts of Interest
References
- Freij, L. Climate Change and the Vulnerable Occupied Palestinian Territories. UCLA J. Environ. Law Policy 2021, 39, 65. [Google Scholar] [CrossRef]
- Kouyakhi, N.R. CO2 Emissions in the Middle East: Decoupling and Decomposition Analysis of Carbon Emissions, and Projection of Its Future Trajectory. Sci. Total Environ. 2022, 845, 157182. [Google Scholar] [CrossRef] [PubMed]
- Imran, M.; Khan, S.; Jambari, H.; Musah, M.B.; Zaman, K. War Psychology: The Global Carbon Emissions Impact of the Ukraine-Russia Conflict. Front. Environ. Sci. 2023, 11, 228. [Google Scholar] [CrossRef]
- Zhang, C.; Hu, Q.; Su, W.; Xing, C.; Liu, C. Satellite Spectroscopy Reveals the Atmospheric Consequences of the 2022 Russia-Ukraine War. Sci. Total Environ. 2023, 869, 161759. [Google Scholar] [CrossRef] [PubMed]
- AL-wesabi, I.; Zhijian, F.; Bosah, C.P.; Dong, H. A Review of Yemen’s Current Energy Situation, Challenges, Strategies, and Prospects for Using Renewable Energy Systems. Environ. Sci. Pollut. Res. 2022, 29, 53907–53933. [Google Scholar] [CrossRef] [PubMed]
- Hainoun, A.; Omar, H.; Almoustafa, S.; Seif-Eldin, M.K.; Meslmani, Y. Future Development of Syrian Power Sector in View of GHG Mitigation Options. Renew. Sustain. Energy Rev. 2014, 38, 1045–1055. [Google Scholar] [CrossRef]
- Hashim, B.M.; Sultan, M.A.; Al Maliki, A.; Al-Ansari, N. Estimation of Greenhouse Gases Emitted from Energy Industry (Oil Refining and Electricity Generation) in Iraq Using IPCC Methodology. Atmosphere 2020, 11, 662. [Google Scholar] [CrossRef]
- Michaelowa, A.; Koch, T. Military emissions, armed conflicts, border changes and the kyoto protocol. Clim. Chang. 2001, 50, 383–394. [Google Scholar] [CrossRef]
- Michaelowa, A.; Koch, T.; Charro, D.; Gameros, C.; Burton, D.; Lin, H.-C. Military and Conflict-Related Emissions: Kyoto to Glasgow and beyond Report; Perspective Climate Group: Breisgau, Germany, 2022. [Google Scholar]
- Qureitem, G.; Al-Khatib, I.A.; Anayah, F. Inventory of Main Greenhouse Gas Emissions from Energy Sector in Palestine. Environ. Monit. Assess. 2020, 192, 63. [Google Scholar] [CrossRef]
- Abu-Madi, M.; Rayyan, M.A. Estimation of Main Greenhouse Gases Emission from Household Energy Consumption in the West Bank, Palestine. Environ. Pollut. 2013, 179, 250–257. [Google Scholar] [CrossRef]
- Hassouna, F.M.A.; Al-Sahili, K. Environmental Impact Assessment of the Transportation Sector and Hybrid Vehicle Implications in Palestine. Sustainability 2020, 12, 7878. [Google Scholar] [CrossRef]
- Hassouna, F.M.A.; Al-Sahili, K. Future Energy and Environmental Implications of Electric Vehicles in Palestine. Sustainability 2020, 12, 5515. [Google Scholar] [CrossRef]
- Hassouna, F.M.A.; Assad, M. Towards a Sustainable Public Transportation: Replacing the Conventional Taxis by a Hybrid Taxi Fleet in the West Bank, Palestine. Int. J. Environ. Res. Public Health 2020, 17, 8940. [Google Scholar] [CrossRef] [PubMed]
- Karaeen, M.; Hasan, A.A.; Hanieh, A.A.; Zorba, M.; Abuhomos, M. On-Road Vehicular Emissions Case of Palestine. In Proceedings of the 2021 12th International Renewable Engineering Conference, IREC 2021, Amman, Jordan, 14–15 April 2021; Institute of Electrical and Electronics Engineers Inc.: Piscataway, NJ, USA. [Google Scholar]
- Palestine Environment Quality Authority. Initial National Communication Report to the United Nation Convention on Climate Change; Palestine Environment Quality Authority: Ramallah, Palestine, 2016. [Google Scholar]
- Elahi, E.; Khalid, Z.; Tauni, M.Z.; Zhang, H.; Lirong, X. Extreme Weather Events Risk to Crop-Production and the Adaptation of Innovative Management Strategies to Mitigate the Risk: A Retrospective Survey of Rural Punjab, Pakistan. Technovation 2022, 117, 102255. [Google Scholar] [CrossRef]
- Elahi, E.; Khalid, Z.; Zhang, Z. Understanding Farmers’ Intention and Willingness to Install Renewable Energy Technology: A Solution to Reduce the Environmental Emissions of Agriculture. Appl. Energy 2022, 309, 118459. [Google Scholar] [CrossRef]
- Solomon, S.; Plattner, G.-K.; Knutti, R.; Friedlingstein, P. Irreversible Climate Change Due to Carbon Dioxide Emissions. Proc. Natl. Acad. Sci. USA 2009, 106, 1704–1709. [Google Scholar] [CrossRef]
- Drouet, J.-L.; Capian, N.; Fiorelli, J.-L.; Blanfort, V.; Capitaine, M.; Duretz, S.; Gabrielle, B.; Martin, R.; Lardy, R.; Cellier, P.; et al. Sensitivity Analysis for Models of Greenhouse Gas Emissions at Farm Level. Case Study of N2O Emissions Simulated by the CERES-EGC Model. Environ. Pollut. 2011, 159, 3156–3161. [Google Scholar] [CrossRef]
- Abbas, A.; Zhao, C.; Waseem, M.; Ahmed khan, K.; Ahmad, R. Analysis of Energy Input–Output of Farms and Assessment of Greenhouse Gas Emissions: A Case Study of Cotton Growers. Front. Environ. Sci. 2022, 9, 826838. [Google Scholar] [CrossRef]
- United Nations High Commissioner for Human Rights. Human Rights Council Forty-Eighth Session: The Allocation of Water Resources in the Occupied Palestinian Territory, Including East Jerusalem; United Nations High Commissioner for Human Rights: Geneva, Switzerland, 2020. [Google Scholar]
- European Union. Six-Month Report on Israeli Settlements in the Occupied West Bank, Including East Jerusalem Reporting Period; European Union: Maastricht, The Netherlands, 2021. [Google Scholar]
- Ramahi, S. The Environmental Impact of Israeli Settlements on the Occupied Palestinian Territories. 2012. Available online: https://www.middleeastmonitor.com/20140511-the-environmental-impact-of-israeli-settlements-on-the-occupied-palestinian-territories/ (accessed on 15 April 2023).
- United Nations Environment Programme. State of Environment and Outlook Report for the Occupied Palestinian Territory 2020; United Nations Environment Programme: Nairobi, Kenya, 2020. [Google Scholar]
- Palestinian Central Bureau of Statistics. Energy Tables and Energy Balance 2019. 2020. Available online: https://www.pcbs.gov.ps/Portals/_Rainbow/Documents/energy2019ArEn.pdf (accessed on 10 December 2022).
- World Bank Groupe. Securing Energy for Development in West Bank and Gaza. 2017. Available online: https://documents1.worldbank.org/curated/en/351061505722970487/pdf/Replacement-MNA-SecuringEnergyWestBankGaza-web.pdf (accessed on 15 October 2022).
- Palestine Environment Quality Authority. The State of Palestine’s First Nationally Determined Contributions (NDCs) “Updated Submission”. 2021. Available online: https://unfccc.int/sites/default/files/NDC/2022-06/Updated%20NDC_%20State%20of%20Palestine_2021_FINAL.pdf (accessed on 10 October 2022).
- Palestinian Energy and Natural Resources Authority. Palestinian Energy and Natural Resources Authority Website. 2023. Available online: http://penra.gov.ps/ (accessed on 3 January 2023).
- Palestinian Central Bureau of Statistics. Annual Energy Tables and Energy Balance. 2022. Available online: https://www.pcbs.gov.ps/site/lang__en/1030/Default.aspx (accessed on 9 February 2023).
- Palestinian Ministry of Transport. Palestinian Ministry of Transport: Statistics. 2022. Available online: http://www.mot.gov.ps/statistics-2/ (accessed on 15 March 2023).
- Palestinian Ministry of Transport. Transport Sector: Annual Statistical Report 2019. 2020. Available online: http://www.mot.gov.ps/wp-content/uploads/Portals/_Rainbow/Documents/Stats/Annual_Repoert2019.pdf (accessed on 20 October 2022).
- Gaza Ministry of Transport. Report on the Achievements of the Ministry of Transport in Gaza Strip. 2019. Available online: https://www.mot.ps/site/2020/02/26/%d8%aa%d9%82%d8%b1%d9%8a%d8%b1-%d8%a5%d9%86%d8%ac%d8%a7%d8%b2%d8%a7%d8%aa-%d9%88%d8%b2%d8%a7%d8%b1%d8%a9-%d8%a7%d9%84%d9%86%d9%82%d9%84-%d9%88%d8%a7%d9%84%d9%85%d9%88%d8%a7%d8%b5%d9%84%d8%a7%d8%aa-2/ (accessed on 15 March 2023).
- Intergovernmental Panel on Climate Change. 2006 IPCC Guidelines for National Greenhouse Gas Inventories. 2006. Available online: https://www.ipcc-nggip.iges.or.jp/public/2006gl/index.html (accessed on 15 March 2022).
- International Renewable Energy Agency. Statistical Profiles. 2022. Available online: https://www.irena.org/Data/Energy-Profiles (accessed on 10 May 2023).
- International Renewable Energy Agency. Palestine Energy Profile. 2022. Available online: https://www.irena.org/-/media/Files/IRENA/Agency/Statistics/Statistical_Profiles/Middle-East/State-of-Palestine_Middle-East_RE_SP.pdf?rev=d73c2ae76f8a48e484705ff50dc77ea1 (accessed on 10 May 2023).
- Israel Ministry of Environmental Protection. System for Recording Greenhouse Gas Emissions in Israel, Operating Regulations and Reporting Guidelines; Israel Ministry of Environmental Protection: Jerusalem, Israel, 2022.
- Gutglick, I.; Nehenia, L.; Mekonen, S.; Aran, M.; Semah, S. Report on the State of the Electricity Sector|2020. 2020. Available online: https://www.gov.il/en/departments/publications/reports/yearly_reports_pua_db_eng (accessed on 9 February 2023).
- Abu Hamed, T.; Ismail, L.; Alshare, A. The Potential of Using Olive Cake in Power Generation in the Palestinian Territories. Int. J. Sustain. Energy 2017, 36, 368–378. [Google Scholar] [CrossRef]
- Khraisha, Y.H. Energetic Study on Jordanian Olive Cake and Woody Biomass Materials. J. Power Energy Eng. 2022, 10, 1–13. [Google Scholar] [CrossRef]
- Tawarah, K.M.; Rababah, R.A. Characterization of Some Jordanian Crude and Exhausted Olive Pomace Samples. Green Sustain. Chem. 2013, 03, 146–162. [Google Scholar] [CrossRef]
- Karaeen, M.; El-Khateeb, I.; Jaradat, A.; Samara, M.; Bannoura, M. Fuel Quality Implications on Combustion Engines in the West Bank Area of Palestine; Palestine Polytechnic University: Hebron, Palestine, 2013. [Google Scholar]
- Palestinian Central Bureau of Statistics. Emissions to Air Tables. 2020; Ramallah—Palestine. 2022. Available online: https://www.pcbs.gov.ps/Portals/_Rainbow/Documents/Emissions_2020_01.html (accessed on 13 November 2022).
- International Energy Agency. Emission Factors 2020 Database Documentation. 2020. Available online: https://iea.blob.core.windows.net/assets/8f05b8a2-e2e4-46a4-a4f9-c03163484501/CO2KWH_Methodology.pdf (accessed on 15 November 2022).
- Krtková, E.; Danielik, V.; Szemesová, J.; Tarczay, K.; Kis-Kovács, G.; Neuzil, V. Non-Energy Use of Fuels in the Greenhouse Gas Emission Reporting. Atmosphere 2019, 10, 406. [Google Scholar] [CrossRef]
- Shikaki, I. The Demise of Palestinian Productive Sectors: Internal Trade as a Microcosm of the Impact of Occupation; Palestine Liberation Organization: Jerusalem, Palestine, 2021. [Google Scholar]
- MoE/UNDP/GEF. Lebanon’s Second Biennial Update Report to the UNFCCC Ministry of Environment Beirut, Lebanon. 2017. Available online: https://unfccc.int/sites/default/files/resource/3490185_Lebanon-BUR2-1-Lebanon%20BURII%202017.pdf (accessed on 5 June 2023).
- Euro-Mediterranean Partnership Unit. Background Note on Energy and Water Issues in Palestine. 2019. Available online: https://www.europarl.europa.eu/meetdocs/2014_2019/documents/dpal/dv/background_note_hala/background_note_halaen.pdf (accessed on 23 November 2022).
- Martin, A.; Barhoum, L.; Dikomitis, E.; Gorevan, D. Israel Tightens Gaza Blockade, Civilians Bear the Brunt Tightening Restrictions. 2018. Available online: https://www.oxfam.org/en/research/israel-tightens-gaza-blockade-civilians-bear-brunt (accessed on 17 March 2023).


| Data | Source | References |
|---|---|---|
| Energy tables 2011–2020 | Palestinian Energy and Natural Resources Authority (PENRA) and Palestinian Central Bureau of Statistics (PCBS) | [29,30] |
| Transportation and communications statistics 2011–2020 | Palestinian Ministry of Transport in The West Bank and Gaza Strip (MoT) | [31,32,33] |
| IPCC default emission factors | The 2006 IPCC guidelines for National Inventories | [34] |
| Per capita electricity generation | International Renewable Energy Agency (IRENA) | [35,36] |
| CO2 emission factor for electricity and heat generation | ||
| Emission factors for electricity generation and fuel combustion in Israel | Israel Ministry of Environmental Protection | [37,38] |
| Guidelines for reporting GHGE | ||
| Fuel quality in gas stations in Palestine (e.g., density and calorific values) | Published literature | [39,40,41,42] |
| Gas | CO2 (Kg/TJ) | N2O (Kg/TJ) | CH4 (Kg/TJ) |
|---|---|---|---|
| Diesel | 74,100 | 0.6 | 3 |
| Gasoline | 69,300 | 0.6 | 3 |
| Year | Amount of Generated Electricity (MWh) | Emission Factors of Electricity Generation in Palestine (kg/MWh or g/kWh) | GHG Emissions (ton CO2eq) | Per Capita Electricity Generation (kWh/Capita) | ||
|---|---|---|---|---|---|---|
| CO2 | CH4 | N2O | ||||
| 2011 | 569,332 | 659 | 0.0270 | 0.0050 | 376,422 | 138 |
| 2012 | 461,112 | 640 | 0.0260 | 0.0050 | 296,098 | 109 |
| 2013 | 537,097 | 634 | 0.0260 | 0.0050 | 341,669 | 124 |
| 2014 | 336,587 | 699 | 0.0290 | 0.0060 | 236,120 | 76 |
| 2015 | 505,367 | 614 | 0.0250 | 0.0050 | 311,364 | 112 |
| 2016 | 494,574 | 644 | 0.0260 | 0.0050 | 319,564 | 107 |
| 2017 | 500,852 | 701 | 0.0280 | 0.0060 | 352,343 | 106 |
| 2018 | 360,427 | 644 | 0.0260 | 0.0050 | 232,886 | 74 |
| 2019 | 691,279 | 643 | 0.0261 | 0.0052 | 446,015 | 139 |
| 2020 | 661,556 | 633 | 0.0260 | 0.0050 | 420,181 | 130 |
| Year | Emission Factors of Electricity Consumption in Palestine (kg/MWh or g/kWh) | ||
|---|---|---|---|
| CO2 | CH4 | N2O | |
| 2011 | 804 | 0.0153 | 0.0094 |
| 2012 | 848 | 0.0175 | 0.0104 |
| 2013 | 769 | 0.0142 | 0.0087 |
| 2014 | 770 | 0.0133 | 0.0092 |
| 2015 | 760 | 0.0132 | 0.0089 |
| 2016 | 681 | 0.0192 | 0.0080 |
| 2017 | 662 | 0.0128 | 0.0060 |
| 2018 | 621 | 0.0113 | 0.0065 |
| 2019 | 630 | 0.0121 | 0.0065 |
| 2020 | 589 | 0.0119 | 0.0049 |
| GHG | Emissions (ton) | Tons of CO2eq | Percentage (%) |
|---|---|---|---|
| CO2 | 7,259,947.38 | 7,259,947.38 | 98.16% |
| N2O | 302.29 | 90,082.42 | 1.22% |
| CH4 | 1835.84 | 45,896.00 | 0.62% |
| Total | 7,395,925.80 | 100.00% | |
Disclaimer/Publisher’s Note: The statements, opinions and data contained in all publications are solely those of the individual author(s) and contributor(s) and not of MDPI and/or the editor(s). MDPI and/or the editor(s) disclaim responsibility for any injury to people or property resulting from any ideas, methods, instructions or products referred to in the content. |
© 2023 by the authors. Licensee MDPI, Basel, Switzerland. This article is an open access article distributed under the terms and conditions of the Creative Commons Attribution (CC BY) license (https://creativecommons.org/licenses/by/4.0/).
Share and Cite
Jafar, H.A.; Shahrour, I.; Mroueh, H. Evaluation of Greenhouse Gas Emissions in Conflict Areas: Application to Palestine. Sustainability 2023, 15, 10585. https://doi.org/10.3390/su151310585
Jafar HA, Shahrour I, Mroueh H. Evaluation of Greenhouse Gas Emissions in Conflict Areas: Application to Palestine. Sustainability. 2023; 15(13):10585. https://doi.org/10.3390/su151310585
Chicago/Turabian StyleJafar, Hanan A., Isam Shahrour, and Hussein Mroueh. 2023. "Evaluation of Greenhouse Gas Emissions in Conflict Areas: Application to Palestine" Sustainability 15, no. 13: 10585. https://doi.org/10.3390/su151310585
APA StyleJafar, H. A., Shahrour, I., & Mroueh, H. (2023). Evaluation of Greenhouse Gas Emissions in Conflict Areas: Application to Palestine. Sustainability, 15(13), 10585. https://doi.org/10.3390/su151310585