Abstract
The study aimed to investigate Gen Z’s intentions to utilize the Waze mobile application as a solution for sustainable traffic management in Metro Manila. The extended technology acceptance model (TAM) was used to define user behavior and technology usage to determine the factors influencing Filipino drivers’ acceptance of the Waze application. The study utilized a survey given to 300 Filipino drivers travelling within the National Capital Region to accurately measure various factors and their connections to usage intention and actual use. The analytical approach used for this investigation was partial least squares structural equation modelling (PLS-SEM). The study’s data results revealed that system quality, perceived location accuracy, perceived usefulness, and perceived ease of use affect Gen Z’s intentions to use traffic navigation applications, particularly Waze. The study’s results can be applied as a theoretical framework for future researchers of Waze mobile applications, Waze route accuracy, and Waze overall application performance, as well as the features of the Waze application, to evaluate how the use of the Waze mobile application could help in the effective management of traffic situations in Metro Manila. The study assessed the effectiveness of the Waze navigation app as a platform for efficiently managing traffic situations in Metro Manila and highlighted the application performance of Waze and its acceptance by Gen Z users in Metro Manila. The study also highlighted the need a critical review of Waze’s application performance. The study recommends that similar future studies must consider samples from a more diverse geographic backgrounds to obtain a more accurate representation of Filipino users. Future researchers are also advised to adopt a qualitative research design to gain more detailed insights into Filipinos regarding their experience with the Waze application.
1. Introduction
Sustainable traffic management effectively manages traffic flow and reduces the negative environmental impacts of transportation systems. This involves implementing strategies and initiatives that prioritize sustainability and promote more eco-friendly modes of transportation [1]. According to Diliman [2], traffic navigation apps can reduce travel time, fuel consumption, and greenhouse gas emissions in promoting sustainable traffic management while improving safety and mobility.
Traffic congestion has been a perennial issue throughout cities in the Philippines, and Metro Manila is the best example. This circumstance has resulted in negative feedback about transportation safety and mobility in the Philippines. According to the annual traffic index, Metro Manila ranked 18th as the most congested city globally, with an average congestion level of 43% in 2021 [3]. The poor mass public transportation system and extreme traffic volumes consume 30% of residents’ time daily; this time could be used more productively. Palmiano et al. [4] pointed out that since the locations of new commercial developments in Metro Manila mainly follow the expansions of the urban transportation system, it is necessary to plan and control the developments more carefully.
Considering the traffic situation in Metro Manila, most Filipino drivers have equipped themselves with mobile navigation applications to help them reach their destination and avoid traffic jams. Waze is one of the country’s most popular navigation and traffic apps and it provides real-time information to drivers, and understanding its features and functionalities can have both practical and academic significance [5]. A study by Noerkaisar et al. [6] found that a traffic navigation app such as the Waze app helps drivers navigate the city’s complex road network and improves their overall travel experience. According to Silva et al. [7], Waze data can provide valuable insights into traffic patterns and help traffic managers make more informed decisions. A study by Laor and Galily [8] examined user behavior and motivations in using Waze and found that Waze users were motivated by convenience, time savings, and the sense of community that comes with crowdsourcing traffic data.
The Philippines, mainly in metropolitan areas such as Manila, faces severe traffic congestion [9]. Thus, studying traffic navigation apps in the Philippines holds significant importance. Studying traffic navigation apps can provide insights into their effectiveness in managing and alleviating traffic congestion. Understanding these apps’ features, functionalities, and user behaviors can contribute to developing targeted solutions to mitigate congestion and optimize traffic flow.
Several studies have explored the motivations behind the acceptance and usage of the Waze app. According to research, the app’s ability to provide real-time traffic information, including route optimization, traffic congestion alerts, and alternative route suggestions, motivates users [10]. According to Shaheen et al. [11], users value the app’s ability to save time, reduce stress, and improve the transportation experience. In addition, traffic navigation applications have the potential to enhance commuter efficiency by providing real-time traffic updates, recommending alternate routes, and optimizing travel times [12]. Based on a study by Cheng et al. [13], by analyzing these applications, researchers and transportation authorities can identify patterns, analyze data, and devise strategies to improve commuting efficacy, reduce travel times, and mitigate commuter congestion-related inconveniences.
Researchers can gain insights into users’ motivations, attitudes, and behaviors related to the app by applying the technology acceptance framework to studying Waze app acceptance. The model helps identify critical factors influencing app acceptance, such as perceived usefulness and ease of use, while considering external factors that may mediate or moderate these relationships [14]. This understanding can inform app developers, policymakers, and researchers in improving the app’s features, addressing user concerns, and promoting higher acceptance and usage levels among target users [15].
Several academic works have covered the evaluation of the acceptance of the Waze app. One broadly used model is the technology acceptance model (TAM). The TAM is a dependable paradigm for analyzing the acceptability of new technologies [16] and delineating user behavior and technology utilization [17]. A study applied the TAM to an examination of Malaysian drivers’ intentions to use the Waze app in Malaysia. The research found that perceived usefulness and ease of use significantly influenced users’ intentions to adopt the app. Additionally, subjective norms and social influence were identified as significant factors influencing users’ attitudes and preferences [18]. In China, another study explored the determinants of drivers’ intentions to use mobile navigation applications, including Waze. The TAM was extended to include additional factors such as trust, perceived risk, and personal innovativeness. The findings indicated that perceived usefulness, perceived ease of use, and trust significantly influenced drivers’ intentions to use mobile navigation apps [19]. In Thailand, a study utilized the TAM framework and included additional factors such as personal innovativeness, perceived enjoyment, and compatibility. The results showed that perceived usefulness, perceived ease of use, and compatibility significantly affected users’ intentions to use the Waze app [20]. In Taiwan, a study applied the TAM and found that perceived usefulness and perceived ease of use greatly influenced users’ intention to use mobile navigation apps. User satisfaction was also identified as an essential factor affecting users’ attitudes and continued usage [21]. The findings of prior studies highlight the significance of perceived usefulness and perceived ease of use in driving users’ intentions to adopt and use these apps. Although several studies exist investigating the factors affecting the Waze app’s acceptance, minimal studies are found integrating system quality and perceived location accuracy in the TAM model.
Given this condition, this research aimed to assess whether the Waze navigation app is an effective platform for efficiently managing traffic situations in Metro Manila. This study also highlighted the application performance of Waze and its acceptance to Gen Z drivers in Metro Manila. Furthermore, the study highlights the need to critical review the application performance of Waze.
2. Conceptual Framework
The TAM is a reliable model for examining the acceptability of new technologies [16] and defining user behavior and technology usage [17]. Because the TAM was frequently investigated in the context of other technologies unrelated to traffic navigation applications, the present study intends to explore other constructs related to driver acceptability by extending the fundamental TAM. First, the independent variables from the original TAM (perceived usefulness (PU) and perceived ease of use (PE)) were chosen to indicate consumers’ intention to use the traffic navigation application. In this study, it is assumed that if traffic navigation apps are valuable in the eyes of the user, the user will also believe that the applications are simple to use and will eventually plan to utilize them. The two parameters that have the most significant impact on user approval are attitude (AT) and perceived usability (PU) [22]. Additionally, if the users believe that the traffic navigation applications are simple to use, meaning that they can be quickly launched while they are in the driver’s seat, and if the interaction process with the human–machine interface is straightforward and beneficial for a driving experience, the users will demonstrate a positive attitude and a high likelihood of accepting the applications. However, this study was limited to the actual use variable because it was outside the purview of the study, and traffic navigation applications are currently not fundamental parts of all vehicle types. As the model’s target variable, the intention to utilize traffic navigation apps (BI) was chosen to represent users’ or drivers’ actual system usage.
Using the extended technology acceptance model (TAM), this study explored the variables affecting Gen Z’s behavior intentions to use traffic navigation applications, particularly Waze. As shown in Figure 1, the suggested model identifies seven variables: system quality (SQ), perceived location accuracy (PLA), perceived usefulness (PU), perceived ease of use (PEU), usage intention (UI), and actual use (AU).
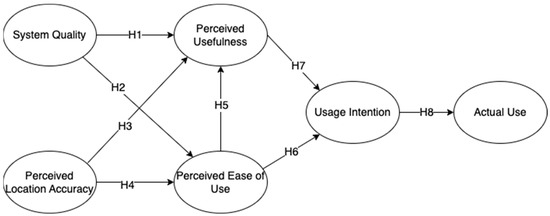
Figure 1.
Conceptual framework based on extended technology acceptance model.
System quality is often based on an information-system’s accuracy, comprehensiveness, timeliness, and presentation format [23]. According to prior research on drivers’ responses to traffic information, these attributes are the key factors determining traffic information quality. As Ben-Elia et al. [24] demonstrated, giving travelers accurate information can enhance the compliance rate. A user’s view of the usefulness increases when reliable information is available to aid decision-making and better travel planning. Several studies have also proved the significant impact of system quality on the perceived usefulness of Waze apps. For instance, Nguyen [25] found the importance of system quality in shaping users’ perceptions of the usefulness and usability of the Waze app. The study found that a well-designed and user-friendly app with intuitive navigation and clear instructions enhanced the perceived usefulness of the app.
Similarly, Khoo and Asitha [26] found that users heavily rely on traffic navigation apps or accurate and up-to-date information. Users perceive the app as more useful if the app consistently provides reliable information about traffic conditions, road closures, and alternative routes. Earlier investigations also corroborated these connections [27]. Thus, it was hypothesized that:
Hypothesis 1 (H1).
System quality has a significant and positive effect on perceived usefulness.
Hypothesis 2 (H2).
System quality has a significant and positive effect on perceived ease of use.
According to Peeta, Ramos, and Pasupathy [28], providing travelers with the location of the accident, projected delay, and best detour option is more beneficial than providing information on location alone. Thus, perceived location accuracy is another prerequisite for the effectiveness of traffic information systems. Park et al. [29] defined perceived location accuracy as the extent to which mobile map service users become aware of their exact locations on displayed maps. Users of mobile map services can view the maps to see where they are right now as well as their surroundings. The systems and services should also provide precise user-positions by calculating and supplying locational information immediately because most mobile-device map systems give their services in real-time. According to prior research, the Waze app’s perceived location accuracy can significantly impact its perceived usefulness [18]. When users evaluate the usefulness of a navigation app such as Waze, they heavily rely on the accuracy of the location information provided. A study by Yamsaengsung and Papasratorn [20] also found that users expect the Waze app to provide accurate routing suggestions based on location. If the perceived location accuracy is high, users are more likely to trust the routing suggestions offered by the app. They perceive the app as more useful when it consistently provides accurate and reliable routes, helping them navigate efficiently and reach their destinations on time. Therefore, users will likely consider mobile map systems and services more valuable if they have superior locational accuracy and efficiency. As a result, this study hypothesized that:
Hypothesis 3 (H3).
Perceived location accuracy has a significant and positive effect on perceived usefulness.
Hypothesis 4 (H4).
Perceived location accuracy has a significant and positive effect on perceived ease of use.
Perceived ease of use refers to users’ perceptions of how easy it is to understand and use the Waze app [30]. This relates to ideas such as legibility, understandability, and ease of learning when describing how drivers respond to traffic information. Usage intention is positively impacted by perceived ease of use. An app that is simple to use will take less time and effort to process. The driver’s ability to use the knowledge quickly and shift their attention to other driving activities will help them perform better [31]. Based on studies, researchers can assess users’ perceptions of the app’s ease of use by examining the app’s design, navigation instructions, voice prompts, and overall user experience [32]. According to Zhang and Adipat [33], usability testing and user feedback can also provide insights into users’ comfort levels and ease of interaction with the app. Previous research on drivers’ acceptance of road guidance systems [34,35,36] supports this finding. As a result, this study hypothesized that:
Hypothesis 5 (H5).
Perceived ease of use has a significant and positive effect on perceived usefulness.
Hypothesis 6 (H6).
Perceived ease of use has a significant and positive effect on usage intention.
Perceived usefulness is the degree to which drivers believe traffic navigation will help them plan their travels [37]. Relevance was one of the most prevalent measures of the use of traffic information in earlier studies on its effects [38]. It was demonstrated that traffic data are significant if they directly affect other road-users’ behavior. According to a study, when users perceive an app as useful, they are more likely to develop positive attitudes towards it and exhibit a higher intention to use it. A study by Wang et al. [39] revealed that perceived usefulness directly influences users’ intentions to adopt and use the Waze app. Accordingly, Khoo and Asitha [26] found that users who perceive the app as valuable and beneficial in providing accurate navigation, real-time traffic updates, and efficient route suggestions are more likely to express a higher intention to use the app regularly. Several studies also support this finding. As a result, this study hypothesized that:
Hypothesis 7 (H7).
Perceived usefulness has a significant and positive effect on usage intention.
The TAM posits that behavioral intentions to use a technology impact actual usage [40]. Based on studies, researchers can examine users’ intentions to use the Waze app by measuring their attitudes, intentions, and willingness to adopt it. According to Wang et al. [39], usage intention influences whether users decide to download and adopt the Waze app in the first place and supposes individuals intend to use the app positively by desiring accurate real-time traffic information or efficient navigation. In that case, they are more likely to install and use it on their devices. As a result, this study hypothesized that:
Hypothesis 8 (H8).
Usage intention has a significant and positive effect on actual use.
3. Methodology
3.1. Setting
Due to the continuous growth in the numbers of Waze users in the Philippines, this study employed a convenience sampling technique. This technique was suitable for this study because it uses convenience as the primary basis for selecting the sample for a large population [41]. The target respondents of this research were the Waze application users travelling within the National Capital Region.
3.2. Participants and Sampling Technique
This study used a non-probability sampling technique, specifically convenience sampling, through an online survey. The aim was to gather responses from Waze users in the National Capital Region. As per Yamane’s research [42], which recommends a minimum sample size of 300 to achieve a 10% margin of error, the expected minimum number of respondents was 300. The summary of the demographic profile is shown in Table 1. Among the respondents, the majority were male (52.3%), between 18 and 19 years of age (79.3%), and had finished college or had a graduate degree. Most of the respondents had used the Waze app for less than a year (44.3%).

Table 1.
Demographic profile.
3.3. Instrumentation
A self-administered approach was utilized to conduct the online survey, which involved distributing the questionnaire via Google Forms. This method enabled the respondents to answer the questions independently, without any assistance from the researchers. The questionnaire was designed using multiple cross-sectional designs, allowing a broader range of data to be collected.
The survey link was sent to the intended participants for two months, from October 2022 to December 2022. This provided ample time for the respondents to complete the questionnaire at their convenience, ensuring a higher response rate. The online survey was presented in English, the preferred language of the target respondents.
The survey consisted of 30 item-questions. The respondent’s demographics were determined in the first section of the questionnaire using 6 item-questions, including age, gender, civil status, area of residence, and how long they have been using the Waze app.
The second part of the questionnaire consisted of the indicators based on the extended TAM model: system quality, perceived location accuracy, perceived usefulness, and perceived ease of use. These measured users’ perceived intention to use the Waze app. The survey consisted of item questions where all answers were on a 5-point Likert scale ranging from “strongly disagree” to “strongly agree”. Six latent variables were used in the survey. The summary of measures and constructs is shown in Table 2. The items for the constructs were adopted from existing studies.
Table 2.
Construct and measurement items.
The questionnaire was briefly discussed with each respondent, and written consent was obtained. Following the Data Privacy Act or Republic Act No. 10173 in the Philippines, the respondents were asked to sign a consent form stating that the responses and information given would only be used for academic and research purposes. Before collecting data, the researchers also asked the Mapua University Research Ethics Committee for permission (application number FM-RC-21-89).
3.4. Data Analysis
The data that were collected from the survey were analyzed using multivariate analysis. In this study, the structural equation model (SEM) used is a variance-based partial least squares SEM (PLS-SEM) with maximum likelihood estimation. PLS-SEM is a tool for studying the relationships between abstract ideas [52]. It deals with complex constructs with higher levels of abstraction and produces higher construct reliability and validity, which makes it great for prediction [53] and valuable in this study. Its main goal is to explain the variation in the dependent constructs as much as possible. The data quality is also judged based on the properties of the measurement model. According to Ouellette and Wood [54], PLS-SEM differs from previous modelling approaches since it considers both direct and indirect effects on presumptive causal links and is increasingly found in scientific investigations and studies. In addition, PLS-SEM is the best method for producing new theories and making predictions, while CB-SEM is better for testing and proving existing theories [53]. Several fit indices were utilized to justify the model fit in this study using PLS-SEM, such as standardized root mean square residual (SRMR), normal fit index (NFI), and chi-square. For SRMS, a value of less than 0.08 is considered a good fit [55]. For NFI, according to Baumgartner and Homburg [56], a value of 0.80 and above represents an acceptable fit, while for chi-square, a value below 5.0 indicates a well-fitting model.
4. Results and Findings
Figure 2 represents the model used to explore the variables that affect Filipinos’ behavioral intention to use the Waze mobile application. The model is composed of 6 latent variables and 35 indicators for which factor loading, reliability, and validity results are presented in Table 3. Before structural equation modelling was carried out, a validity and reliability test was done to ensure that the gathered data were sound and replicable and that the results were accurate [57]. The study utilized Cronbach’s alpha, composite reliability, and average variance extracted tests to assess data sets’ reliability and internal consistency in behavioral intention models [58]. According to Hamid et al. [59], the desired value for composite reliability and Cronbach’s alpha was between 0.60 and 0.70. In contrast, for the average variance extracted test, a value of at least 0.50 is recommended [60]. As indicated in Table 3, all values satisfied the conditions of each test; therefore, each construct from this model can be considered valid and reliable.
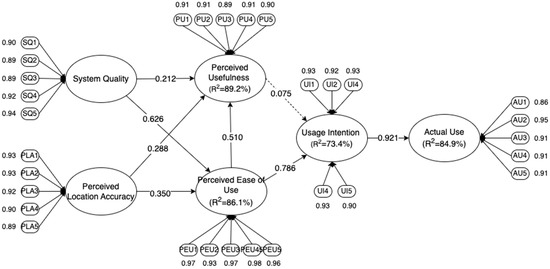
Figure 2.
Final SEM model.
Table 3.
Reliability and convergent validity result.
As Henseler et al. [61] recommended, the Fornell–Lacker criterion and the heterotrait–monotrait ratio of correlation were performed to prove the significant correlation between each factor discussed in the study. Discriminant validity measures the degree of differences between the overlapping constructs [62]. Henseler et al. [61] added that the heterotrait–monotrait ratio (HTMT) could achieve higher specificity and sensitivity rates in determining discriminant validity, followed by the Fornell–Lacker criterion. As presented in Table 4 and Table 5, the values were within the desired range, indicating satisfactory and discriminant validity. Hence, the overall results among the constructs are valid.
Table 4.
Discriminant Validity: Fornell–Larcker Criterion.
Table 5.
Discriminant validity: heterotrait–monotrait ratio.
In testing the proposed hypotheses of this study, partial least squares structural equation modelling (PLS-SEM) was performed using SmartPLS v3.3.3. According to Hair [62], PLS-SEM is a standard approach for analyzing complex inter-relationships between observed and latent variables. Researchers prefer this modelling for estimating complex models and the method’s flexibility regarding data requirements and measurement specifications [52].
Table 6 display the outcomes of an internal model evaluation based on the coefficient of determination (R2) and predictive relevance (Q2). The R2 values for actual use, perceived ease of use, perceived usefulness, and usage intention were 0.849, 0.861, 0.928, and 0.734, respectively. In addition, the data analysis revealed that the Q2 values of all endogenous constructs were more significant than zero, indicating a satisfactory predictive relevance [52].
Table 6.
Coefficient of determination and predictive relevance.
The goodness-of-fit calculation, as shown in Table 7, yielded a GoF value of 0.841, which was substantially greater than 0.36; the model’s high goodness-of-fit can be confirmed following the study of Akter et al. [63].
Table 7.
The goodness-of-fit of the model calculation.
Table 8 demonstrates that all effect size values of exogenous constructs on endogenous constructs were acceptable, having values more than 0.02. The results of the hypothesis test are also presented in Table 8. Out of eight proposed hypotheses, seven were proven to significantly affect the Waze application’s usage behavior and behavioral intentions. Furthermore, all seven accepted hypotheses positively influenced perceived usefulness, perceived ease of use, usage intention, and actual use.
Table 8.
Hypothesis test results.
Presented in Figure 2 is the final SEM model; no indicator was removed from the model as it exceeded the 0.50 minimum value explained by Hair [62]. In assessing the validity of the suggested model, a model fit analysis was performed consisting of SRMR, chi-square, and NFI, using the parameters from a study by Hu and Bentler [55]. As shown in Table 9, all parameter estimates exceeded the minimum threshold value, confirming the proposed model’s validity.
Table 9.
Model Fit.
5. Discussion
It can be seen from the result in Table 5 that seven hypotheses were accepted to have a positive influence. These included system quality (SQ) to perceived usefulness (PU) and perceived ease of use (PEU), perceived location accuracy (PLA) to perceived usefulness (PU) and perceived ease of use (PEU), and perceived ease of use (PEU) to usage intention (UI) and usage intention to actual use (AU).
System quality (SQ) was proved to have a significant and positive effect on the perceived usefulness (PU) and perceived ease of use (PEU) of the Waze app, thereby supporting H1 and H2. This finding is supported by prior studies that proved that the quality of the app’s system significantly impacts the app’s perceived usefulness and ease of use [28,29]. Waze is a GPS-based navigation application that delivers real-time traffic information, suggested routes and other features to enhance the driving experience. According to Nelson et al. [64], an information system’s accuracy, clarity, timeliness, and presentation style are frequently the determinants of system quality. In the case of Waze, the quality of the system may be determined based on variables such as the precision of its mapping data, the dependability of its traffic updates, the quickness of its interface, and the consistency of its operation across various devices and operating systems. These criteria are the primary determinants of the quality of traffic information. According to a previous study on drivers’ reactions to traffic information, giving travelers accurate information can increase compliance rate; when credible information is made available to assist in decision-making and better trip planning, a user’s perception of the usefulness rises [24]. In addition, Hussain et al. [30] examined the effectiveness of perceived ease of use. They analyzed how users sophisticatedly engage with the Waze app on mobile devices and how usefulness, usability, and enjoyment are perceived as motivating factors. This explains why user acceptability of interactive mobile map technology varies. User engagement with interactive mobile maps is significantly positively influenced by perceived usefulness. Hence, if the Waze app has a high level of system quality, users are more likely to find the application useful and easy to use, as they can rely on its features to offer accurate and trustworthy information that facilitates more efficient navigation to their destination. New findings in the study suggest that a reliable and efficient app with enhanced functionality is more likely to meet users’ needs and provide them with value. This finding aligns with previous research highlighting the importance of system quality in determining the utility of software applications [65].
Perceived location accuracy (PLA) was also proved to have a significant and positive effect on perceived usefulness (PU) and perceived ease of use (PEU), thereby supporting H3 and H4. This was also proven in a study by Silaa et al. [66] that showed that perceived location accuracy is associated with a traffic navigation app’s perceived usefulness and ease of use. Waze is a popular navigation program that employs real-time user data to give drivers information on traffic, road closures, accidents, and other pertinent information. According to Marzuki et al. [18], the perceived location accuracy and usefulness of the offered information are two significant variables contributing to the app’s success. Mukul et al. [67] state that insights are more reliable if there is accuracy in location data. This is also confirmed by the study of Yamsaengsung and Papasratorn [20], which states that the usefulness of location accuracy impacts the usefulness and ease of use of the Waze app. During their test on tolls, the Waze app prominently offered the ETA on their initial screen. Since the Waze app has a color-coded representation of congestion on the app, this allows drivers to visualize on which section of the route they should expect congestion. This also allows the drivers to choose a route with the shortest trip time, regardless of traffic. In addition, since the Waze app shows both text and graphs, it strengthens the app’s concise representation of the road. The traffic graph in Waze is considered helpful for selecting lighter traffic, resulting in shorter trip times. This level of accuracy in Waze helps with easy navigation for its users [43]. Overall, the Waze app’s perceived location accuracy, usefulness, and ease of use are significant contributors to its success and appeal. By providing users with accurate and pertinent information, the app enables them to navigate more effectively and with greater ease, resulting in an enhanced driving experience [18]. New findings in our study suggest that users find it more valuable when the app accurately determines their location. This finding aligns with prior research indicating that accurate location data enables personalized recommendations, efficient search results, and better service delivery [68].
Perceived ease of use (PEU) was also proved to have a significant and positive effect on perceived usefulness and usage intention (UI), thereby supporting H5 and H6. The study of Ramayah and Ignatius [69] and Ramayah and Lo [70] also support these findings. Prior studies revealed that drivers found the Waze app functional and helpful. David et al. [71] defined perceived ease of use as “the degree to which a person believes that using a particular system would be free of effort.” It has been shown to positively influence the usage of intention to utilize the Waze navigation system considering the criteria of legibility, understandability, and ease of learning from the results describing a positive attitude from the drivers. In a study conducted by Hussain et al. [30], it was discovered that perceived ease of use predicts the intention to use the Waze application. The intuitive features of the Waze app allow users to enter their destination and obtain turn-by-turn directions rapidly. Waze is used primarily for navigation, and its goal is to help people get where they want to go as quickly and efficiently as possible. Users may promptly input their destination, examine the scheduled arrival time, and receive voice-guided turn-by-turn directions, contributing to Waze’s popularity. Thus, the usefulness of Waze is directly related to its intention, which is to give users a dependable and effective navigation tool that assists them in reaching their destination efficiently and reliably. Prior studies also support this finding and prove that, for users who perceive an app as easy to use, this will often lead to increased satisfaction and a more positive user experience. New findings in this study suggest that if users find the app intuitive, simple to navigate, and straightforward, they are more likely to perceive it as useful. This finding aligns with prior research indicating that the usage intention of interactive mobile apps is significantly positively influenced by perceived ease of use [72].
Usage intention (UI) was also found to have a significant and positive effect on actual use (AU), thereby supporting H8. This finding is also supported by dos Reis et al. [73], who found that a significant positive attitude determined the driver’s acceptance of the Waze app technology, which provided the key to understanding their behavioral intention to use the navigation system. This evaluates that the user’s behavior is accepted under the scale of having a positive attitude and acceptance from the participants from the obtained results. According to Wang et al. [39], usage intention refers to a user’s intention to utilize the Waze app for navigation. Various variables may influence this intention, such as the user’s prior experience with the app, recommendations from relatives or friends, or the desire to avoid traffic congestion [51]. On the other hand, actual use relates to whether a user utilizes the Waze app to navigate their trip [5]. This depends on a range of factors, such as whether the user finds technical difficulties with the app, whether they find the app’s suggestions helpful, and whether they prefer an alternative navigation app or method [1]. New findings in this area add to the existing knowledge by suggesting that users find the app more valuable and functional when it is easy to navigate and interact with. This finding aligns with prior research emphasizing the importance of usability in enhancing the utility of traffic navigation applications [74].
On the contrary, perceived usefulness was found to have no direct or significant effect on usage intention, thereby rejecting H7. This is also supported by Allan’s findings [19], which demonstrated that perceived usefulness did not significantly influence users’ intention to use traffic navigation apps. Zhu et al. [75] also conducted a study on mobile applications and examined the impact of perceived usefulness on usage intention. Their findings suggested that perceived usefulness did not significantly influence usage intention. Instead, factors such as perceived ease of use and personal innovativeness were found to have a stronger impact. Confirming an insignificant effect of usefulness and usage intention on the actual use of an app can be valuable in adding to the existing knowledge base. The new findings highlight alternative factors or considerations that may substantially influence the actual use of an app. Future researchers will be able to uncover previously overlooked aspects that influence user behavior and app adoption by examining these factors. In addition, the findings emphasize the need for a broader understanding of user experience beyond mere usefulness and intention. Future researchers may investigate user satisfaction, perceived simplicity of use, and perceived value to understand better the factors that influence app adoption and usage.
6. Conclusions
This is the first study to investigate the acceptance and use of the Waze navigation app as a solution to manage traffic situations utilizing the technology acceptance model (TAM) among Filipino drivers in Metro Manila. Traffic flow disruption has been rapidly increasing in the Philippines, and several navigation mobile apps have been utilized to solve the traffic congestion that Filipino drivers experience daily. The user’s perception of navigation apps is beneficial as they relay the reliable information that the system provides. Thus, this study has focused on determining the user’s behavioral and technology usage intention regarding using the Waze navigation application. A questionnaire was developed and distributed using an online survey convenience sampling technique to 300 Filipino drivers to determine factors affecting their intention to use, and behavior on, the Waze application.
The results of the proposed hypotheses, partial least squares structural equation modelling (PLS-SEM), were verified using SmartPLS v3.3.3. Out of seven proposed hypotheses, six were proven to significantly affect the Waze application’s usage behavior and behavioral intentions. Furthermore, all six accepted hypotheses positively influenced perceived usefulness, perceived ease of use, usage intention, and actual use. The rejected hypothesis showed that perceived usability does not significantly influence usage intention, as one study has shown that traffic congestion affects drivers’ driving behaviors.
6.1. Recommendations
In line with the completion of this study, the researchers have formulated various suggestions that future researchers may adopt if they decide to pursue a similar research topic. Primarily, it is ideal to consider samples from a more diverse geographic background as this provides a more accurate representation of Filipinos travelling within the National Capital Region. Future researchers may also adopt a qualitative research design to gain more detailed insights into Filipinos regarding their experience with the Waze application. Although several statistical treatments were done with the gathered data, it is still recommended that future researchers obtain narrative responses from their target respondents. Furthermore, future researchers may consider increasing the sample size and related studies to establish more robust inferences. Although this study complied with the conditions needed for its chosen statistical treatment, it would be better for future studies to obtain more responses to validate the accuracy of the findings of this study.
6.2. Practical and Managerial Implication
As there is limited information on the behavioral intentions of Filipinos in using traffic navigation applications, it is essential to explore the constructs related to the acceptability of the Waze application to assess its efficiency and acceptability in managing traffic situations in Metro Manila. This study’s findings shed light on Filipino drivers’ perception regarding the system quality of the application. As a result, drivers’ perceptions may aid in improving navigation technologies, as the study provides validated hypotheses that comprehend the determinants of user acceptance and adaptation of the application. Furthermore, this could encourage the transportation industry to invest in traffic navigation systems and include the study’s significant indicators in their application. This study would enable the government to understand better how the expansion and enhancement of applications such as Waze could reduce traffic congestion in the Philippines. Moreover, the framework used in the study may also be utilized and adopted for technological advancements locally and even internationally.
6.3. Theoretical Implication
Research on the determinants of the usage of traffic navigation applications is crucial due to the continuous increase of the traffic congestion level in Metro Manila. The extended technology acceptance model (TAM) showcased a much more holistic framework for evaluating the behavioral intentions for using navigation systems. As this is a comprehensive study on the usability of the Waze application for managing traffic situations, the study’s findings could serve as a model for technologies to align their systems according to the proposed hypotheses that are significant in the user acceptance of Filipino drivers. Furthermore, this study adds new insights by demonstrating that most of the factors indicated in the extended technology acceptance model significantly affect gaining positive feedback from Filipino drivers. Authorities and developers in the technology industry need to utilize a developed model to enhance navigation systems’ efficiency and usability, as they play a crucial role in managing traffic situations and improving public transportation in Metro Manila.
6.4. Limitations
Despite the findings presented, several limitations were still evident in this study which can be further explored in the future. The first limitation was related to the distribution of respondents; the study could not include samples from diverse geographic backgrounds, which would have provided a more accurate picture of the behavior of Filipino drivers using navigation systems. Future researchers may also consider enlarging the sample size and conducting related studies to draw more firm conclusions to better understand Filipinos’ usage intentions with the Waze application. Second, the study employed a non-probability sampling technique. Further research and analyses can be conducted to confirm the validity of the study’s conclusions. Future researchers could recreate this study and consider these aspects as moderators to verify the hypotheses proposed in this study. Lastly, the study only focused on the Waze application. Future research can circumvent this constraint by looking at different traffic navigation systems available in the country and applying this research to study their acceptability to Filipino drivers.
Author Contributions
Conceptualization, M.J.J.G.; methodology, F.J.C.S.B., K.T.C.E., L.F.E.G. and A.C.V.V.; software, F.J.C.S.B., K.T.C.E., L.F.E.G. and A.C.V.V.; validation, M.J.J.G.; formal analysis, M.J.J.G.; investigation, M.J.J.G.; resources, M.J.J.G.; data curation, F.J.C.S.B., K.T.C.E., L.F.E.G. and A.C.V.V.; writing—original draft preparation, F.J.C.S.B., K.T.C.E., L.F.E.G. and A.C.V.V.; writing—review and editing, M.J.J.G.; visualization, F.J.C.S.B., K.T.C.E., L.F.E.G. and A.C.V.V.; supervision, M.J.J.G.; project administration, M.J.J.G.; funding acquisition, F.J.C.S.B., K.T.C.E., L.F.E.G. and A.C.V.V. All authors have read and agreed to the published version of the manuscript.
Funding
This research received no external funding.
Institutional Review Board Statement
This study was approved by Mapua University Research Ethics Committees.
Informed Consent Statement
Informed consent was obtained from all subjects involved in the study.
Data Availability Statement
The data presented in this study are available on request from the corresponding author.
Conflicts of Interest
The authors declare no conflict of interest.
References
- Chen, C.F.; Chen, P.C. Applying the TAM to travelers’ usage intentions of GPS devices. Expert Syst. Appl. 2011, 38, 6217–6221. [Google Scholar] [CrossRef]
- Diliman, Q.C. Traffic impact assessment for sustainable traffic management and transportation planning in urban areas. Proc. East. Asia Soc. Transp. Stud. 2005, 5, 2342–2351. [Google Scholar]
- Huang, Z.; Loo, B.P. Urban traffic congestion in twelve large metropolitan cities: A thematic analysis of local news contents, 2009–2018. Int. J. Sustain. Transp. 2022, 7, 6. [Google Scholar] [CrossRef]
- Palmiano, H.S.O.; Kurokawa, T.; Sigua, R.G. Shopping centers in Metro Manila and necessity for traffic impact study. J. East. Asia Soc. Transp. Stud. 2015, 3, 107–121. [Google Scholar]
- Brotoisworo, P.; Sunio, V. Exploring the Utilization of Crash Data from Waze and Twitter for Official National Crash Database. Proc. East. Asia Soc. Transp. Stud. 2019, 12. [Google Scholar]
- Noerkaisar, N.; Suharjo, B.; Yuliati, L.N. The adoption stages of mobile navigation technology waze app as Jakarta traffic jam solution. Indep. J. Manag. Prod. 2016, 7, 914–925. [Google Scholar] [CrossRef]
- Silva, T.H.; De Melo, P.O.V.; Viana, A.C.; Almeida, J.M.; Salles, J.; Loureiro, A.A. Traffic condition is more than colored lines on a map: Characterization of waze alerts. In Social Informatics: 5th International Conference, SocInfo 2013, Kyoto, Japan, 25–27 November 2013, Proceedings 5; Springer International Publishing: Berlin/Heidelberg, Germany, 2013; pp. 309–318. [Google Scholar]
- Laor, T.; Galily, Y. In WAZE we trust? GPS-based navigation application users’ behavior and patterns of dependency. PLoS ONE 2022, 17, e0276449. [Google Scholar] [CrossRef] [PubMed]
- Boquet, Y. BRT in the Philippines: A Solution to Manila and Cebu Traffic Problems? In IOP Conference Series: Earth and Environmental Science, Volume 338, Southeast Asian Geography Association (SEAGA) 13th Conference 28 November to 1 December 2017, Universitas Indonesia; IOP Publishing: Bristol, UK, 2019. [Google Scholar]
- Santos, F.A.; Rodrigues, D.O.; Silva, T.H.; Loureiro, A.A.; Pazzi, R.W.; Villas, L.A. Context-aware vehicle route recommendation platform: Exploring open and crowdsourced data. In Proceedings of the 2018 IEEE International Conference on Communications (ICC), Kansas City, MO, USA, 20–24 May 2018; pp. 1–7. [Google Scholar]
- Shaheen, S.; Cohen, A.; Zohdy, I.; Kock, B. Smartphone Applications to Influence Travel Choices: Practices and Policies. 2016. Available online: https://escholarship.org/uc/item/8dq801g7 (accessed on 2 February 2023).
- Poon, S.T. Designing for urban mobility: The role of digital media applications in increasing efficiency of intelligent transportation management system. In Smart Cities: A Data Analytics Perspective; Lecture Notes in Intelligent Transportation and Infrastructure; Springer: Cham, Switzerland, 2021; pp. 181–195. [Google Scholar] [CrossRef]
- Cheng, Z.; Pang, M.S.; Pavlou, P.A. Mitigating traffic congestion: The role of intelligent transportation systems. Inf. Syst. Res. 2020, 31, 653–674. [Google Scholar] [CrossRef]
- Arghashi, V.; Yuksel, C.A. Interactivity, Inspiration, and Perceived Usefulness! How retailers’ AR-apps improve consumer engagement through flow. J. Retail. Consum. Serv. 2022, 64, 102756. [Google Scholar] [CrossRef]
- Huang, K.; Pai, S.H. An approach to design a real-time transportation information application with enabling technologies. In Proceedings of the 19th Biennial Conference of the International Telecommunications Society (ITS): “Moving Forward with Future Technologies: Opening a Platform for All”, Bangkok, Thailand, 18–21 November 2012. [Google Scholar]
- Braun, H.; Gärtner, M.; Trösterer, S.; Akkermans, L.E.M.; Seinen, M.; Meschtscherjakov, A.; Tscheligi, M. Advanced driver assistance systems for aging drivers. In Proceedings of the 11th International Conference on Automotive User Interfaces and Interactive Vehicular Applications, Utrecht, The Netherlands, 21–25 September 2019. [Google Scholar] [CrossRef]
- Rahman, M.M.; Strawderman, L.; Lesch, M.F.; Horrey, W.J.; Babski-Reeves, K.; Garrison, T. Modeling driver acceptance of driver support systems. Accid. Anal. Prev. 2018, 121, 134–147. [Google Scholar] [CrossRef]
- Marzuki, M.I.I.; Rosly, A.N.; Roslan, N.S.; Abdullah, D.; Kamal, S.B.M.; Azmi, A. The role of perceived interactivity, perceived ease of use, perceived usefulness, and perceived enjoyment toward intention to use online mapping service applications. Int. Acad. Res. J. Bus. Technol. 2016, 2, 135–139. [Google Scholar]
- Allan, M. Customers’ Continuance Intention in Using a Mobile Navigation App in the Tourism Context: What Factors Will Lead? Acad. Tur. Tour. Innov. J. 2022, 14, 2. [Google Scholar]
- Yamsaengsung, S.; Papasratorn, B. Towards improving user interactions with navigation apps: An information quality perspective. KnE Soc. Sci. 2018, 3, 119. [Google Scholar] [CrossRef]
- Chen, C.C.; Tsai, J.L. Determinants of behavioral intention to use the Personalized Location-based Mobile Tourism Application: An empirical study by integrating TAM with ISSM. Fut. Gener. Comput. Syst. 2019, 96, 628–638. [Google Scholar] [CrossRef]
- Voinea, G.D.; Postelnicu, C.C.; Duguleana, M.; Mogan, G.L.; Socianu, R. Driving performance and technology acceptance evaluation in real traffic of a smartphone-based driver assistance system. Int. J. Environ. Res. Public Health 2020, 17, 7098. [Google Scholar] [CrossRef] [PubMed]
- McDowell, D.E.; Dillon, T.W.; Lending, D. Perceived quality benefits influenced by usefulness and documentation accuracy of information systems. CIN Comput. Inform. Nurs. 2008, 26, 350–357. [Google Scholar] [CrossRef]
- Ben-Elia, E.; Di Pace, R.; Bifulco, G.N.; Shiftan, Y. The impact of travel information’s accuracy on route-choice. Transp. Res. Part C Emerg. Technol. 2013, 26, 146–159. [Google Scholar] [CrossRef]
- Nguyen, T. Continuance intention in traffic-related social media: A privacy calculus perspective. J. Int. Commer. 2021, 20, 215–245. [Google Scholar] [CrossRef]
- Khoo, H.L.; Asitha, K. User requirements and route choice response to smart phone traffic applications (apps). Travel Behav. Soc. 2016, 3, 59–70. [Google Scholar] [CrossRef]
- Knote, R.; Söllner, M. Towards Design Excellence for Context-Aware Services-the Case of Mobile Navigation Apps. Available online: https://aisel.aisnet.org/wi2017/track02/paper/8/ (accessed on 2 February 2023).
- Peeta, S.; Ramos, J.L.; Pasupathy, R. Content of Variable Message Signs and Online Driver Behavior. Transp. Res. Rec. J. Transp. Res. Board 2000, 1725, 102–108. [Google Scholar] [CrossRef]
- Park, E.; Kim, K.J.; del Pobil, A.P. An examination of psychological factors affecting drivers’ perceptions and attitudes toward car navigation systems. In IT Convergence and Security; Springer: Berlin/Heidelberg, Germany, 2012; pp. 555–562. [Google Scholar] [CrossRef]
- Hussain, A.; Mkpojiogu, E.O.; Yusof, M.M. Perceived usefulness, perceived ease of use, and perceived enjoyment as drivers for the user acceptance of interactive mobile maps. In AIP Conference Proceedings; AIP Publishing LLC: Melville, NY, USA, 2016; Volume 1761, p. 20051. [Google Scholar]
- Amin, M.; Rezaei, S.; Abolghasemi, M. User satisfaction with mobile websites: The impact of perceived usefulness (PU), perceived ease of use (PEOU) and trust. Nankai Bus. Rev. Int. 2014, 5, 258–274. [Google Scholar] [CrossRef]
- Tsai, T.H.; Chang, H.T.; Chen, Y.J.; Chang, Y.S. Determinants of user acceptance of a specific social platform for older adults: An empirical examination of user interface characteristics and behavioral intention. PLoS ONE 2017, 12, e0180102. [Google Scholar] [CrossRef] [PubMed]
- Zhang, D.; Adipat, B. Challenges, methodologies, and issues in the usability testing of mobile applications. Int. J. Hum. Comput. Interact. 2005, 18, 293–308. [Google Scholar] [CrossRef]
- Ghazizadeh, M.; Peng, Y.; Lee, J.D.; Boyle, L.N. Augmenting the technology acceptance model with trust: Commercial drivers’ attitudes towards monitoring and feedback. Proc. Hum. Factors Ergon. Soc. Annu. Meet. 2012, 56, 2286–2290. [Google Scholar] [CrossRef]
- Larue, G.S.; Rakotonirainy, A.; Haworth, N.L.; Darvell, M. Assessing driver acceptance of intelligent transport systems in the context of railway level crossings. Transp. Res. Part F Traffic Psychol. Behav. 2015, 30, 1–13. [Google Scholar] [CrossRef]
- Roberts, S.C.; Ghazizadeh, M.; Lee, J.D. Warn me now or inform me later: Drivers’ acceptance of real-time and post-drive distraction mitigation systems. Int. J. Hum. Comput. Stud. 2012, 70, 967–979. [Google Scholar] [CrossRef]
- Diop, E.B.; Zhao, S.; Duy, T.V. An extension of the technology acceptance model for understanding travelers’ adoption of variable message signs. PLoS ONE 2019, 14, e0216007. [Google Scholar] [CrossRef]
- Chatterjee, K.; Mcdonald, M. Effectiveness of using variable message signs to disseminate dynamic traffic information: Evidence from field trails in european cities. Transp. Rev. 2004, 24, 559–585. [Google Scholar] [CrossRef]
- Wang, Y.Y.; Lin, H.H.; Wang, Y.S.; Shih, Y.W.; Wang, S.T. What drives users’ intentions to purchase a GPS Navigation app: The moderating role of perceived availability of free substitutes. Internet Res. 2018, 28, 1. [Google Scholar] [CrossRef]
- Alzubi, M.M.; Al-Dubai, M.M.; Farea, M.M. Using the technology acceptance model in understanding citizens’ behavioural intention to use m-marketing among Jordanian citizen. J. Bus. Retail. Manag. Res. 2018, 12, 2. [Google Scholar] [CrossRef]
- Etikan, I.; Musa, S.A.; Alkassim, R.S. Comparison of convenience sampling and purposive sampling. Am. J. Theor. Appl. Stat. 2016, 5, 1–4. [Google Scholar] [CrossRef]
- Yamane, T. Statistics, an Introductory Analysis. J. Am. Stat. Assoc. 1967, 60, 678. [Google Scholar] [CrossRef]
- Zhou, T. Examining the critical success factors of mobile website adoption. Online Inf. Rev. 2011, 35, 636–652. [Google Scholar] [CrossRef]
- Jeong, H. An investigation of user perceptions and behavioral intentions towards the e-library. Libr. Collect. Acquis. Tech. Serv. 2011, 35, 45–60. [Google Scholar] [CrossRef]
- Prasetyo, Y.T.; Ong, A.K.S.; Concepcion, G.K.F.; Navata, F.M.B.; Robles, R.A.V.; Tomagos, I.J.T.; Young, M.N.; Diaz, J.F.T.; Nadlifatin, R.; Redi, A.A.N.P. Determining factors Affecting acceptance of e-learning platforms during the COVID-19 pandemic: Integrating Extended technology Acceptance model and DeLone & Mclean is success model. Sustainability 2021, 13, 8365. [Google Scholar]
- Park, E.; Kim, H.; Ohm, J.Y. Understanding driver adoption of car navigation systems using the extended technology acceptance model. Behav. Inf. Technol. 2015, 34, 741–751. [Google Scholar] [CrossRef]
- Zeng, K.C.; Liu, S.; Shu, Y.; Wang, D.; Li, H.; Dou, Y.; Wang, G.; Yang, Y. All your GPS are belong to us: Towards stealthy manipulation of road navigation systems. In Proceedings of the 27th USENIX Security Symposium (USENIX Security 18), Baltimore, MD, USA, 15–17 August 2018; pp. 1527–1544. [Google Scholar]
- Cooharojananone, N.; Napapruekchat, S.; Puttirutwong, T.; Pongnumkul, S. A study of factors influencing intention to use traffic information applications on smartphones in Bangkok, Thailand. In Proceedings of the International Conference on Information Society (i-Society 2014), London, UK, 10–12 November 2014. [Google Scholar] [CrossRef]
- Yang, L.; Bian, Y.; Zhao, X.; Liu, X.; Yao, X. Drivers’ acceptance of mobile navigation applications: An extended technology acceptance model considering drivers’ sense of direction, navigation application affinity and distraction perception. Int. J. Hum.-Comput. Stud. 2021, 145, 102507. [Google Scholar] [CrossRef]
- Lowrie, C.; Kruczkiewicz, A.; McClain, S.N.; Nielsen, M.; Mason, S.J. Evaluating the usefulness of VGI from Waze for the reporting of flash floods. Sci. Rep. 2022, 12, 5268. [Google Scholar] [CrossRef]
- Khairunnisa, R.; Muthaiyah, S. Understanding Factors Influencing Continuance Intention of Users Toward Community-Based Traffic and Navigation Application In Indonesia. Turk. J. Comput. Math. Educ. 2021, 12, 3464–3476. [Google Scholar]
- Hair, J.F.; Sarstedt, M.; Ringle, C.M.; Mena, J.A. An assessment of the use of partial least squares structural equation modeling in marketing research. J. Acad. Mark. Sci. 2011, 40, 414–433. [Google Scholar] [CrossRef]
- Dash, G.; Paul, J. CB-SEM vs. PLS-SEM methods for research in social sciences and technology forecasting. Technol. Forecast. Soc. Chang. 2021, 173, 121092. [Google Scholar] [CrossRef]
- Ouellette, J.A.; Wood, W. Habit and intention in everyday life: The multiple processes by which past behavior predicts future behavior. Psychol. Bull. 1998, 124, 54. [Google Scholar] [CrossRef]
- Hu, L.T.; Bentler, P.M. Fit indices in covariance structure modeling: Sensitivity to underparameterized model misspecification. Psychol. Methods. 1998, 3, 424–453. [Google Scholar] [CrossRef]
- Baumgartner, H.; Homburg, C. Applications of structural equation modeling in marketing and consumer research: A review. Int. J. Res. Mark. 1996, 13, 139–161. [Google Scholar] [CrossRef]
- Kimberlin, C.L.; Winterstein, A.G. Validity and Reliability of Measurement Instruments Used in Research. Am. J. Health-Syst. Pharm. 2008, 65, 2276–2284. [Google Scholar] [CrossRef] [PubMed]
- Peters, G. The alpha and the omega of scale reliability and validity: Why and how to abandon Cronbach’s alpha and the route towards more comprehensive assessment of scale quality. Eur. Health Psychol. 2014, 16, 56–69. [Google Scholar] [CrossRef]
- Hamid, M.R.A.; Sami, W.; Sidek, M.H.M. Discriminant Validity Assessment: Use of Fornell & Larcker criterion versus HTMT Criterion. J. Phys. Conf. Ser. 2017, 890, 12163. [Google Scholar] [CrossRef]
- Analysis INN. Average Variance Extracted (AVE). Analysis INN. 19 April 2020. Available online: https://www.analysisinn.com/post/average-variance-extracted-ave/ (accessed on 2 February 2023).
- Henseler, J.; Ringle, C.M.; Sarstedt, M. A new criterion for assessing discriminant validity in variance-based structural equation modeling. J. Acad. Mark. Sci. 2015, 43, 115–135. [Google Scholar] [CrossRef]
- Hair, J.F.; Hult, G.T.M.; Ringle, C.M.; Sarstedt, M. A Primer on Partial Least Squares Structural Equation Modeling (PLS-SEM); Sage Publications: Thousand Oaks, CA, USA, 2014. [Google Scholar]
- Akter, S.; Fosso Wamba, S.; Dewan, S. Why PLS-SEM is suitable for complex modelling? An empirical illustration in big data analytics quality. Prod. Plan. Control 2017, 28, 1011–1021. [Google Scholar] [CrossRef]
- Nelson, R.R.; Todd, P.A.; Wixom, B.H. Antecedents of information and system quality: An empirical examination within the context of data warehousing. J. Manag. Inf. Syst. 2005, 21, 199–235. [Google Scholar] [CrossRef]
- Green, G.C.; Hevner, A.R.; Collins, R.W. The impacts of quality and productivity perceptions on the use of software process improvement innovations. Inf. Softw. Technol. 2005, 47, 543–553. [Google Scholar] [CrossRef]
- Silaa, J.; Jazri, H.; Muyingi, H. A study on the use of mobile computing technologies for improving the mobility of Windhoek residents. Afr. J. Sci. Technol. Innov. Dev. 2021, 13, 479–493. [Google Scholar] [CrossRef]
- Mukul, M.; Srivastava, V.; Jade, S.; Mukul, M. Uncertainties in the shuttle radar topography mission (SRTM) Heights: Insights from the indian Himalaya and Peninsula. Sci. Rep. 2017, 7, 41672. [Google Scholar] [CrossRef]
- Cardone, G.; Corradi, A.; Foschini, L.; Montanari, R. Socio-technical awareness to support recommendation and efficient delivery of IMS-enabled mobile services. IEEE Commun. Mag. 2012, 50, 82–90. [Google Scholar] [CrossRef]
- Ramayah, T.; Ignatius, J. Impact of perceived usefulness, perceived ease of use and perceived enjoyment on intention to shop online. ICFAI J. Syst. Manag. 2005, 3, 36–51. [Google Scholar]
- Ramayah, T.; Lo, M.C. Impact of shared beliefs on “perceived usefulness” and “ease of use” in the implementation of an enterprise resource planning system. Manag. Res. News 2007, 30, 420–431. [Google Scholar] [CrossRef]
- Davis, F.D.; Bagozzi, R.P.; Warshaw, P.R. User acceptance of computer technology: A comparison of two theoretical models. Manag. Sci. 1989, 35, 982–1003. [Google Scholar] [CrossRef]
- Nysveen, H.; Pedersen, P.E.; Thorbjørnsen, H. Intentions to use mobile services: Antecedents and cross-service comparisons. J. Acad. Mark. Sci. 2005, 33, 330–346. [Google Scholar] [CrossRef]
- dos Reis, R.A.; Grant-Muller, S.; Lovelace, R.; Hodgson, F. Different people, different incentives? Examining the public acceptance of smartphone-based persuasive strategies for sustainable travel using psychographic segmentation. Int. J. Sustain. Transp. 2022, 16, 1. [Google Scholar] [CrossRef]
- Ferris, B.; Watkins, K.; Borning, A. Location-aware tools for improving public transit usability. IEEE Pervasive Comput. 2010, 9, 13. [Google Scholar] [CrossRef]
- Zhu, G.; So, K.K.F.; Hudson, S. Inside the sharing economy: Understanding consumer motivations behind the adoption of mobile applications. Int. J. Contemp. Hosp. Hosp. Manag. 2017, 29, 9. [Google Scholar] [CrossRef]
Disclaimer/Publisher’s Note: The statements, opinions and data contained in all publications are solely those of the individual author(s) and contributor(s) and not of MDPI and/or the editor(s). MDPI and/or the editor(s) disclaim responsibility for any injury to people or property resulting from any ideas, methods, instructions or products referred to in the content. |
© 2023 by the authors. Licensee MDPI, Basel, Switzerland. This article is an open access article distributed under the terms and conditions of the Creative Commons Attribution (CC BY) license (https://creativecommons.org/licenses/by/4.0/).