1. Introduction
Grasslands account for 40% of the world’s land area excluding Antarctica and Greenland and support ~1 billion people’s livelihood [
1]. The grasslands of China are a vital ecological and social–economic resource, covering 40% of the national area and serving as an ecological barrier in the north and northwest border of China [
1,
2]. These grasslands have multiple functions, including adjusting climate, preserving water resources, fixing carbon and releasing oxygen, and mitigating wind and sand dusts [
3]. They are also the essential resources for agricultural productions and home to millions of herders of diverse ethnic groups [
2]. However, the deterioration of grasslands is widespread and is believed to be associated with overgrazing and overexploitation, as well as climate change [
4,
5,
6].
To address this issue, China has implemented various programs, including one of the largest-scale government-led pastoralist-focused payment for ecosystem service (PES) schemes since 2011, with government funds of tens of billions of dollars allocated for 10 years, benefitting 12 million herders, and it is currently in its third 5-year phase (
Table 1) [
7]. In this study, we use the terms “subsidy” or “compensation”, and we would like to point out that these two terms and “reward” interchangeably refer to this policy or program in the existing literature.
This program pays herders for reducing their grazing intensity or cessation of grazing, thus with two policy zones: the grass–livestock balance zone and the grazing ban zone. Each sub-policy zone has its own payment standard, with payments currently at 7.5 CNY/mu and 2.5 CNY/mu (CNY: Chinese Yuan currency) for grazing ban zones and grass–livestock balance zones, respectively (mu is the area unit, and 1 mu equals 1/15 hectare), or equivalent to ~US$16/hectare and ~US$5.5/hectare (at the current exchange rate) for the two zones, respectively. These payment levels are the same for phase 2 (2016–2020) and phase 3 (2021–2025), which increased from the original 6.5 CNY/mu for grazing ban zones and 1.5 CNY/mu for grass–livestock balance zones. Here, we use “grass–livestock” throughout this paper, and readers may encounter the term “forage–livestock” in the existing literature that refers to the same policy or program.
This grassland PES program in China is a significant effort to restore and sustain the grassland ecosystem and lift the poverty of herders. It is a commendable initiative that recognizes the value of grasslands in ecological and social–economic terms. However, further research is needed to evaluate the effectiveness of the program in achieving its goals and to address any potential unintended consequences.
Researchers have discussed the effectiveness of the ecological subsidy program in China, specifically in relation to livestock reduction behavior. While the implementation of the first round of ecological subsidies in 2011 was positively received [
11], other studies highlight that the effect of livestock reduction was not sustained and overgrazing has not completely ceased [
3,
12]. Despite the second round of compensation to improve payment standards, livestock reduction has not continued to decrease and has even rebounded in some areas [
13,
14]. Based on the experience of ecological compensation PES worldwide, a reasonable compensation standard is necessary to motivate pastoral households to actively participate in ecological compensation programs and ensure their welfare [
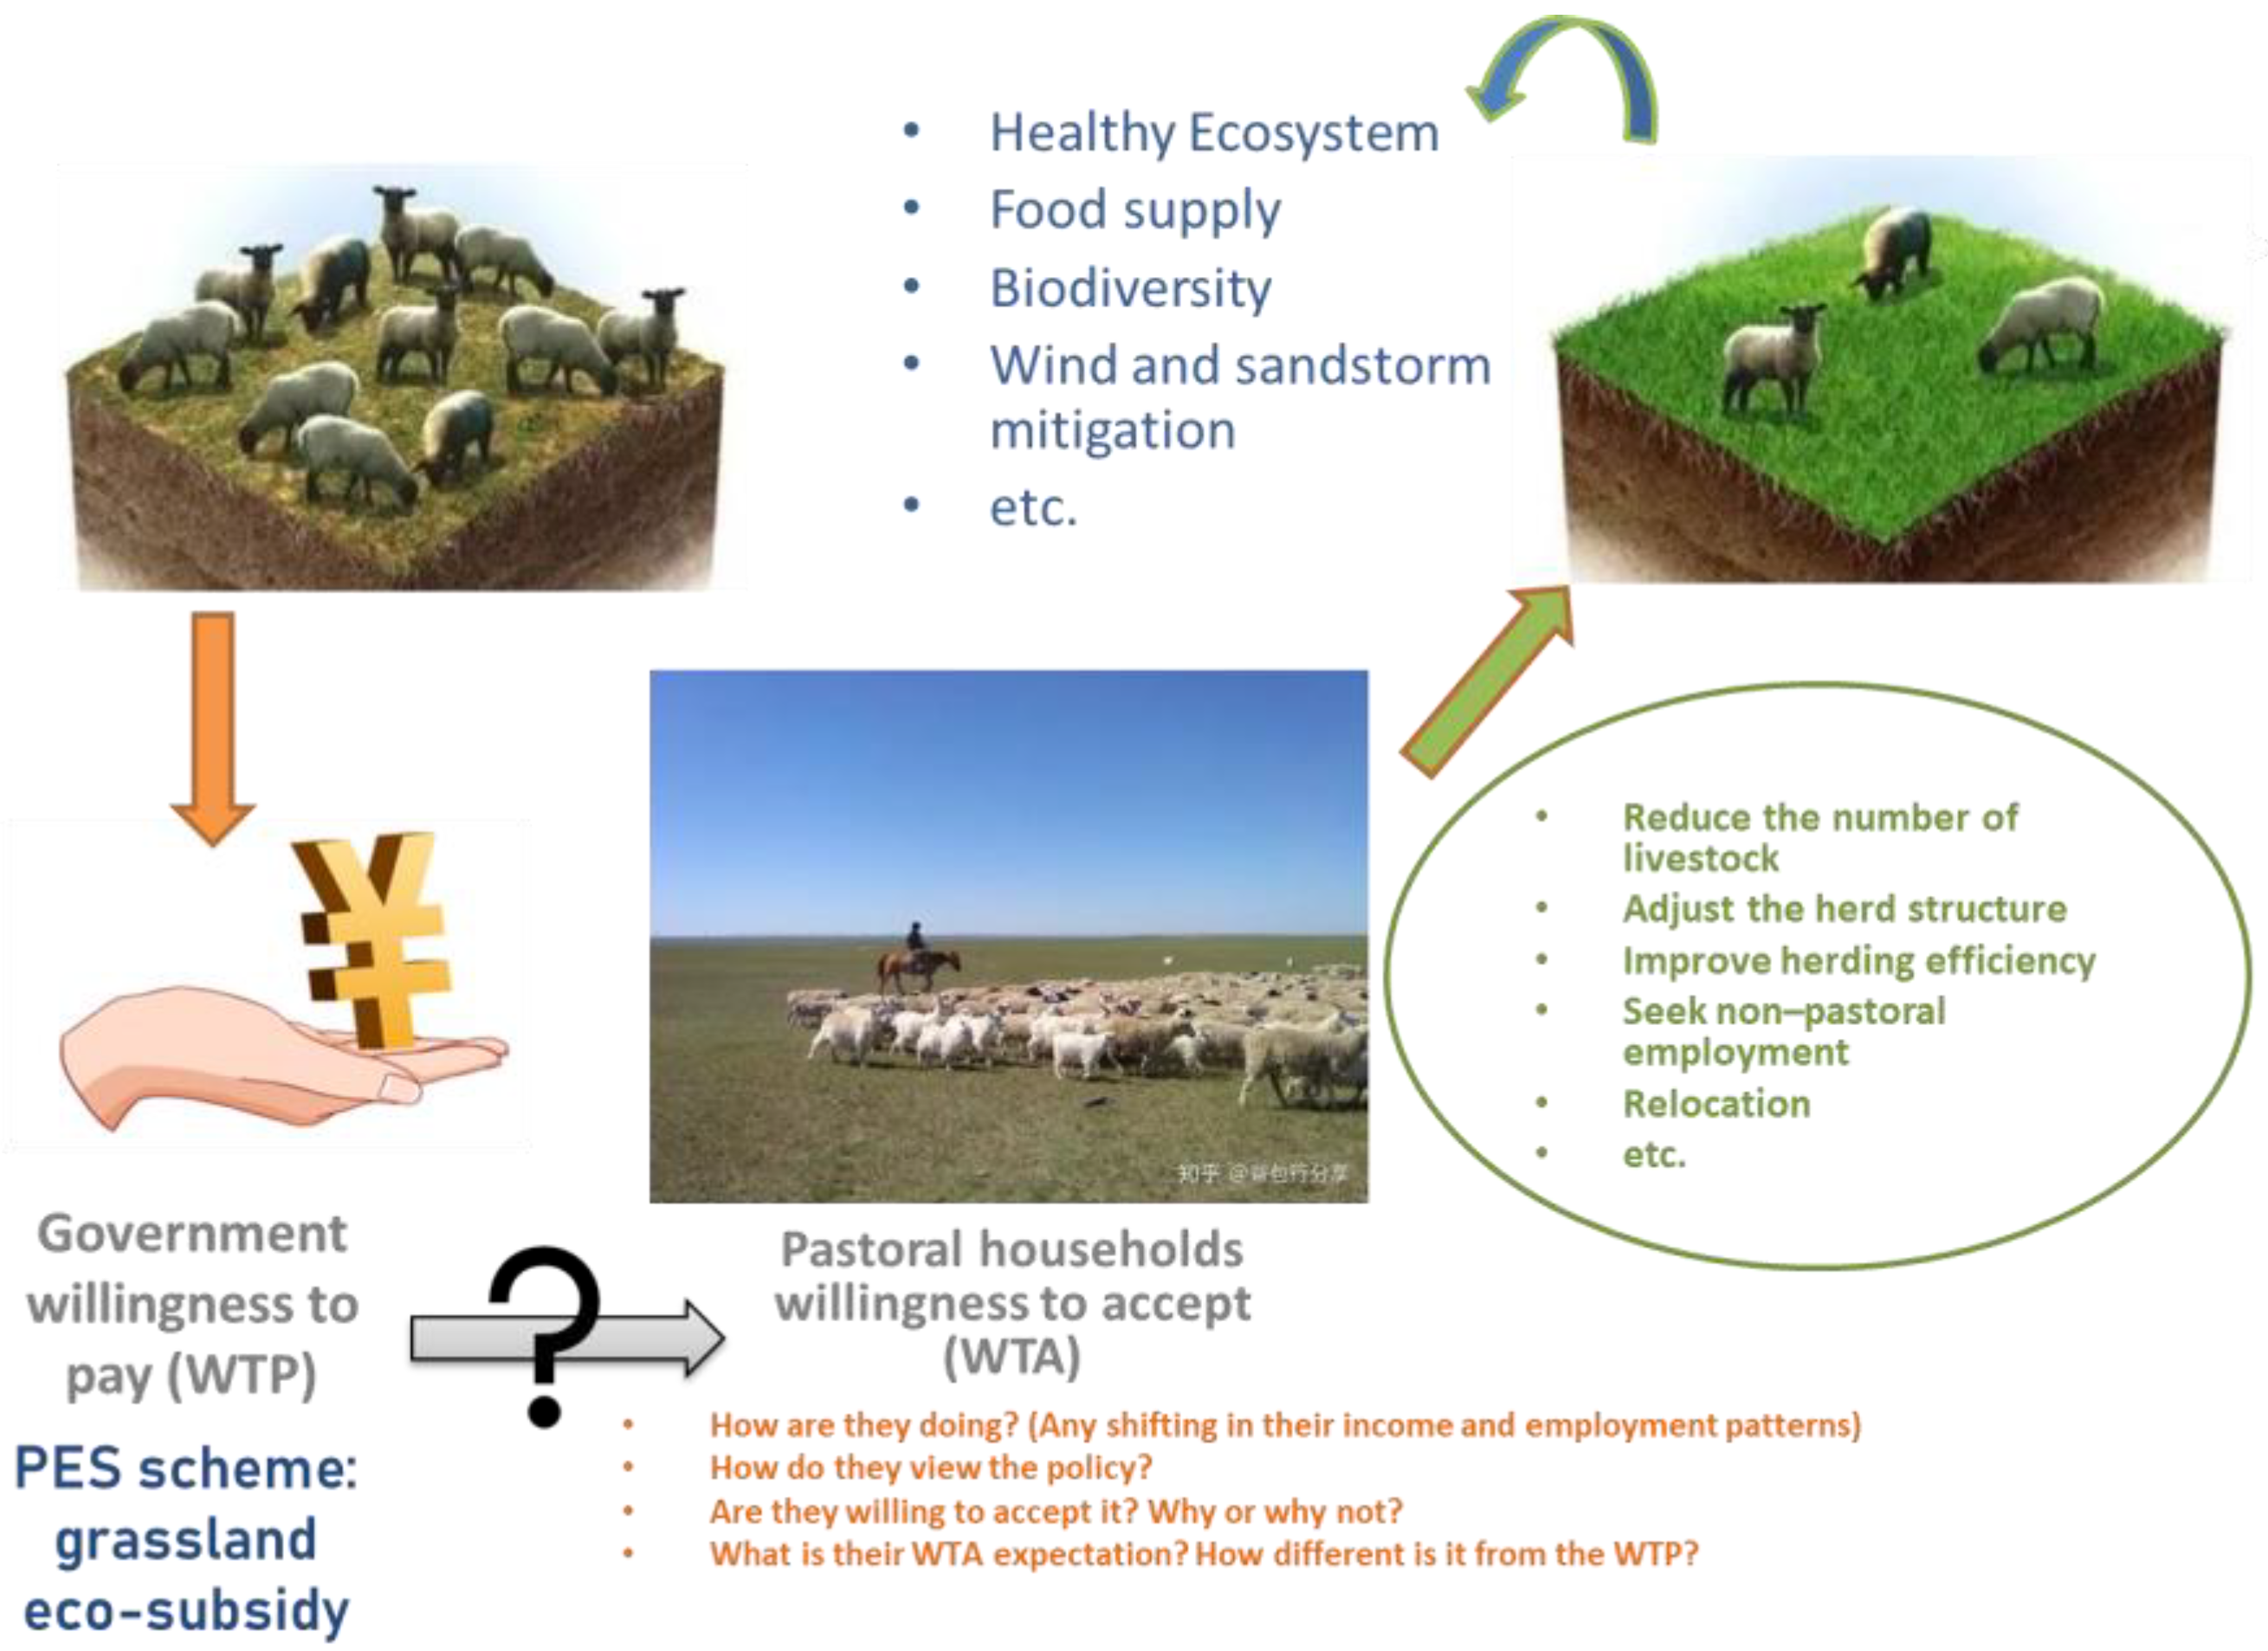
15]. What is also well recognized is the disparity WTP (what the government is willing to pay) and WTA (what the herders are willing to accept), particularly in relation to non-market products such as ecological and environmental services [
16]. The policy offers WTP to incentivize herders, but it is important to consider herders’ WTA, whether they are willing to accept the incentive. Herders, as the providers of ecological services, rely heavily on the grasslands for their livelihood, making them the most impacted group by the PES schemes [
17].
We believe that the willingness to accept compensation is a premise for livestock reduction behavior. The occurrence and extent of livestock reduction behavior depend on the satisfaction degree of the compensation. Therefore, it is of significance to analyze the influencing factors of the WTA for the compensation to inform and improve the program effectiveness, and encourage sustainable livestock reduction behavior.
Research work in this area has primarily focused on the calculation of compensation criteria, and the factors that influence the herders’ WTA. These factors include the estimation of livestock reduction loss, education level of the herders, family income [
18], joint grazing situation [
19], herders’ age and education level [
20], family size [
21], steppe type and ethnic group [
22], precipitation [
20], etc. The existing research has not yet reached a consensus on the factors influencing the willingness of herders to accept the subsidy. This suggests that further research is needed to better understand these factors and herders’ decision-making processes, and how these factors can be addressed to improve the program. This also implies a diversity in herders’ behavior and decision making and a “one-size-fits-all” and “top-down” single PES scheme may not be effective [
23,
24].
In recent years, due to China’s rapid urbanization and agricultural transformation, rural households have become increasingly differentiated and diverse, with significant economic and social heterogeneity [
25]. Environmental and ecological regulations and policies, including the grassland eco-subsidy program, also have effects on the diversification of China’s rural areas [
26]. During our surveys and conversations with herders in this research, we also discovered a notable trend among pastoral households in the natural grassland area of Inner Mongolia. To meet their educational, medical, and/or other needs, these households are increasingly relocating to cities and towns. As a result, there is a growing prevalence of both pastoral and non-pastoral employment among traditional “pure” herders. This shift in employment patterns reflects the evolving dynamics of livelihood strategies among herding communities. Additionally, with the expansion of pasture trade and exchange after the completion of the second round of pasture use–right tenure, differences among pastoral households, grassland productivity, grazing skills, and management ability have further increased, leading to employment diversification and income disparity. However, existing studies on the willingness to accept compensation have not taken these dynamic distinctions of herding households into the analytical framework, and few studies have examined the role.
In this study, we put forth four hypotheses that horizontal and vertical differentiations of herders would affect their willingness to accept compensation. We further assessed whether such differentiations have positive or negative impacts on herders’ attitudes towards participating in the program.
Given the obvious differences in payment levels and grassland productivity, as well as herders’ livelihood involved, we focused on the herders in the grass–livestock balance sub-policy zones and their attitudes towards participating in the program and their livestock reduction behaviors.
Overall, the objective of our study is to evaluate the effects of differentiation and diversity among herders on their willingness to accept the subsidy. By examining the attitudes and behaviors of herders in the grass–livestock balance sub-policy zones, we aim to gain insights into the program’s long-term effects and identify opportunities for improvement, particularly in terms of the increasing income and employment opportunities for herders and their WTA preferences. This paper contributes to the growing literature on PES programs and sustainable land-use policies in general and provides insight into improving it.
2. Materials and Methods
2.1. Study Site
2.1.1. Research Design and Site Locations
We designed our research to study the policy affecting herders and to gather their characteristics, especially the patterns in terms of their income and employment, and we also obtained their views on the policy and their willingness to accept the eco-subsidy (
Figure 1).
We began visiting and interviewing the pastoral households in September 2019 and conducted follow-up surveys from May to August 2021. Our research area spanned four typical league cities in the Inner Mongolia Autonomous Region, including Ordos City, Ulanqab City, and Xilin Gol League to Hulun Buir City, including a total of 10 banners in the four cities (
Figure 2). The climate type of the research area gradually transitions from arid to semi-arid and to sub-humid from west to east. The most recent 10-year precipitation appears to have an increasing trend from west to east with an anomaly of the south–westernmost banner. The grassland type of the sample sites spans from southwest to northeast from desert steppe and typical steppe to lush meadow steppe, covering a wide range from the southwest to northeast of Inner Mongolia (
Appendix A).
2.1.2. Sampling
The method we used consisted of random sampling, a semi-open questionnaire survey, and interviews. After excluding invalid samples such as households with grazing ban grasslands, those who hired other herders for grazing, or those who rented out their pasture, we retained 410 valid samples, and the effective sample rate was 95.2%. On average, about 41 households were from each of the 10 banners.
2.2. Willingness to Accept (WTA) and Contingent Valuation Method (CVM)
This paper distinguishes between two variables in assessing the willingness to accept (WTA): the willingness to accept compensation and the expectation value of the accepted compensation [
15,
27]. The former represents the behavioral intention of herders to participate in the eco-subsidy program, while the latter reflects the participation extent of herders. By analyzing these two aspects simultaneously, a complete WTA assessment can be made.
In this study, the willingness and expectation of compensation refer to the strong willingness of herders to reduce their livestock to a reasonable stocking rate and the minimum compensation they are willing to accept in exchange for the reduction. The survey questionnaire design mainly included the following: (1) basic statistical characteristics of herders; (2) herders’ willingness to reduce livestock; (3) pastoral households’ perceptions on ecological and livelihood risks; and (4) the herders’ willingness to accept compensation and the minimum amount of compensation they would accept.
This study employed the contingent valuation method (CVM) to test the minimum expected compensation in exchange for reducing livestock to the theoretical carrying capacity. CVM is a survey-based technique used to value non-market public goods and services, such as environmental and natural resources, by constructing a hypothetical market survey of people’s willingness to pay (WTP), for example, for an environmental improvement, or willingness to accept (WTA) for a loss for ecological services or environmental damage with a typical stated preference value from given choices [
21,
28,
29,
30]. Here, the reduction in livestock in exchange for the subsidy is perceived as a loss to herders; thus, we considered conducting this CVM survey to access their WTA.
In order to mitigate bias in the CVM study, we implemented a meticulous approach by conducting individual surveys in person with the head of each household, who served as the primary decision maker for their family. These surveys were conducted directly at the participants’ residences, ensuring that the data collected were firsthand information and reduced the risk of distortion.
When surveys are administered face-to-face, it allows for clarifications and additional explanations, which can help respondents better understand the questions and provide accurate answers. This reduces the chances of misinterpretation or response bias. We visited households personally, and we felt we could build rapport, address concerns, and establish trust, which encourages participation and reduces non-response bias. Face-to-face interviews also provided an opportunity to understand the respondents’ perspectives and context better. We could observe their surroundings, ask probing questions, and gather qualitative insights, which can enhance the richness and depth of the data collected. On average, each household survey required a substantial time commitment, typically lasting 2 h or more.
The semi-closed and repeated bidding methods were combined and applied for this WTA study. We first confirmed the grassland area that the herder households had been granted for the land tenure, along with their stocking procession and their financial condition, and then we simulated the real market environment to ensure that the herder had sufficient understanding of relevant background information and to overcome the information bias to the maximum extent. The herders were asked about their expected compensation amount if livestock reduction was required to maintain a reasonable stocking rate. During the survey, a specific set of reference ranges for selection was provided to the herders to capture different monetary values per unit of grazing land. The herders were asked to select a value within these ranges and were then prompted to justify their selection.
To ensure a fair and transparent process, a negotiation or “bargain” was conducted. After the herders initially provided their selection, the surveyors would request a lower selection, encouraging the herders to reconsider and adjust their choice. This iterative process continued until a minimum expectation or mutually agreeable value was reached.
The reference ranges used for selection were as follows: <=3 CNY/mu, 4–10 CNY/mu, 11–15 CNY/mu, 16–20 CNY/mu, 21–25 CNY/mu, 26–30 CNY/mu, 30–40 CNY/mu, or >40 CNY/mu.
2.3. Theoretical Basis for Herders’ Differentiation
In this study, we analyzed the herders’ differentiations, essentially economic situations, in two dimensions: vertical and horizontal. Vertical distinctions represent the economic differences based on the income divergence among the herders, while horizontal differentiation is based on their employment distinctions or income sources [
25]. Non-agricultural or off-farm employment provides herders with alternative sources of income and reduces their dependence on pastoral and agricultural work, thereby improving their anti-risk ability and survival chances to a certain extent [
30]. The pastoral households implementing the ecological incentive policy have gradually diverged into pure pastoral households and various types of part-time pastoral households, leading to an increase in non-pastoral employment and income [
31]. Employment distinctions lead to a difference in the willingness to be compensated among herders, as those with less non-animal husbandry income are more dependent on grazing income and have a relatively low willingness to be compensated for downsizing their livestock numbers, while those with more non-pastoral employment channels and stable income are more willing to be rewarded or compensated [
30].
However, employment distinctions could lead to a gap in compensation expectations among pastoral households. Households with a small proportion of non-pastoral income tend to have higher compensation expectations, while those with a high proportion of non-pastoral employment tend to have lower compensation limits. Hence, we proposed our second research hypothesis H2, stating that employment differentiation of pastoral households has a negative effect on the expectation of the eco-subsidy.
The occupational divergence of pastoral households leads to the transfer of the family labor force and capital to the non-pastoral fields, resulting in a decrease in the available labor force and capital for animal husbandry production. With how the limited funds of pastoral households are being distributed in animal husbandry and non-pastoral fields, the vertical distinctions would proceed. Herding households in the grass–livestock balance area aim to maintain the livestock income against large natural and market fluctuations; thus, reducing the scale of livestock and grazing could significantly incite serious risk perception. Hence, research hypotheses H3 and H4 were proposed, stating that vertical differentiation of herders has a negative effect on their willingness to be subsidized (H3) and a positive effect on the expected value of the eco-subsidy (H4).
In summary, we proposed four hypotheses regarding the WTA and expected compensation value:
H1. Horizontal or employment distinctions of herder households have a positive impact on their willingness to accept the eco-subsidy.
H2. Horizontal or employment distinctions of pastoral households have a negative effect on the expectation value for the subsidy.
H3. Vertical or income distinctions of herders have a negative effect on their willingness to be compensated for grassland ecology.
H4. Vertical or income distinctions of pastoral households have a positive effect on the expected value of the grassland ecological subsidy.
H1 and H3 were evaluated using an ordered Logistic model, which was suitable for analyzing the impact of variables on the ordered outcome. H2 and H4 were assessed using the Tobit model, which is appropriate for analyzing censored or limited dependent variables.
2.4. Models
The two dependent variables of this study are the willingness to accept compensation and the expectation value of the compensation. To quantify the willingness to accept the subsidy under the existing program payment standards, we gave ordered numbers 0–4 as options (
Table 2) in the ordered Logistic model. The expectation of compensation was estimated in the Tobit regression. All the regressions were performed in Stata 14 software.
2.4.1. Ordered Logistic Model for WTA
In the ordered Logistic model, the dependent variable was the willingness of pastoral households to accept compensation, which was classified into five situations: strongly unwilling, unwilling, no preference, willing, and strongly willing. These five ordered latent variables
Z′ were used to establish the sorted Logistic model [
21,
32].
where
Z′ is the latent variable, representing the willingness of herders to accept the subsidy,
is the regression coefficients for
,
is the
ith explanatory variable that may affect the WTA, and
is the intercept of the regression.
, as the observed WTA for herders,
, is determined by:
To have a strong correlation between
Zi and
Zi′, the probability of
Zi is as below, with
F as the cumulative distribution function (CDF) of
:
Assuming
F follows Logit distribution and takes the natural log to obtain:
2.4.2. Tobit Model for WTA Expectation Value
To estimate the expected value for herders’ WTA, the dependent variable involved typical censored data with left-side and right-side thresholds. Thus, an OLS regression is unsuitable, and we chose the Tobit model for censored data [
21,
33]. Censoring occurs when the interested dependent variable is not fully observed, leading to incomplete information about its true value. In a Tobit model, the dependent variable is roughly continuous in a positive range, assumed to have a normal distribution, but observations below or above a certain threshold are truncated. The estimation of a Tobit regression, as below, involves maximizing the likelihood functions, taking into account the censored observations. The provided regression coefficients indicate the direction and magnitude of the relationships between the predictors and the dependent variable.
where
is observations,
is the intercept
is the coefficients,
is the explanatory variables, and
is the random error.
2.4.3. Explanatory Variables
The core explanatory variables in this study are pastoral household distinctions. Based on the theoretical analysis above, we took horizontal differentiation (employment distinctions) and vertical differentiation (income distinctions) as indicators to measure pastoral household preferences. In this study, the proportion of household non-pastoral income was used to represent the employment distinctions of pastoral households, and the household annual net income in its natural log to represent the vertical distinctions [
34,
35,
36].
Table 2.
Herder household WTA variables.
Table 2.
Herder household WTA variables.
| Variable | Description | Mean | s.d. |
|---|
| Dependent variables |
| WTA | Under the current subsidy
payment level:
1 = strongly unwilling
2 = unwilling
3 = no preference
4 = willing
5 = strongly willing | 3.22 | 0.813 |
| EWTA | Expected subsidy (CNY/mu) | 28.27 | 4.981 |
| Explanatory variables |
| X1 | Horizontal/employment distinction = off-farm income/annual household net income | 12.55% | 0.197 |
| X2 | Vertical/Income distinction = Ln (annual household net income in CNY 10,000) [30,36] | 0.16 | 9.648 |
| Variables related to X2 | Annual household income (CNY 10,000) | 18 | 19.2 |
| Persons/household | 3.8 | 1.8 |
| Per capita income (CNY 10,000) | 4.8 | 5.1 |
| Control variables |
| X3 | Degradation perception:
1 = not degraded
2 = slightly degraded
3 = degraded
4 = severely degraded
5 = extremely degraded | 2.47 | 1.056 |
| X4 | Livelihood risk perception for
reducing livestock:
1 = no risk
2 = somewhat risky
3 = risky
4 = highly risky
5 = extremely risky | 2.97 | 1.090 |
| X5 | Annual operating grassland area (hectares) | 445.82 | 631.762 |
| X6 | Available family workforce
(persons) | 2.11 | 0.863 |
| X7 | Cumulative precipitation from last May to this July (mm) | 460.53 | 116.269 |
| X8 | Household head age (years) | 49.15 | 9.468 |
| X9 | Meat product avg. price (CNY) | 764.44 | 381.826 |
| X10 | Supervision intensity
0–loose
1–strict | 0.48 | 0.500 |
| Type | Grassland type | | |
1 = desert
2 = typical
3 = meadow | 1.69 | 0.692 |
2.4.4. Control Variables
The following characteristic parameters for each household were used as the control variables in the regression.
Household head characteristics (age and education);
Family structure (available workforce and grazing grassland area);
Household location (distance to the local government, precipitation, grassland type);
Grassland degradation perception;
Livelihood risk perception.
The characteristics of the household head, family structures, location and degradation, and risk perceptions were selected as control variables. The main characteristic of the head of the household is the age of the head of the household. Generally speaking, the older the head of the household, the weaker labor ability and the stronger the willingness to accept compensation rather than expanding grazing scale.
The grazing area and the number of labor force members represent the family characteristics. The herder households with large grazing areas were more willing to accept compensation, as indicated by the payment standard on the area basis. The more available workers, the more willingness to expand production and the less willingness to get paid to reduce the grazing intensity.
The distance from the government, precipitation, and grassland type were used to characterize the location characteristics. Being further away from the local government, more precipitation, and a more productive grassland type would favor the grazing activities, thus having a negative impact on the willingness to accept the subsidy.
This study included the assessment of risk perceptions among pastoralist households, specifically focusing on their perceptions of grassland degradation and livelihood risk. We hypothesized a stronger perception of degradation would lead to a higher willingness to be subsidized, while a stronger perception of livelihood risk associated with livestock reduction would result in a lower willingness to be subsidized. To measure these two perceptions, two questions were designed, representing two different types of risk perception.
The risk perception of herders was categorized on a Likert scale of 1 to 5. Question 1 asked herders “How do you think of the current grassland conditions in terms of degradation?” The perception of degradation risk of pastoralists was 1 = no degradation, 2 = not serious, 3 = moderate, 4 = serious, and 5 = extremely serious. Question 2 for herders’ livelihood risk perception was phrased as “Under the existing eco-subsidy standards, do you think it is a risky behavior to get the subsidy in exchange for reducing livestock to the prescribed carrying capacity?” (1 = not risky, 2 = somewhat risky, 3 = moderate, 4 = risky, and 5 = highly risky).
2.4.5. Multicollinearity and Correlation Test
Prior to conducting regression models, we performed multicollinearity and correlation tests among the variables. The results of the multicollinearity test indicate that the independent variables had a maximum variance inflation factor (VIF) of 1.51, with an average VIF of 1.22. These values are well below the recommendation threshold of 10. Furthermore, the VIF values for the 12 variables ranged between 1 and 1.6, and the tolerance of each variable was close to 0, suggesting the absence of any multicollinearity issues.
Additionally, Pearson’s test results revealed that both horizontal distinctions and vertical distinctions significantly influenced the willingness to accept and the expectation value of the subsidy. These findings provide a solid basis for conducting a further empirical analysis.
2.4.6. Robustness Test
To ensure the reliability of the results obtained from the benchmark model consisting of 410 household models (as shown in
Table 3), two robustness tests were performed. First, the ordered Logistic model was substituted with the ordered Probit model, and the model outcomes remained largely consistent (refer to
Table 3). Additionally, a robustness test was conducted after removing ~10% of abnormal samples, and the results of this test showed no significant alternations.
To guarantee the reliability of the Tobit regression model results presented in
Table 4, the same robustness test was performed by excluding ~10% of the sample households. Although these specific results are not shown, they indicate that no significant changes occurred, thereby affirming the reliability of both the ordered Logistic model and censored Tobit model.
In summary, the implementation of these robustness tests served to ensure the credibility and consistency of the model results.
4. Discussion
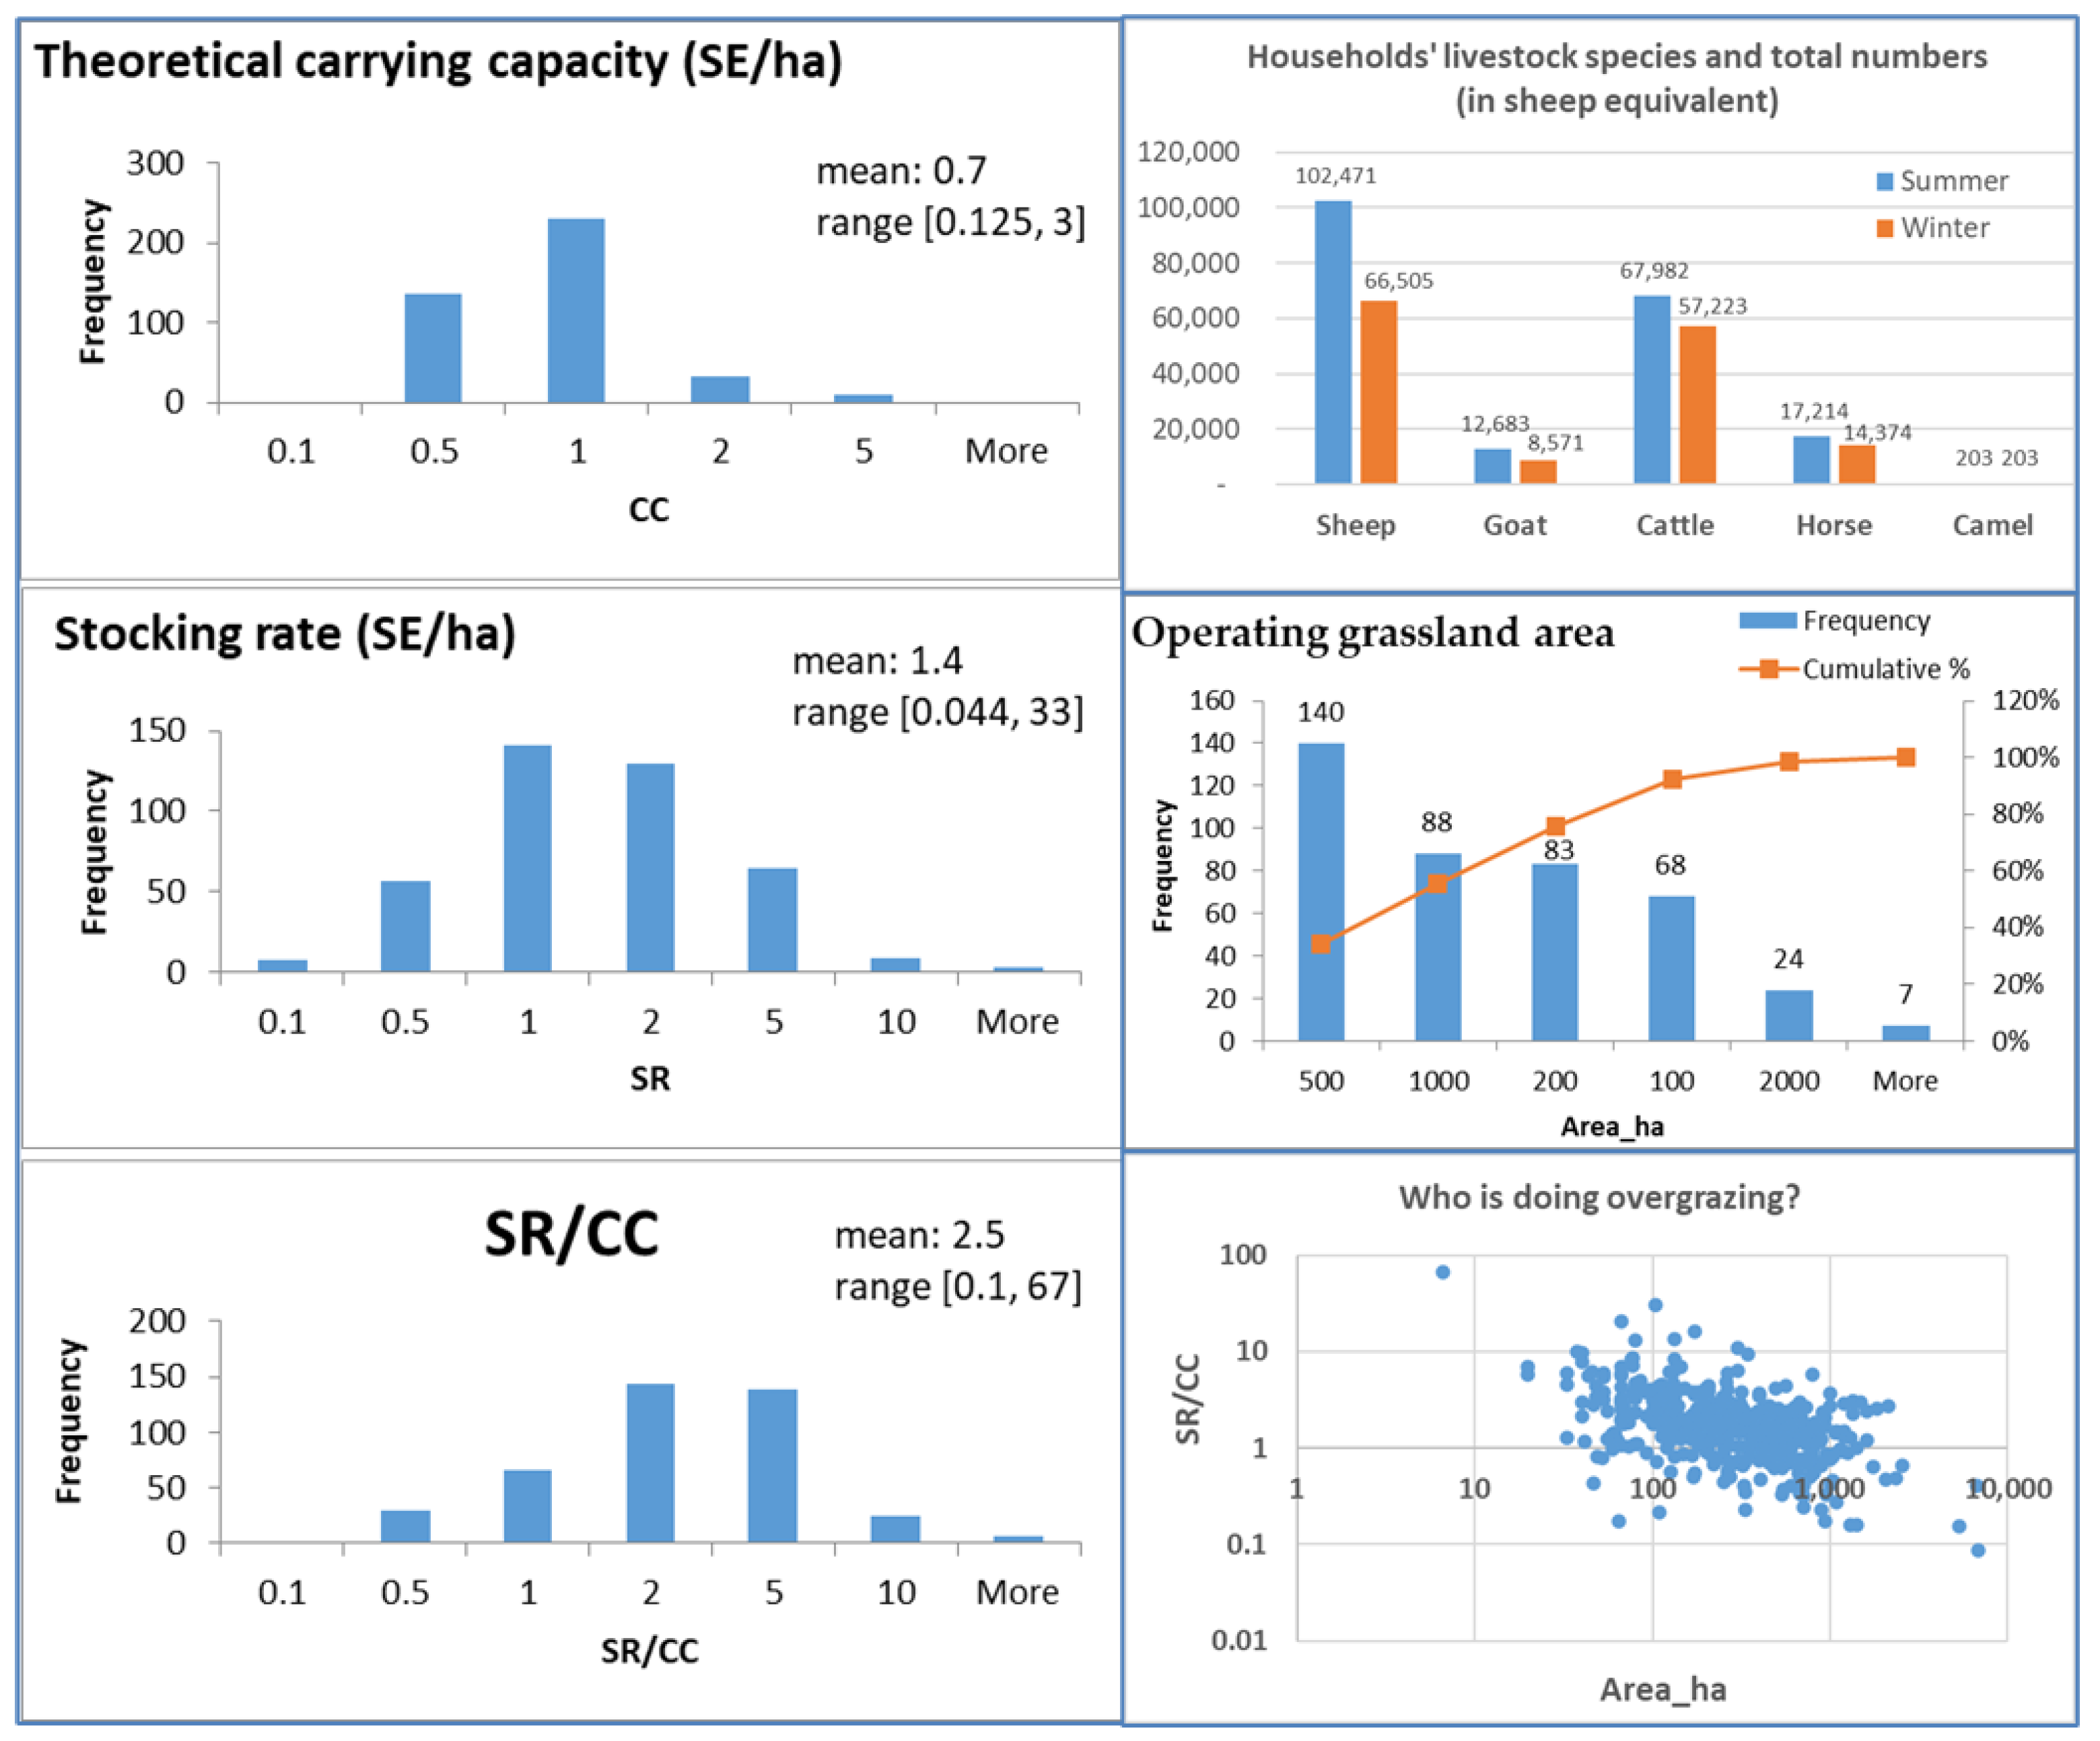
From our herder households in the grass–livestock balance areas across Inner Mongolia, we observed noticeable horizontal and vertical distinctions in both the income source and income amount (
Figure 4), as well as the common occurrence of overgrazing, particularly in association with smaller grazing areas (
Figure 3). Most households heavily relied on grazing for their livelihood, about 90% of households had less than 20% of off-farm income, and reducing stocking rates could be perceived as a livelihood risk that they are hesitant to take, showing as being unwilling to accept the eco-subsidy.
Government statistics show that, based on the national average, each household had received nearly 1500 CNY as the subsidy income [
10]; based on our samples, the average household net income was 180,000 CNY/household (
Table 2), implying the subsidy income accounts for less than 1% of net income. Furthermore, the observed disparity in operating grazing land areas among herder households can lead to a disparity of the subsidy income, consistent with findings from a previous study [
11]. There appears to be a cyclic relationship where having more land leads to a lower stocking rate, resulting in no instances of overgrazing and a potentially higher subsidy income.
Unwillingness was particularly evident when the subsidy payment level fell far below their expectations of compensating their income loss and associated risks—in our estimation, about 30 CNY/mu (expectation for the subsidy payment) vs. 2.5 CNY/mu (actual payment level), a disparity of more than 10-fold.
This substantial gap between the expected and actual payment levels highlights a major factor contributing to the reluctance of herder households to participate in the subsidy program. When the payment is perceived as insufficient to compensate for the potential income loss and risks associated with reducing livestock, herders are less inclined to accept the subsidy and make the necessary changes to their grazing practices. To enhance the effectiveness of the policy and encourage higher participation rates, it is crucial to consider aligning the subsidy payment more closely with the expectations and needs of herder households. Addressing this disparity and ensuring that the payment adequately reflects the income loss and risks can help improve the acceptance and compliance of the subsidy program.
In our ordered Logistic model, eight explanatory variables showed significance. The variables with a positive effect were the horizontal distinction (X1), operating grassland area (X5), and household head age (X8). With higher off-farm income, households relied less on grazing activities, and an increase in the operating grassland area, which is directly linked to the subsidy income, resulted in a higher fraction of off-farm or non-grazing income. Furthermore, as the household head grew older, they tended to prefer off-farm income over labor-intensive grazing activities.
The variables with a negative effect in the ordered Logistic model were the vertical distinction (X2), perception of livelihood risk (X4), available workforce (X6), precipitation (X7), and supervision intensity (X10). A larger income disparity appeared to lower the willingness to accept (WTA) the subsidy, further emphasizing the heavy reliance on grazing as the primary income source for the majority of these households. Consequently, these herders generally aimed to increase their income by expanding production. An increase in net income would heighten the desire and resources to expand the livestock scale but diminish the willingness to accept compensation. When households had a larger available workforce, they tended to increase their stocking and grazing activities to generate more income. Similarly, favorable natural conditions with increased precipitation, indicating a greater availability of grass and forage, led to an inclination to increase stocking and grazing activities rather than reducing the stocking rates and accepting the subsidy, which was anticipated to be insufficient in compensating for their loss due to stocking reduction [
19,
37]. If participating in the subsidy program to reduce stocking means a great livelihood risk, these households would lower their willingness to accept the subsidy. Interestingly, stricter supervision had a negative impact on herder households’ willingness to accept the subsidy, suggesting that incentives need to be self-driven rather than imposed and we need to pay close attention to the participants and most-affected of the PES program—the herders.
These findings highlight the importance of considering economic and demographic factors and the size of the operating grassland area when designing and implementing subsidy programs, as they significantly influence the willingness of herder households to participate and make changes to their livestock management practices.
When estimating the herders’ expectation for the subsidy, the number of significant explanatory variables decreased from eight to five, and they were the employment distinctions (X1) and operating grassland area (X5), both with a negative effect, as well as the net income distinctions (X2), precipitation (X7), and supervision intensity (X10), with a positive effect. The directions of these variables were opposite to their effect on WTA in the ordered Logistic model, thus supporting our hypotheses. The dropped variables were the perception of livelihood risk (X4), available workforce (X6), and household head age (X8). Therefore, the hypothesized horizontal and vertical distinctions were significant in both models. The grassland area, precipitation, and supervision intensity, combined with the identified economic distinctions, played a role in both models.
The estimated expectations we obtained are more than 10 times the current payment level for the grass–livestock balance sub-policy zones. Other studies have indicated a wide range of WTA expectations for higher policy compliance using various methods [
18,
38,
39]. While we acknowledge the potential benefits of increasing the payment level, we also recognize that it may not be practical to significantly raise the payment level, especially not in the near future or by more than 10-fold. Therefore, we suggest considering alternatives to enhance the policy effectiveness.
The theory of forage and livestock, or grass and grazing balance, tries to promote livestock reduction through the ecological compensation policy. However, the effective transmission of this policy to livestock reduction has been lacking. Survey findings indicate that when asked about livestock reduction, herders often referred to the “empirical stocking rate” as the benchmark, similar to the “desirable stocking rate” concept [
40], and believed that reducing the breeding scale to match this rate does not negatively impact the ecological function of the grasslands. When expressing their intention to be compensated, the herders naturally shifted their reference point to the “reasonable loading rate” set by the government. They consider reducing to the loading rate as the criterion for qualifying for the subsidy. However, the herders’ actual loading rate was often much higher than the stipulated reasonable loading rate, especially for herders who had small- or medium-scale operating grassland [
41].
Consistent with our previous study [
20], the herders’ vague understanding of grassland ecology and their deviation from the equilibrium theory, which forms the basis for the eco-subsidy policy, pose challenges in effectively promoting the policy. Unfortunately, our survey uncovered instances of distorted policy implementation where certain herders utilized the subsidy income as a production fund to acquire additional livestock, similar to findings in other studies [
14,
26,
42,
43,
44]. The herders’ understanding of the non-equilibrium ecological theory is reflected in their empirical stocking rates based on their adaptations to the natural conditions. They believed that a flexible stocking rate, determined by factors such as climate change, is crucial for making decisions about the livestock scale while the “reasonable loading rate” is a fixed rate established by government agencies according to the carrying capacity prescribed by the balance theory. Furthermore, the policy applies this single fixed carrying capacity across a region without considering the differentiation among herder households, including factors such as their grassland areas with use–right tenure. For instance, research has shown that small- and medium-scale grassland users tend to experience more severe overgrazing compared to large-scale grassland users and the subsidy shall not be linked to the grassland areas [
41,
45]. Studies also suggest mixed features of equilibrium and non-equilibrium theories in natural grasslands [
46,
47], and such differentiation shall also be taken into account rather than single top–down stocking rate grazing management.
The herder households are the most affected groups by the policy and our findings suggest that we need to consider their distinctions in their off-farm employment and their income levels, provide them with off-farm employment skills and more efficient livestock production, and allow them the stewardship of grasslands. Scholars advocate differentiation in payment levels and a bottom–up approach instead to promote an active role of herders in the implementation of the PES scheme, and to motivate them to participate in the grassland rehabilitation and their livelihood improvement [
1,
48].
Let us take a look at another hypothesis of herders as the “rational economic man” that also forms the eco-subsidy policy basis. In this theory, herders are assumed to be motivated by self-interest and make decisions to maximize their economic utilities. In contrast, ecological and economical rationality suggests that farmers and herders in the ecological economic systems not only consider the economic rationality of “cost–benefit” but also have ecological rationality in pursuing ecological value [
49,
50]. Their environmental perception could significantly lower their expectation of WTA [
48]. The rational ecological individual would recognize that human well-being is interconnected with the health of the natural environment. Here, economic and ecological rationalities are not mutually exclusive; rather, they constitute essential components of a comprehensive, multi-dimensional decision-making process. Ecological rationality suggests that individuals make decisions that are not only economically rational but also environmentally sustainable. It takes into account the long-term impacts on ecological systems and promotes the decision making that aligns with ecological principles. Economic conditions determine economic rationality, and the transition from economic rationality to ecological rationality is only feasible when farmers and herders have an improved livelihood conversion ability [
51], with more efficient livestock production, multiple income sources, and more off-farm employment opportunities. As ecological prioritization becomes the guiding strategy for animal husbandry production systems, educating and guiding herders to shift their ecological understanding to incorporate the balance theory may help for effective policy implementation.
5. Conclusions
Based on the empirical analysis of 410 herder households’ willingness and expectation in the grass–livestock balance area in natural grasslands in Inner Mongolia, this study reveals the impact of herders’ differentiations on their willingness to accept the subsidy. The following key findings and recommendations are highlighted:
(1) Employment or horizontal differentiation of pastoral households had a significant positive impact on the willingness to accept the subsidy and a negative impact on the expectation of compensation, while net income or vertical differentiation showed the opposite pattern.
(2) The current grassland eco-subsidy payment standard appears to be low and insufficient to match the herders’ WTA expectation. The acceptable range for herders in the grass–livestock balance area was estimated to be between 28.27 CNY/mu and 29.31 CNY/mu. The low compensation standards fail to motivate herders who heavily rely on animal husbandry as their main source of income, and limited non-animal husbandry employment options hinder their willingness to accept.
Therefore, our hypotheses H1 to H4 were supported, indicating that a higher diversity in income sources or larger proportion of income from off-farm employment would promote the herders’ willingness to accept the subsidy and lower their subsidy expectations, while a net income disparity would hinder their willingness to accept the subsidy and increase their expectation for the subsidy.
Based on these findings, the following recommendations are proposed:
Enhance the subsidy standard and improve the livelihood conversion ability of pastoral households. Given the substantial gap between herders’ willingness to accept the subsidy and the current payment standard, it is necessary to moderately increase the payment standard. Moreover, a shift from a single subsidy mode is recommended to encourage continued and deepened livestock reduction behavior among herders to address their distinctions and diversity. Furthermore, it is crucial to strengthen non-pastoral skills training, particularly targeting young and middle-aged herders, to expand non-pastoral employment opportunities and enhance their livelihood conversion ability.
Shift the policy from top–down to bottom–up and guide herders to become “ecologically rational people” based on an ecological priority strategy and allow them a more active role in the policy. By coordinating different policies and adopting an ecological priority strategy, herders’ awareness of ecological protection could be enhanced, along with their understanding of ecological and environmental risks, thereby increasing their willingness to accept compensation. Encouraging herders’ active participation in grassland ecological and environmental protection would empower them as key contributors to the preservation of grassland ecosystems.
For future research, we plan to conduct longitudinal studies to follow up with the herders in the policy zones. This will allow us to track and analyze their pasturing behaviors and livelihood outcomes over time under the eco-subsidy programs and in response to changing environmental conditions. By collecting data at multiple time points, we can capture the dynamic nature of the herders’ responses to the policy interventions and environmental changes. This longitudinal approach will provide valuable insights into the long-term effectiveness and sustainability of the eco-subsidy program, as well as the adaptive strategies employed by the herders.


