Abstract
This study aims to identify the success features and indicators of smart cities and real estate projects in order to increase their smartness and integration. Additionally, the study introduces a new comprehensive evaluation framework for both levels; this framework was developed by analyzing scientific literature, indexes, and relevant frameworks. The comparative benchmarks analysis demonstrated the practical application of the framework; seven benchmarks for each level were selected based on selection criteria. The framework is based on seven categories: smart governance, smart people, smart infrastructure, smart energy, smart environment, smart technology, and real estate status. The analysis revealed that cities and projects are adopting smart solutions with a significant integration between the chosen solutions. However, there is still room for improvement at both levels. The range of smart performance and indicators performance is illustrated in the study. The correlation analysis showed a significant correlation between the indicators. Smart real estate followed different strategies for integration into the smart city. Nevertheless, it was discovered that cities could limit smart real estate development in some respects. The study revealed factors and indicators that the municipality, real estate developers, and other stakeholders should focus on in order to achieve smarter development.
1. Introduction
The interest in smart city (SC) development is growing [1]. Many city administrations are adopting SC technologies as an effective way to face global environmental and socioeconomic crises in order to achieve desired urbanization outcomes [2]. Moreover, SC development is seen as a way to facilitate and satisfy users’ needs through the use of integrated information and communication technologies (ICT) [3]. Some countries are shifting to a smarter form of development, such as Japan, which has invested around 507 million USD since 2010 in order to rebuild earthquake-destroyed cities into SCs. With a 333 billion USD investment plan, China plans to transform 80% of its cities into smart cities by 2050 [4].
The efficiency of SCs is heavily dependent on smart buildings (SBs) [5]; SBs build SCs [6]. By 2026, the SBs global market will grow to 121.6 billion USD, at a compound annual growth rate of 10.9% [5]. So far, no certification or rating system exists to identify SBs [6].
Since 2012, real estate (RE) technology-based companies have raised almost 6.4 billion USD in funding in the United States alone. RE smart technologies are used by different participants in the RE industry, including lenders, owners, and investors, in order to collect and distribute industry-related data [7]. However, the CB-Insights and Warburton report revealed that the global RE industry lags five years behind the technology curve [8]. Almost a third of the global RE industry, worth 11 trillion USD, is not utilizing innovative and smart technologies [9]. Most RE establishments lack innovations in the marketplace and so they must catch up in order to support current demands and requirements [6].
SCs and Smart Real Estate (SRE) technologies improve quality of life and facilitate sustainable development [10]. However, no recommendations exist on how these new technologies should be applied to SRE in a SC [11]. Moreover, the EU Parliament revealed that defining city smartness and determining its success is complicated. In addition, it is difficult to point out particular issues and potential improvements within SCs [12]. As such, this study aims to identify the features and success indicators for SCs and SRE and to introduce a new evaluation framework for both levels. The framework is utilized to identify these indicators, evaluate selected benchmarks, define potential improvements, classify the status of SC and SRE, investigate their capabilities, and show their integration and relationship.
This paper is structured as follows. Section 2 presents background information on all parts of SCs and SRE. The study methodology is explained in Section 3. Section 4 introduces the developed evaluation framework for both levels. Section 5 shows the application of the framework on the selected benchmarks. Section 6 reveals the study results and discussion. Finally, the conclusion is illustrated in Section 7.
2. Background
2.1. Defining Smart Development of Cities and Real Estate Projects
Over the years, the determination of smart development level and understanding its ingredients has been proposed and developed [13]. The initial concepts of smart development faced many criticisms, due to a restricted focus on the technological side alone. The smart development concept evolved to adopt an anthropocentric approach that invested in human and social development, in addition to the techno-oriented infrastructure; this led to the enhancement of economic status and quality of life [14]. Nowadays, smart development concepts extend beyond the initial perception of using technology and innovation to tackle urbanization issues and now include the incorporation of sustainable development policies and practices to actively mitigate the effects of urbanization [13].
The origin of the term SC can be traced back to the 1990s [15]. It began with the concept of a knowledge-based city, considering that city development elements change based on knowledge. In the following year, the term global city was invented; this was the first time a direct impact on the whole globe occurred. The term gave the city a direct and tangible impact on global affairs through socioeconomic means. In 1993, the phrase ‘ubiquitous city’ was first mentioned; this phrase is considered, to an extent, as a synonym to SC. It foresaw the link that digital networks in the built environment could provide for users to both connect with other users as well to all goods they might need at any time [16]. With the evolution of these concepts, the MESH (Mobile, Efficient, Subtle, Heuristics) city concept was born; this is the primary association of the term ICT in connection with the modern infrastructure of a city [17].
The definition of SC has been used with different meanings. However, no definition has been agreed upon by researchers. An SC can be identified as a city encompassing many interrelated sectors, including transport, education, healthcare, public security, infrastructure, logistics, resource use, RE, ICT, and others. These sectors have an impact on the daily lives of the urban population [17].
SRE is a combination of user-centered, sustainable, and innovative technologies for efficiently managing RE resources in an urban area and making key information available to consumers, managers, and agents. SRE process management includes data collection and its processing and dissemination by computers and connected technologies to enhance the user’s quality of life. It has specific measures for privacy and data security [8]. Cisco identified SRE as one of the four main pillars of SCs [17].
In theory, the smart development model is a derivative of other existing smart urban development concepts; despite the fact that cities differ from one another in terms of culture, climate, economy, ethnicity, and geography, most SC concepts align [14]. Adopting a ‘lessons learned’ approach, where cities implement policies from successful SCs, could help in improving the performance of traditional cities in a limited way. This process can be a starting point towards smart development [13].
In practice, to provide beneficial smart development solutions for cities and RE to turn into smart versions, adopting the “one-size-fits-all” model of SCs and SRE would not be applicable [14]; instead, they must develop their own best-point solutions [13]. The smart development model is channeled through scoring systems and benchmarks, while the smart components and frameworks are developed as a tool to assess and implement smart development [14]. SCs and SRE ranking and assessment should be reconsidered based on this unified framework in order to test their performance.
2.2. Smart City (SC) Components
Based on the review of various sources [18,19,20,21,22,23,24,25,26], Figure 1 summarises SC components and their smart dimensions and elements. Seven smart city components were selected due to being interrelated with the SC and SRE. The components were categorized as smart governance, smart people, smart environment, smart infrastructure, smart energy, smart technology, and smart buildings. These components are linked together with SC technologies, and they are critical factors for developing the evaluation framework.
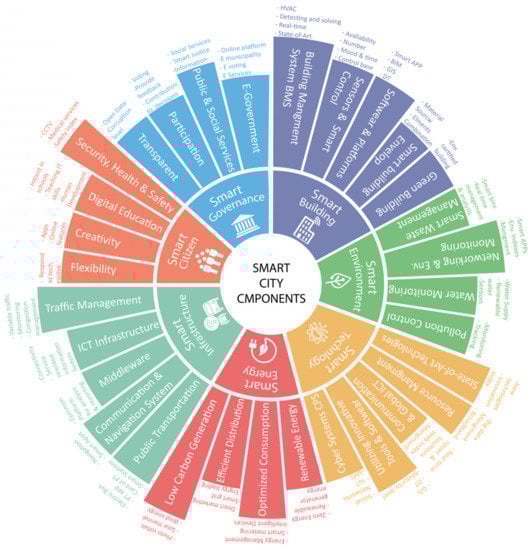
Figure 1.
Smart City Components, Source: Author, 2023.
Multiple dimensions of smartness would contribute to the development of each component. For example, smart governments include: participation, as a smart government allows public participation in decision-making and the ability to contribute and provide suggestions; transparency, to make data available for all users as the decisions and plans should be shared via different social platforms [19,22,27]. In addition, IoT devices, as these contribute toward improving the general quality of life for smart citizens; these devices focuses on promoting the creativity and engagement of the people. Health and safety dimensions are critical for this component; these factors should be provided through E-health, telecare, accessibility to public and open spaces, and video surveillance to provide safety for the people [14,28].
The smart energy system consists of the intelligent integration of decentralized sustainable energy sources, efficient distribution, and optimized power consumption. Efficient distribution in the smart energy system is made possible by the use of smart infrastructure, smart grid, and smart meters. The core of a smart energy system is the information infrastructure; this is responsible for collecting energy consumption information as well as sharing provider rate information [23,25]. Smart technology is key for the design, implementation, and operation of SCs. It is linked to all the smart components through a variety of state-of-the-art technologies that contribute to smart development [25].
The smart environment includes environmental data collection, monitoring and analysis for pollution reduction and control, water quality and supply monitoring, and smart waste management. Smart environment applications are typically based on ambient and chemical sensors. However, these applications are not only limited to sensors. They also contain smart policies and strategies, including waste management strategies and waste production control policies [23,28,29]. Smart buildings are empowered by ICT in the context of merging the Internet of Things (IoT); these buildings are equipped with sensors, actuators, and smart systems that allow for data collection, filtering, and production, thereby increasing user satisfaction [30].
Smart Infrastructure includes the ICT infrastructure that is fundamental to the construction of SCs and depends on factors related to its availability and performance, including communication infrastructure [25]. The Smart transportation system is part of this component, which shifts from traditional transportation systems to Mobility-as-a-Service, where a smart IoT infrastructure connects different users and entities (personal devices, transport systems, sensors, etc.) [23].
2.3. Smart Technologies
Smart technologies and solutions have a crucial role in SCs that goes beyond the traditional objectives of optimizing urban services and improving quality of life [3]. The core concept of a SC is the idea of using data to measure and improve the performance of urban systems through the integration of ICT, big data, and the various devices and technologies connected to the IoT network. This is achieved by employing data and communication through Artificial Intelligence (AI), Machine Learning, Geographic Information Model (GIS), and Digital Twin (DT) and creating systems that efficiently optimize city operations and services [31,32,33,34,35]. Figure 2 illustrates the relationship between different technologies within the SC.
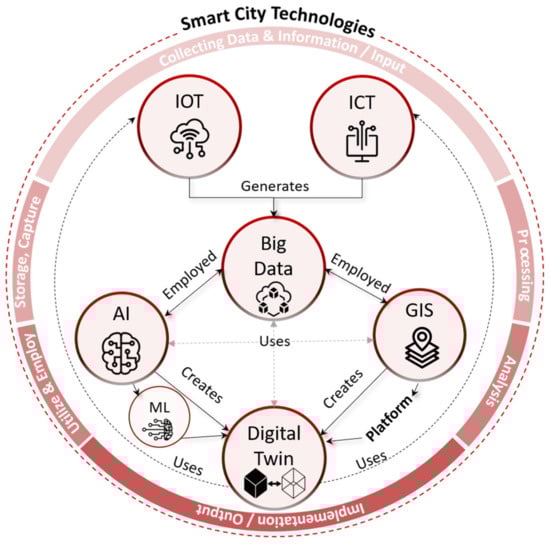
Figure 2.
Smart City Technologies, Source: Author, 2023.
When combined, these technology frameworks allow for the establishment of urban systems that can collect a vast array of data related to the functioning of a city in real-time, and that can analyze the data and adapt the system in response. The degree of urban intelligence can be measured by the available smart elements that the city has access to. However, integrating these elements is based on smart technologies [36]. SC systems are capable of learning by monitoring responses and can thereby optimize performance. SC technology does not only connect to citizens, but also it allows city officials to interact with the community and the infrastructure [15]. SC applications are developed in order to allow responses in real-time; therefore, the SC has a better responses to challenges [25].
Ullah’s 2018 [8] study reviews the adoption of disruptive technologies in RE, with a focus on nine technologies under the title ‘Big 9’. These include big data, virtual realities VR, 3D scanning, drones, IoT, software as a service (SaaS), clouds, robotics and AI, and wearable tech. These technologies were examined and reviewed based on 213 related published articles. In addition to the Big 9 study, other authors [6,37,38,39] identified additional RE technologies and solutions. Table 1 categorizes and lists these technologies.

Table 1.
Smart Real Estate Technologies, Source: Author,2023.
2.4. Strategies for Real Estate Integration into Smart Cities
The level of RE integration into the SC depends on the SC network’s capabilities and the resources provided by the RE developer. Several RE developments in SC strategies are possible, but the RE smartness and intelligence level differ from one strategy to another. Three integration strategies were identified. In the ‘leading’ strategy, RE development became the dominant factor in smartness, affecting its surroundings and setting a new level for other developers to follow. In the ‘following’ strategy, the development follows the dominant and leading developments as a benchmark; these developments might be in another location to the original development. Lastly, in the ‘waiting strategy’, the development uses the fragmented features of intelligence and smartness. All strategies should follow a coherent plan [30].
2.5. Added Values of Integration of Smart Technologies in Real Estate and City Development
The smart development concept is more than just creating an app; instead, it is the complex integration of components, application networks, and infrastructure for the city. There are numerous correlations between urban planning and city growth. Many elements are necessary when the population of a region or neighborhood grows. To understand and make smart decisions for city growth, an in-depth knowledge of these elements is required [3]. The successful SC and thus also the smart neighborhood should follow the triple bottom line of sustainability of social, economic, and environmental improvements. They must improve the quality of life for its inhabitants, maximize resource efficiency to decrease pressure on the environment, and provide a green economy focused on innovation as well as developing governance and local democracy [4].
Nowadays, cities consume about 75% of the world’s resources and energy while producing about 80% of the greenhouse effect [15]. SCs reduce resource and energy consumption, improve operational efficiency and enable efficient asset management and allocation. In terms of the environment, SCs improve the waste management system and reduces greenhouse emissions; this is in contrast to traditional cities. SCs enhance real estate development (RED), increase stakeholder participation, and increase the transparency of government affairs information through the big data platform, leading to smart decision-making by the government [10,32,40]. SCs provide a flexible adaptation to consolidated city development and offer an innovation platform for new entrepreneurial initiatives, followed by economic and social improvement. Additionally, SCs save public funds on services and infrastructures as a result of optimization and provide real-time information, making the residents aware of their needs [15].
Traditional buildings consume more than 40% of the world’s energy and account for 24% of greenhouse gas emissions. In addition, they are major water, materials, and land users. Reducing the environmental impact of buildings is a priority [41]. SRE has numerous advantages for the occupants and the owner. These developments are designed to preserve limited resources, contribute to perceived quality of life growth, and integrate individual building systems. Studies have shown that smart real estate can increase employee productivity by up to 23% through smart lighting systems and smart workplaces [1].
Additionally, smart real estate provide high security, ventilation, sanitation, physical comfort, and space availability measures. They improve sustainability and reduce energy consumption. The operational energy efficiency of smart buildings is defined through various automation factors, such as power management, HVAC control, metering, and lighting control. The use of smart devices provides accurate data on the usage of buildings that assists effective decision-making processes. Sensors provide precise data that assists in making effective decisions [40]. The development of SRE enhances the SC, urban development, and national economy, thereby leading to a better quality of life [30].
3. Research Methodology
3.1. Justification of Selection Criteria
A comparative analysis was conducted in this research. The analysis was applied at SC and SRE levels, as illustrated in Figure 3. Seven benchmarks were selected for each level, and were selected using a selection criterion. The selected benchmarks were compiled, compared, and evaluated using an evaluation framework for each level which is developed in the research. The comparative analysis provided a better understanding of each level, illustrating the integration and relationship between SRE and SC. The selection criteria aimed to identify and select the SC as a first step, and then a smart project within the selected city was identified.
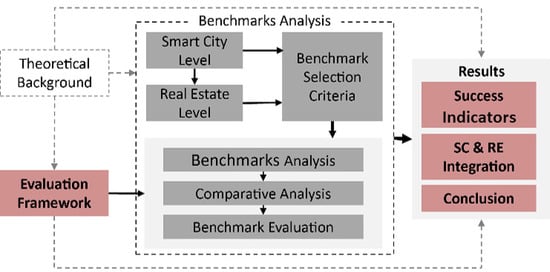
Figure 3.
Research methodology, source: Author, 2023.
The selection criteria for both levels are illustrated in Figure 4. The aim of selecting these benchmarks is to both identify and measure the current status of the leading SCs and SRE; this provides an insight into what has already been achieved, which elements still need improvement, and also sets realistic goals for cities and projects to follow with today’s smart market. The selected RE benchmarks are located in the selected SCs.
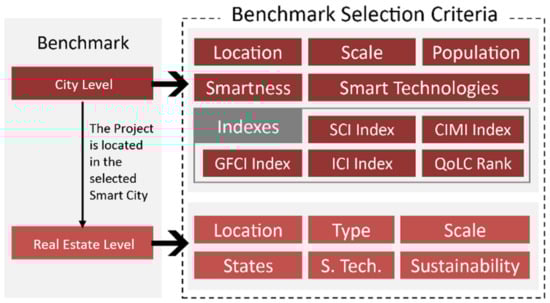
Figure 4.
Benchmark Selection Criteria. Source: Author, 2023.
The SC selection criteria are based on ten main elements, which are described and justified in Table 2. The benchmarks should be listed in five different indexes to ensure their suitability as leading SC benchmarks.
Table 2.
Benchmark Selection Criteria Description and Justification—City Level.
The selected RE projects are based on six elements, starting with the project location limited to the selected cities only. Each criteria element is described and justified in Table 3.
Table 3.
Benchmark Selection Criteria Description and Justification—Real Estate (Project) Level.
3.2. The Purpose of the Evaluation Framework
The introduced evaluation framework aims to identify the success indicators of SCs and SRE. It introduces a set of indicators for each level that can assess their performance in different aspects and determine the deficiencies while highlighting the potential improvements that can be made to reach a smarter status. The framework also aims to disclose the interoperability capabilities between both levels and emphasize the future trends and development of the indicators. It is a flexible framework that can be modified and evolved. It can include new indicators for future technologies.
The framework can serve municipalities, RE developers, contractors, and owners when building future SCs and SRE. It would also help them make an informed investment decision on future smart developments. Additionally, the framework can be utilized by different entities and researchers. It can be incorporated into their scheme and can be developed further with a more comprehensive approach. The framework can be utilized for evaluating existing cities and RE, allowing their current status to be determined and can be used to identify potential measures that can be adopted in order to increase their smartness level. At the same time, it can be utilized for planned SCs and SRE, as it can help to identify a road map and the requirements for their creation.
3.3. Evaluation Framework Development and Benchmark Analysis Process
The evaluation framework is constructed based on multiple layers. The main evaluation categories were selected based on the analysis of different existing classifications and SC components, taking into account the major interconnectivity aspects between SCs and SRE. Seven categories were selected as interrelated to SCs and SRE: smart governance, smart people, smart infrastructure, smart energy, smart environment, smart technology, and RED status as an additional category, included due to its importance to this research. Both SCs and SRE share the same main categories.
The second basis for the evaluation framework is the subcategories developed under the main categories. The subcategories include a set of indicators. These indicators are selected according to the theoretical background, desk study, evaluation framework indexes, other frameworks, and publications. Figure 5 represents the development of the framework and the benchmarks analysis process, showing the relationship between each part.
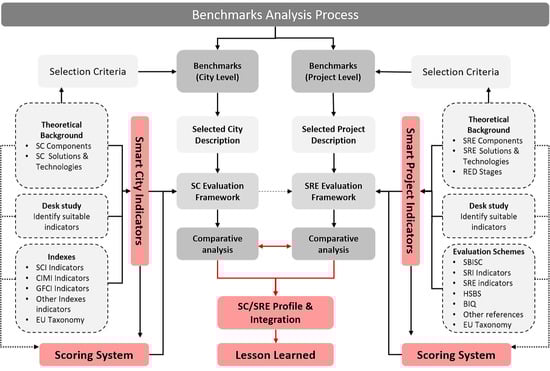
Figure 5.
Benchmarks analysis process and source of indicators, source: Author, 2023.
At the SC level, indicators were selected based on the SC components, solutions, and technologies. Several evaluation schemes and indexes were used to extract suitable indicators for the evaluation framework. SCI, 2021 [42], CIMI, 2020 [43], EU Taxonomy, 2020 [47], Kaluarachchi, 2022 [27], and Sharifi, 2020 research [48] had a significant impact on indicator selection. Other indexes, frameworks, and references were used.
At the RE (project) level, indicators were selected based on SRE components, solutions, and technologies. Various smart building evaluation schemes were beneficial for extracting some subcategories and indicators at the RE level. The smart building integration into a SC (SBISC) study and evaluation framework [11,30], smart building evaluation System by Jain [6], and the Big 9 study [8] had a major role in selecting the indicators. Other indexes, frameworks, tools, publications, and references were used, including EU Taxonomy, 2020 [34], and The EU Smart Readiness Indicator (SRI) scheme.
4. Evaluation Framework
4.1. City Level
A total of 28 subcategories and 85 indicators were used to evaluate the SC as shown in Table 4. Each indicator’s score weight was identified based on its importance and relevance to the evaluation criteria. The evaluation matrix was applied to the selected benchmarks in the following Section 5. The total score was 560 points, distributed equally, with 80 points for each category.
Table 4.
Smart City Evaluation Framework, Source: Author, 2023.
4.2. Real Estate (Project) Level
A total of 90 indicators in 28 subcategories were used to evaluate the smart project as shown in Table 5. Each indicator score weight was identified based on its importance and relevance to the evaluation criteria for the SRE. The overall score was 255 points, distributed based on the category relevance to SRE. Smart technologies are considered the core of the SRE; as such, it had the highest share of points (60 points). Smart energy and smart environment are significant categories, with 40 points each. Smart Infrastructure and RED status had moderate importance, with 35 points each. Smart people and smart governance had an indirect relation with a moderate impact on SRE, with 30 points and 15 points, respectively. The scoring criteria are illustrated in the supplementary materials (Table S2).
Table 5.
Smart Real Estate Evaluation Framework. Source: Author, 2023.
5. Benchmark Analysis
The benchmark analysis was crucial for this study in order to test the evaluation framework, to understand how SC works, and to define its impact and integration with SRE projects. The benchmarks study gives an insight that helps to define SC principles in both theories and practice.
5.1. City Level
5.1.1. Smart City Selection Process
Based on the selection criteria illustrated in Table 2, seven cities were selected from four different countries, as shown in Figure 6. The description of each city in terms of area, population, and performances in various relative indexes and the average ranking is illustrated in Table 6.
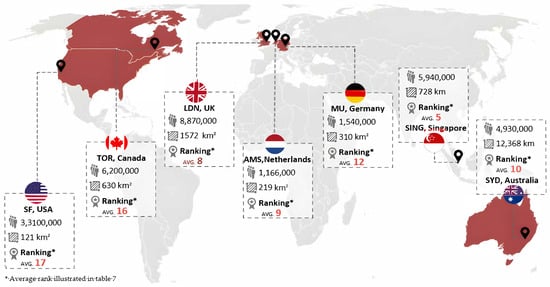
Figure 6.
Selected Benchmarks—City level, Source: Author, 2023.
Table 6.
Selected Benchmarks Details and Performance in Relative Indexes—City level, Source: Author, 2023.
5.1.2. Selected Benchmarks General Description
Amsterdam (AMS), Netherlands, Europe. Amsterdam was one of the early adopters of the SC concept in Europe. The strategy was embraced in order to strengthen the territory’s competitiveness and transform it into one of the most innovative regions in Europe by 2025 [49]. It was named the European Capital of Innovation by the European Commission in 2016. AMS’s economic board has launched the “Amsterdam SC online platform”, which lies at the heart of the city’s strategic approach. The platform aims to enable collaboration and transform it into a SC by adopting a sustainable economy, efficient use of natural resources, and promoting a better quality of life for citizens [49].
London (LDN), United Kingdom, Europe, is considered to be the smartest and most sustainable city in the world, according to CIMI, 2020; for the second year running, it has been deemed the smartest city in the world. As a smart city, London is seen as a thought leader and pioneer; it launched the integrated transport Oyster smartcard in 2003 and introduced a congestion charge in the same year. In 2010, it established an open data platform and brought in a pay-as-you-go. In 2018, the latest SC roadmap—Smarter London Together—was implemented in order to make LDN the smartest city in the world [50].
Munich (MU), Germany, Europe. The SC framework strategy is being implemented in MU. Increasing amounts of SC technology is being introduced to the city by many smart projects, including City-2-Share, Civitas Eccentric, Directions, E2rebuild, and Smarter Together. These projects have introduced several technologies for reducing CO2 emissions, increasing renewable energy use, energy efficiency, and integration with smart mobility solutions, innovative ICT solutions, and providing an urban data platform, for a smarter make MU a smarter city [51]. An operational DTs, representing a digital city, including 3D representation and sensors, enable municipal departments to implement various uses and facilitate decision-making [52,53].
Singapore (SING), Singapore, Asia, has been recognized as the world’s smartest city, according to SCI, 2021 [42]. The city-state constantly tests urban development customs built around the principles of innovation and sustainability. SING was the first to earn the “smart nation” title [54]. It has the world’s first DT of an existing city-state, providing its users with an effective way to engage in the digital economy and urbanization [34]. Many innovations are used in SING, including the “Vehicle-to-Everything” (V2X) project, probably one of the world’s most technologically advanced systems of its kind [54]. In 2018, SING was considered the best blockchain city in the world [55].
Sydney (SYD), Australia, Oceania. In 2020, SYD released a SC strategic framework to harness the opportunities brought about by digital disruption, to plan for uncertainty, and to sustain a global reputation as a leading place to live, work, learn, and visit. SYD is a leading business and professional services hub in the Asia-Pacific region [56]. SYD was one of the first local councils to establish an online hub to ensure that public consultation is supported by digital engagement. It applies technology in different SC components, including smart shuttles communicating with urban infrastructure [57].
San Francisco (SF), United States of America, North America, has been consistently ranked among the leading SCs globally since 2011. SF uses technology to reduce energy use, create more efficient buildings, and develop its waste management and transportation systems, all of which have contributed to greening the city while making mobility easier. The city is also aiming for zero waste, zero emissions, and vision zero traffic fatalities by 2024 [58]. It is home to cryptocurrency trading platforms and is ranked the fifth top blockchain hosting city globally [55].
Toronto (TOR), Canada, North America. In 2017 and 2018, TOR started several SC initiatives and participated in the Canadian Federal SCs Challenge, designed to encourage innovative solutions to urban challenges in partnership with municipal leaders, organizations, and non-profit and academic partners. TOR has outlined an approach to its Smarter Cities Initiatives. Planning for two major projects is the city’s submission to the Canadian SCs Challenge and Sidewalk Toronto partnership, and several divisions within the city have also been undertaking their SC projects [59].
Table 7 summarizes the evaluation of the benchmark at the city level, a detailed scoring is provided in the supplementary materials.
Table 7.
Summarized Benchmarks Evaluation—Smart City level.
5.2. Real Estate (Project) Level
5.2.1. SRE Selection Process
Figure 7 illustrates the seven selected benchmarks at the RE level based on the selection criteria in Table 3. These benchmarks are located in the previously selected cities. Table 8 describes the projects in terms of area, budget, status, number of floors, and sustainability certificates.
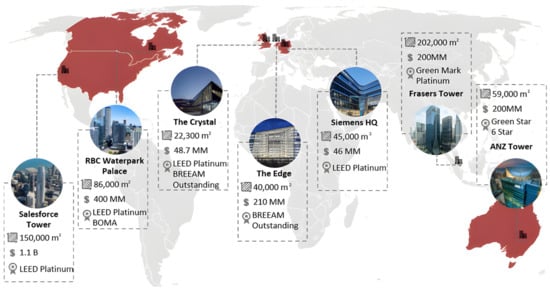
Figure 7.
Selected Benchmarks—Real Estate (Project) Level, Source: Author, 2023.
Table 8.
Selected Benchmarks Details and Performance in Relative Indexes—Real Estate (Project) Level.
5.2.2. Selected Benchmarks General Description
The Edge, Amsterdam, Netherlands, is described as the smartest building in the world and the greenest building in the world. According to BREEAM, the building achieved the highest score ever (98.4%) in 2015 [30]. It is located in the city’s economic and financial center. It optimizes the efficiency and productivity of its users and showcases the benefits of BIM in SRE. The Edge was built with the IoT as its foundational principle. With its implementation of smart technologies, it captures many of BIM’s benefits. The building has the world’s most efficient aquifer thermal energy storage system, providing all the required energy. It has 28,000 sensors for motion, light, temperature, and humidity. The Edge uses an app that tracks the user’s schedule and acts as a pass to all the building’s facilities. The investment is expected to be earned back in only 8.3 years [60].
The Crystal, London, The United Kingdom, is the first building to achieve Outstanding BREEAM and Platinum LEED accreditations. The building has been built on a brownfield site in a historically industrial area. It has been designed to adapt and respond to the surrounding environment as technology evolves. The Crystal produces 20% of its energy using photovoltaic cells and uses 100% natural heat sources; it has no heating bill. It consumes 46% less energy and emits 70% less CO2 than comparable office buildings. The BMS detects outdoor and indoor weather conditions. The building is 90% water self-sufficient, with an approved drinking water safety plan; this is the first in a commercial building to be approved in the UK. The building uses over 3500 data points from IoT sensors and devices, with 2500 individual building control devices. In addition, it measures used electricity and compares its performance against other buildings [61].
Siemens Headquarters, Munich, Germany, is a certified Platinum LEED and DGNB building. Located in downtown Munich, the new headquarters was designed to be essentially energy self-sufficient. Primary energy is based on district heat generated by geothermal heat pumps, and free cooling is achieved through cooling towers. The building uses 90% less electricity, 75% less water, and produces 90% fewer CO2 emissions. A photovoltaic system supplies one-third of the overall power consumed by 7400 LED lamps, thereby cutting energy consumption. The building uses over 300 km of data cables in 150 control cabinets to provide data on temperature, air quality, lighting, and building security, and 30,000 data points continuously analyze the building. The DESIGO system from Siemens links all subsystems [62].
Frasers Tower, Singapore, Singapore, is a Green Mark Platinum-certified building situated within the central business district. The building is well connected with its surrounding public transport system and open space and has its own park. It uses many sustainable solutions, including escalators and regenerative lifts, which generate energy for the building. It uses a ductless fan system that reduces power consumption, water recycling for irrigation, and sustainable and recycled materials. The building is fed by over 2100 data points connected to the cloud; the platform enables holistic environment management. In addition, 900 lighting, 179 Bluetooth Beacons, air quality, and temperature sensors gather data in real-time, enabling operators to optimize building spaces for maximum efficiency. It has a DT, providing an smart building blueprint, using BMS that manages and controls the building’s various systems [63,64].
ANZ Tower, Sydney, Australia, is an addition to the Sydney skyline and has been awarded the highest possible rating by the Green Building Council of Australia, with a rating of 6 Star Green Star—Office Design v2; it also has been awarded KNX Award. The building consumes 30% less energy and emits 69% less CO2 than comparable office buildings [65]. UV lights in the building emitters in all air handling units are used to improve air quality. The building is fully integrated with the smart grid. The building uses audio-visual interfacing, and BMS manages and controls the building systems, allowing lighting scheduling throughout the building. Demand control ventilation assisted by CO2 sensors adjusts demand and delivers fresh air. The building has a time-controlled purging system to eliminate office-generated contaminants [66].
Salesforce Tower, San Francisco, USA, is the tallest building allowed in SF by zoning, and it is the first pre-certified LEED Platinum Core and Shell project in SF. The converged network approach has increased the building’s performance, functionality, and environmental sustainability by converging the building management and metering systems. It enabled the building’s operator to gather and make informed decisions. The building’s sustainable solutions reduce energy by 30%, emissions by 7040 MTCO2e, water consumption by 30% below code, and divert around 1500 tons of waste. It uses a first-of-its-kind HVAC system with floor-by-floor air handlers. The building DT helps to understand the use of space and modeling and energy modeling [67,68,69].
RBC Waterpark Place, Toronto, Canada, is the first commercial tower in Toronto to achieve LEED Platinum CandS and LEED gold for OandM certifications; also in addition, it achieved a rating of 100 in Energy Star. Employing the highest standards in sustainable design, it uses energy-efficient lighting, reduces water usage by 35%, and utilizes a deep-water district cooling system. Around 60% of the building’s roofs are green, irrigated only by stormwater. The heat gain is reduced by using sunshades and fins and low-emitting building materials. IoT sensors in the building gather and store data, providing valuable insights and visibility to assets, energy equipment, and the environment. Power over Ethernet enables real-time data monitoring. Demand control ventilation is assisted by CO2 sensors [70,71].
Table 9 summarizes the evaluation of the benchmark at the RE level. Detailed scoring and its justifications are provided in the supplementary materials.
Table 9.
Summarized Benchmarks Evaluation—Real Estate (Project) level.
6. Results and Discussion
According to Table 7, London has ranked as the smartest city among selected benchmarks, scoring around 70%. The average score of the selected benchmarks at the SC level is 65%. At the SRE level, Table 9 illustrates that The Edge in Amsterdam has ranked as the smartest RE among selected benchmarks, scoring 84%; the average score of the selected benchmarks is 72%. The framework is designed for ultimate performance, considering the future evolution of the evaluated elements. Only an ideal SRE in an ideal SC would a building have a full score, so the selected benchmarks score is considered in a range of good to very good in the current state; these can be references for other projects to follow.
Figure 8 and Figure 9 capture the highest and lowest scores achieved by the selected benchmarks, creating a smart performance range of the selected benchmarks. These ranges guide evaluators to assess the position of the evaluated SCs and SRE, and to identify if they are within the smart performance range. In some categories, the difference range is insignificant; in others, the range drops significantly, such as for the smart energy for both levels. This means that some failures in the used techniques can be identified or that some crucial smart elements are being neglected.
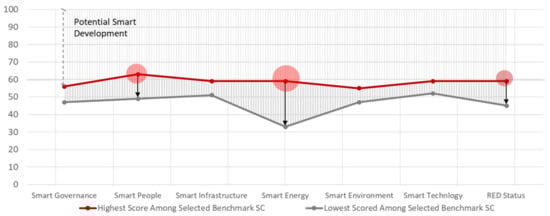
Figure 8.
Performance range between highest and lowest scores (city level), source: Author, 2023.
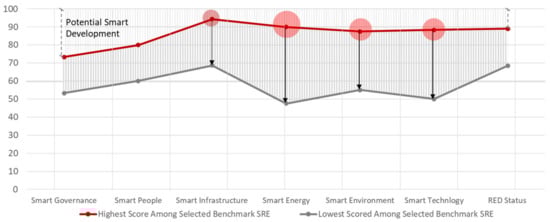
Figure 9.
Performance range between highest and lowest scores (Project Level), source: Author, 2023.
The evaluation framework revealed that there is still a gap in SCs and SRE even for the selected benchmarks; this should be developed further and improved to reach a smarter state on both levels. Figure 10 illustrates the SRE and SCs level performance in each smart category based on the average performance of the selected benchmarks. On average, the leading category at the SC level is smart technology and smart infrastructure for the SRE level.
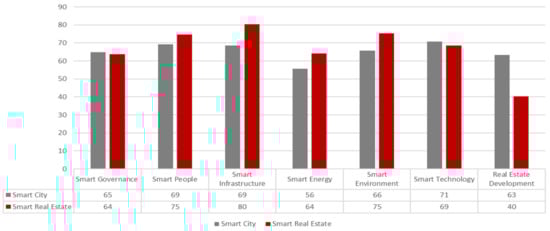
Figure 10.
Selected Benchmarks average performance in the main smart categories, source: Author, 2023.
The gaps can be identified as potentials for improvement on each indicator. Figure 11 illustrates the average performance of the selected SC benchmarks, indicating the impact, performance, and importance of SC indicators. Some indicators are already developed, used, and commonly utilized in all selected cities and can be considered critical factors for a successful SC, including and not limited to the available middleware platform, big data management, utilizing DT, GIS, smart grids, smart waste management, the growth of SC market, and traffic management. Other indicators are developed with potential for improvement. They are considered essential to the SC, such as the accessibility to the local government decisions, the satisfaction level of public transport, CO2 emission, smart home devices ownership, online governmental documents, and other indicators that can be improved.
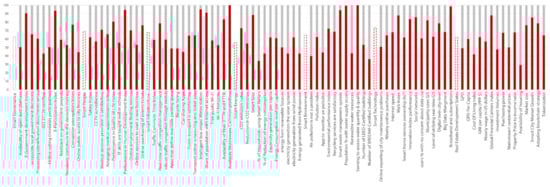
Figure 11.
Smart City indicators average performance based on selected benchmarks, Source: Author, 2023.
Other indicators require further development, such as online reporting of city maintenance problems, availability of open data platforms, renewable water resources, utilization of different types of applications, and the reduction of energy consumption. A major improvement is required for a limited number of indicators; this would help to obtain a smarter and more sustainable city, and includes the number of green-certified buildings, the number of households using smart meters, and the generated energy in different types of sources.
The selected SRE projects had a significant reduction in resource consumption, with an average reduction of 48% for energy consumption, 65% for water consumption, and 67% for CO2 emission. Some indicators are already developed; they are used in the selected projects and are critical for successful SRE, as shown in Figure 12. These include utilizing BIM, availability of sensors and actuators, using smart processing big data, real-time management, and pre-design studies. Some other indicators require minor development, such as expected payback, data points from IoT, governmental support, BMS, GIS utilization level, and ICT connection. Various indicators need to be developed, including the connection to the city BigData, smart construction management process, and response to the technology as it evolves. Other indicators that are in major need of development would make the building more connected to the city, such as the DT maturity level and being linked to the BigData platform, increasing the connection to the SC.
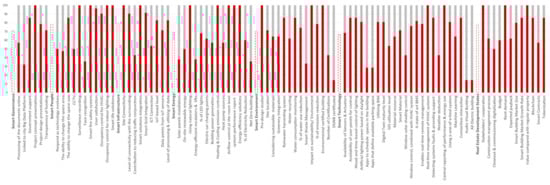
Figure 12.
Smart Real Estate indicators average performance based on selected benchmarks, Source: Author, 2023.
Figure 13 represents the sectional analysis of selected benchmarks’ SRE integration into SCs and the performance of both levels in each category. Although MU was ranked fifth on the SC level, the city’s SRE was ranked third; this shows that the SBs can follow the different strategies explained previously in Section 2.3.
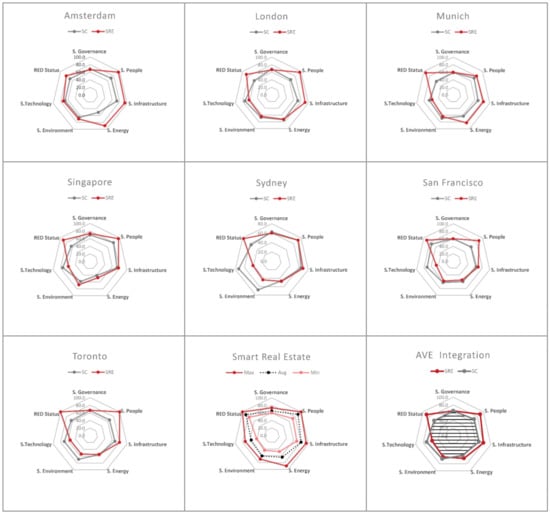
Figure 13.
Sectional analysis of selected benchmarks’, Smart Real Estate integration into Smart Cities and the performance.
SRE in AMS, MU, and LND followed a leading strategy, as they are more developed than established elements in several SC categories. Both projects in SING and TOR adopted the following strategy, proceeding with what already exists and exceeding it in some areas. The SF and SYD projects followed the waiting strategy, using fragments of the SC decreasing in some areas other than the SC and expanding in others.
The sectional analysis shows that the SC performance limits the smart governance at the SRE level, and all selected SRE did not exceed that limit. As for the average, the projects adopted the leading strategy in RED status, smart people, smart infrastructure, and the following strategy in smart governance, smart environment, and smart energy. The smart technology followed the waiting strategy, as it decreased in performance in that area; this can verify that the SRE technologies are still behind the curve, as mentioned in Section 1.
Correlation analysis was conducted using SPSS (Statistical Product and Service Solutions) software on both SC and SRE levels and their integration. The analysis was tested on three classifications: main categories, subcategories, and indicators. The analysis revealed a significant integration and mutual impact between SC and SRE, and there is a correlation between most of the elements. Table 10 identifies the significant correlation between the main category classification levels. Significant correlations have been detected between different categories. Smart infrastructure, smart governance, and smart technology had the highest correlation and impact on different categories within both levels and their impact on each other.
Table 10.
Significant Correlation—Categories Classification, Source: Author, 2023.
Significant correlations were identified for the subcategory’s classification. E-government, transparency, and ICT infrastructure were identified as some of the significant correlations, with the highest count at the SC level. ICT infrastructure, smart data solutions, and BMS were identified for the SRE level with the highest count. The integrated subcategories with the highest count are public transportation, transparency, cyber systems, mobility and accessibility, environmental impact, and smart apps linked to the building.
Many indicators significantly correlate with each other with various impacts. Table 11 highlights some of the leading indicators with the highest count of significant correlation. It can be concluded that the indicators’ priority and impact are different based on their impact position, whether within the same level or on the other integrated level. Some indicators have a significant impact in both positions, such as the availability of open data platforms, big data management, net zero building, and sensors and actuator availability.
Table 11.
Significant Correlation—Indicators Classification, Source: Author, 2023.
7. Conclusions
This study introduced, developed, and applied a new comprehensive evaluation framework for smart cities and smart real estate levels, with 85 and 90 indicators, respectively. The evaluation framework was applied to seven benchmarks for each level. The comparative benchmarks analysis revealed that cities and real estate developments are adopting smart principles and moving towards a smarter status. The smart performance range of the selected benchmarks is in the range of good and very good. The results showed that smart real estate projects are achieving a smarter status with an average of 72%; the rate was 65% on average for the smart cities level. Achieving a full score would not be realistic; only an ideal smart real estate in an ideal smart city could reach that score.
It was identified that the leading categories of the smart city are smart technology, smart infrastructure, and smart people. For the smart real estate level, smart infrastructure, smart people, and smart environment were the leading categories. The study proved that smart cities and smart real estate are significantly more developed than traditional ones; smart cities are more sustainable, connected, transparent, innovative, managed, and offer a highly improved quality of life. Selected smart real estate projects showed improvement in users’ satisfaction, building management, innovation, renewable resources, and resource consumption reduction. Traditional buildings are responsible for 40% of the consumption of energy resources and 24% of the greenhouse effect worldwide; this was reduced in the selected smart real estate with an average 48% and 67%, respectively.
Based on the comparative benchmark analysis for both scales, some indicators are commonly utilized in all selected benchmarks and can be considered success indicators. These include the availability of middleware platforms, big data management, and the sensors and actuators. However, even with the leading smart development, further development and potential for improvement are needed to reach a smarter status. According to the results, the city’s performance impacts the smart real estate’s performance and vice versa. However, based on some smart city categories’ performance, they set limits of smartness for smart real estate that would affect their capabilities; this was the case for the smart governance category.
The correlation analysis was conducted on three classifications: indicators, subcategories, and main categories for smart cities and real estate levels and their integration. The analysis proved a significant correlation in these classifications, and a significant correlation was detected in the integration between smart cities and smart real estate. The analysis detected a significant correlation between the mentioned classifications and levels. At the main category classification, smart infrastructure, governance, and technology had the highest correlation levels with other categories. The indicators classification, the availability of open data platforms, big data management, net zero building, and sensors and actuator availability significantly correlate with other indicators at all levels.
The selected smart real estate followed different strategies for integration in the smart city. Three projects followed a leading strategy, two followed the following strategy, and the remaining two followed the waiting strategy. As such, the integration and the relationship between the cities and the real estate projects followed different forms and approaches. At the same time, the detected trends illustrated that, on average, smart real estate tends to adopt the leading strategy, except for smart governance, technology, and environment. To reach a smarter development and improve users’ quality of life, the focus should be on improving both levels, as they are significantly dependent on each other.
Future research can be formed by adopting and merging the framework with currently used systems and schemes, such as Smart City Index, EU ESG, and other entities and systems, the framework is designed to be flexible and adjustable to respond as technology evolves. Additionally, a possible extension to the smart neighborhood level. The framework can be developed as a recognized rating and certification system for smart cities and real estate.
Supplementary Materials
The following supporting information can be downloaded at: https://www.mdpi.com/article/10.3390/su15129518/s1. References [52,59,69,72,73,74,75,76,77,78,79,80,81,82,83,84,85,86,87,88,89,90,91,92,93,94,95,96,97,98,99,100,101,102,103,104,105,106,107,108,109,110,111] are cited in Supplementary Materials.
Author Contributions
Conceptualization, T.H.A.-R. and M.N.; methodology, T.H.A.-R. and M.N.; software, T.H.A.-R.; validation, T.H.A.-R. and M.N.; formal analysis, T.H.A.-R.; investigation, T.H.A.-R.; resources, T.H.A.-R.; data curation, T.H.A.-R.; writing—original draft preparation, T.H.A.-R.; writing—review and editing, M.N.; visualization, T.H.A.-R.; supervision, M.N.; project administration, M.N. All authors have read and agreed to the published version of the manuscript.
Funding
This research received no external funding.
Institutional Review Board Statement
Not applicable.
Informed Consent Statement
Not applicable.
Data Availability Statement
The authors confirm that the data supporting the findings of this study are available within the article and its supplementary materials.
Acknowledgments
We acknowledge financial support by Deutsche Forschungsgemeinschaft and Technische Universität Dortmund/TU Dortmund University within the funding program Open Access Costs.
Conflicts of Interest
The authors declare no conflict of interest.
References
- Mora, L.; Komninos, N. Exploring the Big Picture of Smart City Research ONLINE S3 (ONLINE Platform for Smart Specialisation Policy Advice) View Project RESta(r)t (Roadmap for European Smart City Strategies) View Project Exploring the Big Picture of Smart City Research. 2018. Available online: https://www.researchgate.net/publication/319598847 (accessed on 13 January 2023).
- Yigitcanlar, T. How Are Smart City Concepts and Technologies Perceived and Utilized ? A Systematic Geo-Twitter Analysis of Smart Cities in Australia. J. Urban Technol. 2020, 28, 1–20. [Google Scholar] [CrossRef]
- Girardi, P.; Temporelli, A. Smartainability: A Methodology for Assessing the Sustainability of the Smart City. Energy Procedia 2016, 111, 810–816. [Google Scholar] [CrossRef]
- Myeong, S.; Jung, Y.; Lee, E. A study on determinant factors in smart city development: An analytic hierarchy process analysis. Sustainability 2018, 10, 2606. [Google Scholar] [CrossRef]
- MarketsandMarkets. Smart Buildings Market by Component, Building Type, And Region—Global Forecast to 2026. 2022. Available online: https://www.reportlinker.com/p05083038/Smart-Building-Market-by-Type-Building-Type-And-Region-Global-Forecast-to.html?utm_source=GNW (accessed on 30 December 2022).
- Jain, K. Development of a Smart Building Evaluation System for Office Buildings. Master’s Thesis, Technical University of Berlin, Berlin, Germany, 2019. [Google Scholar] [CrossRef]
- CB-Insights. Real Estate Tech Reaches New Heights In 2016. 2017. Available online: https://www.cbinsights.com/research/real-estate-tech-startup-funding/ (accessed on 30 December 2022).
- Ullah, F.; Sepasgozar, S.M.E.; Wang, C. A systematic review of smart real estate technology: Drivers of, and barriers to, the use of digital disruptive technologies and online platforms. Sustainability 2018, 10, 3142. [Google Scholar] [CrossRef]
- Sepasgozar, S.M.E.; Davis, S.R.; Li, H.; Luo, X. Modeling the Implementation Process for New Construction Technologies: Thematic Analysis Based on Australian and U.S. Practices. J. Manag. Eng. 2018, 34, 05018005. [Google Scholar] [CrossRef]
- Selvakanmani, S. Smart City—The Urban Intelligence of India. Int. J. Res. Appl. Sci. Eng. Technol. 2015, 3, 302–307. [Google Scholar]
- Apanaviciene, R.; Vanagas, A.; Fokaides, P.A. Smart Building Integration into a Smart City (SBISC): Development of a New Evaluation Framework. Energies 2020, 13, 2190. [Google Scholar] [CrossRef]
- Directorate-General for Internal Policies of the Union (European Parliament); Millard, J.; Thaarup, R.; Pederson, J.; Manville, C.; Wissner, M.; Kotterink, B.; Cochrane, G.; Cave, J.; Liebe, A.; et al. Mapping Smart Cities in the EU—Publications Office; European Parliament: Strasbourg, France, 2014. [Google Scholar] [CrossRef]
- Antwi-Afari, P.; Owusu-Manu, D.G.; Ng, S.T.; Asumadu, G. Modeling the smartness or smart development levels of developing countries’ cities. J. Urban Manag. 2021, 10, 369–381. [Google Scholar] [CrossRef]
- Irungbam, R.S. The Model of Smart Cities in Theory and in Practice. J. Stud. Manag. Plan. 2016, 2, 156–187. [Google Scholar]
- Martínez, D.R.S.; Gracia, T.J.H.; Muñoz, E.M.; García, A.C. Sustainable Smart Cities. Creating Spaces for Technological, Social, and Business Development; Springer: Berlin/Heidelberg, Germany, 2017. [Google Scholar] [CrossRef]
- Šiurytė, A. Analysis of Key Factors in Developing a Smart City. Master’s Thesis, Mykolas Romeris University, Vilnius, Lithuania, 2015; pp. 1–68. [Google Scholar]
- Schipper, R.; Silvius, A. Characteristics of Smart Sustainable City Development: Implications for Project Management. Smart Cities 2018, 1, 75–97. [Google Scholar] [CrossRef]
- Vishnivetskaya, A.; Alexandrova, E. ‘Smart City’ Concept. Implementation Practice. IOP Conf. Ser. Mater. Sci. Eng. 2019, 497, 012019. [Google Scholar] [CrossRef]
- Pereira, G.V.; Parycek, P.; Falco, E.; Kleinhans, R. Smart governance in the context of smart cities: A literature review. Inf. Polity 2018, 23, 143–162. [Google Scholar] [CrossRef]
- Nikoloudis, C.; Strantzali, E.; Tounta, T.; Aravossis, K.; Mavrogiannis, A.; Mytilinaioy, A.; Sitzimi, E.; Violeti, E. An Evaluation Model for Smart City Performance with Less than 50,000 Inhabitants: A Greek Case Study. In Proceedings of the 9th International Conference on Smart Cities and Green ICT Systems (SMARTGREENS 2020), Online, 2–4 May 2020; pp. 15–21. [Google Scholar] [CrossRef]
- Petrova-Antonova, D.; Ilieva, S. Smart cities evaluation—A survey of performance and sustainability indicators. In Proceedings of the 2018 44th Euromicro Conference on Software Engineering and Advanced Applications (SEAA), Prague, Czech Republic, 29–31 August 2018; pp. 486–493. [Google Scholar] [CrossRef]
- Dwivedi, M.; Uniyal, A.; Mohan, R. New Horizons in Planning Smart Cities using LiDAR Technology. Int. J. Appl. Remote Sens. Gis. (IJARSGIS) 2015, 2, 40–50. [Google Scholar]
- Bellini, P.; Nesi, P.; Pantaleo, G. IoT-Enabled Smart Cities: A Review of Concepts, Frameworks, and Key Technologies. Appl. Sci. 2022, 12, 1607. [Google Scholar] [CrossRef]
- Qolomany, B.; Member, G.S.; Al-fuqaha, A.; Member, S.; Gupta, A. Leveraging Machine Learning and Big Data for Smart Buildings: A Comprehensive Survey. IEEE Access 2019, 7, 90316–90356. [Google Scholar] [CrossRef]
- Mohanty, S.P.; Choppali, U.; Kougianos, E. Everything you wanted to know about smart cities. IEEE Consum. Electron. Mag. 2016, 5, 60–70. [Google Scholar] [CrossRef]
- Baraniewicz-Kotasińska, S. Smart city. Four approaches to the concept of understanding. Urban Res. Pract. 2022, 15, 397–420. [Google Scholar] [CrossRef]
- Kaluarachchi, Y. Implementing Data-Driven Smart City Applications for Future Cities. Smart Cities 2022, 5, 455–474. [Google Scholar] [CrossRef]
- Sadiku, M.N.O.; Shadare, A.E.; Dada, E.; Musa, S.M. Smart Cities. Int. J. Sci. Eng. Appl. Sci. 2016, 2, 2395–3470. [Google Scholar] [CrossRef]
- Malchea, T.; Tiwarib, P.K.; Tharewalc, S.; Tiwari, R. Smart Waste Management System for Smart City based on Internet of Things (IoT). Turkish J. Comput. Math. Educ. 2021, 12, 4491–4499. [Google Scholar]
- Apanaviciene, R.; Urbonas, R.; Fokaides, P.A. Smart building integration into a smart city: Comparative study of real estate development. Sustainability 2020, 12, 9376. [Google Scholar] [CrossRef]
- Zhu, J.; Wu, P. Towards Effective BIM/GIS Data Integration for Smart City by Integrating Computer Graphics Technique. Remote Sens. 2021, 13, 1889. [Google Scholar] [CrossRef]
- Zhao, Z.; Zhang, Y. Impact of Smart City Planning and Construction on Economic and Social Benefits Based on Big Data Analysis. Complexity 2020, 2020, 8879132. [Google Scholar] [CrossRef]
- Studies, C.; Trends, C.; Kim, H.M. Smart Cities for Technological and Social Innovation; Academic Press: Cambridge, MA, USA, 2020; Available online: https://www.perlego.com/book/1896975/smart-cities-for-technological-and-social-innovation-case-studies-current-trends-and-future-steps-pdf?utm_source=google&utm_medium=cpc&campaignid=15913700346&adgroupid=133123121755&gclid=CjwKCAiAhqCdBhB0EiwAH8M_Gt0Ok-H (accessed on 15 February 2023).
- Farsi, M.; Daneshkhah, A.; Hamid, A.H. Digital Twin Technologies and Smart Cities; Springer: Berlin/Heidelberg, Germany, 2020. [Google Scholar]
- Sisman, S.; Aydinoglu, A.C. Using gis-based multi-criteria decision analysis techniques in the smart cities. ISPRS-Int. Arch. Photogramm. Remote. Sens. Spat. Inf. Sci. 2020, 44, 383–389. [Google Scholar] [CrossRef]
- Ramos, J. Technology for smart cities: The pillars of urban planning of the future. Tomorrow City 2021. Available online: https://tomorrow.city/a/technology-for-smart-cities-the-pillars-of-urban-planning-of-the-future (accessed on 25 December 2022).
- Omar, O. Intelligent building, definitions, factors and evaluation criteria of selection. Alexandria Eng. J. 2018, 57, 2903–2910. [Google Scholar] [CrossRef]
- Kejriwal, S.; Mahajan, S. Blockchain in Commercial Real Estate The Future Is Here! Deloitte Cent Finance Serv. 2017. Available online: https://www2.deloitte.com/content/dam/Deloitte/us/Documents/financial-services/us-dcfs-blockchain-in-cre-the-future-is-here.pdf (accessed on 20 January 2022).
- Wouda, H.P.; Opdenakker, R. Blockchain technology in commercial real estate transactions. J. Prop. Investig. Financ. 2019, 37, 570–579. [Google Scholar] [CrossRef]
- Zhuang, H.; Zhang, J.; Sivaparthipan, C.B.; Muthu, B.A. Sustainable Smart City Building Construction Methods. Sustainability 2020, 12, 4947. [Google Scholar] [CrossRef]
- Al Dakheel, J.; Del Pero, C.; Aste, N.; Leonforte, F. Smart buildings features and key performance indicators: A review. Sustain. Cities Soc. 2020, 61, 102328. [Google Scholar] [CrossRef]
- Bris, A.; Hean, C.K.; Lanvin, B. Smart City Index 2021; IMD Business School: Lausanne, Switzerland, 2021; p. 133. Available online: https://www.imd.org/smart-city-observatory/smart-city-index/ (accessed on 10 May 2022).
- Setiyani, M.S. IESE Cities in Motion Index 2020; IESE Business School: Barcelona, Spain, 2020. [Google Scholar]
- Yeandle, M. The Global Financial Centres Index 17. 2015, p. 56. Available online: http://www.longfinance.net/images/GFCI15_15March2014.pdf (accessed on 10 May 2022).
- World’s Most Innovative Cities 2021: Innovation CitiesTM Index: Top 100. 2021. Available online: https://www.innovation-cities.com/worlds-most-innovative-cities-2021-top-100/25477/ (accessed on 20 November 2022).
- Quality of Living City Ranking|Mercer. Available online: https://mobilityexchange.mercer.com/Insights/quality-of-living-rankings (accessed on 31 December 2022).
- European Commission. Taxonomy: Final Report of the Technical Expert on Sustainable Finance. 2020. Available online: https://finance.ec.europa.eu/system/files/2020-03/200309-sustainable-finance-teg-final-report-taxonomy_en.pdf (accessed on 24 January 2023).
- Shari, A. A global dataset on tools, frameworks, and indicator sets for smart city assessment. Data Brief 2020, 29, 105364. [Google Scholar] [CrossRef]
- Nesti, G. Defining and assessing the transformational nature of smart city governance: Insights from four European cases. Int. Rev. Adm. Sci. 2020, 86, 20–37. [Google Scholar] [CrossRef]
- Sue, W. Smart City World City Profile. 2021, pp. 1–22. Available online: www.smartcitiesworld.net (accessed on 18 June 2022).
- Smart Cities Information System, European Commission. The Making of a Smart City: Best Practices across Europe; European Commission: Brussels, Belgium, 2017; Available online: https://smart-cities-marketplace.ec.europa.eu/insights/publications/making-smart-city-best-practices-across-europe (accessed on 10 April 2023).
- Morishita-Steffen, N.; Alberola, R.; Mougeot, B.; Vignali, É.; Wikström, C.; Montag, U.; Lutz, E.G.; Hartmann, G.; Pfaffenbichler, F.X.; Hainoun, A.; et al. Smarter Together: Progressing Smart Data Platforms in Lyon, Munich, and Vienna. Energies 2021, 14, 1075. [Google Scholar] [CrossRef]
- The Smart City Market in Germany 2021–2026; Springer: Berlin/Heidelberg, Germany, 2013; Available online: https://international.eco.de/topics/internet-of-things-home/study-the-smart-city-market-in-germany-2021-2026/#download (accessed on 11 July 2022).
- Rocque, M. SmartCitiesWorld, City Profile—Singapore. 2017. Available online: https://www.smartcitiesworld.net/city-profile/smart-cities-reports/smartcitiesworld-profile--singapore-full-report-1767 (accessed on 10 January 2022).
- Cohen Boyd. Top 10 Blockchain Cities in the World: The Methodology. 2018. Available online: https://boydcohen.medium.com/top-10-blockchain-cities-in-the-world-the-methodology-8a96bbfb666d (accessed on 31 December 2022).
- City of Sydney. Smart City Strategic Framework 2|Smart City Strategic Framework. 2020. Available online: https://www.cityofsydney.nsw.gov.au/strategies-action-plans/smart-city-strategic-framework (accessed on 20 January 2022).
- Glasco, J. SmartCitiesWorld, City Profile—Sydney. 2020, pp. 1–22. Available online: https://www.smartcitiesworld.net/city-profile/smart-cities-reports/smartcitiesworld-city-profile--sydney-5954 (accessed on 18 January 2022).
- SFMTA. City of San Francisco Meeting the Smart City Challenge. 2016. Available online: https://www.sfmta.com/sites/default/files/projects/2016/SF%20Smart%20City%20Challenge_Final.pdf (accessed on 4 May 2022).
- Middleton, E. Smart City Strategic Planning in North America: Learnings for London. Present Blackwell Stephen Lorimer 2018, 1–21. Available online: https://www.london.gov.uk/sites/default/files/smart_city_strategic_planning_in_na_for_smart_london_em_vfinal.pdf (accessed on 19 January 2022).
- Aftab, J.; Ramage, M. The Edge Amsterdam—Showcasing an Exemplary IoT Building|Centre for Digital Built Britain. 2018, p. 22. Available online: https://www.cdbb.cam.ac.uk/system/files/documents/TheEdge_Paper_LOW1.pdf%0Ahttps://www.cdbb.cam.ac.uk/news/2018CaseTheEdge (accessed on 22 January 2022).
- Siemens. The Crystal: One of the Most Sustainable Buildings in the World. 2015. Available online: https://www.inawe.in/wp-content/uploads/2015/12/The-Crystal-Sustainability-Features.pdf (accessed on 9 April 2022).
- Braun, T.; Treiber, M. Green Building Certification for the Siemens Headquarters in Munich, Germany. In Proceedings of the PLEA2013—29th Conference, Sustainable Architecture for a Renewable Future, Munich, Germany, 10–12 September 2013. [Google Scholar]
- Frasers Tower Singapore. Available online: https://www.fraserstower.com.sg/home.html (accessed on 2 May 2023).
- SEC Eco Office. Press Release: Frasers Property Receives Eight Certifications from Singapore Environment Council in Recognition of Its Low-Carbon and Sustainable Initiatives at Its Commercial Buildings. 2021, pp. 1–3. Available online: https://www.frasersproperty.com/content/dam/frasersproperty/feature/project/newsroom/press-releases/corporate/2021/january/frasers-property-receives-eight-certifications-from-singapore-environment-council-in-recognition-of-its-low-carbon-and-sustainable-initiatives-at-its-commercial-buildings/News-release-Frasers-Property-receives-eight-certifications-from-Singapore-Environment-Council.pdf (accessed on 30 April 2022).
- MySmartCTI. Case Study-ANZ Tower. 2014. Available online: https://integrate-expo.com/wp-content/uploads/2014/05/KNX-ANZ-Tower-PDF-Case-Study.pdf (accessed on 15 June 2022).
- Partridge, L. Achieving a Six-Star Rated Tall Building in Sydney’s Central Business District. CTBUH J. 2014, 34–39. Available online: https://global.ctbuh.org/resources/papers/1837-Partridge_2014_SixStarTallBuilding.pdf (accessed on 11 May 2022).
- Salesforce Tower Building San Francisco Vertical Village. Available online: https://www.theb1m.com/video/salesforce-tower-building-san-franciscos-vertical-village (accessed on 2 May 2023).
- Smart Building Example—Salesforce Tower|WSP Smart Buildings. Available online: https://smart-cities.wsp.com/projects/salesforce-tower-san-francisco/ (accessed on 2 May 2023).
- Case Study: Salesforce Tower—San Francisco—Hines. Available online: https://www.hines.com/case-studies/salesforce-tower (accessed on 2 May 2023).
- Pires, M. RBC WaterPark Place. Canadian Consulting Engineer. 2013. Available online: https://www.canadianconsultingengineer.com/features/rbc-waterpark-place/ (accessed on 10 July 2022).
- Delta Controls. Cisco WaterPark Place III Toronto, ON Canada. 2014. Available online: https://www.cisco.com/c/dam/m/en_ca/innovationcenter/toronto/pdf/delta-controls.pdf (accessed on 19 July 2022).
- United Nations. E-Government Development Index. Available online: https://publicadministration.un.org/egovkb/Data-Center (accessed on 11 May 2022).
- WCCD. ISO 37122—World Council on City Data. Available online: https://www.dataforcities.org/iso-37122 (accessed on 15 May 2022).
- Santana, É.; Nunes, E.; Santos, L. The use of ISO 37122 as standard for assessing the maturity level of a smart city. Int. J. Adv. Eng. Res. Sci. 2018, 5, 309–315. [Google Scholar] [CrossRef]
- Kristiningrum, E.; Kusumo, H. Indicators of Smart City Using SNI ISO 37122:2019. IOP Conf. Ser. Mater. Sci. Eng. 2021, 1096, 012013. [Google Scholar] [CrossRef]
- Transparency International. 2021 Corruption Perceptions Index. 2021. Available online: https://www.transparency.org/en/cpi/2021?gclid=Cj0KCQiAtbqdBhDvARIsAGYnXBO2TbmyWE44rmrde8-ej4c0YUHjAEj6fsIBYctz96iAD7gdJ3p0qEoaAieoEALw_wcB (accessed on 20 October 2022).
- Numbeo. Quality of Life Index. Available online: https://www.numbeo.com/quality-of-life/rankings_current.jsp (accessed on 31 December 2022).
- UNDP. Human Development Index. Available online: https://hdr.undp.org/data-center/human-development-index#/indicies/HDI (accessed on 20 October 2022).
- TomTom. Traffic Congestion Ranking|TomTom Traffic Index. Available online: https://www.tomtom.com/traffic-index/ranking/ (accessed on 21 October 2022).
- World Bank. The World Bank Annual Report 2020. 2020. Available online: https://elibrary.worldbank.org/doi/abs/10.1596/978-1-4648-1619-2 (accessed on 21 October 2022). [CrossRef]
- Wi-Fi Map. Wi-Fi Hotspots. Available online: https://www.wifimap.io/ (accessed on 24 October 2022).
- Global Carbon Atlas. Carbon Atlas. Available online: http://www.globalcarbonatlas.org/en/content/welcome-carbon-atlas (accessed on 2 November 2022).
- Moran, D. Global Gridded Model of Carbon Footprints. Available online: https://www.citycarbonfootprints.info/ (accessed on 2 November 2022).
- Mssion Innovation. Smart Grids Innovation Challenge Country Report 2019. 2019. Available online: https://www.kluniversity.in/alumni/pdfs/59.pdf (accessed on 3 November 2022).
- Our World in Data. Available online: https://ourworldindata.org/ (accessed on 11 November 2022).
- EPI. Environmental Performance Index|Environmental Performance Index. Available online: https://epi.yale.edu/epi-results/2022/component/epi (accessed on 31 December 2022).
- Green Building Information Gateway. Available online: https://www.gbig.org/ (accessed on 25 November 2022).
- U.S. Green Building Council. LEED Project Profiles. Available online: https://www.usgbc.org/projects (accessed on 25 November 2022).
- BREEAM Projects. Available online: https://tools.breeam.com/projects/explore/buildings.jsp (accessed on 25 November 2022).
- Simon, K. Digital 2022: Global Overview Report—DataReportal—Global Digital Insights. 2022. Available online: https://datareportal.com/reports/digital-2022-global-overview-report?utm_source=Global_Digital_Reports&utm_medium=Article&utm_campaign=Digital_2022 (accessed on 25 November 2022).
- World Wide Web Foundation. Web Index Report 2014–15. 2014. Available online: http://thewebindex.org/wp-content/uploads/2014/12/Web_Index_24pp_November2014.pdf (accessed on 25 October 2022).
- The World Bank. GDP (Current US$)|Data. Available online: https://data.worldbank.org/indicator/NY.GDP.MKTP.CD (accessed on 26 October 2022).
- Everett-Allen, K. Global Residential Cities Index Q2 2021. Kn. Frank. 2021; p. 2. Available online: https://content.knightfrank.com/research/1026/documents/en/global-residential-cities-index-q2-2021-8453.pdf (accessed on 26 October 2022).
- Orion Market Research. Global Smart City Market Share, Size, Future Outlook, COVID-19 Impact Analysis, Forecast 2021-2027. 2021. Available online: https://www.slideserve.com/rishabh3210/global-smart-city-market-share-size-future-outlook-covid-19-impact-analysis-forecast-2021-2027 (accessed on 31 December 2022).
- LH Müchen. Smart City Munich—Energy Cities. 2019. Available online: https://energy-cities.eu/best-practice/smart-city-munich/ (accessed on 2 May 2023).
- Megatrends and Innovations, Singapore Smart City: Sustainability Projects—We Build Value. 2021. Available online: https://www.webuildvalue.com/en/megatrends/singapore-smart-city.html (accessed on 22 May 2022).
- Bre Group. The Edge, Amsterdam awarded BREEAM Award for Offices New Construction 2016—BRE Group. Available online: https://bregroup.com/case-studies/breeam-new-construction/the-edge-amsterdam-awarded-breeam-award-for-offices-new-construction-2016/ (accessed on 3 May 2022).
- Comfy. Top 8 Smart Buildings from Around the World. 2017. Available online: https://comfyapp.com/top-8-smart-buildings-from-around-the-world/ (accessed on 3 May 2022).
- Resonai. 4 Amazing Intelligent Buildings From Around the World. 2020. Available online: https://www.resonai.com/blog/4-best-intelligent-buildings (accessed on 2 May 2023).
- Bloomberg. The Edge Is the Greenest, Most Intelligent Building in the World. Available online: https://www.bloomberg.com/features/2015-the-edge-the-worlds-greenest-building/ (accessed on 3 May 2022).
- Babu, D. The Crystal by Wilkinson Eyre Architects: A Pavilion in a Park—RTF|Rethinking The Future. Available online: https://www.re-thinkingthefuture.com/2021/05/19/a4224-the-crystal-by-wilkinson-eyre-architects-a-pavilion-in-a-park/ (accessed on 4 May 2022).
- Kolusu, L. The Crystal, London: A Sustainable Intelligent Building Case Study. 2017. Available online: https://www.slideshare.net/LakshmiRaviChanduKolusu/the-crystal-london-a-sustainable-intelligent-building-casestudy-by-lakshmi-ravi-chandu-kolusu (accessed on 2 May 2023).
- Lam, J. Press Release “Frasers Property Makes Future of Work Experience a Reality in Singapore”. 2020. Available online: https://www.frasersproperty.com/content/dam/frasersproperty/feature/project/newsroom/press-releases/corporate/2020/october/frasers-property-makes-future-of-work-experience-a-reality-in-singapore/Frasers-Property-makes-Future-of-Work-experience-a-reality-in-Singapore.pdf (accessed on 2 May 2022).
- Henderson, J. Microsoft Creates a Digital Twin of Singapore HQ, Outlines Smart Building Blueprint, Channel Asia. 2020. Available online: https://www.channelasia.tech/article/671848/microsoft-creates-digital-twin-singapore-hq-outlines-smart-building-blueprint/ (accessed on 22 May 2022).
- Microsoft Stories Asia, Bentley Systems, Microsoft and Schneider Electric Re-Imagine Future Workplaces with Sensors, Sustainability, IoT and AI—Microsoft Stories Asia. 2020. Available online: https://news.microsoft.com/apac/2020/03/12/bentley-systems-microsoft-and-schneider-electric-re-imagine-future-workplaces-with-sensors-sustainability-iot-and-ai/ (accessed on 25 May 2022).
- CABA News. 7 Key Examples of Smart Buildings. 2021. Available online: https://www.caba.org/examples-of-smart-buildings/ (accessed on 24 May 2022).
- Robinson, M. WeWork Is Opening a Second Headquarters in Salesforce’s New $1 Billion Skyscraper. Business Insider. 2017. Available online: https://www.businessinsider.nl/photos-of-salesforce-tower-san-francisco-2017-4?international=true&r=US (accessed on 2 May 2023).
- Salesforce Tower web site. Salesforce Tower San Francisco, First-of-Its-Kind Workspace. Available online: https://salesforcetower.com/ (accessed on 2 May 2023).
- Urvashi. Smart Lighting Case Study: Cisco RBC Waterpark Offices. 2018. Available online: https://www.rcrwireless.com/20181017/lighting/smart-lighting-cisco (accessed on 2 May 2023).
- Zinco. RBC Waterpark Place. Available online: https://www.zinco.ca/case-studies/rbc-waterpark-place (accessed on 2 May 2023).
- WZMH Architects. RBC WaterPark Place is Toronto’s First LEED Platinum Core and Shell Certified Office Tower! 2016. Available online: https://www.wzmh.com/news/rbc-waterpark-place-achieves-leed-platinum/ (accessed on 2 May 2023).
Disclaimer/Publisher’s Note: The statements, opinions and data contained in all publications are solely those of the individual author(s) and contributor(s) and not of MDPI and/or the editor(s). MDPI and/or the editor(s) disclaim responsibility for any injury to people or property resulting from any ideas, methods, instructions or products referred to in the content. |
© 2023 by the authors. Licensee MDPI, Basel, Switzerland. This article is an open access article distributed under the terms and conditions of the Creative Commons Attribution (CC BY) license (https://creativecommons.org/licenses/by/4.0/).