Article

How Smart City Construction Affects Digital Inclusive Finance in China: From the Perspective of the Relationship between Government and Large Private Capital

1
School of Marxism, Tsinghua University, Beijing 100084, China
2
School of Public Policy & Management, Tsinghua University, Beijing 100084, China
3
School of Economics and Management, Huazhong Agricultural University, Wuhan 430070, China
*
Authors to whom correspondence should be addressed.
Sustainability 2023, 15(11), 9035; https://doi.org/10.3390/su15119035
Submission received: 30 April 2023 / Revised: 25 May 2023 / Accepted: 31 May 2023 / Published: 2 June 2023

Abstract

:
In China, the relationship between smart city policy (SCP) and the development of digital inclusive finance (DIF) partially mirrors the connection between the Chinese government and large private capital. This study examines this relationship using data from the Peking University Digital Financial Inclusion Index of China (PKU-DFIIC) and a difference-in-differences method. Results indicate that SCP may indirectly promote DIF in pilot cities, exhibiting statistically significant growth compared to non-SCP pilot cities. This promotion effect appears indirect, as negligible DIF digitization growth in SCP pilot cities suggests that the government’s objective is not to enhance large private capital-related digital infrastructure construction. Moreover, DIF in SCP pilot cities demonstrates a statistically significant increase only in the depth of use, not in coverage. This study implies that, in China, large private capital’s behavioral logic is profit-seeking, and SCP may be employed to facilitate digital financial services development. These findings uncover SCP’s complex impact on DIF in China and the strained government–capital relationship. The Chinese government should prudently manage its relationship with capital in public policies and direct capital toward a more constructive role.

1. Introduction

The financial services market is an integral part of the national economy of any country [1]. Digital inclusive finance (DIF), which offers tech-based financial services to underserved populations in rural/remote areas, low-income individuals, and small/micro-businesses, has become increasingly important nowadays [2,3]. China began focusing on DIF in 2000 with the aim of promoting rural development and improving access to financial services for rural residents [4]. Prior to this, China’s financial sector was dominated by state-owned banks that mainly served urban areas and large businesses, leaving rural and low-income individuals with limited access to financial services. Despite small/micro-businesses accounting for 60% of industrial output and employing 80% of China’s workforce, only one-fifth had ever received a bank loan, leading many to turn to high-interest grey money markets such as loan sharks and pawn shops [5].
China’s financial system is no longer controlled by a few large state-owned commercial banks due to the emergence of digital financial inclusion. Peer-to-peer (P2P) lending platforms have enabled companies such as Alibaba, Tencent, and Baidu to improve their performance significantly and offer faster access to financial services. These companies have utilized new technological infrastructure and advanced data analysis capabilities to outperform banks, which have historically directed credit towards state-owned enterprises and large private companies [6].
The involvement of private capital in inclusive finance is viewed as a further liberalization of China’s market economy and financial system. However, the Communist Party of China has stressed the importance of controlling capital and building a socialist society with Chinese characteristics. China aims to develop DIF beyond traditional financial institutions, which are government-controlled, such as the Agricultural Bank of China and Postal Savings Bank of China, and include private giants such as Alibaba and Tencent. This raises questions about the relationship between the Chinese government and large private capital in this context.
A noteworthy new trend is that the Chinese government has increased its efforts in the construction of smart cities in recent years, as innovation plays a crucial role in economic growth [7]. The development of informatization and smart city construction is a significant transformation in China. By the end of 2020, China had 1.29 billion internet users and 1.2 billion 4G mobile network users, with over 800 smart cities being built or already operational [8]. The development of DIF is widely believed to rely on digital technology [9,10]. The construction of smart cities is crucial in promoting DIF because of the advancement of digital and electronic information equipment [11,12].
In China, smart city construction is initiated and led by the Communist Party of China (CPC), representing the government’s will to some extent. The emergence of the new relationship between smart city construction and DIF driven by private giant capital in China is due to the limited success of traditional state-owned capital in developing DIF. Therefore, the relationship between SCP (driven by the government) and DIF (driven by private giant capital) reflects the relationship between the Chinese government and private giant capital. Understanding this relationship is crucial for comprehending the development of China’s digital cities and the growing role of private capital in driving DIF. It also provides insights into the current dynamics between the Chinese government and capital.

2. Literature Review and Empirical Strategy

2.1. Literature Review

The relationship between the government and private capital plays a crucial role in Chinese society. The State Council of the People’s Republic of China pointed out that regulating and guiding the development of capital under the conditions of a socialist market economy is not only a significant economic issue but also a significant political issue [13]. It is both a major practical problem and a major theoretical problem, directly related to the security of the nation and the stability of society.
However, despite the significance and extensive discussions surrounding the relationship between the government and capital in China, there is a notable lack of empirical research evidence on the topic [14,15]. For quantitatively studying the relationship between the Chinese government and capital, it is necessary to have access to comprehensive and reliable data that accurately reflect the interactions and dynamics between the government and capital [16]. However, in the academic circles of China, such data have been lacking for an extended period. This data scarcity hinders researchers from conducting rigorous empirical analyses.
Exploring the relationship between SCP and DIF in China can contribute significantly to our understanding of how the government engages with large private capital. By providing empirical evidence and insights, it can inform policymakers, investors, and other stakeholders about the dynamics and potential benefits of such collaborations in promoting inclusive finance and sustainable urban development.
From a neoliberal perspective, in Western societies, the relationship between SCP and DIF is characterized by market-driven mechanisms and a focus on individual empowerment. This approach emphasizes the role of private sector actors, competition, and deregulation in driving innovation and economic growth [17,18,19]. However, Chinese society exhibits its own distinctiveness in the relationship between SCP and DIF.
While the Western and Chinese digital economies both feature a variety of players, large private firms largely dominate [20,21]. In the West, Google, Amazon, Facebook (Meta), and Apple (collectively, GAFA) exert major influence over sectors such as search engines, ecommerce, social media, and mobile operating systems. Similarly, in China, digital economy giants Alibaba, Tencent, and Baidu hold significant market shares in ecommerce, social media, digital payments, and internet services.
The development of smart cities in both Western and Chinese societies typically involves a combination of both public (government) and private (capital) actors, though the balance between these can vary significantly [22]. In Western societies, smart city initiatives often involve partnerships between governments and private companies. Governments tend to set the overall vision and regulatory framework, while private companies provide the technology, expertise, and sometimes the capital to realize these plans. Some cities might contract out specific projects to private firms, while others might involve private companies more integrally in the planning and operation stages, with the private sector leading tech development and government oversight [23].
In China, the government plays a more dominant role in smart city construction. The Chinese government, at both the national and local level, initiates most smart city projects and provides significant funding and policy support [24,25]. The primary objective of SCP in China is not solely market-oriented to strengthen the real economy’s infrastructure support but also to ultimately enhance national modernization governance capabilities [7,26]. For example, China’s smart city approach employs AI, facial recognition, and big data for efficiency and public safety, and the government collaborates with tech companies to deploy infrastructure.
In addition, it is undeniable that state regulation is prominent in China’s financial sector, and government intervention plays a crucial role [27]. For instance, the Chinese government takes a strong stance on controlling the development of new financial technologies, such as cryptocurrency, to ensure they align with established regulatory frameworks [28].
Research suggests that evidence-based policymaking at the bureaucratic level can face challenges arising from various sources [29,30,31]. Based on the above analysis, we can draw a clear conclusion: the discussion of the relationship between SCP and DIF in China cannot simply apply the experiences and conclusions from Western societies. Instead, it requires specific analysis based on the actual conditions of Chinese society, and this analysis must be conducted within the framework of the relationship between the Chinese government and large private capital in order to be properly understood.

2.2. Empirical Strategy

The main purpose of this article is to examine the relationship between government and large private capital by investigating how the construction of smart cities affects digital inclusive finance in China.
According to the report by the Institute of Digital Finance at Peking University, the database of “Peking University Digital Financial Inclusion Index of China (PKU-DFIIC)” aims to study the status of financial inclusion in China [32]. Prior to the establishment of the PKU-DFIIC database in 2011, China lacked a large-scale publicly available longitudinal survey specifically reflecting the activities of large private capital. The establishment of the PKU-DFIIC database filled this research gap. To date, numerous related studies by Chinese scholars have been published [33,34,35]. However, very few studies have acknowledged a crucial point, which was that this survey was organized in collaboration between Peking University and Ant Group (the parent company of Alipay, China’s largest mobile payment platform), and the survey content mainly focused on the usage and penetration of Alipay in China [36].
The PKU-DFIIC database provides convenient conditions for us to study the behavioral logic of private large capital in Chinese society and its relationship with the government. We employ the Digital Financial Inclusion Index to measure DIF’s development level. Although the PKU-DFIIC released this indicator, it was actually developed with Ant Group’s investment, and the quantitative approach relies heavily on Alipay account usage. Ant Group, which originated from Alipay founded in 2004, transformed into a small and micro financial service group in 2013. Therefore, the quantitative operations of almost every dimension of the Digital Financial Inclusion Index are related to the use of Alipay. With over 1.3 billion users, Alipay and its digital wallet partners comprise one of the world’s largest mobile payment platforms [37].
We examine the relationship between SCP and DIF in China, focusing on the three batches of SCP pilot projects as a stepwise natural experiment. In 2012, the Ministry of Housing and Urban-Rural Development (MOHURD) issued a notice to conduct national pilot smart cities, recognizing smart city development as an essential strategy for achieving national goals such as innovation-driven development, modern urbanization, and a comprehensively prosperous society [38]. On 29 January 2013, China’s Ministry of Housing and Urban-Rural Development (MOHURD) announced the first list of smart cities. The second batch was revealed on 5 August 2013, and the third batch was revealed on 7 April 2015.
To ensure policy evaluation applicability and validity, the paper primarily employs the difference-in-differences (DID) method, conducts robustness discussions, and considers potential spatial spillover effects of policies. As this study includes multiple treatment groups and time periods, city and time fixed effects are added to control for unobservable factors, giving the SCP a “quasi-natural experiment” characteristic [31]. Data compilation is vital, as some city districts and subordinate prefecture-level cities also implement SCP pilots; the time a city first enters the SCP list is considered the start of its SCP. After processing and analyzing the collected information, we obtain panel data for 285 cities, with 155 cities in the treatment group and 130 cities in the control group.

3. Model Setting and Data Sources

3.1. Econometric Model

To explore the influence of smart city construction on a city’s DIF in China, our paper adopts the DID model to regress the development level of digital finance inclusion. The DID model primarily addresses the problem of selection bias and unobserved heterogeneity in observational studies by providing a quasi-experimental framework to estimate causal effects of a treatment. To set up the conventional DID model, two dummy variables should be created: one dummy variable for the treatment group and one dummy variable for the time period during which the policy was implemented [39].
In our study, the first dummy variable is assigned to SCP pilot cities as the treatment group, and non-pilot cities are assigned as the control group. The second dummy variable is typically assigned to a specific policy implementation period. However, in our research design, new samples will continue to be added to the treatment group in different years, which means that different samples in the treatment group may receive policy interventions at different times. Therefore, a particular year cannot be used as a unified time node. To address this issue, this paper employs the benchmark DID setting appropriate for gradual policy pilots. Compared to conventional DID models, the benchmark DID setting for gradual policy pilots includes multiple time points to capture the gradual and cumulative impact of policy interventions. It considers the gradual policy implementation, allowing for the analysis of effects as they unfold. Additionally, it recognizes the dynamic nature of policy interventions, examining how effects evolve over time. These features enable a more nuanced and accurate analysis of the policy’s long-term impact [40]. The specific model is set as follows:
I n c l u f i n a i t = α 0 + α 1 t r e a t i t × p e r i o d i t + θ X i t + ε i t
where (1) I n c l u f i n a i t represents the i-th city’s development level of digital finance inclusion in t year; (2) t r e a t i t is the policy dummy variable constructed by the model—when t r e a t i t = 1, it means that i-th city has entered the SCP pilot, otherwise t r e a t i t = 0; (3) p e r i o d i t is the constructed time dummy variable—when p e r i o d i t   = 1, it means that the time is before the SCP pilot approval, otherwise p e r i o d i t   = 0; (4) D I D i t = t r e a t i t × p e r i o d i t represents the interaction term of two dummy variables, which is the core explanatory variable; (5) estimated parameter α 1 is the main regression coefficient, which represents the net effect of policy implementation that the research focuses on; (6) X i t represents control variables.

3.2. Data Sources

The data used in this paper to measure the development level of DIF comes from the PKU-DFIIC, which is jointly compiled by the Institute of Digital Finance at Peking University and Ant Technology Group. According to PKU-DFIIC [41], the value of the Digital Financial Inclusion Index is calculated by a weighted summation of three dimensions: coverage (54.0%), depth of use (29.7%), and degree of digitization (16.3%). The Digital Financial Inclusion Index compiled by PKU-DFIIC comprises 33 specific indicators across three dimensions mentioned above. Details about the indicator system can be found in Table 1.
(1)
Coverage: Digital finance coverage relies on electronic accounts, surpassing traditional indicators such as outlets/personnel. Internet-enabled, it transcends geographical boundaries. Regulations in China mandate linking third-party payments, e.g., Alipay, to bank cards for broader reach. More linked cards indicate improved service coverage, serving as a sub-indicator for digital finance coverage.
(2)
Usage depth: In terms of the depth of digital financial usage, it primarily measures the actual utilization of various digital financial services. These services encompass payment service, monetary fund business, credit business, insurance business, investment business, and credit service. From a usage standpoint, it includes both aggregate usage indicators (i.e., the number of people who use these services per 10,000 Alipay users) and individual activity indicators (per capita transaction number and per capita transaction amount).
(3)
Degree of digitization: Inclusive financial digitalization relies on convenience, low cost, and credit for user adoption. This showcases the benefits of these services, making digitalization crucial to the financial inclusion index system. Services with greater convenience (e.g., a higher proportion of mobile payment amounts), lower costs (e.g., lower average personal loan interest rates), and higher credit levels (e.g., a higher proportion of Sesame Credit’s deposit-free transactions) indicate effective digital financial inclusion.
We obtained the list of SCP pilots and their disclosure dates from the official website of the MOHURD of China.
The control variables that may potentially impact the development of DIF include (1) GDP (Gross Domestic Product) per capita, which is deflated and logarithmically transformed; (2) the level of industrial structure, as measured by the ratio of output value of the secondary and tertiary industries to the total output value; (3) the level of human capital, as indicated by the proportion of employees in information transmission, computer services and software, finance, scientific research and technology services, and education industries to the total number of employees; (4) population density, measured by the population per unit of urban built-up area; (5) government support for science and technology, represented by the proportion of fiscal expenditures on science and technology to total public expenditures; (6) informatization level can be measured by indicators as the average number of mobile phones per capita in the city and the number of Internet-connected devices per capita in the city; (7) the level of openness to the outside world, represented by the amount of foreign direct investment per capita.
The control variable data were sourced from the “China City Statistical Yearbook” for the period from 2010 to 2018. However, data were missing for some prefecture-level cities in certain years. To address this issue, we applied the average growth rate method to impute the missing data. This resulted in a balanced panel dataset comprising 291 prefecture-level cities from 2010 to 2018. The total number of observations without missing variables was 2280. This includes prefecture-level cities where only certain regions participate in the pilot. As these cities do not have all administrative regions included in the smart city pilot policy, they need to be excluded to reduce the potential interference of spatial selection bias on the estimation results. Additionally, central directly administered municipalities with significant political, economic, and locational advantages are excluded due to their lack of direct comparability with other prefecture-level cities. The final sample size is 1648 observations. Table 2 presents the descriptive statistics of the main variables used in our analysis.

4. Results

4.1. Benchmark Regression

This article employs a multi-time point DID approach to conduct a benchmark regression analysis with clustering robust standard errors at the urban level. The results, as presented in Table 3, consistently demonstrate a significantly positive estimated coefficient for the SCP variable, irrespective of controlling for other factors. This suggests that the SCP has a substantial positive impact on DIF. Moreover, in order to address potential time fixed effects and city fixed effects, we introduce year fixed effects and city fixed effects as control variables. The findings indicate that even after accounting for these fixed effects, the favorable influence of SCP on DIF remains statistically significant. Therefore, we can preliminarily conclude that there is a positive effect of SCP on DIF. However, it is important to note that this finding does not provide robust statistical evidence regarding the influence of SCP on DIF or support the assertion that the role of SCP in promoting DIF is unaffected by other potential factors. Hence, further robustness tests are necessary to delve deeper into this matter.

4.2. Robustness Tests

4.2.1. Assessing Preconditions on the Effects of SCP on DIF

To ensure the validity of conclusions drawn from the benchmark regression, three preconditions must be satisfied: the parallel trends assumption, the Stable Unit Treatment Value Assumption (SUTVA), and the linearity assumption. Figure 1 displays the change in the Digital Financial Inclusion Index for each year in both the treatment group and the control group. Based on Figure 1, we can draw the following three conclusions:
(1)
Before the approval of the first batch of SCP pilot lists in January 2013, the Digital Financial Inclusion Index of the treatment group and the control group exhibited a consistent trend, with differences remaining essentially constant. This initial observation suggests that the development trend of DIF between the prefecture-level cities included in the SCP and those not included is quite similar. Consequently, we do not reject the parallel trends assumption in the pre-period. However, Figure 1 does not indicate whether the process of each sample entering the treatment group or the control group is random, so it is necessary to further test whether the SCP is influenced by confounders (the results are presented in Section 4.2.2).
(2)
After the approval of the second and third batches of SCP pilot lists, the DIF development trend of the treatment group and the control group continued to converge. This observation merits consideration. First, it is recommended to conduct a dynamic heterogeneity test to determine whether the effect of SCP on the development of DIF indeed manifests over time (results are presented in Section 4.2.3). If the relationship between SCP and DIF is confirmed, it should be questioned why the difference in the Digital Financial Inclusion Index between the treatment group and the control group keeps decreasing after implementing SCP. The adjustment for prior trends and systematic bias, as well as the placebo test, are conducted to address this issue (results are shown in Section 4.2.4, Section 4.2.5 and Section 4.2.6, respectively).
(3)
Figure 1 preliminarily indicates that when the SCP policy is not affected, the DIF trend of individual i largely satisfies the linearity assumption. Building upon this, it is necessary to further test the DID effect of the confounder, i.e., testing whether the confounder X i t in the model “ I n c l u f i n a i t = α 0 + α 1 t r e a t i t × p e r i o d i t + θ X i t + ε i t ” is affected by the SCP policy—that is, whether it meets the exogeneity assumption.
Table 3. Benchmark regression results.
(1)(2)
DID1.4323 ***1.215 **
(0.5166)(0.5009)
Control variablesUncontrolledControlled
Year fixed effectsControlledControlled
City fixed effectsControlledControlled
Obs16481648
R20.99410.9944
Note: Standard errors in parentheses, * p < 0.10, ** p < 0.05, *** p < 0.01. Notes for subsequent tables are identical.

4.2.2. Evaluating the Effect of Covariates on SCP

It is crucial to exercise caution when assuming that a specific city’s inclusion in the pilot is random, when considered as SCP in the quasi-natural experiment. To ascertain whether the benchmark regression has sufficiently accounted for endogenous factors, we need to examine if the characteristics of prefecture-level cities influence their inclusion in the SCP pilot list. For this study, we considered a city’s inclusion in the SCP pilot list during a particular year as the dependent variable and utilized covariates with a lag of one period and a lag of two periods for regression analysis. The outcomes are displayed in Table 4. The findings indicate that, apart from population density, the proportion of universities lagging in the first period exhibits a statistically significant correlation with a city’s inclusion in the SCP pilot list. Other covariates do not significantly affect whether a prefecture-level city becomes part of the pilot or not, with none demonstrating a substantial impact. Consequently, we can relax this assumption, concluding that the SCP is fundamentally unaffected by the endogeneity of covariates.

4.2.3. Dynamic Heterogeneity Test

The inclusion of a prefecture-level city in the SCP pilot is a short-term process, yet the policy’s influence is closely related to the local government’s ongoing development and enhancement. As a result, the impact of SCP on DIF development may emerge gradually over time. To examine the varying effects of different time periods on DIF development before and after the SCP approval, this study uses a method that adjusts the window width before and after the policy approval to test the policy’s dynamic heterogeneity. Drawing from Bertrand and Mullainathan [42], Beck et al. [43], and Moser and Voena [44], this paper creates yearly dummy variables before and after the SCP approval, which are then interactively combined with the DID component in the benchmark regression. Figure 2 visually illustrates the dynamic impact of SCP across various years. The figure reveals that when the current policy approval period acts as the model’s reference group, the estimated coefficients α 1 before approval are less than 0, while the estimated coefficients after approval are all significantly positive. This finding indicates that the positive effect of SCP on DIF development increased steadily after the SCP approval and eventually plateaued. At the same time, there might be some notable differences between the treatment and control groups before that, which warrant further investigation in subsequent analyses.
Table 4. Exogenous test on SCP.
Lagged Covariates(1)(2)
1 Time Period2 Time Periods
GDP per capita0.02080.0634
(0.0318)(0.0674)
Share of secondary industry−0.00070.0011
(0.0022)(0.0021)
Share of tertiary industry−0.00140.0004
(0.0021)(0.0021)
Human capital index−0.0034−0.0045
(0.0031)(0.0035)
Population density−0.0329−0.0474 **
(0.0256)(0.0213)
Percentage of Govt. Spending on Sci. & Tech.0.0137−0.0082
(0.0141)(0.0102)
Per capita telecommunications usage0.02850.0084
(0.0193)(0.0146)
The average number of mobile phones per capita in the city−0.0003−0.0004
(0.0006)(0.0006)
The number of Internet connected devices per capita in the city−0.0007−0.0013
(0.001)(0.0013)
Average wage of employed workers0.0106−0.0158
(0.0472)(0.0625)
Per capita foreign direct investment0.01230.0014
(0.0076)(0.0081)
Year fixed effectControlledControlled
City fixed effectControlledControlled
_cons−0.3918−0.3781
(0.5344)(0.801)
Observations14421236
R20.7480.8429
Note: The observed sample size in this analysis is not 1648 due to the inclusion of lagged covariates. The sample size decreased as some observations lacked data from the previous period. This reduction is necessary to meet data requirements and ensure the reliability of the regression analysis.

4.2.4. The Adjustment for Pre-Existing Trends

As mentioned in Section 4.2.3, there may be noteworthy disparities between the treatment and control groups prior to SCP approval. Consequently, based on the benchmark regression model, an interaction term is incorporated for each group dummy variable and the time trend factor, so as to adjust for pre-existing trends. The findings are presented in Table 5. These results corroborate that the SCP exerts a significant positive influence on the advancement of DIF. In comparison to Table 3, the estimated coefficient α 1 becomes larger, indicating a systematic trend discrepancy between the treatment and control groups. This divergence has an impact on DIF development. By excluding the interaction term, the benchmark regression outcomes may undervalue the effects of SCP on DIF.

4.2.5. The Adjustment for Systematic Bias

The Propensity Score Matching (PSM) method is employed to mitigate potential systematic bias arising from observable factors. A non-alternative one-to-one nearest-neighbor matching approach was selected. Building upon the studies conducted by Blundell et al. [45] and Heyman et al. [46], we employ the nearest-neighbor without replacement method. In the initial step, we compute the likelihood of a city being approved for the SCP, based on various observable attributes. Each treated city (included in the SCP pilot) is then matched with a comparable but non-treated city (not included in the SCP pilot). The propensity score’s balancing condition has been assessed and satisfied in all computations. We have calculated numerous propensity scores using various covariates; however, only those meeting the propensity score’s balancing condition were considered. Our selection of the model specification was guided by a high R2 value. Nevertheless, if the Conditional Independence Assumption (CIA) is not met, the Propensity Score Matching (PSM) method cannot address the systematic differences arising from unobserved factors. The DID approach can eliminate time-invariant individual heterogeneity and account for the common trends across different groups during the observation period. Considering these factors, we employed a combined PSM and DID methodology to assess the robustness of the SCP effect. Table 6 displays the robustness estimation results for the PSM-DID method. When compared to Table 3, the estimated coefficients α 1 and significance levels have not changed considerably, which further reinforces the credibility of the relationship between SCP and DIF.

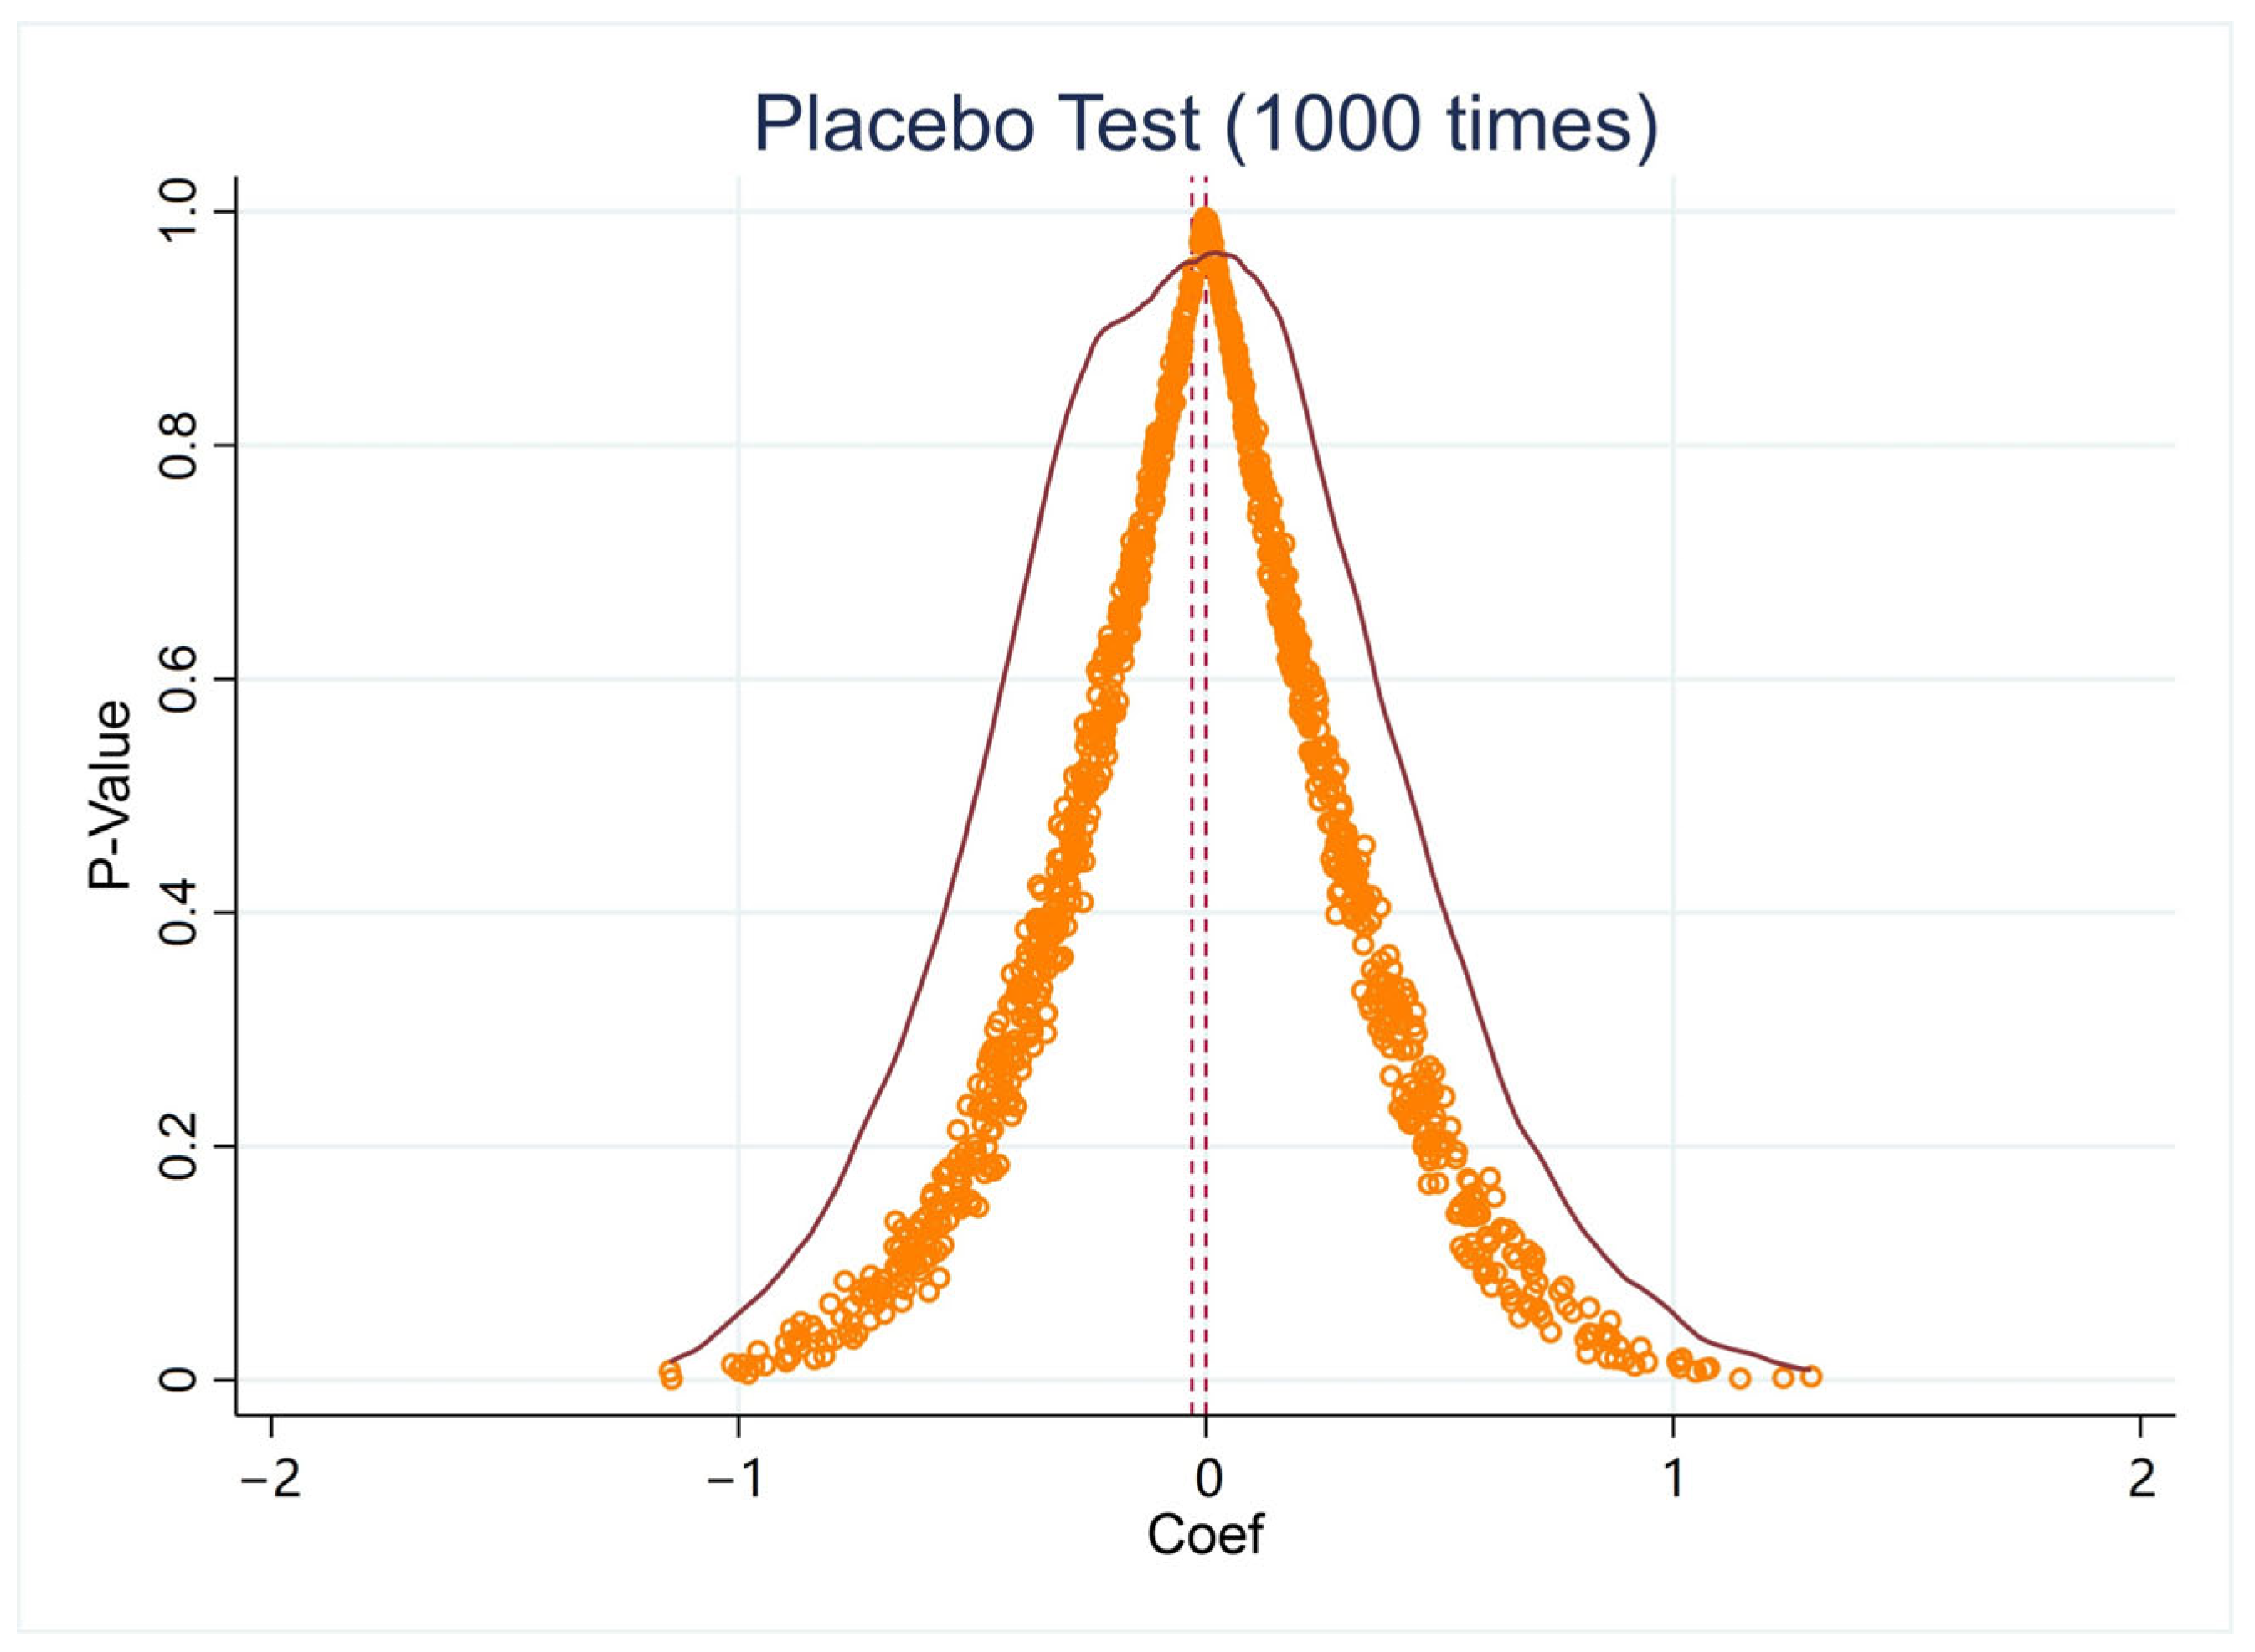
4.2.6. Placebo Tests for Randomly Generated Treatment and Control Groups

Considering that this study can only access data from the Digital Financial Inclusion Index for the first two years prior to the SCP approval, conducting a time-based placebo test using fictitious policies becomes challenging. As a result, a placebo test was carried out by randomly assigning treatment and control groups. The impact of SCP on a specific prefecture-level city was simulated as a random generation process by a computer, and this random process was repeated 1000 times for the benchmark regression. Figure 3 presents the distribution of 1000 estimated coefficients and their corresponding p-values in the baseline regression of the randomly assigned treatment and control groups. The findings indicate that the average value of the estimated coefficient derived from random processing is very close to zero and statistically insignificant. Consequently, it is believed that unobserved urban characteristics will not significantly affect the estimation results, suggesting that the statistical correlation between SCP and DIF is robust.

4.3. Heterogeneity Analysis for the Effect of SCP on DIF

The purpose of this section is to analyze the heterogeneous impact of SCP on the development of DIF. It specifically investigates how SCP affects DIF from its coverage, depth of use, and degree of digitization, the index system content of which is shown in Table 1. The testing results are presented in Table 7.
Firstly, based on the empirical evidence presented in Table 7, cities in SCP pilots do not show a statistically significant impact on digital financial inclusive service coverage. Based on Table 1, it is evident that the term ‘coverage’ primarily refers to the extent of Alipay account usage. Hence, the findings presented in Table 7 reveal that smart cities have not experienced a rise in local digital finance coverage compared to non-smart cities. However, it is important to note that coverage also encompasses spatial reach. As PKU-DFIIC did not collect specific data related to this aspect, we conducted additional research on the topic in Section 4.4.
Secondly, the results of this study indicate that SCP significantly enhances the usage depth of DIF. The research evaluated the extent of DIF adoption among users of various digital financial services. The findings showed that SCP increases user engagement among small and micro-enterprises, as well as individual consumers, in adopting online financial services. Based on the indicator description in Table 1, it can be seen that the promotion effect of SCP on the depth of DIF usage is mainly manifested in increasing the usage level of users who already have Alipay accounts. This is in terms of payment services, monetary fund business, credit business, insurance business, investment business, and credit services. However, it does not significantly promote the coverage of electronic accounts among the population.
Thirdly, the study found no significant effect of SCP on the degree of digitization of DIF. In this study, the digitization degree index was created by combining secondary indicators such as affordability and credit and tertiary indicators such as average personal loan interest rates and Huabei payment proportions. Previous studies have suggested that improving identification and risk assessment, enhancing the social credit reporting system and environment, and using big data technology and high-speed computing can help evaluate risks quickly, leading to lower loan interest rates and easier lending for traditional financial institutions [47]. However, the p-value in our study was less than 10%, indicating weak evidence supporting their statistical relationships.

4.4. Spatial Effects of SCP on DIF

In Section 4.3, we discovered that the population coverage of DIF in pilot cities did not significantly improve compared to non-SCP pilot cities. In this section, we investigate whether SCP has any spatial effect on DIF.

4.4.1. Assessing Diffusion Effects of SCP

To examine the spatial heterogeneity and diffusion influence of SCP, this study computes the shortest geographic Euclidean distance between SCP pilot cities and non-pilot cities, as well as their adjacent cities. A binary variable is established based on the distance; it is set to 1 within a certain distance and 0 otherwise. This study employs a 20 km bandwidth and creates five bandwidths between cities, ranging from 0 to 100 km, sequentially interacting with the five geographical distance binary variables and DID factors and incorporating them into the benchmark DID model. Table 8 reveals that when observable factors are not controlled, SCP maintains a certain policy effect within a 40–60 km range from the treatment group. Observing the trend, within a 0–60 km range from the treatment group, the spatial spill-over effect of SCP exhibits a pattern of initially increasing and then decreasing with distance. When accounting for observable factors, the spatial spill-over range of SCP narrows to a 0–40 km range from the treatment group. As a result, it can be inferred that a certain spatial correlation may be present in the smart city pilots. Neglecting spatial correlation while evaluating policy impact may introduce bias in the model setting.

4.4.2. Selection of Spatial Econometric Model

In this study, the appropriate spatial econometric model is determined through a spatial econometric correlation test. The Hausman test results reveal a χ2 statistic of 1902.52 and a p-value less than 0.0001, suggesting that the fixed effect model is superior to the random effect model. Furthermore, the fixed effects assumption is more consistent with reality and better suited for addressing the issue of omitted variables compared to the random effect model. To investigate whether the Spatial Durbin Model (SDM) can be simplified into a Spatial Auto-Regressive Model (SAR) and a Spatial Error Model (SEM), this study employs the Wald test and log-likelihood ratio (LR) test. The Wald test results exhibit a χ2 statistic of 95.48 and a p-value of 0.0000, while the LR test results display a χ2 statistic of 109.74 and a p-value less than 0.0001. Both tests’ outcomes indicate that the fixed effect SDM model should be chosen for estimation in this context.
Table 8. The diffusion effects of SCP.
(1)(2)
0~20 km3.9887 ***3.9396 ***
(1.1908)(1.2404)
20~40 km4.897 **4.1732 *
(2.1494)(2.2268)
40~60 km2.2232 *1.7372
(1.1769)(1.1966)
60~80 km1.74481.5448
(1.137)(1.1346)
80~100 km2.2111.6389
(1.4349)(1.4297)
Control variablesUncontrolledControlled
Year fixed effectsControlledControlled
City fixed effectsControlledControlled
Obs22802280
R20.99460.9946

4.4.3. Regression Analysis of Fixed Effects in SDM

The spatial correlation of economic activities is often linked to geographical and economic distances, and it influences the sensitivity of spatial econometric models to spatial weights. In our analysis, we employ geographical distance, economic distance, and adjacent spatial weight matrices for estimation. The results depicted in Table 9 reveal that the spatial autocorrelation coefficient (ρ) of the Digital Financial Inclusion Index is significantly positive at the 1% confidence level, indicating a strong spatial dependence in the development of DIF. The development level of digital financial inclusion, based on geographical distance, economic distance, and adjacent space, impacts the development level of DIF in a specific region.

5. Discussion

After conducting various robustness tests, this article indicates that SCP (driven by government initiatives) has indeed promoted the development of DIF (spearheaded by the Ant Group, the largest financial services corporation in China). However, it should be noted that this effect is indirect rather than direct. The Chinese government’s primary objective in building smart cities is not focused on deepening the development of inclusive digital finance spearheaded by the Ant Group. Since the 18th National Congress of the Communist Party of China, the government has made efforts to regulate and combat capital monopolies. Therefore, even if cooperation with large private capital is possible, the Chinese government is believed not to prioritize the interests of capitalists. As a result, the promotional effect of SCP implemented by the Chinese government on DIF spearheaded by the Ant Group should be understood as indirect.
In this study, the evidence that can be used to support the promoting effect of SCP on DIF is indirect and includes the following:
(1)
The main content of smart city construction is to enhance the digital and information-based infrastructure of the city. However, the development of smart cities driven by government initiatives has not advanced the degree of digitization observed in inclusive finance spearheaded by the Ant Group. At the very least, there is no statistically significant correlation between the two. Hence, while the Chinese government-led smart city construction also involves digitization, this digitization is not aimed at facilitating the expansion of large private capital.
(2)
Smart city construction in China directly affects rural residents and marginalized groups and seeks to promote digital development in grassroots governments. In recent years, the most significant digital transformation undergone by Chinese society is the continual reduction of the urban–rural gap in infrastructure development, such as internet access [8]. However, compared to the results of this study, there was no significant difference in the population coverage of DIF between SCP pilot cities and non-pilot cities. These findings indicate that the objectives of the government and large private capital do not entirely align.
(3)
The content of smart city construction does not include the monetary fund business, credit business, insurance business, investment business, and credit services of the digital finance industry. However, the results of this study show that the depth of DIF usage of these businesses in SCP pilot cities has significantly increased compared to non-SCP pilot cities. The possible reason for this is that large private capital utilized SCP to develop DIF. The acquisition of DIF services entails significant technical complexity, where users’ knowledge base, financial awareness, and digital literacy play a pivotal role. These elements serve as critical gateways for accessing digital financial resources [48,49]. Additionally, the development of smart cities creates a favorable environment for promoting the digital literacy of residents, either directly or indirectly [50,51]. Therefore, under the influence of the market economy, SCP promotes the development of DIF indirectly, especially in increasing its depth of use.
However, although the direct purpose of the government in implementing SCP is not to promote the development of large private capital in DIF, it indirectly has such an effect. This development reflects the profit-seeking logic of large private capital. Supporting evidence shows that, compared to non-SCP pilot cities, SCP pilot cities have made significant progress only in the depth usage of DIF. Additionally, significant progress in DIF coverage has been only reflected in geographical space and not in population coverage. Under the framework of a free market economy, the mainstream view is that smart city construction is an opportunity for growth and innovation [12,52]. As Neo-Marxism criticizes, market-oriented approaches and technical solutions may marginalize advanced groups without access to technology and financial services [53,54]. These views criticize the focus on private investment and market forces, which undermine public services and exacerbate existing inequalities [55,56].

6. Conclusions

This article utilizes PKU-DFIIC data to explore the relationship between SCP and DIF in China. It provides robust evidence of the relationship between SCP and DIF through double difference testing. After controlling for other factors, the DIF development level of SCP pilot cities increased by 21.5% compared to non-SCP pilot cities. This article also examines the heterogeneous impact of SCP on the development of DIF in various dimensions. It finds a significant correlation with the depth of use of DIF but no statistical correlation with the coverage and degree of digitization of DIF. The spatial Durbin model indicates that the development level of DIF in a specific region is influenced by the geographical distance and economic activities of surrounding areas.
This article emphasizes the essential difference between the government (the CPC) and large private capital when explaining the relationship between SCP and DIF in China. The empirical research suggests that the operating logic of capital and its economic and social impact is intricate in China. As China’s economy transitioned to a market economy, capital power has become a significant and intangible force in Chinese society. When formulating and implementing public policies, the government’s original intent may not be to serve capitalist interests, but these policies may be used by capital logic during implementation. To avoid negative outcomes such as social inequality, the Chinese government should carefully manage its relationships with large private capital in public policies and direct it towards a positive role.
Overall, this study enhances understanding of the SCP–DIF relationship in China and emphasizes the importance of managing government–capital relationships in public policies. Future studies could focus on the following areas: (1) explore how large private capital utilizes SCP to advance digital finance development and the extent to which government policies influence capital’s behavior; (2) examine the implications of the strained government–capital relationship on public policies in China. Assess the effectiveness of government measures to regulate and combat capital monopolies while promoting inclusive finance and ensuring social equality; (3) investigate whether market-oriented approaches and technical solutions, as seen in smart city construction, exacerbate existing inequalities and marginalize certain groups.

Author Contributions

Conceptualization, J.L., X.C. and G.Y.; methodology, J.L. and X.C.; software, X.C. and G.Y.; validation, J.L., X.C. and G.Y.; formal analysis, J.L. and X.C.; investigation, J.L. and X.C.; resources, J.L., X.C. and G.Y.; data curation, X.C. and G.Y.; writing—original draft preparation, J.L., X.C. and G.Y.; writing—review and editing, J.L. All authors have read and agreed to the published version of the manuscript.

Funding

This research received no external funding.

Institutional Review Board Statement

Not applicable.

Informed Consent Statement

Not applicable.

Data Availability Statement

The data used in the paper, the Digital Inclusive Finance Index, can be found at https://www.idf.pku.edu.cn/bqzt/xw/513798.htm (accessed on 10 September 2022). Other data can be made available upon request.

Conflicts of Interest

The authors declare no conflict of interest.

References

  1. Shkarlet, S.; Dubyna, M.; Zhuk, O. Determinants of the financial services market functioning in the era of the informational economy development. Balt. J. Econ. Stud. 2018, 4, 349–357. [Google Scholar] [CrossRef]
  2. Pazarbasioglu, C.; Mora, A.G.; Uttamchandani, M.; Natarajan, H.; Feyen, E.; Saal, M. Digital Financial Services; World Bank: Washitington, DC, USA, 2020; pp. 1–54. Available online: https://pubdocs.worldbank.org/en/230281588169110691/Digital-Financial-Services.pdf (accessed on 10 March 2023).
  3. Durai, T.; Stella, G. Digital Finance and its Impact on Financial Inclusion. J. Emerg. Technol. Innov. Res. 2019, 6, 122–127. [Google Scholar]
  4. Situ, P. Microfinance in China and Development Opportunities. Consultant Report, October, German Technical Cooperation (GTZ). 2003. Available online: https://www.findevgateway.org/sites/default/files/publications/files/mfg-en-paper-microfinance-in-china-and-development-opportunities-oct-2003.pdf (accessed on 15 March 2023).
  5. Yeung, G. Chinese state-owned commercial banks in reform: Inefficient and yet credible and functional? J. Chin. Gov. 2021, 6, 198–231. [Google Scholar] [CrossRef]
  6. Boiarynova, K.; Popelo, O.; Tulchynska, S.; Gritsenko, S.; Prikhno, I. Conceptual Foundations of Evaluation and Forecasting of Innovative Development of Regions. Period. Polytech. Soc. Manag. Sci. 2022, 30, 167–174. [Google Scholar] [CrossRef]
  7. Gruin, J.; Knaack, P. Not just another shadow bank: Chinese authoritarian capitalism and the ‘developmental’ promise of digital financial innovation. New Political Econ. 2020, 25, 370–387. [Google Scholar] [CrossRef] [Green Version]
  8. China Internet Network Information Center [CNNIC]. The 49th Statistical Report on China’s Internet Development. 2022. Available online: https://www.cnnic.com.cn/IDR/ReportDownloads/202204/P020220424336135612575.pdf (accessed on 15 March 2023).
  9. Chang, S.E.; Luo, H.L.; Chen, Y. Blockchain-enabled trade finance innovation: A potential paradigm shift on using letter of credit. Sustainability 2019, 12, 188. [Google Scholar] [CrossRef] [Green Version]
  10. Perzanowski, A.; Schultz, J. The End of Ownership: Personal Property in the Digital Economy; MIT Press: Cambridge, MA, USA, 2016. [Google Scholar]
  11. Anttiroiko, A.V.; Valkama, P.; Bailey, S.J. Smart cities in the new service economy: Building platforms for smart services. AI Soc. 2014, 29, 323–334. [Google Scholar] [CrossRef]
  12. Bagloee, S.A.; Heshmati, M.; Dia, H.; Ghaderi, H.; Pettit, C.; Asadi, M. Blockchain: The operating system of smart cities. Cities 2021, 112, 103104. [Google Scholar] [CrossRef]
  13. The State Council of the People’s Republic of China. Xi Jinping Presided over the 38th Collective Study of the Political Bureau of the CPC Central Committee and Delivered an Important Speech. 30 April 2022. Available online: http://www.gov.cn/xinwen/2022-04/30/content_5688268.htm (accessed on 20 May 2023).
  14. Lin, C.S. State, capital, and space in China in an age of volatile globalization. Environ. Plan. A 2000, 32, 455–471. [Google Scholar] [CrossRef]
  15. Zhao, Z.J.; Su, G.; Li, D. The rise of public-private partnerships in China. J. Chin. Gov. 2018, 3, 158–176. [Google Scholar] [CrossRef]
  16. Liu, Z.; Guo, J.E.; Wang, S.; Liu, H. Government incentive strategies and private capital participation in China’s Shale gas development. Appl. Econ. 2018, 50, 51–64. [Google Scholar] [CrossRef]
  17. Arora, R.U. Financial sector development and smart cities: The Indian case. Sustain. Cities Soc. 2018, 42, 52–58. [Google Scholar] [CrossRef] [Green Version]
  18. Visvizi, A.; Lytras, M.D.; Damiani, E.; Mathkour, H. Policy making for smart cities: Innovation and social inclusive economic growth for sustainability. J. Sci. Technol. Policy Manag. 2018, 9, 126–133. [Google Scholar] [CrossRef] [Green Version]
  19. Papa, C.; Rossi, N. Smart Cities and Sustainable Finance. Eur. J. Islam. Financ. 2022, 9, 18–26. [Google Scholar]
  20. Langley, P.; Leyshon, A. Platform capitalism: The intermediation and capitalization of digital economic circulation. Financ. Soc. 2017, 3, 11–31. [Google Scholar] [CrossRef] [Green Version]
  21. Chen, B.; Zhu, H. Has the Digital Economy Changed the Urban Network Structure in China?—Based on the Analysis of China’s Top 500 New Economy Enterprises in 2020. Sustainability 2022, 14, 150. [Google Scholar] [CrossRef]
  22. Hu, Q.; Zheng, Y. Smart city initiatives: A comparative study of American and Chinese cities. J. Urban Aff. 2021, 43, 504–525. [Google Scholar] [CrossRef]
  23. Smart, E.C.; Cooperation, G.C. Comparative study of smart cities in Europe and China. In Current Chinese Economic Report Series; Springer: Berlin/Heidelberg, Germany, 2014. [Google Scholar]
  24. Shen, L.; Huang, Z.; Wong, S.W.; Liao, S.; Lou, Y. A holistic evaluation of smart city performance in the context of China. J. Clean. Prod. 2018, 200, 667–679. [Google Scholar] [CrossRef]
  25. Yu, W.; Xu, C. Developing smart cities in China: An empirical analysis. Int. J. Public Adm. Digit. Age (IJPADA) 2018, 5, 76–91. [Google Scholar] [CrossRef]
  26. Lardy, N. Markets over Mao: The Rise of Private Business in China; Columbia University Press: New York, NY, USA, 2014. [Google Scholar]
  27. Ozili, P.K. Financial inclusion research around the world: A review. Forum Soc. Econ. 2021, 50, 457–479. [Google Scholar] [CrossRef]
  28. Allen, F.; Qian, J.Q.; Gu, X. An overview of China’s financial system. Annu. Rev. Financ. Econ. 2017, 9, 191–231. [Google Scholar] [CrossRef]
  29. Bakır, C.; Çoban, M. How can a seemingly weak state in the financial services industry act strong? The role of organizational policy capacity in monetary and macroprudential policy. New Perspect. Turk. 2019, 61, 71–96. [Google Scholar] [CrossRef]
  30. Tkachuk, I.; Kobelia, M.; Popelo, O.; Zhavoronok, A.; Vinnychuk, O. Modelling financial influence of political and oligarchic interests of governed-sponsored enterprises on the creation and implementation of the financial policy in the state. J. Hyg. Eng. Des. 2023, 42, 271–279. [Google Scholar]
  31. Shen, Q.; Wu, R.; Pan, Y.; Feng, Y. The effectiveness of smart city policy on pollution reduction in China: New evidence from a quasi-natural experiment. Environ. Sci. Pollut. Res. 2023, 30, 52841–52857. [Google Scholar] [CrossRef]
  32. Institute of Digital Finance at Peking University. Peking University Digital Financial Inclusion Index (2011–2020). April 2021. Available online: http://nsd.pku.edu.cn/docs/20221017131046905230.pdf (accessed on 22 May 2023).
  33. Ji, Y.; Shi, L.; Zhang, S. Digital finance and corporate bankruptcy risk: Evidence from China. Pac.-Basin Financ. J. 2022, 72, 101731. [Google Scholar] [CrossRef]
  34. Lv, P.; Xiong, H. Can FinTech improve corporate investment efficiency? Evidence from China. Res. Int. Bus. Financ. 2022, 60, 101571. [Google Scholar] [CrossRef]
  35. Ahmad, M.; Majeed, A.; Khan, M.A.; Sohaib, M.; Shehzad, K. Digital financial inclusion and economic growth: Provincial data analysis of China. China Econ. J. 2021, 14, 291–310. [Google Scholar] [CrossRef]
  36. Chen, M. Research on Threshold Effect of Digital Inclusive Finance and Regional Urban-rural Income Gap. Front. Econ. Manag. 2021, 2, 255–262. [Google Scholar]
  37. Ant Group. 2023. Available online: https://www.antgroup.com/#company-profile (accessed on 15 January 2023).
  38. MOHURD (Ministry of Housing and Urban-Rural Development). A Notice on Conducting National Pilot Smart Cities [Guan Yu Kai Zhan Guo Jia ZhiHui Cheng Shi Shi Dian Gong Zuo De Tong Zhi]. 2012. Available online: www.mohurd.gov.cn/wjfb/201212/t20121204_212182.html (accessed on 15 January 2023).
  39. Abadie, A. Semiparametric difference-in-differences estimators. Rev. Econ. Stud. 2005, 72, 1–19. [Google Scholar] [CrossRef]
  40. Athey, S.; Imbens, G.W. The state of applied econometrics: Causality and policy evaluation. J. Econ. Perspect. 2017, 31, 3–32. [Google Scholar] [CrossRef] [Green Version]
  41. PKU-DFIIC. The Peking University Digital Financial Inclusion Index of China (2011–2020) [PDF]. Institute of Digital Finance Peking University. 2021. Available online: https://idf.pku.edu.cn/docs/20210421101507614920.pdf (accessed on 18 March 2023). (In Chinese).
  42. Bertrand, M.; Mullainathan, S. Pyramids. J. Eur. Econ. Assoc. 2003, 1, 478–483. [Google Scholar] [CrossRef]
  43. Beck, T.; Levine, R.; Levkov, A. Big Bad Banks? The Winners and Losers from Bank Deregulation in the United States. J. Financ. 2010, 65, 1637–1667. [Google Scholar] [CrossRef] [Green Version]
  44. Moser, P.; Voena, A. Compulsory Licensing: Evidence from the Trading with the Enemy Act. Am. Econ. Rev. 2012, 102, 396–427. [Google Scholar] [CrossRef] [Green Version]
  45. Blundell, R.; Dias, M.C. Evaluation methods for non-experimental data. Fisc. Stud. 2000, 21, 427–468. [Google Scholar] [CrossRef]
  46. Heyman, F.; Sjöholm, F.; Tingvall, P.G. Is there really a foreign ownership wage premium? Evidence from matched employer-employee data. J. Int. Econ. 2007, 73, 355–376. [Google Scholar] [CrossRef] [Green Version]
  47. Zenios, C.V.; Zenios, S.A.; Agathocleous, K.; Soteriou, A.C. Benchmarks of the efficiency of bank branches. Interfaces 1999, 29, 37–51. [Google Scholar] [CrossRef]
  48. Poon, W.C. Users’ adoption of e-banking services: The Malaysian perspective. J. Bus. Ind. Mark. 2008, 23, 59–69. [Google Scholar] [CrossRef]
  49. Mohammadyari, S.; Singh, H. Understanding the effect of e-learning on individual performance: The role of digital literacy. Comput. Educ. 2015, 82, 11–25. [Google Scholar] [CrossRef]
  50. Kummitha, R.K.R.; Crutzen, N. How do we understand smart cities? An evolutionary perspective. Cities 2017, 67, 43–52. [Google Scholar] [CrossRef]
  51. OECD. Smart Cities and Inclusive Growth: Building on the Outcomes of the 1st OECD Roundtable on Smart Cities and Inclusive Growth. 2020. Available online: https://www.oecd.org/cfe/cities/OECD_Policy_Paper_Smart_Cities_and_Inclusive_Growth.pdf (accessed on 15 January 2023).
  52. Zygiaris, S. Smart city reference model: Assisting planners to conceptualize the building of smart city innovation ecosystems. J. Knowl. Econ. 2013, 4, 217–231. [Google Scholar] [CrossRef]
  53. Charnock, G. Challenging new state spatialities: The open Marxism of Henri Lefebvre. Antipode 2010, 42, 1279–1303. [Google Scholar] [CrossRef]
  54. Harvey, D. The political economy of public space. In The Politics of Public Space; Routledge: Abingdon, UK, 2013; pp. 23–188. [Google Scholar]
  55. Harvey, D. Neoliberalism and the City. Stud. Soc. Justice 2007, 1, 2–13. [Google Scholar] [CrossRef]
  56. Kitchin, R.; Cardullo, P.; Di Feliciantonio, C. Citizenship, justice, and the right to the smart city. In The Right to the Smart City; Emerald Publishing Limited: Bingley, UK, 2019; pp. 1–24. [Google Scholar] [CrossRef] [Green Version]
Figure 1. Trends in the Digital Financial Inclusion Index for the treatment group and control group. Note: The number depicted in the figure represents the median of the index.
Sustainability 15 09035 g001
Figure 2. The net effect of SCP implementation over time. Note: The net effect of implementation refers to the overall impact of the intervention by comparing outcome changes between the treatment and control groups before and after the intervention. Due to the model specification, the lagged term (t-1) was omitted from the econometric regression analysis.
Sustainability 15 09035 g002
Figure 3. Randomly generated regression coefficients and their p-values for treatment and control groups, across 1000 iterations.
Sustainability 15 09035 g003
Table 1. Digital Financial Inclusion Index System.
First-Level DimensionSecond-Level DimensionSpecific Indicators
CoverageAccount coverageNumber of Alipay accounts per 10,000 people
Proportion of Alipay users with linked bank cards
Average number of bank cards linked to each Alipay account
Usage depthPayment serviceNumber of payments per capita
Per capita payment amount
active users to the total active users per year
Monetary Fund BusinessNumber of Yu’e Bao purchases per capita
Amount of Yu’e Bao purchased per capita
Number of Yu’e Bao purchasers per 10,000 Alipay users
Credit businessPersonal consumption loansNumber of internet consumption loan users per 10,000 Alipay adult users
Number of loans per capita
Loan amount per capita
Small and micro-business loansNumber of internet small & micro-business loan users per 10,000 Alipay adult users
Average number of loans per small and micro-business
Average loan amount for small and micro-businesses
Insurance businessNumber of insured users per 10,000 Alipay users
Number of insurance policies per capita
Insurance amount per capita
Investment BusinessAlipay users in online investment and wealth management per 10,000 people
Number of investments per capita
Per capita investment amount
Credit servicesPer capita call times of natural person credit
Number of credit-based service users per 10,000 Alipay users
Degree of digitizationMobileProportion of mobile payment transactions
Proportion of mobile payment amount
AffordabilityAverage loan interest rate for small and micro-businesses
Average personal loan interest rate
CreditProportion of Huabei payments
Proportion of Huabei payment amount
Proportion of Sesame Credit’s deposit-free transactions
Proportion of Sesame Credit’s deposit-free amount
ConvenienceProportion of user QR code payments
Proportion of the amount paid by user QR code
Note: The terms “Yu’e Bao”, “Huabei”, and “Sesame” refer to popular financial services offered by Ant Group, a prominent financial technology company in China.
Table 2. Descriptive statistics of all variables.
VariableObservationsMeanStd. Dev.MinMax
Digital Financial Inclusion Index1648151.63461.00017.020284.910
Logarithm of GDP per capita (USD)16488.6420.6686.26613.765
Proportion of GDP from the secondary industry (%)164847.97311.10213.57089.340
Proportion of GDP from the tertiary industry (%)164842.441101.52510.15080.980
Human capital level
(% of the population with a certain level of education or training)
164818.8296.9600.52362.303
Logarithm of population density (person/km2)16487.9880.7185.7339.397
Proportion of fiscal expenditure on science and technology
(% of total government spending)
16480.8851.2980.00220.414
Logarithm of telecom business volume per capita (USD)16484.6220.8300.5249.688
The average number of mobile phones per capita in the city16480.9140.4330.1113.303
The number of Internet connected devices per capita in the city16480.1850.1440.0351.489
Logarithm of per capita salary of employed workers (USD)16486.3790.8724.2629.785
Logarithm of per capita foreign direct investment (USD)16485.1892.056−1.8209.403
Table 5. Regression outcomes accounting for pre-existing trends.
(1)(2)
DID3.0482 **2.6283 **
(1.1979)(1.1763)
Control variablesUncontrolledControlled
Year fixed effectsControlledControlled
City fixed effectsControlledControlled
Time trend term × Treatment group dummy variableControlledControlled
Obs16481648
R20.99410.9944
Table 6. Regression outcomes accounting for systematic bias.
(1)(2)
DID1.4277 ***1.0288 **
(0.5002)(0.4962)
Control variablesUncontrolledControlled
Year fixed effectsControlledControlled
City fixed effectsControlledControlled
Obs15721572
R20.99460.9948
Note: The observed sample size in this analysis is different from 1648 due to the application of the PSM process, which results in a reduction in the sample size.
Table 7. The impact of SCP on different dimensions of DIF.
(1)(2)(3)(4)(5)(6)
CoverageDepth of UseDegree of Digitization
DID0.1914−0.24742.3111 ***2.2925 ***3.9309 *4.084 *
(0.4692)(0.4443)(0.8754)(0.8669)(2.2213)(2.1819)
Control variablesUncontrolledControlledUncontrolledControlledUncontrolledControlled
Year fixed effectsControlledControlledControlledControlledControlledControlled
City fixed effectsControlledControlledControlledControlledControlledControlled
Obs164816481648164816481648
R20.99430.99490.98670.98710.92850.9300
Table 9. Analysis of fixed-effect SDM using various spatial weight matrices.
Weight Matrix Type(1)(2)(3)
Geographical DistanceEconomicProximity
DID2.0766 **1.5206 ***5.8274 ***
(0.9574)(0.6243)(2.2153)
Control variablesControlledControlledControlled
Fixed effectsControlledControlledControlled
ρ1.3047 ***0.8926 ***0.6362 ***
(0.0498)(0.0127)(0.0505)
σ e 2 28.3547 ***21.7206 ***130.8168 ***
(3.5165)(2.4903)(29.8918)
Obs164816481648
R20.03550.94290.0523
Note: ρ represents the spatial correlation coefficient of the dependent variable, while Sigma-squared ( σ e 2 ) denotes the standard deviation of the error term.
Disclaimer/Publisher’s Note: The statements, opinions and data contained in all publications are solely those of the individual author(s) and contributor(s) and not of MDPI and/or the editor(s). MDPI and/or the editor(s) disclaim responsibility for any injury to people or property resulting from any ideas, methods, instructions or products referred to in the content.

