Abstract
Urban vitality, understood as a key factor in the achievement of cities’ sustainability, shows a strong relationship with urban morphology. The city theorist Jane Jacobs suggested morphological aspects to promote vital cities in the 1960s, which remain valid in the present. However, few studies in the Andean region quantitatively exemplify this. This paper aims to test the measurement of urban vitality in a neighborhood of Quito, Ecuador, called La Mariscal, integrating Jacobs’ approach. In particular, three urban vitality indexes are evaluated with the application of GIS software using cadastral data obtained from the Metropolitan District of Quito and field data collection. Results show that context-based previous knowledge and scale of analysis are essential factors in the configuration of dimensions, indicators, and spatial representation of any urban vitality index. In the study area, land use mixture, contact opportunity, and accessibility dimensions are fundamental. Regarding indicators, the incorporation of informal small-scale commerce, the quality of sidewalks, and well-conditioned street furniture is recommended. Finally, a hybrid representation (raster and vectorial) is suggested to precisely measure urban vitality at a block scale. Altogether, by providing a comparative approach, we intend to provide a useful framework for researchers and planners to study urban vitality in Andean cities.
1. Introduction
Urban vitality is a central topic on 21st-century urban agendas. According to the United Nations (UN), an estimated 60% of the world’s population occupied urban areas by 2021, while South American numbers increased to 82% of the total [1]. This urban expansion presents considerable challenges regarding the sustainability of the planet. In this regard, the UN suggested in 2016 17 Sustainable Development Goals (SDG) to guarantee human growth viability [2]. The eleventh goal, Sustainable Cities and Communities, highlights the significance of conceiving good places to live, which must include a transversal answer to environmental, economic, and social requirements. Descending this concept to a small urban scale, the perception of a successful neighborhood is related to the idea of self-sufficiency and proximity, having the possibility of close access to food supply (shops, supermarkets), health (hospitals, recreation areas), education (kindergartens, schools, universities), and housing, placing the commodity and quality of life of the inhabitants in the center of the urban discussion [3].
One of the pioneers in the study of urban vitality was the American Canadian city theorist Jane Jacobs (1916–2006). She wrote a highly influential book in 1961, “The Death and Life of Great American Cities”, which remains valid more than sixty years later. In the first chapter, Jacobs pointed out the importance of people’s concentration in the achievement of urban vitality. According to this, she presented sidewalks as one of the main elements of the nature of cities. She coined the expression “eyes on the street”, referring to the fact that having people walking around and looking through windows would guarantee street safety, among other things [4]. In the second chapter, Jacobs analyzed diversity, relating it primarily to economic and morphologic factors, concluding that the need for primary mixed uses, the need for small blocks, the need for aged buildings, and the need for concentration of people were substantial dimensions to provide urban vitality. In the third and fourth chapters, she highlighted the importance of reducing border vacuums, referring to big urban areas with massive single uses, and having good accessibility as additional complements to motivate people to walk on the streets [4].
Since the 1970s, a significant number of authors have reviewed and interpreted Jacobs’s approach defining several indexes, composed of different dimensions and, at the same time, structured by a sum of indicators: the index of total diversity [5], the primary diversity index [6], the Jacobs’s diversity index [7], the compact city index [8], the Simpson diversity index [9], the Shannon’s index [10], the walkability index [11], the entropy index [12,13], the gravity index [14], the JANE index [15,16,17,18], the urban vibrancy index [19], the Morphoindex [20], the urban form index [21], the urban comprehensive vitality index [22], the urban vitality index [23], and Moran’s index of urban vibrancy [24]. Additionally, the total number of publications regarding urban vitality increased by 527% from 2008 to 2018 [25].
A strong precedent of urban vitality studies explores Asian cities, more specifically Shenzhen [26,27,28], Hong Kong [29], Shanghai [27,30,31], Tianjin [27,32], Chengdu [27,33,34], Wuhan [27], and Qingdao [18,27] in China; Seoul [7,35,36,37] in South Korea; Singapore in Singapore [20]; Ho Chi Minh [38] in Vietnam and Kayseri [39] in Turkey. To a lesser extent, similar investigations have been conducted in North America, more precisely in the United States, with special attention in Seattle and Washington [11], followed by Manhattan [14,40], Portland, Brisbane, Indianapolis, and Chicago [14]. In Australia, Melbourne and Adelaide [14] have been studied. In Europe, research has taken place principally in London, England [41]; Rotterdam in the Netherlands [42]; in Italy, specifically in Bologna, Florence, Milan, Palermo, Rome, and Turin [43,44]; and in Barcelona, Spain [15,17]. Finally, in South America, only Santiago, in Chile, has been analyzed [16].
The definition of a clear geographic scale is essential to comprehending urban vitality [35,45]. Investigations have predominantly focused on the metropolitan scale [7,28,36,38,46]. However, some studies pay attention to the district and neighborhood scales. According to this, ref. [17] compares the thirteen neighborhoods that constitute the district of Nou Barris in Barcelona, but without descending to the block scale. Refs. [47,48]’s approach the block scale but only examine the accessibility dimension. Ref. [18] proposes a decrease in scale without exactly defining the conditions per block. The fact of not accentuating the importance of the block scale could lead to a misunderstanding of the closest environment, the belonging space, and the essence of urban vitality [49].
The scale of the study area is directly related to the representation system. Two main spatial representations are used to map urban vitality: raster-based and vectorial-based. In most cases, the first one uses a regular raster of squares, which adopts a quantitative gradient of pixel divisions, symbolizing the ponderation of the chosen categories. Moreover, the size of the study area usually determines the pixel area. The smallest ones, around 50 × 50 m, include districts or neighborhoods of study [17,39], while the large ones, from 100 × 100 m up to 250 × 250 m, usually provide the analysis of the whole area of a city [15,16,50,51] or the comparison of various metropolises [20,27,52]. The second representation method uses the administrative boundary of districts or neighborhoods, which commonly coincides with the street layout [11,38,53,54,55]. Additionally, another interesting way of illustrating urban vitality is by mapping continuous lines on the street layout with different gradient colors, leaving the blocks empty [34], using alternative diagrams with different-sized and colored circles, linear diagrams based on x and y coordinates [31], and 3D space-time cubes [28].
The review of studies on urban vitality in the last ten years allows us to identify two major research gaps that structure the present research: (i) there is no evidence of the application and comparison of different urban vitality indexes in a single case study, and (ii) there is a lack of studies representing urban vitality at a block scale in the Andean region. Regarding the first gap, there are no publications that illustrate the application of more than one index of urban vitality in the same study area, avoiding the possibility of contrasting results. Concerning the second gap, only one study uses GIS quantification to measure urban vitality, more specifically in Santiago, Chile [16]. Nevertheless, there is potential for practice-oriented research since several initiatives in Argentina and Ecuador examined urban morphology to inform sustainable principles at a neighborhood level, although not directly applying urban vitality indexes [48]. On this subject, it is worth mentioning Salvador Rueda, who carried out several projects in agreement with the Municipality of Quito as a director of the Agencia de Ecología Urbana de Barcelona (AEUB), in which he developed the Superblocks Study at the Historic Center of the city between 2013 and 2015, promoting private traffic reduction and active mobility. Some of these ideas were taken into consideration for future territorial plans of the city [56]. The Llactalab laboratory in Cuenca, Ecuador, developed a GIS tool for urban morphology and sustainability [57]. Additionally, studies do not usually illustrate urban vitality with a morphological characterization and representation of blocks. Nevertheless, this is probably the most appropriate scale of analysis, considering the daily component of the movements of the inhabitants within the area.
Research questions arising from the two gaps are: (i) Which criteria can guide the selection of dimensions and indicators for measuring urban vitality? (ii) Which representation system is more precise for measuring urban vitality at a block scale? Therefore, the present presents two objectives: (i) develop a comparative approach through the application of different indexes in a single case study and (ii) assess the representation of urban vitality at a block scale in the Andean region. Both objectives are developed based on the morphological features derived from Jane Jacobs’s approach in La Mariscal neighborhood, Quito, Ecuador. For a better understanding of the reader, this document in Section 2 describes Materials and Methods; Section 3 provides the Results; Section 4 discusses the paper’s findings; and Section 5 states the Conclusions.
2. Materials and Methods
2.1. Study Area
La Mariscal neighborhood is located north of the Historic Center of Quito (Figure 1), Ecuador, and was planned in the 1920s and officially baptized in 1922 as “Ciudadela Mariscal Sucre” [58] as an extension to house some of the wealthy families of the capital living in the colonial center. It has a population of 7732 inhabitants [59] in an area of approximately 1.82 km2 [58] and was initially designed with the typical garden city principle: big villas surrounded by private green spaces. Furthermore, it included a reticular street layout created over 100 years [58], with 163 blocks, where around 50% show square and rectangular shapes between 80 m and 120 m in length. In the 1940s, a new development of townhouses took place in the northern part of the area, and in the 1970s and 1980s, the construction of high buildings along the main avenues complemented its urban morphology [58]. In the last two decades, a significant number of multi-family housing units have been added to the rich morphological panorama. This urban growth process has given rise to a fabric that combines residential uses with a rich variety of amenities within walking distance. Despite presenting a low population density, the combination of different building typologies in a small-scaled street layout with abundant activities on the ground floor and well-provided public facilities and services positions this neighborhood as a good case study to map urban vitality at a block scale (Figure 2 and Figure 3).
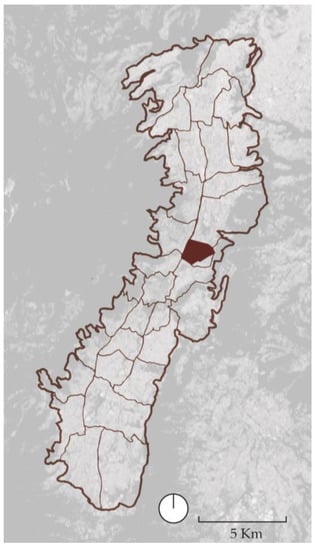
Figure 1.
Metropolitan District Quito, la Mariscal neighborhood.
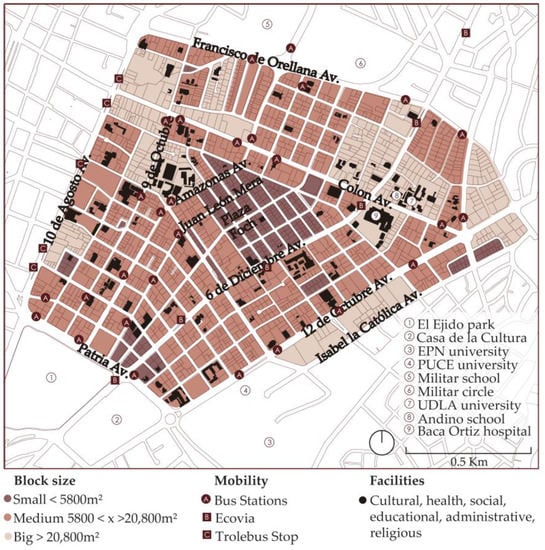
Figure 2.
Study area morphological plan.
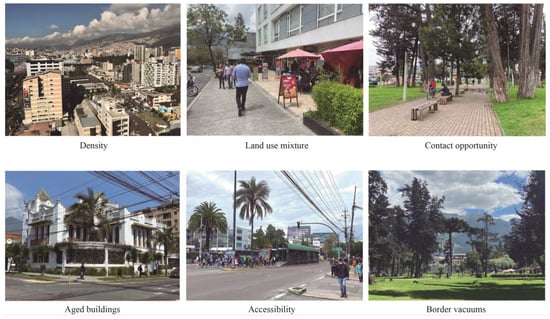
Figure 3.
Dimensions derived from Jane Jacobs in the study area.
2.2. Dimensions Derived from Jane Jacobs
In this article, we interpret and adapt six morphological dimensions derived from Jane Jacobs [4] to measure to what degree a contemporary urban area can be considered vital:
- The density dimension derives from “the need for concentration”, as recommended by Jacobs. Currently, it highlights the relevance of population density combined with an understanding of the built environment shaped by factors such as the density of buildings, commercial activities, and public facilities. In the study area, there is a remarkable presence of housing and commercial density. Nevertheless, the floor area ratio (FAR) could be considerably increased based on the regulations of the municipality;
- The land use mixture dimension derives from “the need for primary mixed uses” recommended by Jacobs. Currently, it emphasizes the significance of land use diversity in attracting a significant number of people. For instance, the presence of kindergartens, schools, restaurants, bars, discotheques, hospitals, and daycare centers would promote the presence of more children, teenagers, youngsters, families, and elderly people, respectively. In the study area, it is ensured as a result of the significant number of schools, universities, health centers, housing, offices, administrative buildings, churches, and commerce present;
- The contact opportunity dimension derives from “the need for small blocks” recommended by Jacobs. She posited that small blocks promote more interaction in the streets than large blocks [4]. Currently, it associates the urban layout and elements such as distance to pocket parks and Wi-Fi spots with the possibility of interaction for walkers. In the study area, it is represented by a heterogeneous reticular urban layout conformed by morphologically different grideal-patterned subsectors and the presence of pocket parks and Wi-Fi spots;
- The aged buildings dimension derives from the “need for aged buildings” recommended by Jacobs. It underlined the idea that older buildings would be more receptive to locating people with fewer economic resources, promoting social diversity. For this paper, since we have only considered morphological parameters, we have associated aged buildings with the original big villas surrounded by generous private green gardens and interpreted them as urban vitality propellers due to their current public use after rehabilitation as heritage buildings;
- The accessibility dimension derives from the “need for accessibility” recommended by Jacobs. Currently, it is related to the importance of having close access to public transport stops, facilitating a good connection with the rest of the city, as well as promoting universal accessibility. For example, it should facilitate that people in wheelchairs do not present problems if they have to climb a curve, or parents who push a baby cart may not struggle with rough sidewalks. In the study area, it is covered by different public transport stations. Nevertheless, the neighborhood presents limitations regarding universal accessibility because of the inappropriate quality of sidewalks and high street slopes;
- The border vacuum dimension derives from the “absence of border vacuums” recommended by Jacobs. It correlates with the idea that massive, gated areas inside the city, usually with one single use, such as railways, highways, or gated residential communities, make continuous walking more complicated and, therefore, urban vitality decreases. There is a presence of external border vacuums in the external perimeter of the study area.
2.3. Methods
In the present study, we use a quantitative multi-method approach combining (i) an exhaustive literature review, (ii) an application of GIS software, and (iii) expert judgment (Table 1).

Table 1.
Experts involved in the present study.
To answer the first research question regarding which criteria can guide the selection of dimensions and indicators for measuring urban vitality, three methods have been implemented. In the first method, databases such as Web of Science and Scopus have been used to find scientific publications corresponding to the last five years. Keywords for the search have been “urban vitality, urban vibrancy, urban form, and Jane Jacobs”. An intensive reading has helped to identify two pertinent indexes [16,17] to be adapted for the calculation of urban vitality in the study area, discarding the ones not integrating a clear Jane Jacobs’s approach. A third index, not implicitly related to Jane Jacobs’s approach but with an extensive urban form proposal [33], has been adapted and also included. In the second method, the three selected indexes have been tested in the study area through GIS software using a comparative methodological design [60]. In the third method, a compilation of opinions provided by experts such as residents, municipality workers, and researchers on the specific topic of La Mariscal neighborhood has been developed to certify the validity of the study [61] (Table 1). To answer the second research question regarding which representation system is more precise for measuring urban vitality at a block scale, the second and third methods have been implemented.
2.3.1. Indexes, Calculations, and Data Sources
This section examines the three applied indexes, their dimensions, indicators, formulas, weighting, and data sources (Table 2). Data sources are based both on cadastral data provided by the Metropolitan District of Quito and field data collection based on on-site direct observation for the building use mix, residential–non-residential balance, and entropy indicators.
Table 2.
Dimensions, indicators, formulas, weighting, and data sources of the three applied indexes.
Index 1
Index 1 contains nine indicators to measure the six morphological dimensions derived from Jane Jacobs: density, land use mixture, contact opportunity, aged buildings, accessibility, and border vacuums. Dimensions are weighted with 20% of the total each, except the last two dimensions, which are weighted with 10% of the total each, following Jacob’s theories that the four first dimensions were the most meaningful. The representation is generated by a raster of 50 × 50 m in order to obtain more detailed information at a block scale. The original index was applied in Barcelona, Spain [15], and Santiago, Chile [16]. It has been selected because it is the only index of urban vitality tested in the Andean region.
Index 2
Index 2 contains six indicators to measure four dimensions derived from Jane Jacobs: density, land use mixture, contact opportunity, and accessibility. Dimensions are weighted equally, with 25% of the total each, considering the relevance of accessibility in the contemporary reality of cities. The representation is generated by a vectorial block system, which oscillates between 750 m2 and 45.500 m2 per block. The original index was applied in Chengdu, China [33]. It has been selected because of the optimization of dimensions and indicators, the incorporation of a morphological indicator that correlates the regularity and size of blocks (the Richardson Compactness Index), and the convenience of correlating its study of urban form with Jane Jacobs’s approach.
Index 3
Index 3 contains eighteen indicators to measure the six morphological dimensions derived from Jane Jacobs: density, land use mixture, contact opportunity, aged buildings, accessibility, and border vacuums. Dimensions are weighted with 20% of the total each, except the last two dimensions, which are weighted with 10% of the total each, as shown in Index 1. The representation is generated by a raster of 50 × 50 m in order to obtain more detailed information at a block scale, as shown in Index 1. The original index was applied in Barcelona, Spain [17]. It has been selected because of the reduction in the scale of application from the city to the district and the addition of indicators related to land use mixture, contact opportunity, and accessibility dimensions.
A WGS84 referential system and a universal transversal coordinating system Mercator (UTM) for zone 17S are established [62,63]. Additionally, the study area is masked, and indicators are normalized as follows [64]:
Z scores = (number-average)/standard deviation
Once indicators are normalized, they are processed in the GIS 10.5 software to obtain the results of urban vitality for each index.
3. Results
The three existing indexes have been tested in the study area. Results on the applied dimensions and indicators are described, and a comparison between the three final maps of urban vitality is provided. The red color shows a more positive connection between urban morphology and urban vitality regarding Jane Jacobs’s approach, while the navy-blue color represents the opposite (Figure 4).
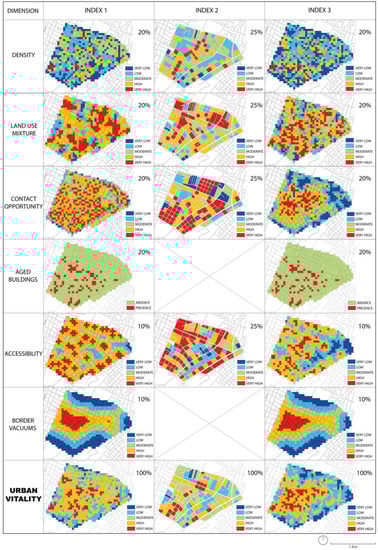
Figure 4.
Maps per dimension and final maps of urban vitality of the three indexes applied in La Mariscal.
3.1. Density
The density dimension aims to illustrate the potential concentration of people in the neighborhood. It emphasizes a uniform distribution of three indicators for the three indexes. Index 1 and Index 3 use the population density indicator and combine it with the housing density indicator and the building density indicator in Index 1, and the commercial density indicator and the public facilities density indicator in Index 3. According to this, in the specific case of La Mariscal, the commercial density indicator and the building density indicator play a very important role. This area concentrates both the most popular places to go out in the city and the smaller plots of the area with townhouses. Moreover, the public facilities density indicator shows evidence of multiple services within the area. Index 2 relies on the POI density index indicator, the floor area ratio indicator, and the building density indicator, which may be interpreted as a balanced combination of the other two indexes. The POI density index indicator presents a correspondence between the block area and the number of POI within it, meaning that if there is only one POI occupying the whole block, such as the case of hospitals and schools, the POI density index indicator will be very low. Final density dimension maps show slight differences between the three indexes. Index 1 and Index 3 have middle-low density values homogeneously distributed across the neighborhood. In contrast, in Index 2, the density is concentrated in the areas close to the neighborhood’s core, the Plaza Foch, and in the Colon and Amazonas Avenues, where many high-rise buildings with offices are located (Figure 4).
3.2. Land Use Mixture
The land use mixture dimension measures the area’s diversity of activities. In Index 1 and Index 3, indicators are the building use mix and the residential–non-residential balance. Both approaches connect the proportion of uses with residential use. Moreover, in Index 3, there is an addition of two indicators: the commercial and facility mix and the basic–non-basic commercial and facility balance. In Index 2, the entropy indicator is equivalent to the building use mix indicator. On this subject, differences between the two maps are explained because of the integration of additional categories more connected to the specific vitality of La Mariscal neighborhood in the entropy calculation, such as restaurants and bars/discotheques. Final land use dimension maps illustrate that the areas with the highest level of land use mixture, common in Index 1 and Index 2, are close to the intersection of the 6 de Diciembre and Colón Avenues, where different residences, offices, the pediatric hospital Baca Ortiz, the UDLA university, and the San Francisco de Sales and Andino schools are located, and close to the intersection of the Tamayo and Vintimilla streets, where a remarkable number of restaurants close to the Pontificia Universidad Católica del Ecuador are placed. Additionally, Index 2 also shows a higher proportion of land use mixture close to the intersection of the Amazonas and Colón Avenues (Figure 4).
3.3. Contact Opportunity
In accordance with Jane Jacobs postulate that smaller blocks provide a higher possibility of interaction, the block size indicator in Index 1, the Richardson Compactness Index (RCI) indicator in Index 2, and the distance to intersections and the betweenness indicators in Index 3 are the ones that better relate these two crucial factors. In Index 3, the street width indicator illustrates the benefit of having narrower streets to obtain more interaction. The distance to squares and pocket parks and the presence of benches, indicators of Index 3, help to understand where people could be sitting and, consequently, how this may impact the number of people congregating. In La Mariscal, there is a low presence of pocket parks and benches. Additionally, it is essential to emphasize the importance of the inversely proportional relationship in some indicators of this dimension. In Index 1, the bigger the blocks, the stronger the confrontation with contact opportunity, whereas in Index 3, this is represented by the distance to intersections, the distance to squares and pocket parks, and the distance to public Wi-Fi spots. The longer the distance, the smaller the possibility of contact. Unlike what happens in the other five dimensions, final maps present evidence of different results. In Index 1, there is a homogeneous distribution of contact opportunity. In Index 2, the higher levels are located in most of the regular and grideal areas of the neighborhood, and in Index 3, contact opportunities are placed in the central areas, where the distance to intersections is smaller and the highest levels of betweenness are mainly concentrated (Figure 4).
3.4. Aged Buildings
The aged buildings dimension relates to the idea that old constructions connected to the original city garden villas of the neighborhood present bigger areas than the contemporary buildings and, therefore, can be easily adapted to public facilities or amenities, increasing urban vitality. For instance, the Benjamín Carrión cultural center, the Manuela Cañizares School, the French embassy, the Symphonic National Orchestra of Ecuador, and several hotel boutiques occupy heritage buildings. The aged buildings indicator has been applied in Index 1 and Index 3. It illustrates the presence of patrimonial buildings older than approximately 60 years. These constructions are practically homogenously distributed across the area delimited by the Patria, 12 de Octubre, Colón, and 10 de Agosto Avenues, contributing to the expansion of different land uses (Figure 4).
3.5. Accessibility
The accessibility dimension aims to represent the quantity and location of public transport present in the area, as well as particular accessibility parameters. In Index 1 and Index 2, only one indicator absorbs the whole dimension weight, distance to public transportation, and rail transit convenience index (RTI), respectively. In both scenarios, the distance to the nearest Metrovía or Ecovía stops, a kind of tram that possesses its own lane, and traditional bus stops are considered the main factors. In Index 3, four more indicators were added: street slope, street lighting, the presence of maximum vehicular speed areas of 30 km/h, and the distance to pedestrian crossings. Street slope reduces accessibility and coincides with some areas where public transport stops are completely absent. The presence of 30 km/h areas is very limited in the study area, and the distance to pedestrian crossings is comparable with the distance to intersections, an indicator of the contact opportunity dimension. The street lighting indicator shows that there is a presence of lighting, but it is non-homogenous and distributed across the area. Even though the first impression from observing the final maps of the three indexes is that there are numerous differences, a closer interpretation reveals a critical number of similarities. The highest value of accessibility is mainly located in the broader streets of the neighborhood, where public transport stops are concentrated: the four perimetral avenues, Patria, 12 de Octubre, Francisco de Orellana, and 10 de Agosto, and three internal avenues, 6 de Diciembre, Colón, and Amazonas. Additionally, two internal streets, Juan León Mera and 9 de Octubre, also concentrate a significant number of bus stops in the south-north direction. It is also important to emphasize that the northeast corner, the central zone, and the Tamayo and Leonidas Plaza streets, mostly in navy- and sky-blue tones, are the ones without any direct connection to public transport (Figure 4).
3.6. Border Vacuums
The border vacuum dimension aims to illustrate the presence and position of these big areas characterized by massive single uses. It only concerns one indicator from Index 1 and Index 3. In this case, it is worth mentioning that there is no border vacuum inside the study area, but in its perimeter. The Militar School Eloy Alfaro on the north side; the US ambassador’s residence and the Pontificia Universidad Católica del Ecuador on the east side; and the Casa de la Cultura on the south side are considered border vacuums because of their gated reality. El Ejido Park, a green public space of 14.21 ha, is situated in the south part of the neighborhood and concentrates multiple activities such as outdoor dancing, biking, picnicking, and games for children. It can be crossed without problem by pedestrians. This possibility of walking through the park and connecting different surrounding areas is the reason why it was not included as a border vacuum in calculating the dimension of Index 3. Final border vacuum maps concentrate the higher levels in areas close to the north, east, and south perimeters (Figure 4).
3.7. Final Maps of Urban Vitality
The areas with a very high intensity of urban vitality are mainly located in the neighborhood core and two of the main internal streets, Colón and Amazonas Avenues (Figure 4). On the one hand, the concentration of the highest values in the central neighborhood core in Index 1 and Index 3 may respond to the presence of aged buildings in this area, as well as the building density indicator and commercial density indicator in Index 3. Additionally, the presence of the smallest blocks, represented by the block size indicator of Index 1, the Richardson Compactness Index (RCI) of Index 2, and the distance to intersections of Index 3, also contribute to promoting contact opportunities in this area. On the other hand, the lowest score on the upper right corner in Index 3 may respond to the influence of four indicators: distance to squares and pocket parks (no parks in this area), street lighting (insufficient), street slope (steepest slop in this area), and block size (biggest blocks in this area).
As a final step of the analysis, the final map of each index located in the last row of Figure 4 is synthesized for comparison using the five different ranges of urban vitality: very high, high, moderate, low, and very low (Table 3). Index 1 presents 39% of the area of study with ranges between very high and high, whereas Index 2 increases this area to 68%, and Index 3 reduces the area to 32%. Regarding ranges of urban vitality between very low and low, Index 1 shows 23% of the area of study, while Index 2 decreases to 4% of the area, and Index 3 increases to 41% of the area. In this sense, it is essential to highlight the possible influence of having the border vacuum dimension in the two indexes where the low and very low levels are more evident. Regarding the moderate range, the fluctuations are not as representative as mentioned before. Index 1 presents this score as 36% of the area, whereas Index 2 decreases to almost 27% of the area, and Index 3 illustrates 26% of the area. Finally, the sum of the first three ranges, very high, high, and moderate, generates a remarkable score of urban vitality within 76% of the area of study in Index 1, 95% of the area in Index 2, and 58% of the area in Index 3.
Table 3.
Comparison of levels of urban vitality for the three final maps of Figure 4.
4. Discussion
The study’s results contribute to discussing the two research questions: Which criteria can guide the selection of dimensions and indicators for measuring urban vitality? Which representation system is more precise for measuring urban vitality at a block scale? Moreover, considerations regarding the methodology of the article are presented.
Regarding morphological dimensions, one criterion is essential to define which are the most relevant in each particular study area in order to reshape Jacobs’s approach: context. To this extent, the density dimension highlights notable differences depending on the study area. In several contemporary Chinese neighborhoods, it is associated with high-rise buildings [28,29,65], while in European areas conceived as city extensions in the second half of the 19th century, such as the Eixample of Barcelona, it refers to urban compacity, represented by approximately eight-story buildings inserted into compact blocks [15]. Furthermore, Chinese cities such as Shenzhen, Nanjing, and Chengdu present an indissoluble connection with the land use mixture dimension [26,34,66]. Moreover, in Turkey, more particularly in Kayseri, special attention is put on the creation of a need for small buildings’ dimension [39]. In addition, the contact opportunity and aged building dimensions are notably remarkable in cities where historical layouts are predominant [15,17]. Likewise, even though the accessibility dimension was secondary for Jane Jacobs’s approach in the 1960s [4], it is crucial for urban vitality calculations in the present, not only because of the importance of public transport stations but also for the relevance of integrating vulnerable collectives such as children, the elderly, or people with disabilities in the composition of urban areas [67,68,69]. Furthermore, the border vacuum dimension needs to be extremely precisely defined, for instance, with the inclusion or exclusion of big parks depending on their role in the study area. This difficulty in defining the specific characteristics of border vacuums is probably the reason why they are not included in several indexes of urban vitality [1,2,3]. In the specific case of La Mariscal, the land use mixture, contact opportunity, and accessibility dimensions play a very significant role. The first one is a consequence of the remarkable number of restaurants, bars, discotheques, political institutions such as international embassies and consulates, and public and private schools and universities located in the area. The second one is due to the historical heterogeneity of the neighborhood’s layout. The third one is because of the significant number of residents who use public transport to move inside Quito—more than 70% of the total [70,71].
Regarding the indicators’ selection for each dimension, two main criteria are recommended: context and scale. Regarding the first, the inclusion of three new context-related indicators in the case of the Andean region is essential to reinforce the connection to the study area, which would substantially improve the urban vitality measurement. First, an informal small-scale commerce indicator very common and a determinant of urban vitality. Second, a quality of sidewalks indicator, meaning having no barriers to generate continuous walking with a wheelchair or similar, as a result of the insufficient level of quality of a significant part of the streets in the region [47,72]. Third, a good-conditioned street furniture indicator, including banks and big trees to protect from the high UV factor in the countries close to the Ecuadorean line, either in parks or streets. Besides adding new indicators, a deep understanding of the context would facilitate reconsidering the street width indicator, which illustrates a controversial topic connected to the culture of the place. For instance, in Mediterranean cities, there is a context-based concern that relates pedestrian streets (usually narrow) with walkability and, consequently, urban vitality [3,47]. On the contrary, in the Andean context, people tend to concentrate more on wide streets where public transport stations are located due to the unusual presence of pedestrian streets [73]. Additionally, a deep understanding of the context would simplify the inclusion of general morphological indicators belonging to the most remarkable identified dimensions. In the particular case of La Mariscal, either the building use mix, residential-non-residential balance, commercial and facility mix, or basic-non-basic commercial and facility balance indicators should be included in the land use mixture dimension. In the contact opportunity dimension, either the block size or the distance to intersections indicators should be incorporated, as well as the distance to squares and pocket parks indicator. In the accessibility dimension, the distance to public transportation and the street slope indicators should be part of any index. Regarding the second, adding new building scale morphological indicators such as façade length and door encounter rate [40] and building entrance density [35] would reinforce the block characterization’s relevance in relation to what happens on the ground floor, gaining accuracy, which highly determines urban vitality worldwide, including the Andean context.
Regarding the question of the most precise system for representing urban vitality at a block scale, where the dimension of streets is recognizable, this is a subject that has not been widely discussed among urban researchers. On one hand, the use of raster calculations in this context reveals a lack of correlation with urban morphology, particularly at the street layout level [15,16,20,52]. However, the use of a small-scale unit of measurement, such as a 50 × 50-m raster cell, shows promise in identifying hot and cold spots [17]. On the other hand, the use of a block (polygon) representation clearly connects the specific urban layout to urban vitality, albeit at the expense of excluding some street and plot characterization [18,33]. In light of these findings, it is noteworthy to consider a combined approach that leverages both rastering and polygonal results to comprehensively understand urban dynamics at a block scale, for instance, by descending to the plot analysis. Such criteria would allow for a more nuanced understanding of the relationship between urban morphology and vitality and enable the identification of specific urban features and patterns that drive urban vitality at the street level.
Ultimately, two relevant methodological considerations need to be highlighted. First, the partiality of including only morphological parameters in the interpretation of urban vitality. In this sense, several studies follow this tendency, relegating social, economic, and environmental issues to second place [15,16,17]. Nevertheless, these non-morphological factors are also fundamental in any evaluation of urban vitality [74,75]. For instance, in La Mariscal neighborhood, poverty, non-legal immigration, and delinquency are structural components of the residents’ and visitors’ reality [76,77]. However, the impossibility of acquiring this information segregated into the units of study, either a 50 × 50-m raster cell or block, has not allowed the integration of this approach. Second, the lack of inclusion of the time dimension in urban vitality studies. On this subject, although the application of morphologic indexes offers a rich array of dimensions and corresponding indicators [15,16,17], time-based indexes of urban vitality would also promote the assimilation of the variability concept, which refers to a dynamic attribute regarding the flexible quantity of people present in the same area at different times of the day or the week [41,78,79].
5. Conclusions
Our study has contributed to the literature gaps by (i) developing a comparative approach with the application of different indexes in a single case study, La Mariscal neighborhood, Quito, Ecuador, and (ii) assessing the representation of urban vitality at a block scale in the Andean region. The first objective shows the importance of considering (i) context-based previous knowledge for identifying dimensions and (ii) context-based previous knowledge and scale of analysis for identifying indicators. Regarding dimensions, land use mixture, contact opportunity, and accessibility have been identified as essential in the study area. Regarding indicators, context-based indicators such as informal small-scale commerce, quality of sidewalks, and well-conditioned street furniture, as well as general indicators conforming to the most remarkable identified dimensions, should be included. Additionally, building scale indicators such as façade length and door encounter rate, and building entrance density are highly encouraged to be part of any urban vitality index in the Andean region. The second objective illustrates that the use of a hybrid representation system, which combines the raster and the polygon and descends to the plot scale, would improve the ability to measure and analyze vitality in cities. This would greatly support evidence-based decision-making in urban planning and design, promoting more vital and sustainable places to live.
5.1. Limitations of the Present Article
Regarding data collection limitations, official open data sources are almost nonexistent in Ecuador. In the specific case of Quito, official data present access problems and certain incoherence due to the update limitations of the local government agencies. On this subject, there is no official information regarding the building use mix indicator or the residential non-residential balance indicator. The data used to calculate these indicators was manually collected in the field in 2022, and due to the COVID-19 pandemic, it was delayed for more than six months compared to the initial timeline. Furthermore, the last national census was developed in 2010, generating some possible inconsistencies concerning the permanent population of the study area.
5.2. Future Lines of Research
Based on the discussion, future studies concerning indexes of urban vitality measurement in the Andean region should include socio-economic factors and time-sensitive indicators. First, the morphological approach used for this study could be enriched with complementary data on people’s activities (e.g., mobile phone big data on people’s daily mobility) and sociodemographic data. Second, the land use dimension influence on urban vitality changes during daytime or nighttime hours (e.g., discotheques at night) and on weekday or weekend days (e.g., schools). Finally, the inclusion of time in studying urban vitality may also lead to a significant relationship between the presence of people and street security.
Supplementary Materials
The following supporting information can be downloaded at: https://www.mdpi.com/article/10.3390/su15118597/s1. Detailed indicators’ description and maps are provided.
Author Contributions
Conceptualization, N.V.D., G.H.-B. and M.B.A.; methodology, N.V.D., G.H.-B. and M.B.A.; software, N.V.D.; validation, N.V.D., G.H.-B. and M.B.A.; formal analysis, N.V.D., G.H.-B. and M.B.A.; investigation, N.V.D., resources, N.V.D.; data curation, N.V.D.; writing—original draft preparation, N.V.D.; writing—review and editing, N.V.D., G.H.-B. and M.B.A.; visualization, N.V.D.; supervision, G.H.-B. and M.B.A.; project administration, N.V.D. and G.H.-B.; funding acquisition, N.V.D. and G.H.-B. All authors have read and agreed to the published version of the manuscript.
Funding
This research received internal funding of the P02_2122 fromUniversidad Internacional SEK, Ecuador.
Institutional Review Board Statement
Not applicable.
Informed Consent Statement
Not applicable.
Data Availability Statement
The data presented in this study are available in the Supplementary Materials.
Acknowledgments
We are extremely grateful to David Velasco Vásquez for his effort and technical skills in GIS, which greatly improved the level of the manuscript, and to Cristina Bayas, for her research work in the first steps of the article. We would also like to thank the UISEK and, more specifically, Juan Carlos Navarro for his support during the process.
Conflicts of Interest
The authors declare no conflict of interest.
References
- Siclari, P. Implementation of the New Urban Agenda (NUA) in Latin America and The Caribbean: 2018–2022. 2022. Available online: https://www.google.com.hk/url?sa=t&rct=j&q=&esrc=s&source=web&cd=&cad=rja&uact=8&ved=2ahUKEwjIhIis2f3-AhVR62EKHfUpBdwQFnoECA4QAQ&url=https%3A%2F%2Fwww.urbanagendaplatform.org%2Fsites%2Fdefault%2Ffiles%2F2022-03%2FNUA_LAC%2520Region.pdf&usg=AOvVaw1VU-JlpsRT4adh0EA4OqTO (accessed on 12 December 2022).
- The Sustainable Development Goals Report. 2022. Available online: http://desapublications.un.org/publications/sustainable-development-goals-report-2022 (accessed on 12 December 2022).
- Allam, Z.; Nieuwenhuijsen, M.; Chabaud, D.; Moreno, C. The 15-Minute City Offers a New Framework for Sustainability, Liveability, and Health. Lancet Planet. Health 2022, 6, e181–e183. [Google Scholar] [CrossRef] [PubMed]
- Jacobs, J. The Death and Life of Great American Cities; Random House: New York, NY, USA, 1961; ISBN 978-0-394-42159-9. [Google Scholar]
- Weicher, J.C. A Test of Jane Jacobs’ Theory of Successful Neighborhoods. J. Reg. Sci. 1973, 13, 29–40. [Google Scholar] [CrossRef]
- Schmidt, C.G. Influence of Land Use Diversity upon Neighborhood Success: An Analysis of Jacobs’ Theory. Ann. Reg. Sci. 1977, 11, 53–65. [Google Scholar] [CrossRef]
- Sung, H.; Lee, S.; Cheon, S. Operationalizing Jane Jacobs’s Urban Design Theory: Empirical Verification from the Great City of Seoul, Korea. J. Plan. Educ. Res. 2015, 35, 117–130. [Google Scholar] [CrossRef]
- Lee, J.; Kurisu, K.; An, K.; Hanaki, K. Development of the Compact City Index and Its Application to Japanese Cities. Urban Stud. 2015, 52, 1054–1070. [Google Scholar] [CrossRef]
- King, K. Jane Jacobs and ‘the Need for Aged Buildings’: Neighbourhood Historical Development Pace and Community Social Relations. Urban Stud. 2013, 50, 2407–2424. [Google Scholar] [CrossRef]
- Guan, C.; Rowe, P.G. The Concept of Urban Intensity and China’s Townization Policy: Cases from Zhejiang Province. Cities 2016, 55, 22–41. [Google Scholar] [CrossRef]
- Frank, L.D.; Sallis, J.F.; Saelens, B.E.; Leary, L.; Cain, K.; Conway, T.L.; Hess, P.M. The Development of a Walkability Index: Application to the Neighborhood Quality of Life Study. Br. J. Sport. Med. 2010, 44, 924–933. [Google Scholar] [CrossRef]
- Cho, S.E.; Kim, S. Measuring Urban Diversity of Songjiang New Town: A Re-Configuration of a Chinese Suburb. Habitat Int. 2017, 66, 32–41. [Google Scholar] [CrossRef]
- Kang, C.; Fan, D.; Jiao, H. Validating Activity, Time, and Space Diversity as Essential Components of Urban Vitality. Environ. Plan. B Urban Anal. City Sci. 2021, 48, 1180–1197. [Google Scholar] [CrossRef]
- Sevtsuk, A.; Kalvo, R.; Ekmekci, O. Pedestrian Accessibility in Grid Layouts: The Role of Block, Plot and Street Dimensions. Urban Morphol. 2016, 20, 89–106. [Google Scholar] [CrossRef]
- Delclòs-Alió, X.; Miralles-Guasch, C. Looking at Barcelona through Jane Jacobs’s Eyes: Mapping the Basic Conditions for Urban Vitality in a Mediterranean Conurbation. Land Use Policy 2018, 75, 505–517. [Google Scholar] [CrossRef]
- Fuentes, L.; Miralles-Guasch, C.; Truffello, R.; Delclòs-Alió, X.; Flores, M.; Rodríguez, S. Santiago de Chile through the Eyes of Jane Jacobs. Analysis of the Conditions for Urban Vitality in a Latin American Metropolis. Land 2020, 9, 498. [Google Scholar] [CrossRef]
- Gómez-Varo, I.; Delclòs-Alió, X.; Miralles-Guasch, C. Jane Jacobs Reloaded: A Contemporary Operationalization of Urban Vitality in a District in Barcelona. Cities 2022, 123, 103565. [Google Scholar] [CrossRef]
- Wang, S.; Deng, Q.; Jin, S.; Wang, G. Re-Examining Urban Vitality through Jane Jacobs’ Criteria Using GIS-SDNA: The Case of Qingdao, China. Buildings 2022, 12, 1586. [Google Scholar] [CrossRef]
- Tang, L.; Lin, Y.; Li, S.; Li, S.; Li, J.; Ren, F.; Wu, C. Exploring the Influence of Urban Form on Urban Vibrancy in Shenzhen Based on Mobile Phone Data. Sustainability 2018, 10, 4565. [Google Scholar] [CrossRef]
- Chen, W.; Wu, A.N.; Biljecki, F. Classification of Urban Morphology with Deep Learning: Application on Urban Vitality. Comput. Environ. Urban Syst. 2021, 90, 101706. [Google Scholar] [CrossRef]
- Wu, J.; Ta, N.; Song, Y.; Lin, J.; Chai, Y. Urban Form Breeds Neighborhood Vibrancy: A Case Study Using a GPS-Based Activity Survey in Suburban Beijing. Cities 2018, 74, 100–108. [Google Scholar] [CrossRef]
- Liu, D.; Shi, Y. The Influence Mechanism of Urban Spatial Structure on Urban Vitality Based on Geographic Big Data: A Case Study in Downtown Shanghai. Buildings 2022, 12, 569. [Google Scholar] [CrossRef]
- Zhang, Y.; Yang, L.; Wang, X. Analysis and Calculating of Comprehensive Urban Vitality Index by Multi-Source Temporal-Spatial Big Data and EW-TOPSIS; IEEE: Piscataway, NJ, USA, 2021; pp. 196–201. [Google Scholar]
- Wang, X.; Zhang, Y.; Yu, D.; Qi, J.; Li, S. Investigating the Spatiotemporal Pattern of Urban Vibrancy and Its Determinants: Spatial Big Data Analyses in Beijing, China. Land Use Policy 2022, 119, 106162. [Google Scholar] [CrossRef]
- Shi, J.; Miao, W.; Si, H. Visualization and Analysis of Mapping Knowledge Domain of Urban Vitality Research. Sustainability 2019, 11, 988. [Google Scholar] [CrossRef]
- Yue, Y.; Zhuang, Y.; Yeh, A.G.O.; Xie, J.-Y.; Ma, C.-L.; Li, Q.-Q. Measurements of POI-Based Mixed Use and Their Relationships with Neighbourhood Vibrancy. Int. J. Geogr. Inf. Sci. 2017, 31, 658–675. [Google Scholar] [CrossRef]
- Zhang, A.; Li, W.; Wu, J.; Lin, J.; Chu, J.; Xia, C. How Can the Urban Landscape Affect Urban Vitality at the Street Block Level? A Case Study of 15 Metropolises in China. Environ. Plan. B Urban Anal. City Sci. 2021, 48, 1245–1262. [Google Scholar] [CrossRef]
- Chen, L.; Zhao, L.; Xiao, Y.; Lu, Y. Investigating the Spatiotemporal Pattern between the Built Environment and Urban Vibrancy Using Big Data in Shenzhen, China. Comput. Environ. Urban Syst. 2022, 95, 101827. [Google Scholar] [CrossRef]
- Huang, J.; Cui, Y.; Li, L.; Guo, M.; Ho, H.C.; Lu, Y.; Webster, C. Re-Examining Jane Jacobs’ Doctrine Using New Urban Data in Hong Kong. Environ. Plan. B Urban Anal. City Sci. 2022, 23998083221106184. [Google Scholar] [CrossRef]
- Wu, W.; Niu, X. Influence of Built Environment on Urban Vitality: Case Study of Shanghai Using Mobile Phone Location Data. J. Urban Plan. Dev. 2019, 145, 04019007. [Google Scholar] [CrossRef]
- Shen, Y.; Karimi, K.; Law, S.; Zhong, C. Physical Co-Presence Intensity: Measuring Dynamic Face-to-Face Interaction Potential in Public Space Using Social Media Check-in Records. PLoS ONE 2019, 14, e0212004. [Google Scholar] [CrossRef]
- Zeng, P.; Sun, Z.; Gao, Z. Study on the Classification Method of Urban Vitality Spatial Pattern Based on Full-Time Vitality Spectrum: A Case Study of Tianjin, China; CORP–Competence Center of Urban and Regional Planning: Vienna, Austria, 2020; pp. 1181–1186. [Google Scholar]
- Lu, S.; Huang, Y.; Shi, C.; Yang, X. Exploring the Associations between Urban Form and Neighborhood Vibrancy: A Case Study of Chengdu, China. ISPRS Int. J. Geo-Inf. 2019, 8, 165. [Google Scholar] [CrossRef]
- Li, Q.; Cui, C.; Liu, F.; Wu, Q.; Run, Y.; Han, Z. Multidimensional Urban Vitality on Streets: Spatial Patterns and Influence Factor Identification Using Multisource Urban Data. ISPRS Int. J. Geo-Inf. 2021, 11, 2. [Google Scholar] [CrossRef]
- Kim, S. Urban Vitality, Urban Form, and Land Use: Their Relations within a Geographical Boundary for Walkers. Sustainability 2020, 12, 10633. [Google Scholar] [CrossRef]
- Sung, H.-G.; Go, D.-H.; Choi, C.G. Evidence of Jacobs’s Street Life in the Great Seoul City: Identifying the Association of Physical Environment with Walking Activity on Streets. Cities 2013, 35, 164–173. [Google Scholar] [CrossRef]
- Sung, H.; Lee, S. Residential Built Environment and Walking Activity: Empirical Evidence of Jane Jacobs’ Urban Vitality. Transp. Res. Part D Transp. Environ. 2015, 41, 318–329. [Google Scholar] [CrossRef]
- Yue, W.; Chen, Y.; Thy, P.T.M.; Fan, P.; Liu, Y.; Zhang, W. Identifying Urban Vitality in Metropolitan Areas of Developing Countries from a Comparative Perspective: Ho Chi Minh City versus Shanghai. Sustain. Cities Soc. 2021, 65, 102609. [Google Scholar] [CrossRef]
- Ziya Paköz, M.; Yaratgan, D.; Şahin, A. Re-Mapping Urban Vitality through Jane Jacobs’ Criteria: The Case of Kayseri, Turkey. Land Use Policy 2022, 114, 105985. [Google Scholar] [CrossRef]
- Palaiologou, G.; Vaughan, L. The Sociability of the Street Interface–Revisiting West Village, Manhattan; FEUP: Porto, Portugal, 2014; Volume 21, pp. 88–102. [Google Scholar]
- Sulis, P.; Manley, E.; Zhong, C.; Batty, M. Using Mobility Data as Proxy for Measuring Urban Vitality. J. Spat. Inf. Sci. 2018, 16, 137–162. [Google Scholar] [CrossRef]
- Zeng, W.; Ye, Y. VitalVizor: A Visual Analytics System for Studying Urban Vitality. IEEE Comput. Graph. Appl. 2018, 38, 38–53. [Google Scholar] [CrossRef]
- De Nadai, M.; Staiano, J.; Larcher, R.; Sebe, N.; Quercia, D.; Lepri, B. The Death and Life of Great Italian Cities: A Mobile Phone Data Perspective. In Proceedings of the WWW’16: 25th International World Wide Web Conference, Montréal, QC, Canada, 11–15 April 2016; pp. 413–423. [Google Scholar]
- Šćepanović, S.; Joglekar, S.; Law, S.; Quercia, D. Jane Jacobs in the Sky: Predicting Urban Vitality with Open Satellite Data. Proc. ACM Hum.-Comput. Interact. 2021, 5, 1–25. [Google Scholar] [CrossRef]
- Beltrán Rodríguez, M. La Importancia de La Vitalidad Urbana. Ciudades 2017, 217–235. [Google Scholar] [CrossRef]
- Zhang, X.; Sun, Y.; Chan, T.O.; Huang, Y.; Zheng, A.; Liu, Z. Exploring Impact of Surrounding Service Facilities on Urban Vibrancy Using Tencent Location-Aware Data: A Case of Guangzhou. Sustainability 2021, 13, 444. [Google Scholar] [CrossRef]
- Bartzokas-Tsiompras, A.; Tampouraki, E.M.; Photis, Y.N. Is Walkability Equally Distributed among Downtowners? Evaluating the Pedestrian Streetscapes of Eight European Capitals Using a Micro-Scale Audit Approach. City Sustain. Regen. 2020, 4, 75–92. [Google Scholar] [CrossRef]
- Zumelzu, A.; Barría, T.; Barrientos-Trinanes, M. Efectos de La Forma Urbana Sobre La Accesibilidad Peatonal En Barrios Del Sur de Chile. Arquiteturarevista 2020, 16, 1–22. [Google Scholar] [CrossRef]
- de Ecología, A.; de Barcelona, U. (Eds.) Certificación del Urbanismo Ecológico; Ministerio de Fomento: Madrid, Spain, 2012; ISBN 978-84-498-0914-9. [Google Scholar]
- Huang, C.; Gong, P.; Ding, R.; Qu, S.; Yang, X. Comprehensive Analysis of the Vitality of Urban Central Activities Zone Based on Multi-Source Data-Case Studies of Lujiazui and Other Sub-Districts in Shanghai CAZ; Association for Computer-Aided Architectural Design Research in Asia (CAADRIA): Hong Kong, China, 2021. [Google Scholar] [CrossRef]
- Bergroth, C.; Järv, O.; Tenkanen, H.; Manninen, M.; Toivonen, T. A 24-Hour Population Distribution Dataset Based on Mobile Phone Data from Helsinki Metropolitan Area, Finland. Sci. Data 2022, 9, 1–19. [Google Scholar] [CrossRef] [PubMed]
- Jia, C.; Du, Y.; Wang, S.; Bai, T.; Fei, T. Measuring the Vibrancy of Urban Neighborhoods Using Mobile Phone Data with an Improved PageRank Algorithm. Trans. GIS 2019, 23, 241–258. [Google Scholar] [CrossRef]
- Zeng, C.; Song, Y.; He, Q.; Shen, F. Spatially Explicit Assessment on Urban Vitality: Case Studies in Chicago and Wuhan. Sustain. Cities Soc. 2018, 40, 296–306. [Google Scholar] [CrossRef]
- Lu, S.; Shi, C.; Yang, X. Impacts of Built Environment on Urban Vitality: Regression Analyses of Beijing and Chengdu, China. Int. J. Environ. Res. Public Health 2019, 16, 4592. [Google Scholar] [CrossRef]
- Fang, C.; He, S.; Wang, L. Spatial Characterization of Urban Vitality and the Association with Various Street Network Metrics from the Multi-Scalar Perspective. Front. Public Health 2021, 9, 677910. [Google Scholar] [CrossRef]
- Instituto Metropolitano de Patrimonio del Distrito Metropolitano de Quito Plan Parcial Para el Desarrollo Integral del Centro Histórico de Quito. Propuesta Estratégica. 2019. Available online: https://www7.quito.gob.ec/mdmq_ordenanzas/Comisiones%20del%20Concejo/Uso%20de%20Suelo/2019/2019-03-01%20Extraordinaria/Informaci%C3%B3n%20IMP/Plan%20Parcial%20Centro%20Hist%C3%B3rico/3.%20PROPUESTA%20ESTRAT%C3%89GICA%20-%20PLAN%20PARCIAL%20PARA%20EL%20DESARROLLO%20INTEGRAL%20DEL%20CHQ.pdf (accessed on 19 April 2023).
- Descargas. LlactaLAB—Universidad de Cuenca. Available online: https://llactalab.ucuenca.edu.ec/investigacion/toolbox-densificacion-urbana-sustentable/descargas/ (accessed on 17 February 2023).
- Ponce Alvarado, A. La Mariscal. Historia de un Barrio Moderno en Quito en el Siglo XX; Instituto Metropolitano de Patrimonio: Quito, Ecuador, 2012; ISBN 978-9978-366-73-8. [Google Scholar]
- Home—Instituto Nacional de Estadística y Censos. Available online: https://www.ecuadorencifras.gob.ec/institucional/home/ (accessed on 15 December 2022).
- Cantrell, M.A. Pediatric Nursing. 2011. p. 188+. Available online: https://link.gale.com/apps/doc/A265869622/AONE?u=googlescholar&sid=bookmark-AONE&xid=fdeab004 (accessed on 19 April 2023).
- Mestanza-Ramón, C.; Lara-Váscones, R.; Mora-Silva, D.; Milanes, C.B.; Saeteros-Hernández, A.; Sánchez-Capa, M.; Cunalata-Garcia, A. Charapa Turtles (Podocnemis Unifilis), an Opportunity to Improve Community Tourism and Contribute to Their Conservation in Yasuní National Park, Ecuador. Sustainability 2022, 14, 7548. [Google Scholar] [CrossRef]
- Wirth, M.A. Shape Analysis and Measurement. Image Process. Group 2004, 1–49. Available online: http://www.cyto.purdue.edu/cdroms/micro2/content/education/wirth10.pdf (accessed on 19 April 2023).
- Sevtsuk, A.; Mekonnen, M. Urban Network Analysis: A New Toolbox for ArcGIS. Rev. Int. De Géomatique 2012, 22, 287–305. [Google Scholar] [CrossRef]
- Calculate Z-Score—ArcGIS Insights | Documentation. Available online: https://doc.arcgis.com/en/insights/latest/analyze/calculate-z-score.htm (accessed on 31 March 2023).
- Ye, Y.; Li, D.; Liu, X. How Block Density and Typology Affect Urban Vitality: An Exploratory Analysis in Shenzhen, China. Urban Geogr. 2017, 39, 1–22. [Google Scholar] [CrossRef]
- Liu, S.; Zhang, L.; Long, Y.; Long, Y.; Xu, M. A New Urban Vitality Analysis and Evaluation Framework Based on Human Activity Modeling Using Multi-Source Big Data. ISPRS Int. J. Geo-Inf. 2020, 9, 617. [Google Scholar] [CrossRef]
- Bozdag, A.; Gumus, M.G.; Gumus, K.; Durduran, S. Accessibility Analysis for the Elderly in an Urban Area from Turkey. Transylv. Rev. Adm. Sci. 2017, 21–37. [Google Scholar] [CrossRef]
- Gargiulo, C.; Zucaro, F.; Gaglione, F. A Set of Variables for Elderly Accessibility in Urban Areas. TeMA-J. Land Use Mobil. Environ. 2018, 53–66. [Google Scholar] [CrossRef]
- Fatima, K.; Moridpour, S.; Saghapour, T. Measuring Neighbourhood Walking Access for Older Adults. Sustainability 2022, 14, 13366. [Google Scholar] [CrossRef]
- Celi Ortega, S.F. Análisis Del Sistema de Transporte Público Privado de La Ciudad de Quito-Ecuador. Espacios 2018, 39, 1. [Google Scholar]
- Paredes, E.; Berbey Álvarez, A. Situación Actual Del Sistema de Transporte En La Ciudad de Quito, Ecuador: Una Propuesta de Mejora. TRIM Tordesillas Rev. Investig. Multidiscip. 2019, 16. [Google Scholar] [CrossRef]
- Shaaban, K. Assessing Sidewalk and Corridor Walkability in Developing Countries. Sustainability 2019, 11, 3865. [Google Scholar] [CrossRef]
- Arellana, J.; Saltarín, M.; Larrañaga, A.M.; Alvarez, V.; Henao, C.A. Urban Walkability Considering Pedestrians’ Perceptions of the Built Environment: A 10-Year Review and a Case Study in a Medium-Sized City in Latin America. Transp. Rev. 2020, 40, 183–203. [Google Scholar] [CrossRef]
- Botta, F.; Gutiérrez-Roig, M. Modelling Urban Vibrancy with Mobile Phone and OpenStreetMap Data. PLoS ONE 2021, 16, e0252015. [Google Scholar] [CrossRef]
- Jia, C.; Liu, Y.; Du, Y.; Huang, J.; Fei, T. Evaluation of Urban Vibrancy and Its Relationship with the Economic Landscape: A Case Study of Beijing. ISPRS Int. J. Geo-Inf. 2021, 10, 72. [Google Scholar] [CrossRef]
- Núñez, P. Samuel Análisis de la relación de migración extranjera y delincuencia. In Caso de Estudio de los Barrios de la Mariscal y la Florida Dentro de la Administración Zonal Norte, Eugenio Espejo, del Distrito Metropolitano de Quito en el Periodo de 2014 a 2015; Pontificia Universidad Católica del Ecuador: Quito, Ecuador, 2018. [Google Scholar]
- Olarte, S. Identifying Patterns of Labour Exclusion by Residential Causes in South America: The Case of Quito. J. Urban Reg. Anal. 2021, 13, 401–415. [Google Scholar] [CrossRef]
- Tang, S.; Ta, N. How the Built Environment Affects the Spatiotemporal Pattern of Urban Vitality: A Comparison among Different Urban Functional Areas. Comput. Urban Sci. 2022, 2, 1–13. [Google Scholar] [CrossRef] [PubMed]
- Wu, C.; Ye, X.; Ren, F.; Du, Q. Check-in Behaviour and Spatio-Temporal Vibrancy: An Exploratory Analysis in Shenzhen, China. Cities 2018, 77, 104–116. [Google Scholar] [CrossRef]
Disclaimer/Publisher’s Note: The statements, opinions and data contained in all publications are solely those of the individual author(s) and contributor(s) and not of MDPI and/or the editor(s). MDPI and/or the editor(s) disclaim responsibility for any injury to people or property resulting from any ideas, methods, instructions or products referred to in the content. |
© 2023 by the authors. Licensee MDPI, Basel, Switzerland. This article is an open access article distributed under the terms and conditions of the Creative Commons Attribution (CC BY) license (https://creativecommons.org/licenses/by/4.0/).