Review

Scope of the Literature on Efforts to Reduce the Carbon Footprint of Seaports

by
Seyed Behbood Issa Zadeh
1,*,
José Santos López Gutiérrez
2,
M. Dolores Esteban
2,
Gonzalo Fernández-Sánchez
3 and
Claudia Lizette Garay-Rondero
4,*
1
Escuela Técnica Superior de Ingenieros de Caminos, Canales y Puertos, Universidad Politécnica de Madrid, 28040 Madrid, Spain
2
Environment, Coast and Ocean Research Laboratory-ECOREL, Universidad Politécnica de Madrid, 28040 Madrid, Spain
3
Civil Engineering Department, Universidad Europea, 28005 Madrid, Spain
4
Institute for the Future of Education, School of Engineering and Sciences, Tecnologico de Monterrey, Ave. Eugenio Garza Sada 2501, Monterrey 64849, Mexico
*
Authors to whom correspondence should be addressed.
Sustainability 2023, 15(11), 8558; https://doi.org/10.3390/su15118558
Submission received: 23 April 2023 / Revised: 13 May 2023 / Accepted: 18 May 2023 / Published: 25 May 2023

Abstract

:
Seaport activities account for 3% of global carbon emissions, and as an important industrialised economic centre, ports engage in numerous industrial and financial activities that could increase their greenhouse gas (GHG) emissions and carbon footprints (CF). The 13th sustainable development goal (SDG) states that these activities must be balanced with environmental considerations. Therefore, as critical marine infrastructure, seaports need CF reduction initiatives. This scoping review covers important ideas and ways to reduce the CF in seaports to simplify future policymaking. These approaches include energy management systems, equipment and infrastructures, and carbon emission policies and laws specific to ports. Relevant literature is classified, evaluated, and discussed. The findings are interpreted and discussed based on the current state of ports around the world, using statistical data to demonstrate that there are sufficient regulations and standards in place, but that more work is needed to replace conventional systems with intelligent ones and fossil fuels with renewable energy. Finally, the scoping review results, and scientific interpretations, thoughts, proposals, and recommendations are presented as references for related studies in the future.

1. Introduction

In 2020, the industrial sector remained the largest emitter of GHGs, accounting for 31% of worldwide GHG emissions. The electric power industry contributed 28% of the worldwide emissions, with coal burning accounting for the great majority. Figure 1, based on the Rhodium Groups report, shows an independent research provider combining economic data in the United States. The information displays that the combined emissions from land use, agriculture, and garbage accounted for 18% of the global total, followed by transportation at 16% (land transport at 12%, maritime transport at 3%, and aviation at 1%) and buildings at 7% [1].
In coastal regions, seaports are among the most essential industrial zones. They consume a tremendous amount of electricity for industrial purposes, the majority of which is derived from fossil fuels that are responsible for 20% of global GHG emissions, contribute to the majority of maritime transport types that are responsible for 2.5% of global GHG emissions, and have numerous buildings for their official and industrial functions that can contribute to produce 1% and 9% of global GHG emissions, respectively, according to Figure 1.
The International Maritime Organisation (IMO) challenged the shipping industry to reduce yearly GHG emissions by 2050 to at least 50% of the 2008 levels. According to the fourth IMO GHG study in which 2008 was set as a baseline, maritime GHG emissions will likely increase by 90–130% by 2050 without significant decarbonisation. To achieve zero emissions, the shipping industry must act promptly and cooperatively and take comprehensive measures from multiple perspectives to counter the adverse effects of global warming [2].
The maritime industry relies greatly on fossil fuels. It emitted around 3% of the global GHG emissions in 2020 or approximately 1.2 gigaton equivalents of carbon dioxide (CO2eq); this value exceeds the emissions of the world’s fifth largest GHG-emitting country [3].
The fact that 70% of ship emissions occur within 400 km of coastlines demonstrates that all of the most polluting cities in the world are located along coasts [4]. Therefore, ports, as intersecting points for marine and other modes of transportation, can play a critical role in mitigating global climate change. Moreover, the carbon dioxide emissions generated by various activities conducted at ports are one of the most significant environmental features of ports that contribute to the problem of climate change.
Hence, shifting the operations and practices at a port toward sustainability is recognised as an essential goal in several SDGs. For example, goal 7 acknowledges that all ports have a high potential for generating power from renewable energies because of their proximity to the wind, direct sunlight, and marine environment; goal 9 focuses on industry, innovation, and infrastructure; goal 11 recognises that ports are now located within cities and are part of smart cities, and goal 13 focuses on the climate change issues [5].
Notably, global societies created specific global standards, such as the Maritime Pollution Regulation (MARPOL) Annexe IV of the IMO (released in 2005 and last revised in 2022) [6], the ‘Carbon Footprinting Guidance for Ports’ issued by the World Ports Climate Initiative (WPCI) in 2008 [7], and the ‘European green deal’ by European Sea Ports Organisation in 2020 [8]. Some of these standards can be considered international community actions to reduce carbon emissions at ports.
Considering the significance of CF reduction metrics in ports, particularly for clarifying standards, guidelines, normativity, key concepts, and best practices, this review study aims to identify and categorise the most recent measures, actions, projects, and guidelines to reduce the carbon footprint (CF) in seaports, which are significant hubs for commerce and transportation. The scope of this work includes preventative measures and decarbonisation of maritime ports.
The key contribution of this research is the categorisation of measures and actions for reducing CF in an acceptable and new manner, allowing policymakers to issue better laws informed by a better understanding of many branches of mitigation choices. However, new classifications can help scientific societies better understand multiple components and focus on each class according to their research areas to provide more accurate scientific outputs. This sorting and classification can help policymakers determine the feasibility of different initiatives and potential responses to reduce GHG emissions.
The rest of this paper is organised as follows: Section 2 describes the research methodology of a five-phase scoping review. Section 3 presents the key concepts, national and international guidelines and best practices concerning the standards, actions, and results toward the objective of reducing the CF. The most relevant findings are discussed in Section 4. Finally, Section 5 presents the conclusions and proposes future work based on the scientific interpretation of the findings and discussions.

2. Materials and Methods

This analysis was conducted as a scoping review of CF mitigation activities in seaports. The research included a study and review of the background and recent literature on this research work’s main issue, developed through preferred reporting items for systematic reviews and meta-analyses in scoping review (PRISMA-ScR). PRISMA-ScR intends to help readers gain a greater understanding of the relevant terminology, core concepts, and critical items to report for scoping reviews. These phases and procedures include ‘Identification’, ‘Screening’, and ‘Eligibility’, as shown in Figure 2. These phases involved the following tasks:
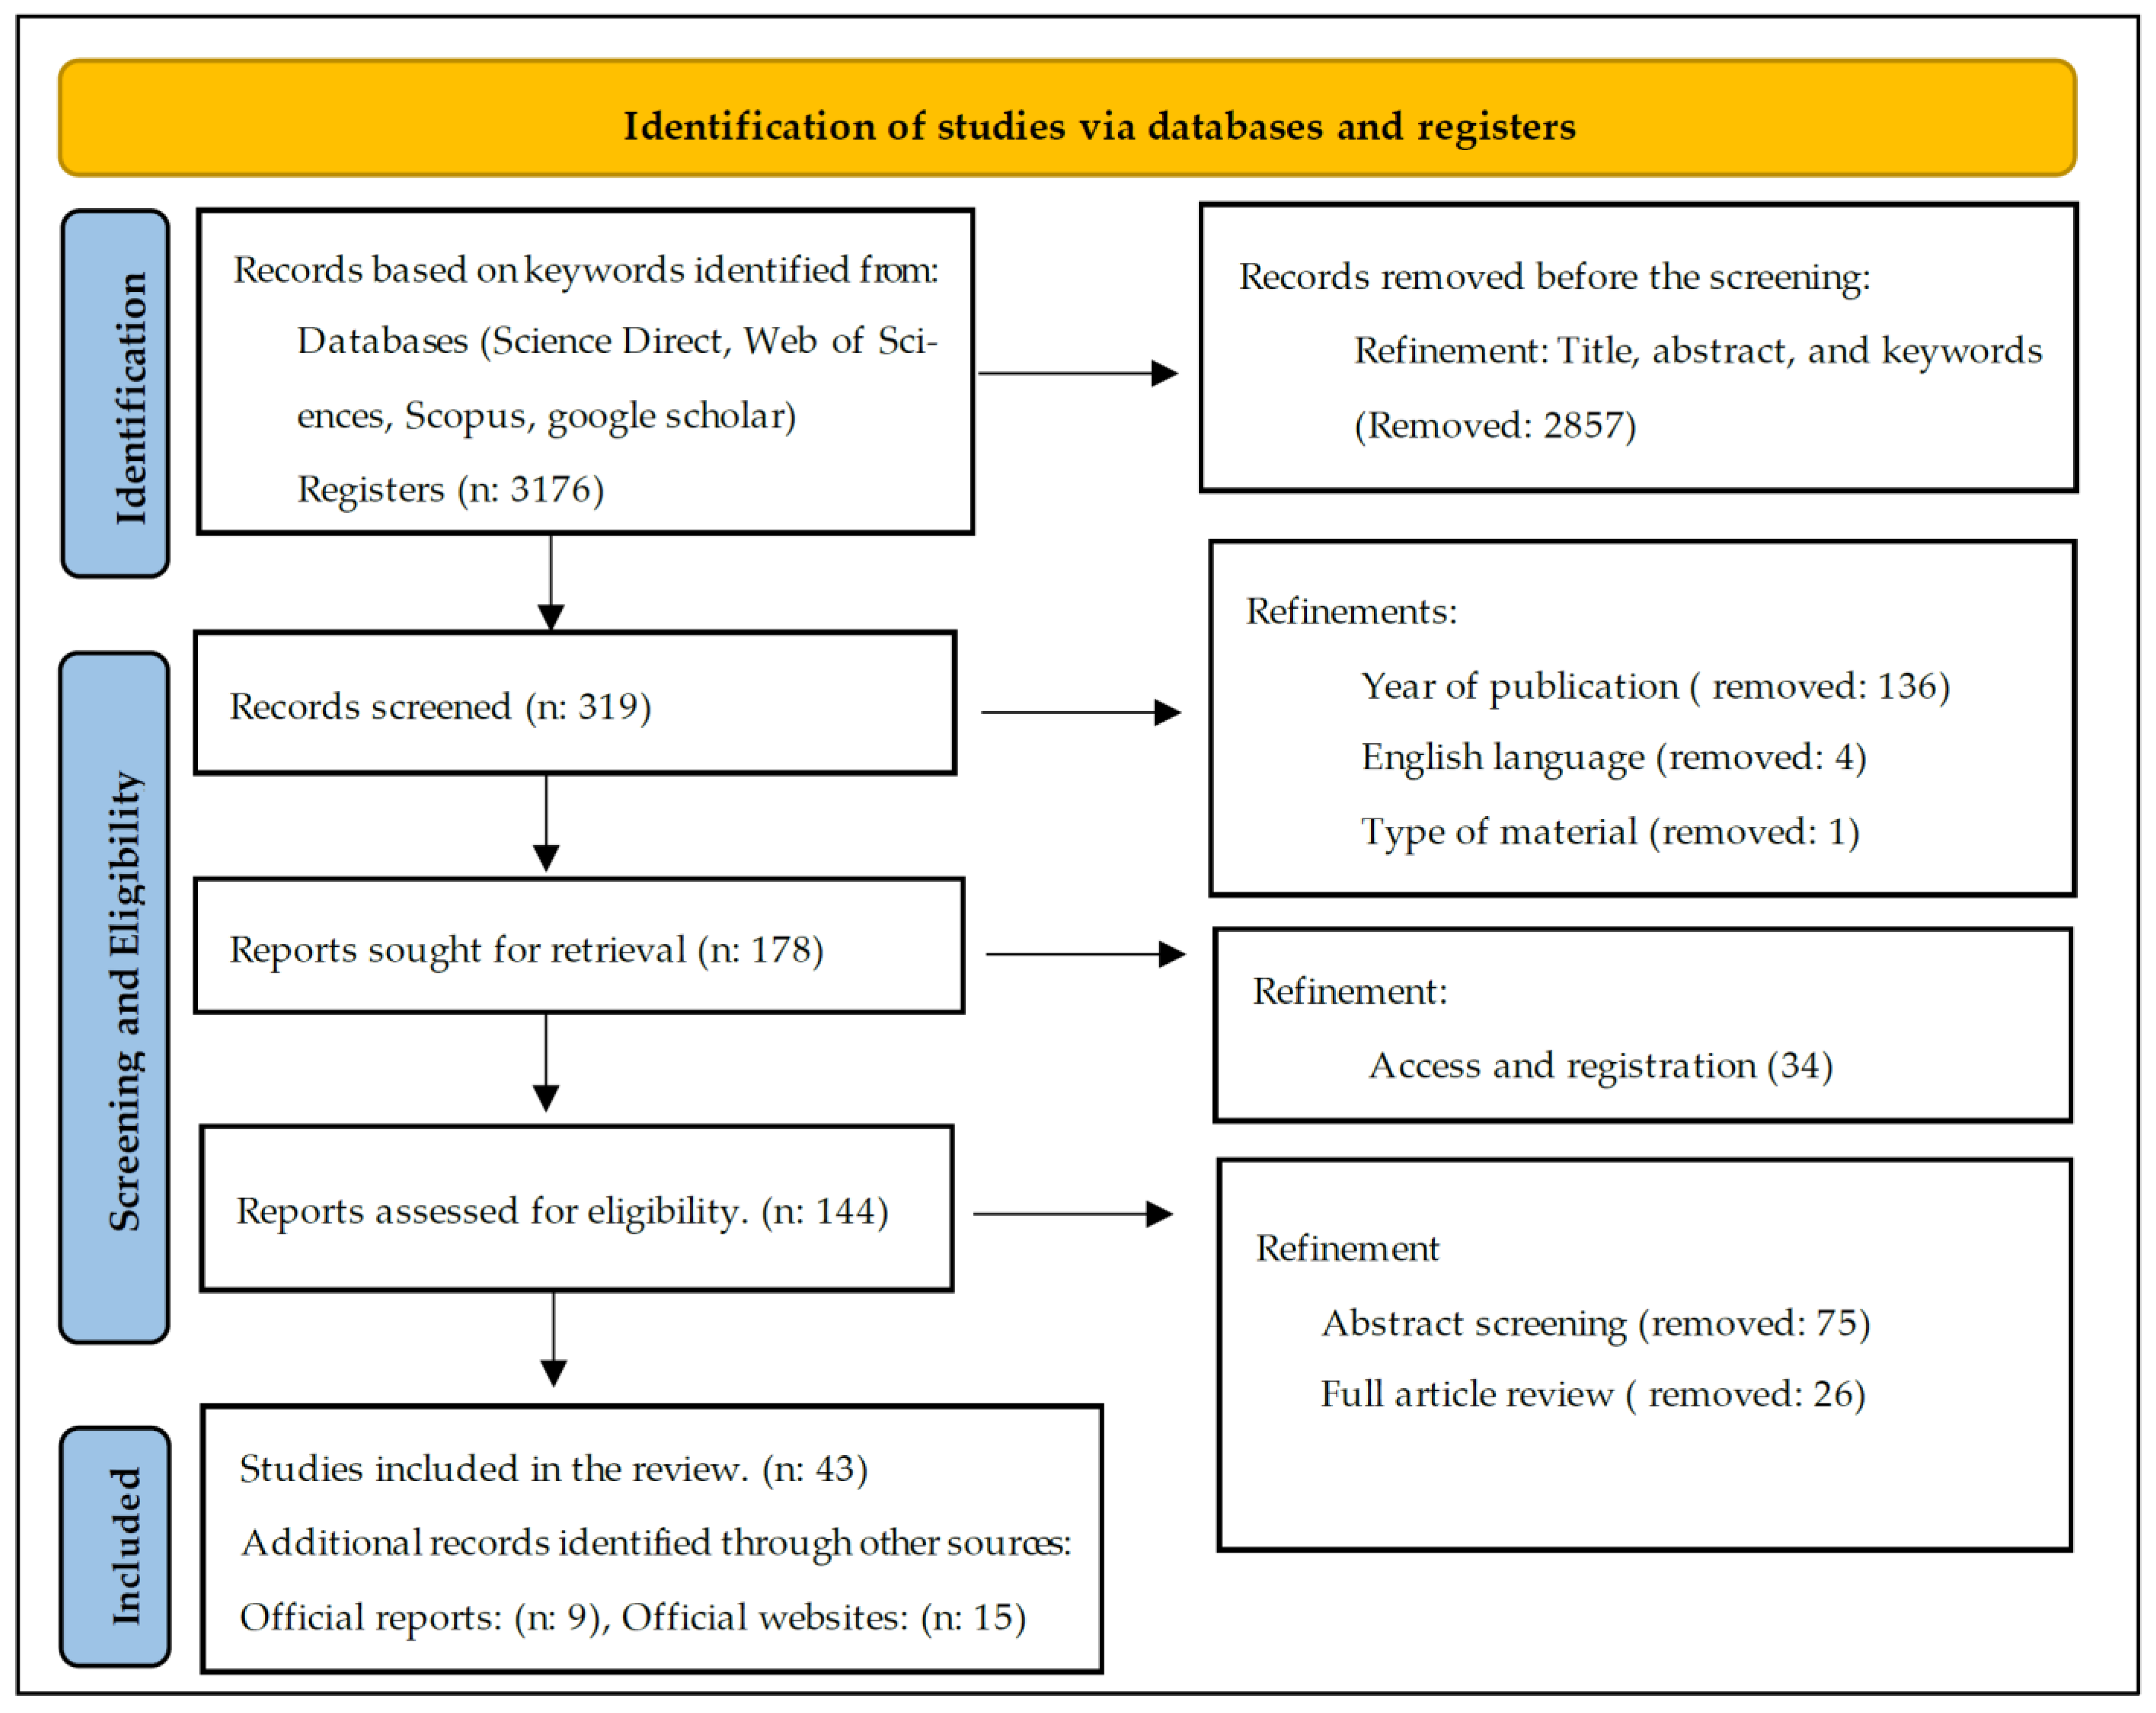
  • Identification: Keyword search in Internet databases (Science Direct, Web of Sciences, Scopus, and Google Scholar) for ‘seaport’ or ‘port’ and ‘reduction’ or ‘reducing’ or ‘mitigation’ and ‘CF’ or ‘CO2 emission’ or ‘climate change’, which rated top in 3176 results;
  • Screening and eligibility: These processes are linked because a single or mixture of eligibility concerns is raised at each screening stage. Eligibility categories included the paper’s title, abstract, and keywords in the first refinement, which led to 319 resources and the year of publication from 2018 till the end of 2022 (5 years), which led to 183 resources; further refining by language (only in English) led to 179 resources. Then, refining was performed by type of material (articles, conference papers, books, and conference reviews): in all, 119 articles, 48 conference papers, 5 books, and 6 review research papers were identified. The next step was refinement based on access and registration, and 144 research works were identified. Subsequently, abstract screening was performed, and refinement and adjustment were performed to account for important topics. Thus, 75 resources were found. Considering full article reviews yielded 43 resources;
  • In the final stage after screening and refinements to obtain the total number of research that will be discussed in the review, 37 publications were identified from indexed journal articles and six conference papers; these publications included three IEEE research papers. Since the nature of this study involves national and international legislation, 15 official websites of international entities and organisations, and nine official reports were re also included in the database for this research;
  • The transparent procedures followed in this PRISMA-ScR allow future researchers to replicate and update the review. The flowchart of the PRISMA-ScR steps and the filtering results are shown in Figure 2.
Forty-three articles were discovered using Internet search engines (Figure 2). Subsequently, a comprehensive search was performed, and 15 websites and nine reports on international standards, directives, statistical information, and reports associated with the focus of this research from international organisations and institutions were discovered. This comprehensive search was performed considering the primary objective and scope of research.
In the following sections, the reports and data, international rules and regulations, and the findings in the resources on lowering CF at ports are categorised and briefly explained. These classifications are based on the effectiveness of the regulations, nature of control by relevant bodies, and performance.

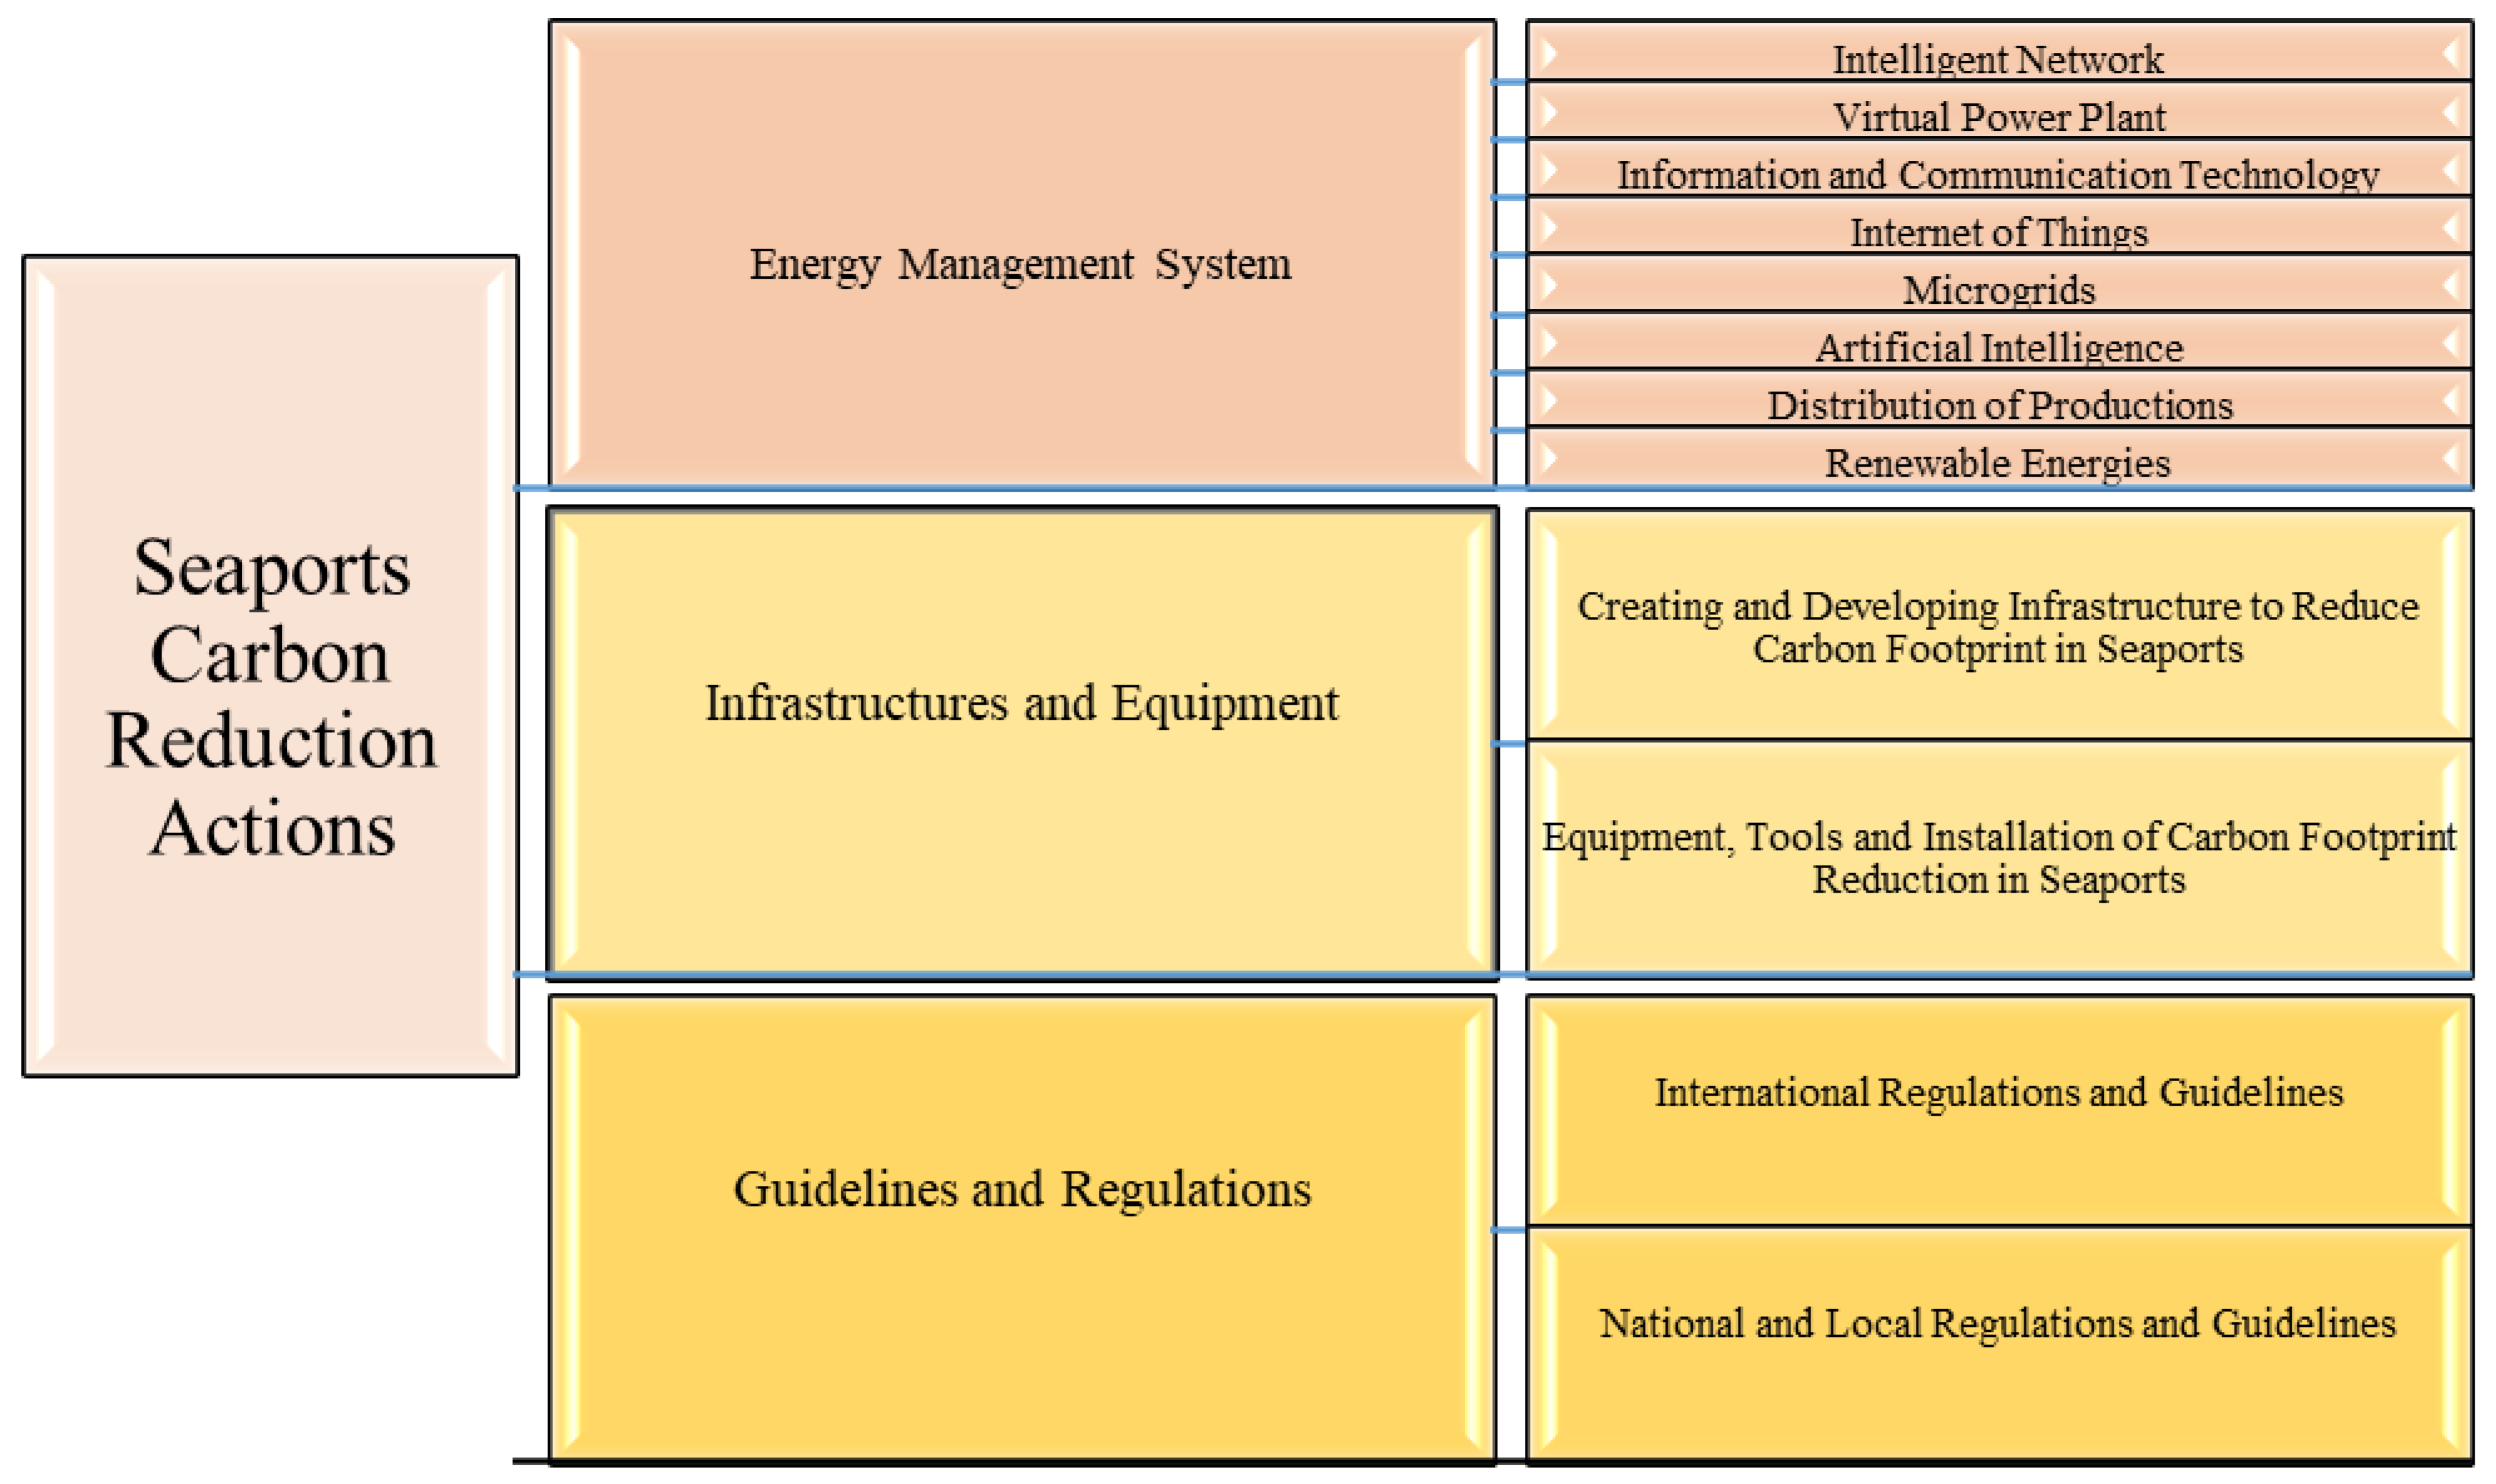
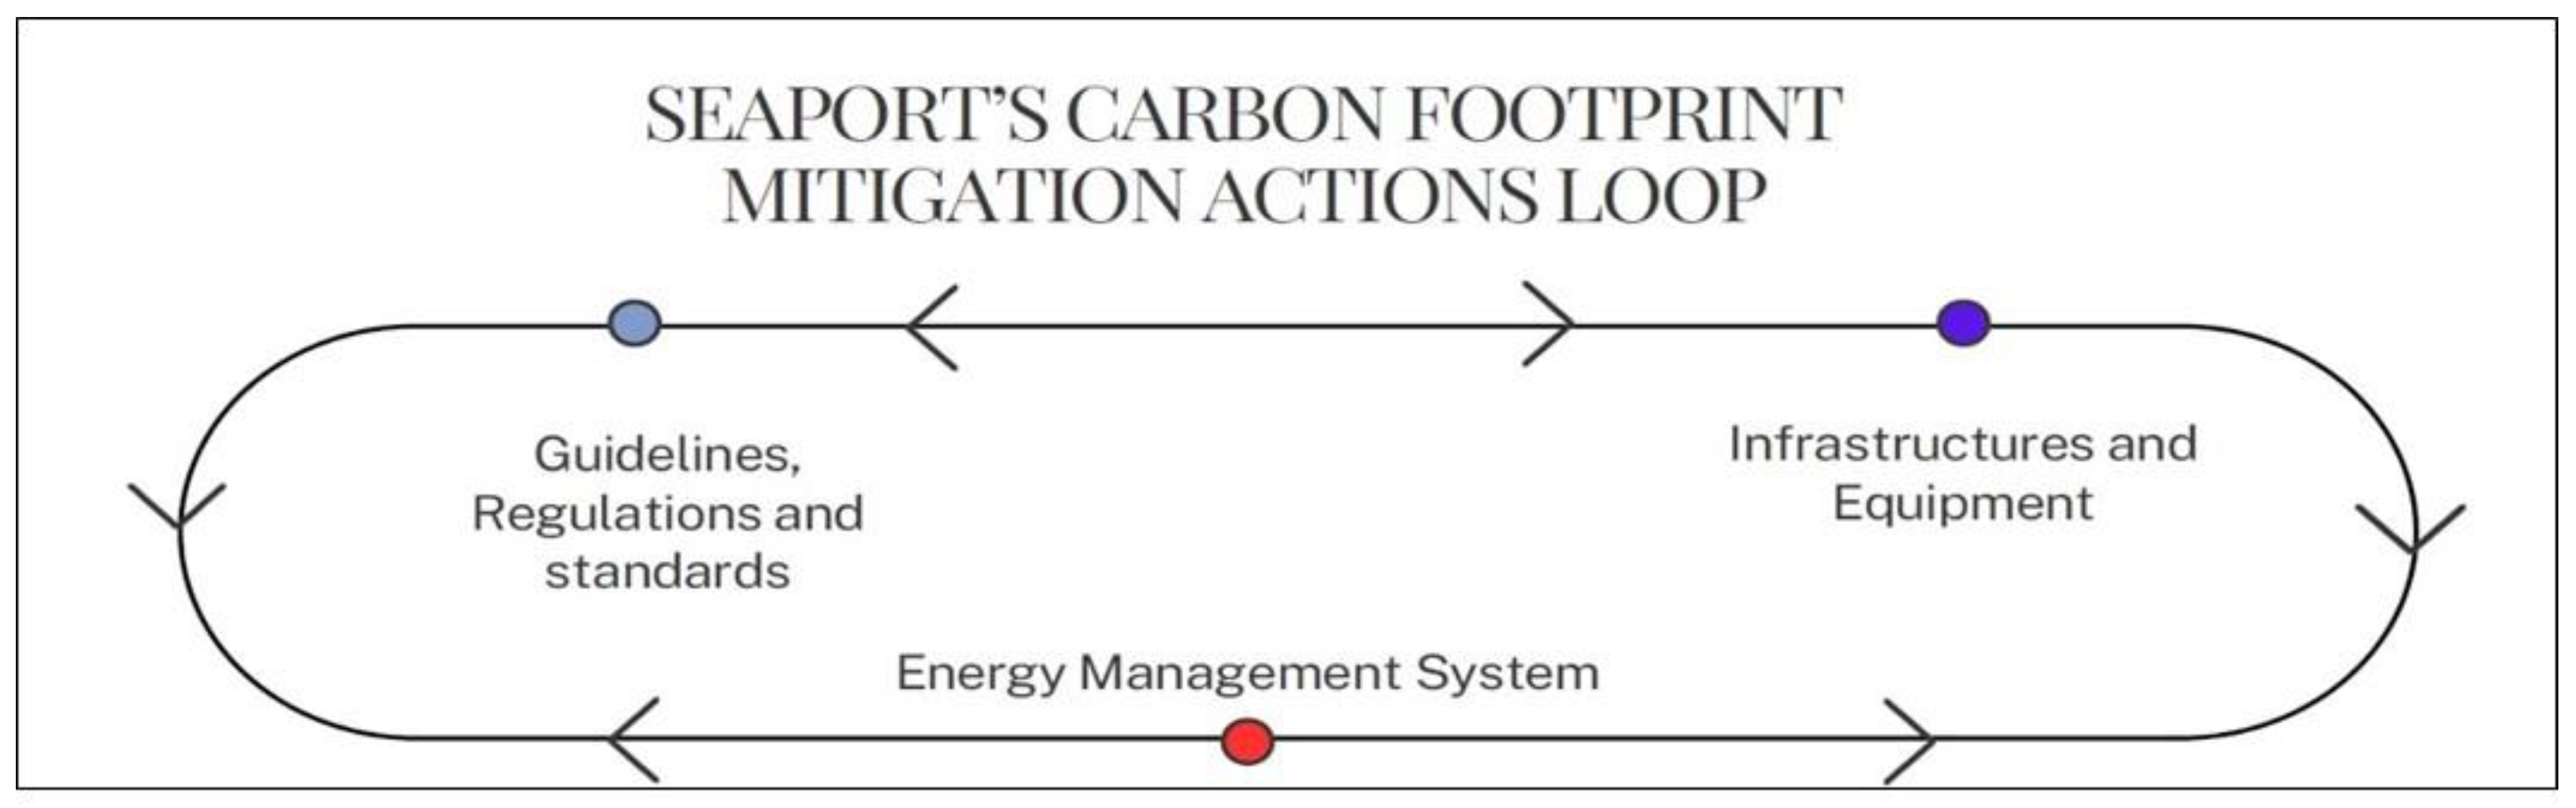
3. Findings on Initiatives for Reducing the CF at Ports

According to recent global statistical data on CO2 emissions in billions of metric tonnes (BMT) over the last decade based on reports of ‘Statista’ [9], the proportion of emissions by sector is as shown in Figure 3.
Figure 3 shows that the power industry is responsible for most of the CO2 emissions over the last decade, followed by the transportation sector. The contributions of both increased slightly from 2011 to 2021, with only a reduction in 2020 because of the COVID-19 pandemic and a moderate increase thereafter. With regard to seaports, the focus was on regulating internal maritime, land, rail, and pipeline transports, and managing and replacing them with renewable energies.
Furthermore, according to the research on the recent port CF mitigation activities, most of these activities focus on the land part of scope 3 of GHG emissions in ports.
In seaports, emissions are divided into three categories: those produced by equipment and entities under the control of port authorities (scope 1); those brought on by the purchase of electricity for all port authority’s activities (scope 2); and those produced by other sources (scope 3), which makes up the remaining portion of seaport emissions and comprises indirect GHG emissions from sources that are a result of port operations but are owned or under the control of other entities (according to the GHG protocol [10]).
According to the most recent EU Ports’ Climate Performance report, scope 3 emissions are responsible for the majority of emissions in the port area [11], and warrant more attention.
Following the designation of the resources specified in Section 2 of this paper, the authors began to categorise findings by evaluating the nature of activities and influences in minimising seaports’ CF.
There are three major categories of initiatives, as mentioned earlier:
(i)
The use of an energy management system (EMS) in ports;
(ii)
Deploying infrastructure and equipment to reduce CF in ports, and;
(iii)
Issuing and applying guidelines and regulations that represent national and international bodies’ policies toward the primary goal of reducing the CF to mitigate climate changes.
As illustrated in Figure 4, each of these groups can be further subdivided.
Furthermore, other studies combined the goal of reducing CF in seaports with other areas, such as CF accounting procedures or using renewable energies. Nonetheless, this study focuses entirely on the primary aims of the seaport’s carbon reduction activities; this focus can distinguish this study, provide better output for future work, and guide policymakers for future decisions.
As illustrated in Figure 4 prepared by the authors, the classification results from the scoping study in a relatively basic yet new manner can lead to a better understanding of the best practices for combating seaports’ CF worldwide.

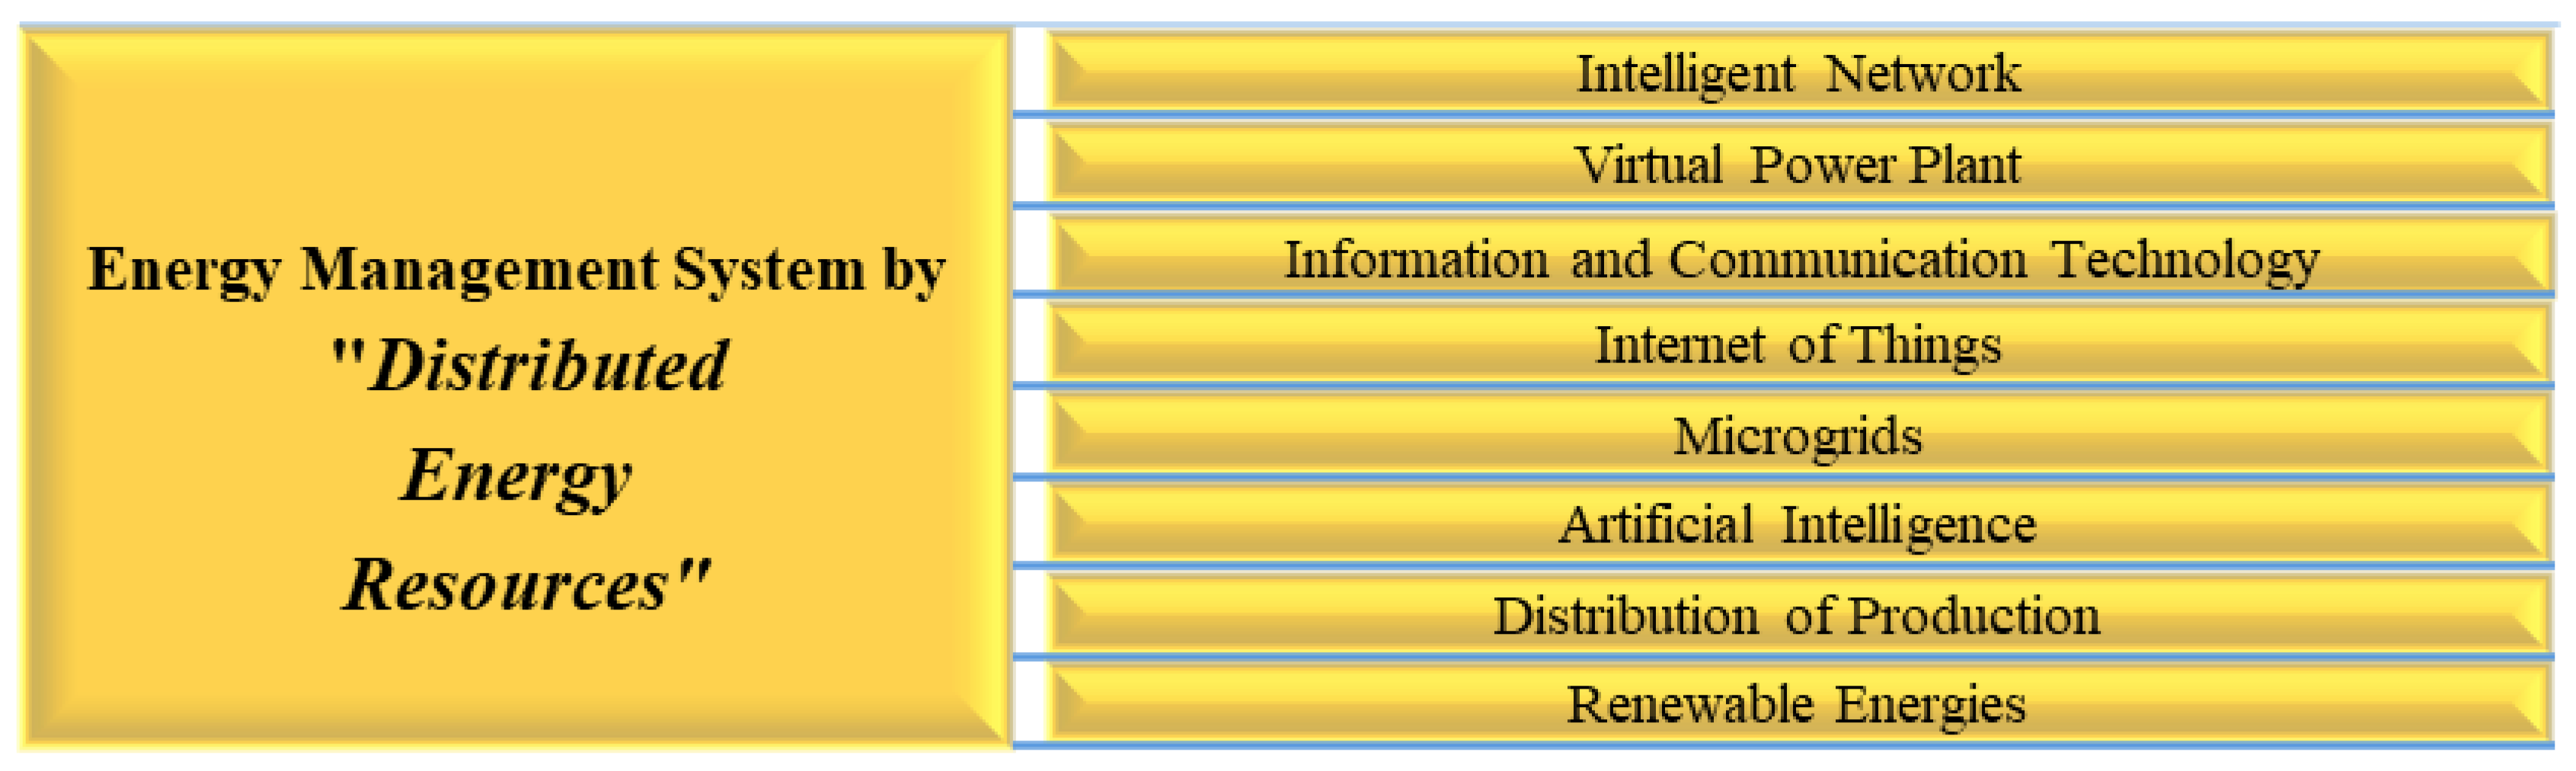
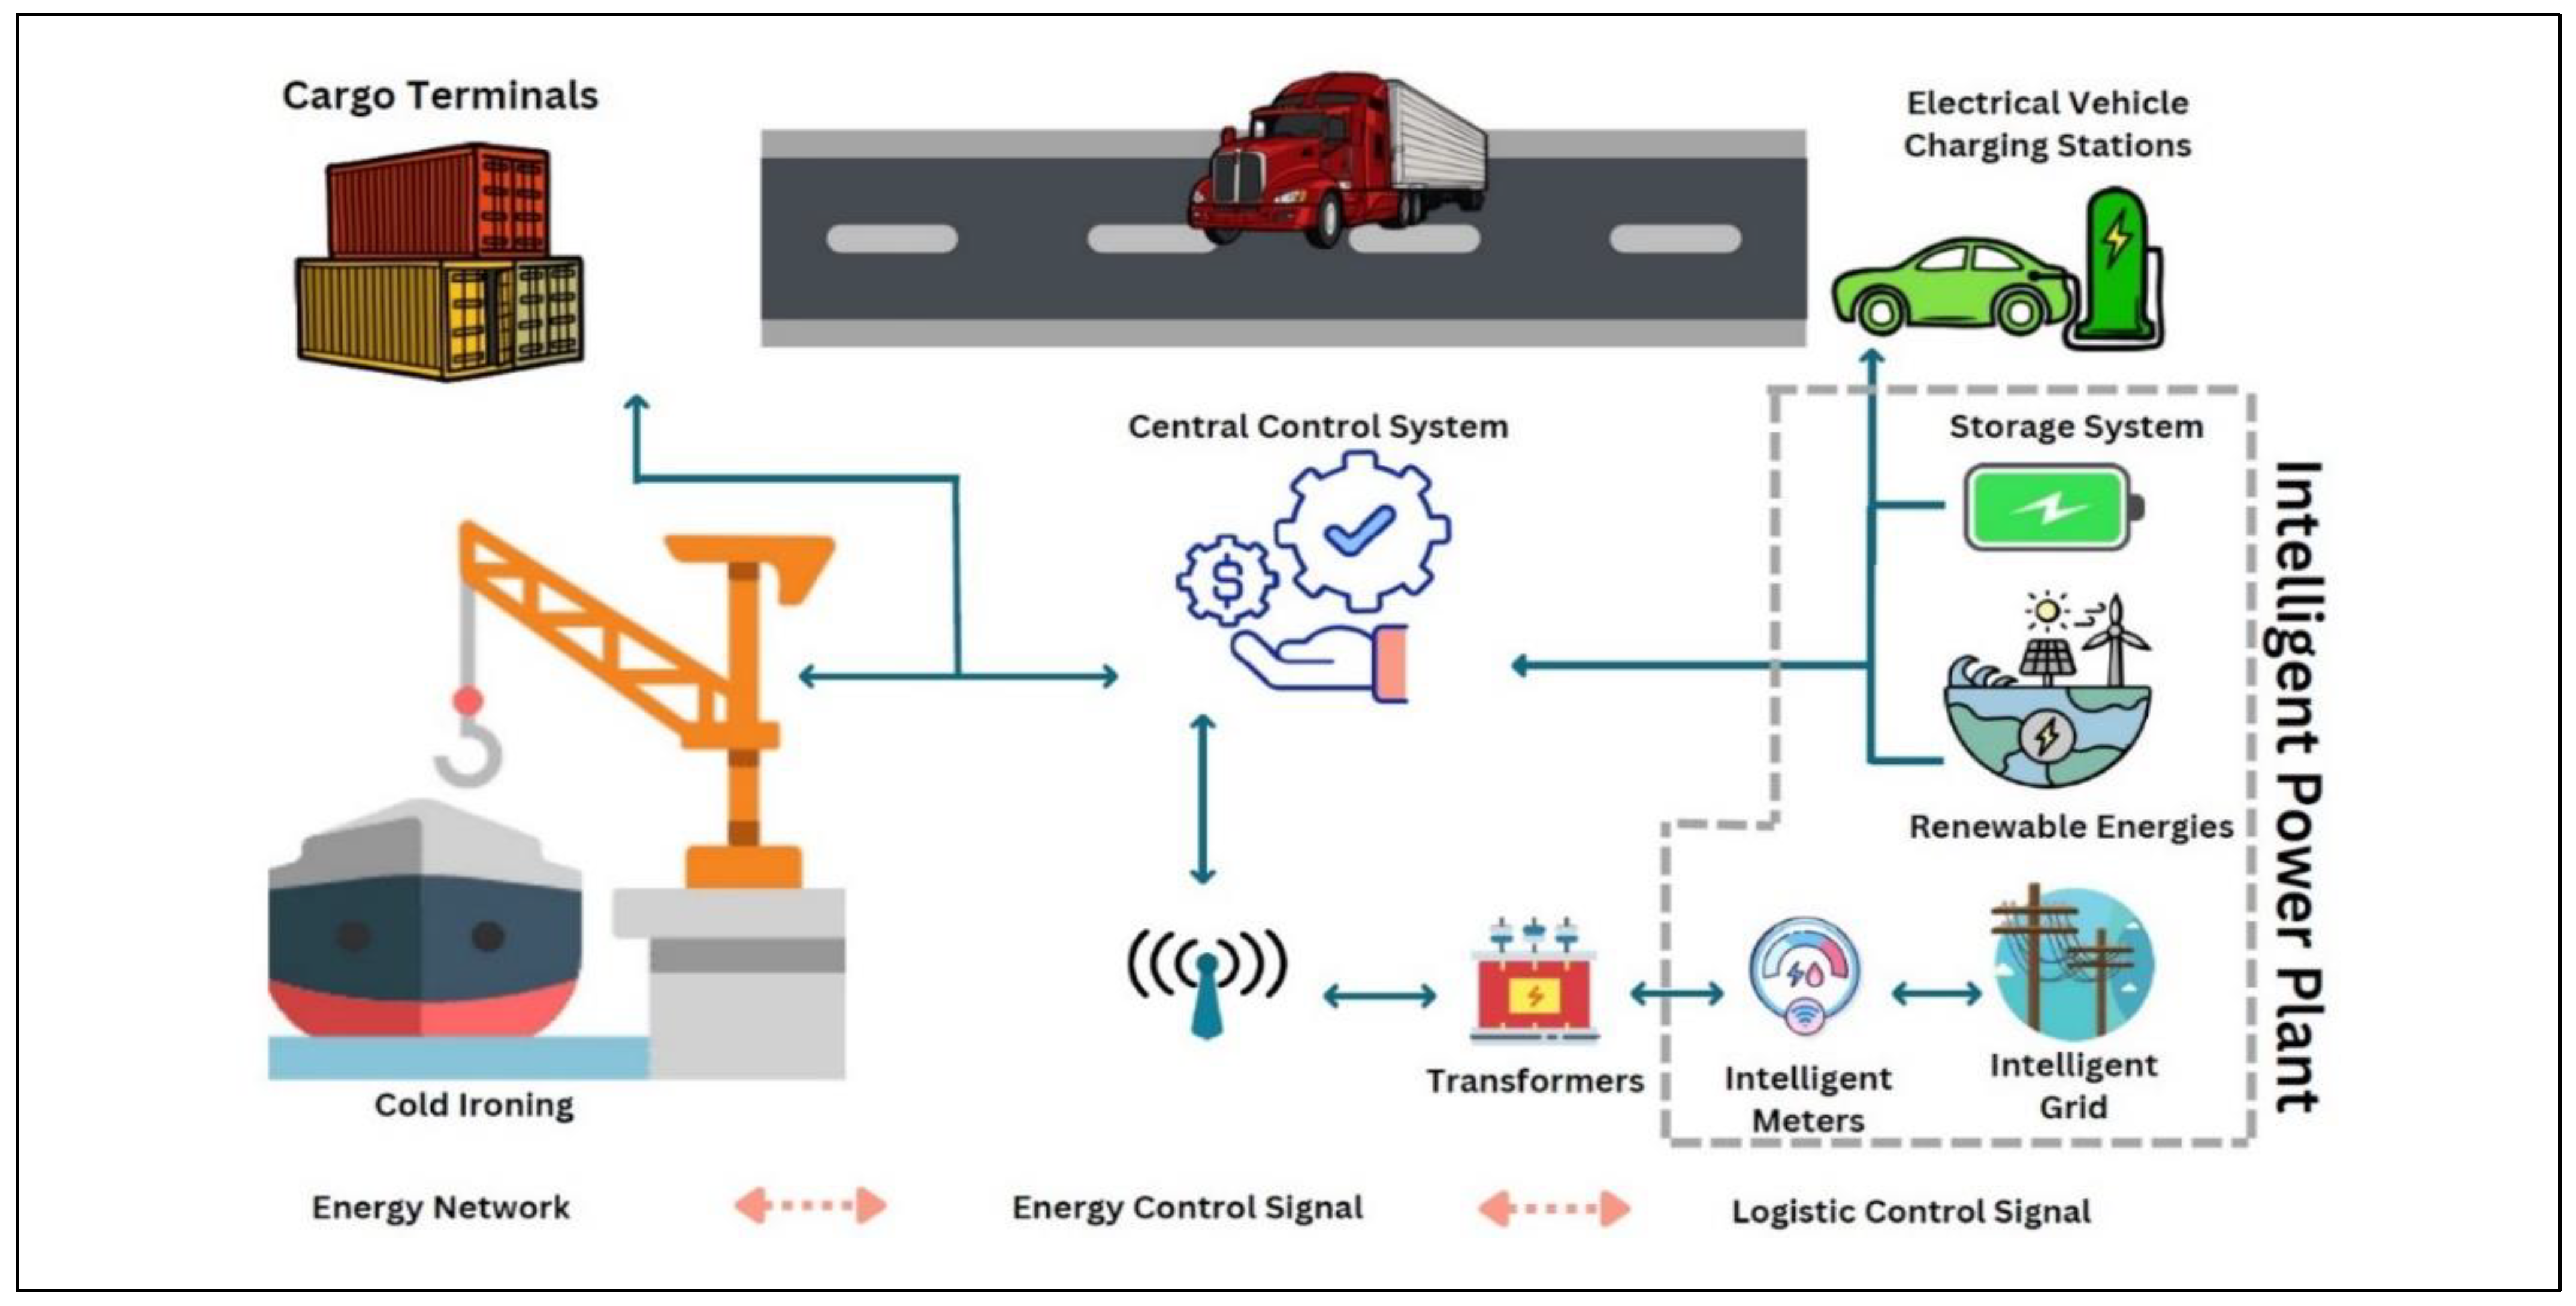
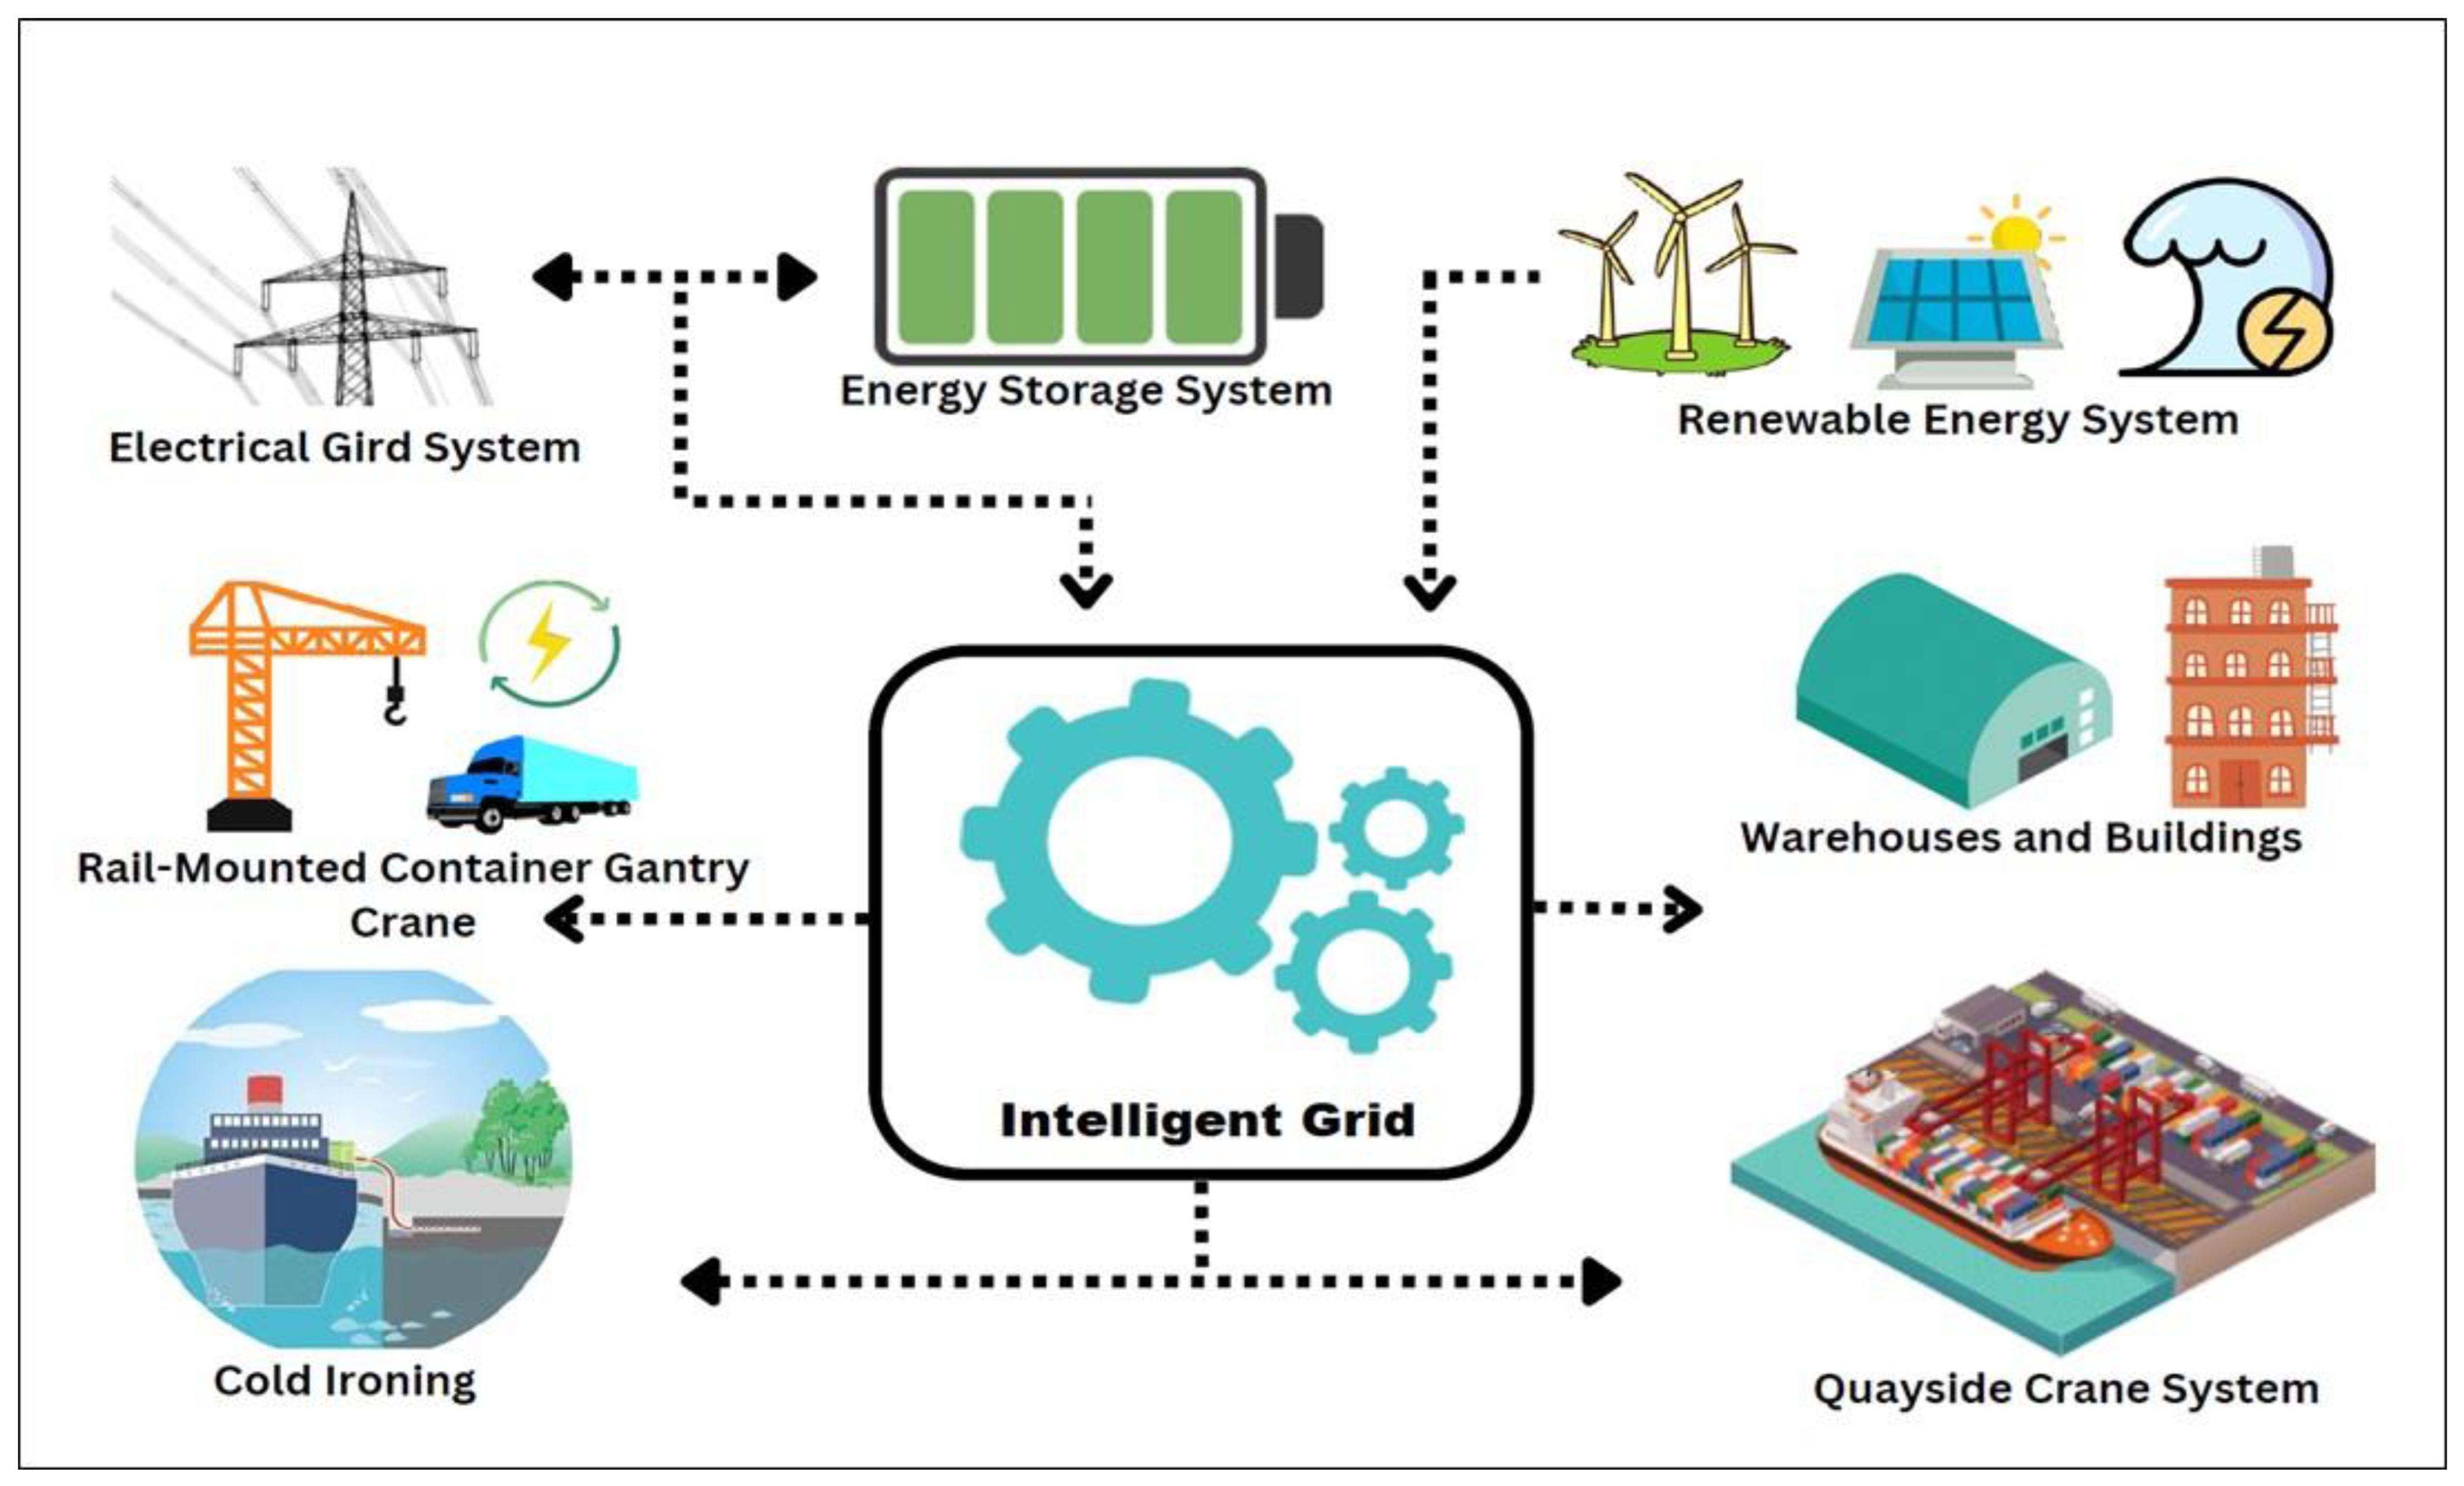
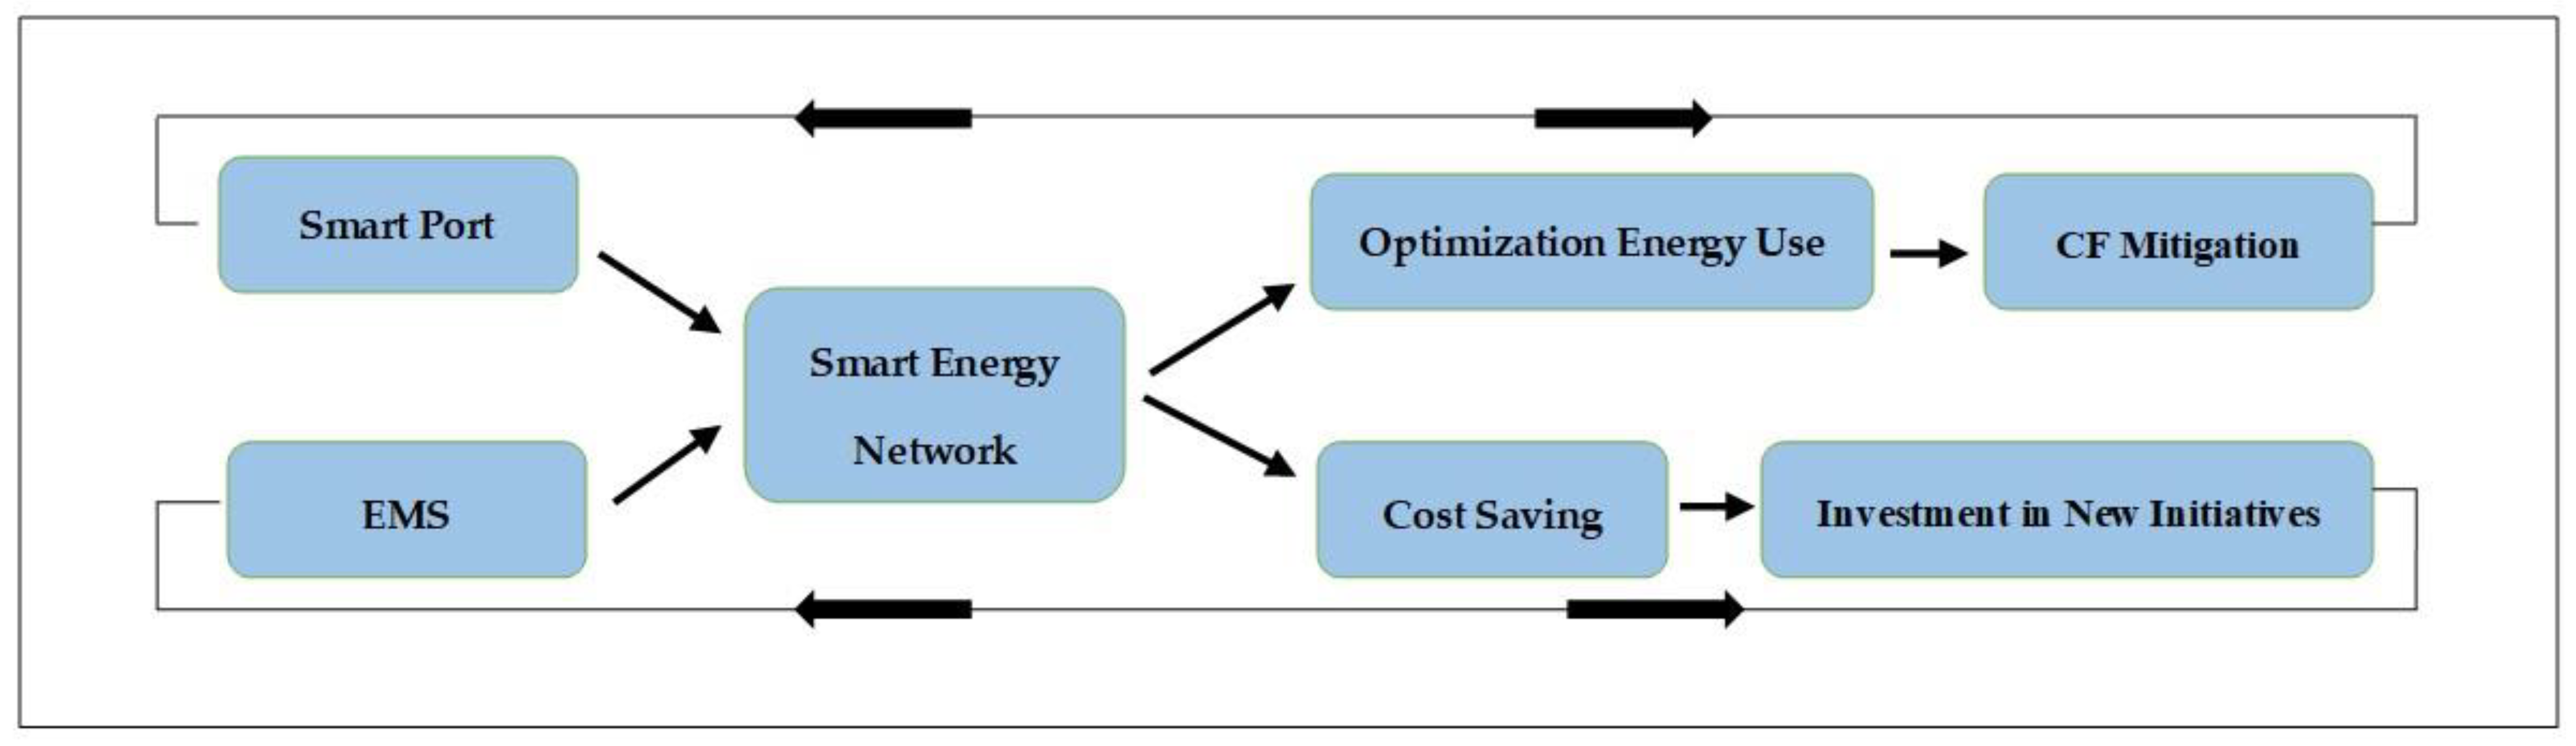
3.1. Energy Management System

The viability of using intelligent energy systems in residential and commercial construction increased with the recent promise of information and communication technology (ICT) applications for fabrications, construction, and building automation networks.
The global energy needs are expected to rise in the coming decades because of the projected population growth and potential industrial expansion. This topic focuses on increasing public knowledge of the environmental effects of energy production, delivery, and consumption. Considering the preceding points, the critical challenge for an EMS is to reduce environmental consequences while maintaining the quality and influence of energy prices [12].
A modern EMS for marine ports also offers creative, efficient, safe, and cost-effective seaport options. This system involves energy generation from all resources, including renewable sources, etc., energy distribution, and energy consumption control. At a port, energy generation refers to activities that convert fossil fuel and renewable energies, such as wind, solar, and wave energies, into electricity. In contrast, energy distribution refers to the systematic and intelligent distribution of energy to users. Using electricity for ports and port-related tasks, such as cargo handling, industrial operations, logistics, and office tasks, is energy consumption.
According to an economist intelligence assessments report, by 2032, fossil fuels will still constitute 78% of the global energy mix, which is only a modest decrease from 81% in 2022 [13].
Furthermore, ports are frequently located in areas that are particularly well-suited for power generation from renewable energy sources such as wind, sun, and waves (such as Rotterdam in the Netherlands and Kitakyushu in Japan) and tide differentials (which are currently being researched, for example, in Dover, the UK, and the Port of Digby, Nova Scotia). In some cases, geothermal energy presents an opportunity to move toward greener energy, as in the case of Hamburg port.
Additionally, broad, flat surfaces such as storage areas and warehouses that can be used for solar panel installation are frequently found in ports (e.g., the Tokyo Ohi Terminal or the Port of San Diego administration buildings). However, seaport energy management necessitates policies, technological developments, and operational measures.
Therefore, achieving EMS goals lies at the heart of national and international EMS rules and regulations in marine ports [14]. Hence, several laws governing the use of the EMS are being passed worldwide. Some of the significant international policies are as follows:
  • Energy Management, ISO 50001 [15];
  • Energy Management Systems, EN 16001 [16];
  • Plans for Managing Port energy (PeMP);
  • Environmental Management Systems Address Energy Management (EMS);
  • Green Port Policies and Port Environmental Management Plans (PEMP).
Furthermore, following the implementation of an EMS in a seaport, the following areas must be covered by technological and operational steps to improve its performance:
  • Classification of port-related activities (direct and indirect or land-based and maritime-based);
  • Important operational metrics;
  • Primary technological solutions for vehicles and equipment at ports and terminals;
  • Energy saving port structures;
  • Additional facilities and infrastructure to support port energy efficiency.
Nowadays, an EMS may be considered a component of the distributed energy resources (DER) programme, which is defined as ‘energy-producing services that are directly connected to medium voltage or low voltage delivery grids rather than bulk energy broadcasting systems’ [12].
Through the DER, the components of EMS can be divided into eight primary categories: (i) intelligent network, (ii) virtual plant, (iii) ICT, (iv) Internet of Things (IoT), (v) microgrids, (vi) artificial intelligence (AI), (vii) distribution of production, and (viii) renewable energies, as illustrated in Figure 5.
An intelligent network employs microgrids and virtual power plants (VPPs) as hardware and ICT, IoT, and AI as software to support efficient product distribution. It leads to a new perspective that controls energy use through DER.
Although more cases can be considered for this part, since this study is only a scoping review, only the literature identified after refining was examined. Finally, for all procedures, the use of renewable energy rather than fossil fuels was essential, especially given the growing threat of global warming and climate change. All the components, which include software and hardware, operate with an intelligent control system to form an intelligent network.

3.1.1. Intelligent Network

Intelligent grid technologies can help to resolve the challenges for an energy system and provide reliable, secure, stable, and high-quality power production by connecting many seaport energy sources with suppliers or renewable energy sources. Figure 6 shows how an intelligent network improves the dependability and efficiency of the power supply of a seaport.
As shown in Figure 6, the central control system in an innovative system that runs with an intelligent network regulates the energy network and logistic control signal. It provides cargo terminals an on-site power supply known as cold ironing (CI) “Cold ironing, or shore connection, shore-to-ship power (SSP) is the process of providing shoreside electrical power to a ship at berth while its main and auxiliary engines are turned off” [17], transportation equipment (trucks), renewable energy production systems, energy storage systems, an electric vehicle charging station, and an intelligent grid that is connected (via a transformer for adjusting required power and voltage) to an intelligent metre to monitor the energy consumption. An intelligent energy central control system in a seaport regulates and connects each of these parts.
The effects of constructing an intelligent network in a seaport were examined by employing a two-stage programming technique in a study by Molavi et al. on intelligent management in smart ports. Their study demonstrated how installing an intelligent network at a port can drastically reduce energy use and carbon emissions. This intelligent network also demonstrated how effective infrastructure, suitable standards, and the EMS system work together to move toward sustainability, and finally, help mitigate climate change [18].
Furthermore, seaport intelligent energy networks employ a variety of technologies that can demonstrate the dependability and adaptability of electrical energy delivery. Examples are the use of AI to predict the amount of energy produced in the coming days, storing or converting this energy, and then transforming it into new types of energy and repurposing it to accommodate demands.

3.1.2. Virtual Power Plant

According to Kenzhina et al., a VPP is not a power plant in the traditional sense, though it is described as a novel power plant that employs the ICT to link, monitor, and visualise scattered generators. Aggregator-specific software provides automated capacity management to centralise, process, and display data analytically, as well as to provide communication with the operator of the power transmission system [19].
An EMS must have a VPP, especially in seaports where energy use is extensive and consumption regulation can drastically affect cost and supply. Finally, this optimisation decreases consumption, which eventually means fewer port emissions and lower CF.

3.1.3. Information and Communication Technology

The ICT is one of the most critical aspects of contemporary society and an essential component of an EMS. Russo and Musolino defined ICT as information technology integrated with numerous other related technologies, particularly communication technology. In other words, ICT is essential for creating a secure, flexible, and realistic communication infrastructure in an intelligence network and enabling protocols that support real-time communications between producers and users [20]. The most popular approach is the Global Positioning System (GPS) or Global Pocket Radio Services.
Considering these two definitions, the role of ICT in an intelligent network for connecting different hardware is highlighted, and the intelligent network of an EMS in a smart seaport requires ICT for efficient connection.
An example of ICT is the power line connection (PLC), which is a frequently utilised technique for communication between an intelligent metre and a data cloud in an EMS intelligent network in a seaport [21]. By comparing the descriptions and performances of ICT and PLC, it is clearly seen that using these systems is critical in smart ports and increasing the efficiency of an EMS in smart ports is directly related to lowering the CF.
In a new perspective, data clouds and data metre management systems are merged, as depicted in Figure 6, and these two are incorporated into an intelligent metre’s system.

3.1.4. Internet of Things

The IoT is a relatively new field in information technology, and it encompasses a wide range of concepts and industrial applications. The Internet connects computer network-based systems to benefit millions of people worldwide using common Internet protocols. The IoT is being employed in intelligent energy systems in seaports, according to Sarabia-Jacome, who examined marine port data cloud and demonstrated the performance and benefits of IoT for maritime port operations [22].
The findings of Sarabia-Jacome support the notion that maritime port data clouds aid decision-making in several port departments. Another study explored the use of an automatic mooring system (AMS), which allows ships to dock and unberth without using mooring equipment, and revealed that it can reduce carbon emissions. This AMS is an excellent example of the application of the IoT in seaports [23].

3.1.5. Microgrids

Nur Najihah et al. described a microgrid as “a community of interconnected loads and distributed generation at defined electrical boundaries based on a controllable entity that is connected to the grid”. A microgrid can operate in an isolated or connected mode because it is both grid-connected and detached [24].
However, for a microgrid to operate effectively, system reliability must be improved, power needs must be predicted, interruptions must be avoided, and unanticipated issues related to renewable energy resources must be addressed by using microgrid energy storage technology. Microgrid control and performance, as well as cooperation with other EMS components, have a substantial impact on EMS performance [25].
Figure 7 shows a high-level view of an EMS microgrid system at a smart seaport. This system includes a port with a cargo terminal containing warehouses and buildings, renewable energy sources and an energy storage system, and CI infrastructure and port facilities (including rail-mounted container gantry cranes, cargo load, and discharging facilities such as quayside cranes). All of these components are linked in an intelligent network and managed by a central control system.

3.1.6. Artificial Intelligence

Since AI is capable of tackling complicated issues, the usage of AI in environmental modelling increased drastically. AI is required to realise an EMS system at seaports as an industrial zone to manage and control the generation, transfer, distribution, and optimisation of energy consumption on large scales throughout the whole energy supply chain in the market (from energy production to transmission via network and distribution to the final user) [26].
Therefore, the existence of AI necessitates the optimal connection of all hardware and software in the EMS of a smart port. The distribution of production, which includes both hardware and software, is explained in the following section.

3.1.7. Distribution of Production

Another component of an EMS is production distribution via an intelligent system, which may be described as an overall perspective of an EMS at a seaport. Energy rules and policies evolved dramatically in the recent years because of major challenges affecting people’s lives, such as the shortage of fossil fuels, rapid climate change, and population expansion. In this scenario, however, several countries began employing micro-energy-generating technologies to improve the supply security and to satisfy energy demands [27].
Distributed generation (DG) refers to small-scale power generation, usually on a scale of a few kilowatts to a few megawatts, on a microgrid close to the loads [28]. Mehigan et al. proposed three classes of DG: (A) power generation connected to a distribution network, (B) power generation connected to the user’s end of the receiving device, and (C) power generation unconnected to the grid and reliant on energy demand [29].
Furthermore, a DG system has main systems: a conventional producing system and an unconventional producing one. The conventional producing system consists of devices such as microturbines. Unconventional producing systems include renewable energy resources, storage devices (such as batteries), and electrochemical equipment (fuel cells) [30]; according to Mehigan et al., both types of production systems are incorporated in a DG [29].
Abundant data and information on DG are available. However, current research cannot provide a complete understanding of the concept yet, but given the nature of seaport operations, DG must be incorporated in smart seaports to optimise energy consumption while improving the performance, which can eventually lead to reducing the CF of seaports.

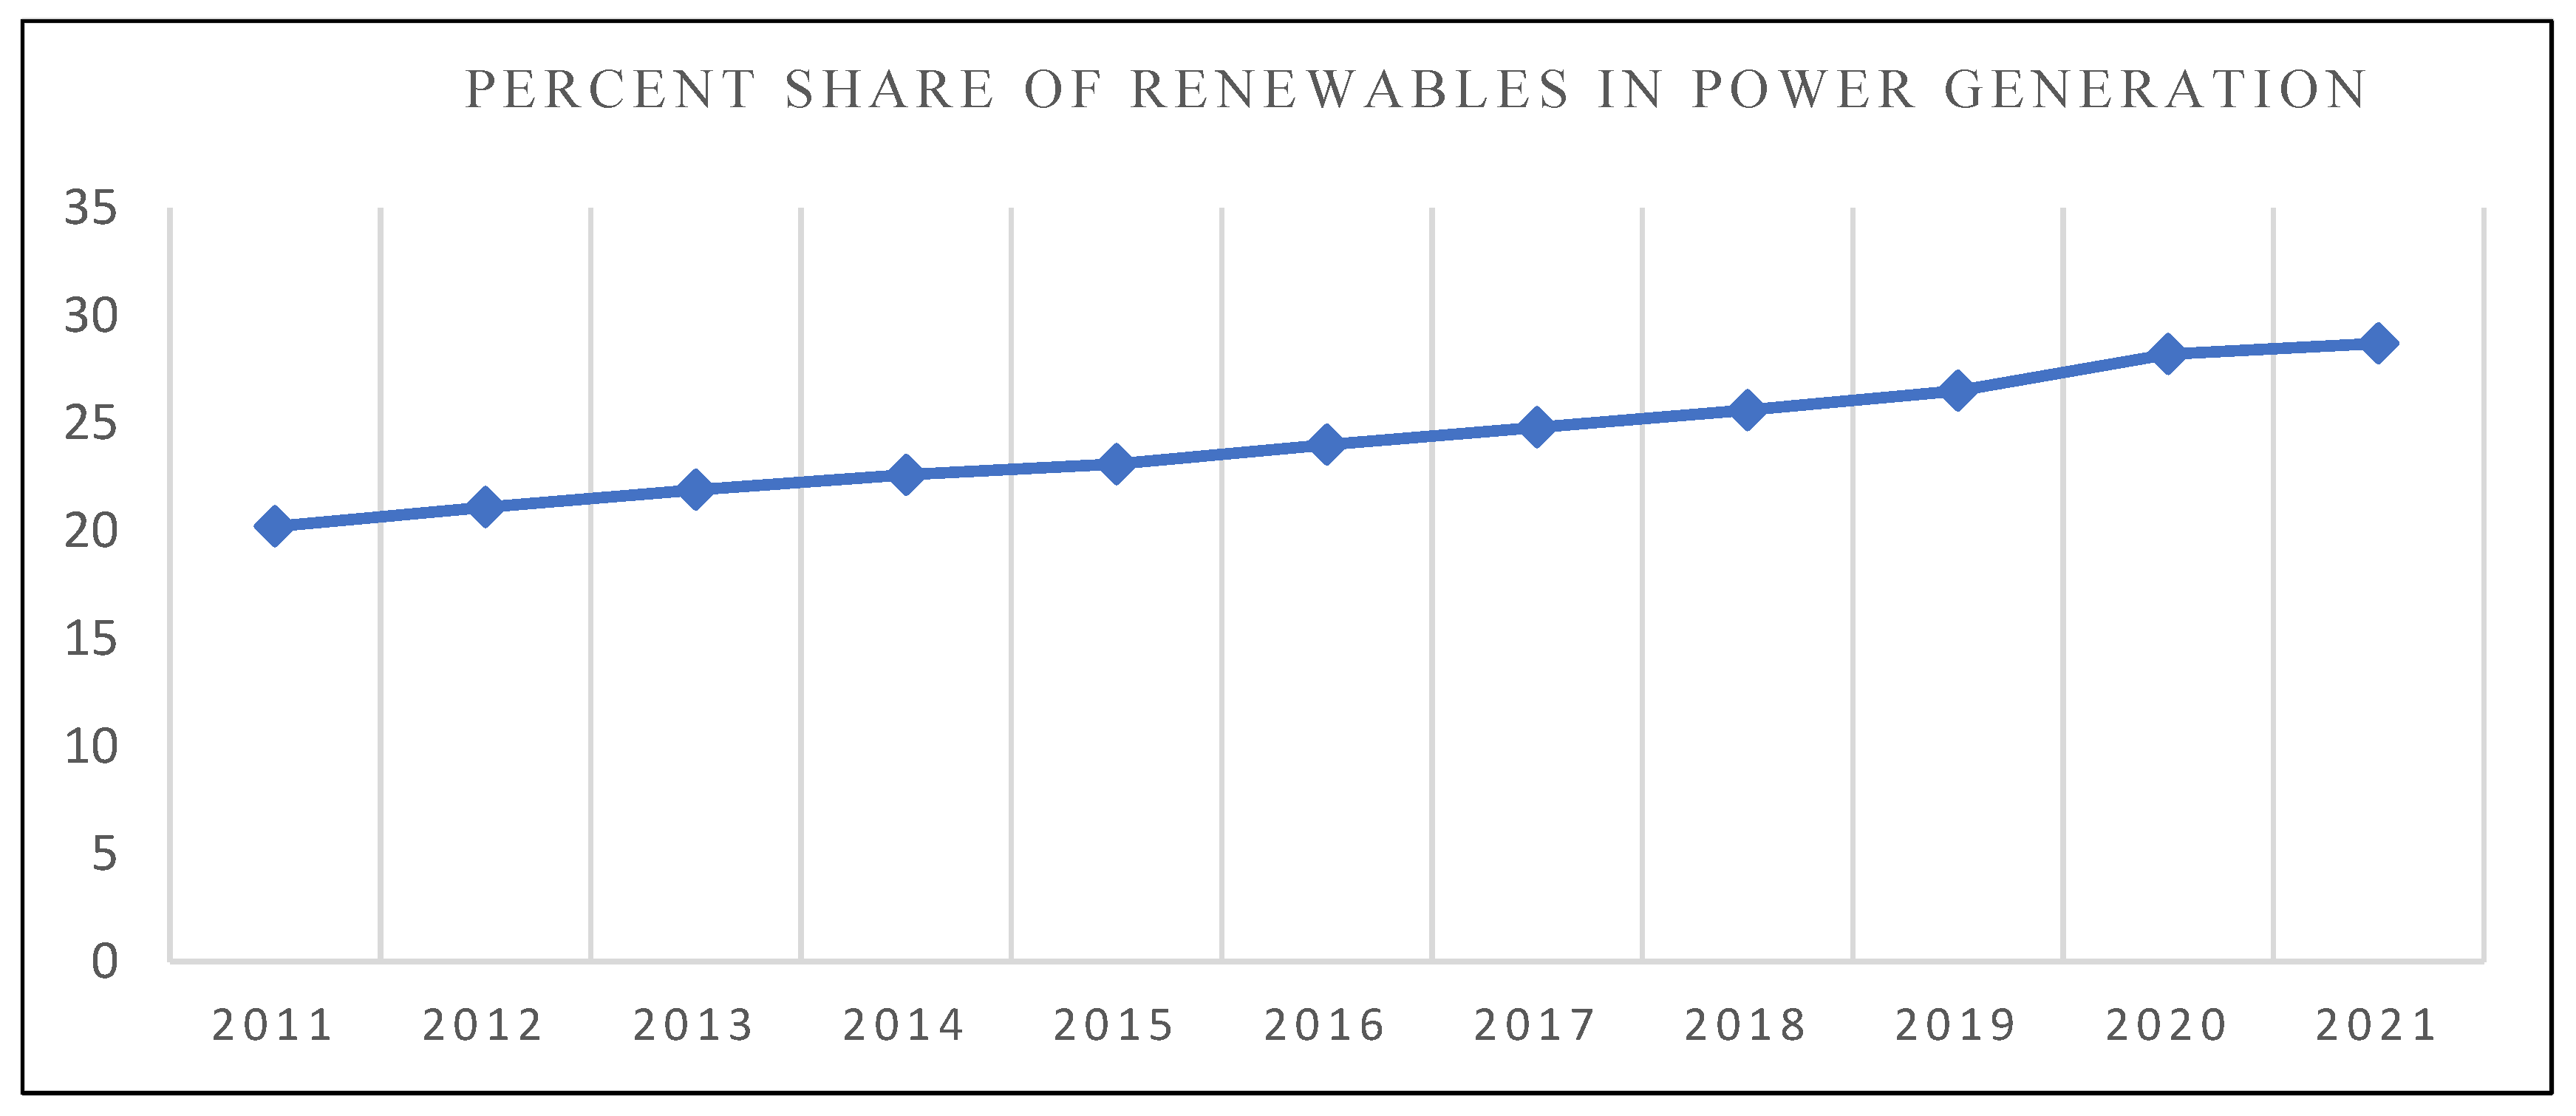
3.1.8. Renewable Energy

Nowadays, many ports are moving toward deploying renewable energy to meet the energy demands for operational purposes within port boundaries. This measure can help overcome climate change by mitigating the CF of ports.
Examples of the use of renewable energies to replace fossil fuels for port operations in the new era include the wind farms in the seaports of the UK and Spain, solar and solar–thermal plants in Singapore and Australia, marine energy in the UK, and geothermal plants in German ports.
However, some tools and infrastructure, as well as some implementation and legislation, are required for using renewable energy. Hence, the use of renewable energy can be classified in another subsection of this research.
According to Kandiyil et al., in Middle Eastern ports, deploying marine renewable energy at ports might reduce carbon dioxide emissions by up to 28 million tonnes per year, or nearly 20%. However, this study found that implementing marine renewable energy in the Middle East is difficult because of significant initial capital expenditure, regulatory and legislative obstacles, and technical and operational constraints [31].
In another study in 2019, Wang et al. studied the implementation of a two-stage framework for optimising hybrid renewable energy systems at seaports. According to the findings from between 2015 and 2018, using this strategy can save annual electricity expenses by 31.9% and CO2 emissions by as much as 34.7%. The report highlights the benefits of using renewable energy at ports to improve economic and environmental sustainability [32].
Furthermore, in another recent study, according to Sadek and Elgohary in 2020, a review of renewable energy supply found that wind and solar energy may be efficiently employed for green ports. A hybrid renewable energy system is a viable solution. According to the case study, such a hybrid system can meet around 60% of the port’s total energy needs [33].
Moreover, Fossile and colleagues evaluated the ‘FITradeoff’ approach to determine the most feasible renewable energy sources for Brazilian ports in 2020. According to the survey, solar and wind energy are the most viable sources with high scores. In contrast, biomass and hydropower were ranked the last. Furthermore, the researchers discovered that adopting energy storage devices can remarkably reduce energy expenses, and this research can be presented as an excellent example of combining different renewable energies, infrastructure, and regulation in a project [34].
Recently, Sifakis et al. examined hybrid renewable energy as one of the approaches to meet energy demands while minimising GHG emissions. In the proposed technology, a hydrogen fuel cell and photovoltaic (PV) panels are employed to generate electricity and power the CI process in seaports. According to the study, using a hybrid renewable energy system can reduce GHG emissions by up to 87%, thereby providing a reliable and affordable energy source for seaports. This case can also be classified as a fusion of deploying EMS with CI infrastructures and using legislation to implement CI instead of ship energy [17].
More cases fit within this part; however, since this study is only a scoping review, only the literature that was refined above is examined. The following section explains the literature regarding the infrastructures, tools, and equipment required to mitigate the CF in ports.

3.2. Infrastructure and Equipment

The second component of the carbon reduction measures in seaports is related to the infrastructure and equipment utilised to reduce directly or indirectly reduce the CF of the ports. The categorisation in this section is based on numerous aspects and approaches. The two main categories are as follows: (i) creating new or developing current infrastructure, and (ii) CF mitigation equipment and tools and installations in seaports that use cutting-edge technologies with high efficiencies, resulting in reduced energy use and a smaller CF.
All the studies discussed in this chapter are classified accordingly into these two groups (see Table 1). In some cases, these infrastructures, tools, and installations were already in place and were simply updated, whereas in others, they were built from scratch:
Note that some infrastructure and equipment already exist and should be ecologically friendly and upgraded before attempting to build new ones. However, for the use of new infrastructures, tools, and applications, as well as for the implementation of legislation, the rules and policies, which are described in Section 3.3, are required.

3.2.1. Creating and Developing Infrastructure to Reduce CF in Seaports

The first component of the second category of CF reduction measures in seaports covers CF reduction infrastructures deployed in seaports. The measures involve two key steps: the first is to update existing infrastructures in terms of their environmental impacts, and the second is to set up new infrastructures to satisfy the main purpose, which is to overcome climate change by reducing the CF. The following paragraphs will explain some of the most essential and distinctive associated actions.
Tomás Calheiros-Cabral et al. examined the possibility of deploying marine and wind renewable energies in the Port of Leixoex in Portugal and showed that despite the high costs associated with building, operating, and attempting to prepare the infrastructure for renewable energies, doing so will be more reasonable and advantageous in terms of both the GHG emission, CF mitigation, and cost implications [35].
Moreover, the viability of employing microgrid digital twins (MGDT) in buildings inside the port regions was examined by Segovia et al. in 2022. A MGDT is a digital representation of a microgrid (MG); this digital version mirrors the behaviour of its physical counterpart by using high-fidelity models and simulation platforms and by real-time bi-directional data exchange with the real twin. The use of MGDT resulted in a 4% decrease in building energy use [38].
Wang and co-workers examined the scheduling of a green port project with comprehensive consideration of its efficiency consideration. They demonstrated that the construction of an economic and environmental seaport in the south of China with five jetties and a container terminal can reduce the use of coal (for power generation) by approximately 6527 tonnes per year and CO2 emissions by about 40.875 tonnes per year, thereby saving about 49 million Chinese Yuan. They described a green port design model for constructing a seaport to maximise port greening. The money saved could possibly pay back the entire cost of the greening project within six years [40].
Recently, Herrero et al. examined necessary port infrastructure, effectiveness of applying the onshore power supply (OPS) or CI and alternative marine power (AMP) for the Port of Santander in Spain. They reported that using renewable energies for these infrastructures can lead to a reduction of 22% in the CF of ports [36].
The possibility of constructing a small physical power plant that uses renewable energies inside a port was examined by Colarossi et al. for the Port of Ancona in Italy and with two different scenarios was approved. It was found that this action could affect up to 40% of the CF of the port, especially if PV solar cells, for which this port has high potential, are used [49].
The next section will briefly outline the new tools and equipment utilised in seaports to minimise CF.

3.2.2. Equipment, Tools, and Installation of CF Reduction Measures at Seaports

The second section of the second category of CF reduction measures in seaports examines the effects of applying equipment and tools and installation in seaports, one of which is as follows:
According to a research study by Fahdi et al. in 2019, using an electric rubber tire gantry (E-RTG) is more effective than using a rubber tire gantry (RTG) in seaports. The static results show that at Singapore port, which served as the target site for this case study, using E-RTG in conjunction with green port regulations can drastically reduce the carbon emissions by 67.79% and save energy by 86.6%. This study shows that the mentioned energy saving can have financial benefits for the port authority that can lead to E-RTG replacing the conventional RTG in a particular period [46]
Furthermore, Gutierrez-Romero et al. examined the effects of using an OPS for ships berthed in Spain’s Cartagena port in 2019 (and explored the modern renewable energy sources can power these technologies) and argued that energy-efficient systems generated on land, rather than ship generators (which were frequently two-stroke and less effective), can save energy and reduce fossil fuel consumption. Statistics showed that the OPS can reduce 10,000 tonnes of CO2 annually at Cartagena port [47].
Ding et al. reported that the use of RTG cranes in Shanghai ports has a positive influence, and hence, approval was given to replace the generational cranes with railed ones [41].
In the other study, and according to the technical and scientific studies conducted by Peiris and colleagues, the Port of Santander in Spain reduced its carbon emissions by approximately 76.78% in 2019 because of the use of an AMS. The AMS can replace the traditional mooring systems, such as ship winches and drums, which rely on ship power provided by a ship’s generators. Ship generators are two-stroke engines that consume much diesel or heavy fuel oil to generate power, and they are controlled and managed by the AMS fed by port power to reduce CO2 emissions [23].
Meanwhile, an intelligent microgrid for fishing seaports was described by Al-Zahrani et al. and the system was subsequently validated in a case study of Milford Haven Port in South Wales, UK. The findings demonstrate that offices and enterprises close to ports can meet the local electricity demands by utilising on-site PV electricity, thereby significantly lowering the CO2 emissions and associated impacts. This system can greatly enhance the CF optimisation of the port [48].
Hence, Haibo and colleagues examined the energy use and carbon emissions in seaports using consumption and emission inventories. They suggested preventative measures to reduce carbon emissions and energy use in Qingdao Port in China. Examples of the measures are using CI with solar renewable energies, which are ideal for the port’s location and can serve as a model for implementing environmentally friendly infrastructure in modern seaports [50].
Meanwhile, in a study on energy saving and emission reduction of clean energy technologies in ports, Zhu et al. addressed methods to meet the electrical needs of the Chinese seaport of Ningbo by utilising renewable energy sources. According to this study, employing renewable energy can drastically reduce energy usage in the EMS and carbon emissions at seaports [37].
Wang. et al. conducted a parallel study in which the CF levels in 30 Chinese ports were evaluated in 2020. The authors proposed the ports container distribution (PCD) approach for calculating carbon emissions, validated it, and obtained positive CO2 reduction results [44].
Tovar and Wall estimated the sustainability performance of 28 seaport organisations in Spain using the output–direction distance boundary with low output and extreme carbon emissions and applied a data envelopment analysis (DEA) for estimating emission and sailing the shortest possible distance. According to their study, carbon emissions are already 56% reduced at the current level. The emissions can be reduced by 63% if the port authorities realise adequate environmental efficiency at that port [42].
Arena et al. investigated the possibility of utilising and installing energy production systems in Italian seaports following the European 2020 strategy and the case of study was the port of Roccella Jonica in the south of Italy, which aims to harness the force of the waves in the sea and use electric vehicles for transportation within the ports. The authors reported that a significant reduction in CO2 emissions can be achieved, and this case can be a good example for the use of equipment that requires infrastructures and some legislation [39].
Note that all the facilities listed above were installed and updated in various seaports. The CF reduction measurements can be used as long as the policies and regulations allow them to be used appropriately and in coordination with the smart EMS that was explained in previous sections. However, as will be explained in the following section, some guidelines are necessary to establish a connection between effective management and appropriate and targeted power use.

3.3. Guidelines and Regulations

Owing to the 7th, 9th, 11th, and 13th goal of SDGs, green ports became especially important; these goals are related in order to obtain affordable, clean, and sustainable energy; sustainable industries; innovation and infrastructures and sustainable cities; and climate change mitigation [5].
On the other hand, the concept of a ‘green port’ is closely related to environmental integration and states that the port’s management and operations should all be in harmony with the environment [51].
The measures taken to realise green ports can be classified based on several criteria, such as the use of EMS, CI, and so on, to minimise carbon emissions during port activities. However, all these actions necessitate the implementation of specific mandatory criteria for all involved parties.
The third section of seaport CO2 reduction actions in this study states that enacting appropriate laws, standards, and regulations enables the applicable policies to connect the equipment and facilities with energy management in all stages of generation, distribution, and consumption.
In the following sections, the relevant studies are reviewed for the applications in the preceding sector and the two main categories of strategies are as follows: (i) international guidelines and regulations and (ii) national, local, and domestic guidelines and rules that are prepared and issued following the regional capabilities and seaports.

3.3.1. International Regulations and Guidelines

Table 2 lists the most significant laws related to international standards enacted from 2018 to the end of 2022. Although most laws have a long history, their implementation and reviews are continuing, and hence, they are included in the table based on their most recent revision time.
Table 2 summarises the worldwide legislation on CF mitigation in ports:
  • Maritime Pollution Regulation (MARPOL) is approved by the IMO and deals with the emissions by ships (chapter 6 of MARPOL). It has some important regulations regarding air pollution caused by ships, and its latest amendment was approved in Dec 2022 by the IMO Marine Environment Protection Committee (MEPC). The latest amendment dealt with the required carbon intensity indicator of fuels used for shipping;
  • Toolbox for Port Clean Air Programmes provide web-based guidelines to provide all ports worldwide, as well as all the stakeholders involved, with easy access to information, options, and tools that can be used to begin the planning process for addressing port-related air quality challenges while fostering commercial growth [52];
  • Ship Energy Efficiency Regulations and Related Guidelines introduced the Ship Energy Efficiency Management Plan. This plan establishes a mechanism to improve the energy efficiency of a ship in a cost-effective manner [53];
  • Clean Cargo Working Group Carbon Emissions Accounting Methodology is dedicated to improving environmental performance in container shipping by developing standardised methodologies to measure environmental impacts and easy-to-use tools that meet the needs of shippers, freight forwarders, and carriers. It enables the measurement, evaluation, and reduction in the environmental impacts [54];
  • IMO ‘s strategy to reduce GHG emissions from ships explains that the IMO adopted the first set of international mandatory measures to improve the energy efficiency of ships on 15 July 2011. IMO took further action in the past decade, including the introduction of further regulatory measures and adoption of the initial IMO GHG strategy. IMO executes a comprehensive capacity building and technical assistance programme, including a range of global projects, to support their implementation [55];
  • Carbon Management for Port and Navigation Infrastructure; World Association for Waterborne Transport Infrastructure (PIANC) Working Group, 188 on Carbon Management for Port and Navigation Infrastructure, was tasked by the PIANC to investigate the CF of activities related to the development, maintenance, and operation of navigation channels and port infrastructure, including the management of dredged material. Life cycle analysis (LCA) and other assessment methods supported this investigation and provided insights into opportunities for improving carbon management [56];
  • World Ports Climate Action Program (WPCAP) vowed to demonstrate port leadership in CO2 reduction by executing port membership in the Paris Agreement and has five groups, each comprising some ports that are working toward reducing their CO2 emissions [57];
  • The IMO 2020 regulation limits sulphur in the fuel oil of ships to a maximum of 0.50%. This regulation has been in force globally since 1 January 2020 under IMO ‘s MARPOL treaty and it proved to be beneficial for the environment and human health by reducing the amount of sulphur oxides in the air [58];
  • Climate Change Adaptation Planning for Ports and Inland Waterways aims to provide guidance to ensure the resilience of waterborne transport to climate change and to provide examples and recommendations for good practices for ports and waterways [59];
  • ESPO ’s Roadmap to implement the European Green Deal objectives in ports covers the implementation of the European Green Deal to reduce CO2 emissions from ships at anchor and in ports by at least 50% across all maritime segments by 2030 [60].
In addition, regulations such as the WPCI 2010 prepared by the International Association of Ports and Harbours (IAPH) [7], and PIANC Sustainable Port Guideline by The World Association for Waterborne Transport Infrastructure (PIANC) [59], also exist; however, since their issuance dates were beyond the purview of this research, they are not listed in Table 2.
In addition, Table 2 explains the provisions of each law and set of recommendations briefly. It is important to remember that most ports worldwide have their own methods for achieving environmental sustainability by considering the relevant capacity and capability. Some of the most current and widely used national and regional rules are described in the following section.

3.3.2. National and Local Regulations and Guidelines

Here, some important policies and standards and their impact on CF reduction in seaports are reviewed to better understand policy implementation. Fahdi et al. showed that replacing rubber cranes with an electric propulsion system to reduce energy consumption and carbon emissions at the ports in Singapore served as a good illustration of a local approach [46].
Yun et al. examined the implications of employing a port-based power source to serve ships in seaports while removing the impact of action approaches on emissions through modelling by using a quantitative simulation model of carbon emissions in 2018. The same study also claimed that carbon emissions from port operations and transport within container terminals are similar. Moreover, they discovered that reducing a ship’s speed in waterway channels from 24 to 8 knots can reduce carbon emissions by approximately 32.9% overall; this can be incorporated in practical legislation to reduce the rate in the access channels of ports while also reducing any possible ship manoeuvring accidents by the adoption of safe and controllable ship speed [43].
Meanwhile, other research conducted by Wang et al. suggested a new framework employing hybrid renewable energy technology, particularly wind energy, for seaports. Their work led to a new framework policy for generating and storing energy in a terminal port in southern China. According to this 2019 research, establishing infrastructures for generating power from renewable resources is an expensive process and requires some implementation from port authorities. However, the expense of these infrastructures will be offset by reduced fossil fuel usage through targeted scheduling and activity [32].
In 2020, the Port of Koper in Slovenia’s north Adriatic Sea, which holds a green port certificate, was examined by Twrdy et al. They also examined the management’s perspective on the sustainability of logistics in seaports. They suggested planning for seaport locations and implementing green practices in the Koper port area to help reduce port carbon emissions. Additionally, the existing situation and the sustainability of port logistics were investigated. This study demonstrated how some requirements can have a substantial impact on the ability of a seaport to reduce its CF owing to the inclusion of the green port society [45].
In 2019, Haibo et al. suggested an energy usage inventory approach for China’s Qingdao Port. This approach involves using the ‘green port’ concept and many carbon reduction strategies. This strategy may be used for other seaports using the same criteria [50].
Moreover, Ancic et al. examined the Adriatic Sea region and Croatia proposed two local and domestic guidelines, namely, the obligation to reduce vessel speed, which has a huge impact on CF mitigation and the use of solar and wind energy, both of which have good potential in the study area [61].
Furthermore, Zhu et al. examined the reduction in carbon emissions of seaports by the adoption of renewable energy technology. Using LNG greatly reduced the CO2 emission (which accounts for 77% of all GHG emissions in the world) and SO2 (indirect greenhouse gases) in seaports while increasing the overall energy consumption; nonetheless, for some Chinese seaports, the air pollution should be reduced. Zhu et al. examined the Chinese Port of Ningbo and described the results of regional seaport policies [37].
A thorough study conducted in South Korea by Lee et al. examined the implementation of mandatory ship speed reduction requirements, CI in all jetties, and preparation and application of integrated national emissions. The results show the significant impact of these three standards and guidelines to reduce the CF in seaports [62].
In addition, the environmental performance of operations of the Dublin port was analysed using a non-parametric DEA model by Djordjevic et al. in 2022. All operations were classified into land-based and marine-based activities. The DEA is a non-parametric method in which linear programming techniques are used to determine an efficiency frontier on which only efficient decision-making units are placed. Finally, they demonstrated that the CF of the Dublin port in 2020 could be reduced by 33% by applying DEA analysis [61].
In 2019, Al-Zahrani et al. conducted a study at Milford Haven Port in South Wales, UK. This study demonstrated that using intelligent microgrids can reduce carbon emissions by reducing energy demand and enhancing renewable energy sources. This example is also mentioned in the Section 3.2.2 regarding reduction equipment. Further, literature on green harbour practices was surveyed. This literature included articles that describe the principles, rules, and practices that promote the practical application of green harbour ideas. Both approaches demonstrate how local implementation positively impacts the reduction of the CF in a seaport area [48].
A similar study was conducted by Spengler et al. on the Canary Islands (Spain) from the perspective of the potential of using CI and its effect on CF mitigation. They discovered that another strategy to mitigate the hotelling of ships alongside jetties can greatly enhance port sustainability and the global vision of 2030 [63].
Another innovative and cutting-edge approach was proposed by Azarkamand et al. in 2020. They developed and explored measurement standardisation for estimating carbon emissions. This standardisation helps monitor integrated and defined criteria and reduce carbon emissions from seaports. They examined how implementing a specific standard can assist a port authority with multiple ports or can help separate port authorities to develop appropriate policies to mitigate CF via an integrated accounting system. The proposed standard is regarded as an extremely useful national standard that can also be used on an international scale [64].
Finally, Botana et al. examined CF strategies and calculations for the Port of Vigo in Spain in 2022. They contend that using a standard integrated system for calculating CF can benefit mitigation strategies and initiatives by up to 55%. Further, it can also be included as national seaport CO2 emission standards and guidelines [65].

4. Discussion

The results of this study support the actions undertaken by numerous international organisations and port authorities to combat climate change by reducing CO2 emissions.
International organisations such as the IMO, IAPH, and PIANC committed to reducing GHG emissions at ports through several initiatives. Examples include creating the WPCI working group, updating MARPOL Annex VI to include standards for preventing ship-borne air pollution, and establishing a framework to support ports in mitigating climate change.
These measures show that the CFs of many ports are being calculated and shared in recent years, and this is a positive sign regarding the efforts being made to realise green ports. However, there is still room for development.
Renewable power generation increased by about 7% in 2021 compared to 2020, which implied a record 522 terawatt-hour (TWh) increase, with wind and solar PV technologies accounting for nearly 90% of this increase. Consequent to a 0.4 percentage point increase, the share of renewables to worldwide power generation reached 28.7% in 2021 according to the recent report of the International Energy Agency [66].
The slow development of the renewables’ share was owing to global electricity demand reaching its highest level in history, as economic activity recovered from the COVID-19-related downturn and droughts in numerous places reduced hydropower generation; it is shown in Figure 8 [66].
The number of forms of renewable energy used gradually increased over the last decade, as shown in Figure 8, and this is true for seaports as well, as they have potential to generate energy from renewables. However, seaports do not seem to have sufficient renewable resources to meet the whole need for ports as industrial transportation hubs.
On the other hand, to replace renewables in power generation, there is a need for intelligent or semi-intelligent systems to store excess generated energy and to meet excess demands of power plants and to maintain a balance in this system using intelligent or semi-intelligent systems as a critical component of the implementation of EMS. Hence, most ports worldwide started to implement the EMS with the aim of reducing their CF drastically.
The CF mitigation measurements and actions in seaports can be classified into three independent but linked categories: the use of EMS, the deployment of new or updated infrastructure and equipment, and the development of guidelines and standards.
These categories can be discussed and analysed separately, but it is important to remember that they are interconnected and that none of them can be performed independently without collaboration with others. Further, legislation and equipment, in addition to infrastructure, are required for establishing EMS. To prepare these infrastructures and equipment, the responsible parties and authorities must develop standards and regulations. However, the existence of regulations without EMS and infrastructure is entirely meaningless; and finally, as shown in Figure 9, these three components are inextricably linked.
Furthermore, according to the reviewed research, EMS and CF mitigation at ports are related from two perspectives. A smart seaport employs an EMS. One of the primary components of an EMS is a smart energy network to manage and optimise energy usage using monitoring systems combining hardware and software. This system leads to CF reduction at seaports.
Conversely, the savings achieved because of reduced power consumption allow the port authority to invest in new CF mitigation measures and projects within the boundaries of the port; this interrelationship is depicted in Figure 10.
Meanwhile, the following elements were found to be problematic upon a close evaluation of the actions taken by governments, port authorities, and international, regional, and local entities to minimise carbon emissions in seaports:
  • To stop excessive and uncontrolled carbon emissions, actions should be taken to govern ship operations and those of other operators by utilising indirect control or replacing their consumption with controlled energies supplied by port authorities. However, before framing regulations to replace CI and port-controlled facilities instead of ship facilities to manage and control energy generation and consumption, the infrastructures for both land and maritime areas of a port must be ready. This requires national and international collaborations between all involved parties, as well as the preparation of some financial assistance if required; subsequently, the effectiveness of these actions should be evaluated. It was shown that using alternative equipment in ports rather than ship equipment is a promising and workable solution as per preliminary tests. For instance, AMS and CI are more effective because they only generate energy when needed. If excess energy is generated, it can be stored, but ships lack the technology to do so at present [23];
  • It is necessary to set up supporting infrastructure to use appropriate machinery at ports. Such infrastructure incurs high expenses (for example, the case of installing an AMS at Chennai port in India) and the port management can afford them by adopting the right economic and environmental policies. Further, the GHG emissions and CF should be appropriately limited for the existing infrastructure and equipment in the port (e.g., the case of utilising E-RTG at Singapore port, which can deploy them);
  • Providing land-based energy for ships may be an appropriate option for decreasing carbon emissions from the equipment and facilities that must be fixed and operated at ports. This is part of an ongoing EMS implementation. However, it cannot be deemed an action for carbon emission reduction if land-based energy derived from fossil fuels is employed;
  • Special attention should be paid to the efficiency of the port, traffic, cargo types, and amounts. Evaluation of the efficiency of the systems and equipment installed at seaports to reduce CF showed that LNG ships, tankers, and bulk carriers produce the most carbon and GHGs in ports because of the use of internal pumps, cranes, and facilities that require the deployment of internal generators, considering that these generator operations are not under the control of port authorities to comply with environmental regulations [67]. As the first solution, legislation can be formulated to shorten the hotelling of such ships at ports. The loading/discharging of cargo facilities and equipment for port services operations must be addressed. Finally, the hybrid use of all options is required to minimise emissions from ports;
  • Before analysing macro-reduction operations, it is necessary to quantify carbon using the LCA to understand better the variables contributing to the continual expansion of CF in ports;
  • Lastly, note that port management systems can perform routine inspections based on the state of all buildings, vehicles, and other items at a port. The efficiency of these procedures was thoroughly examined at several ports based on local, national, and even international standards to reduce emissions.
The results of this study also show a significant association between the EMS and the volume of global air pollution produced by ports using an EMS. The impact of this link is more evident on large scales, such as industrial sites and ports because for the performance of services and industrial productions, per capita energy consumption is more relevant than the volume of activity or geographic area.

5. Conclusions

For energy management at seaports to combat climate change by reducing carbon emissions, the fundamental concept was obtained by combining the definitions of ‘seaports’ and ‘EMS’. According to this concept, the EMS aims to manage energy generation, transfers, distribution, and consumption. When necessary, it uses the storage system. In the case of excessive demand, it connects directionally between traditional production or balances the whole system.
However, a significant share (71%) of the world’s energy output still relies on fossil fuels. Before renewable resources sufficiently replace fossil fuels, the EMS must continue to concentrate on boosting productivity and efficiency of energy generation, transmission, distribution, and consumption by using the whole possible infrastructure of an intelligent network [30].
The EMS uses smart energy networks that effectively balance energy supply and demand in ports where renewable energies are utilised as efficient energy production sources. If the amount of energy generated by the renewable resources exceeds the energy demand at smart ports, the excess energy will be stored for later consumption to prevent a shortfall. If there is an excessive demand, a hybrid resource using traditional and renewable sources will be used to supply the energy in a standard manner.
Finally, implementing smart energy networks and management systems will help compensate for the energy produced by fossil fuels and reduce the amount of energy to be generated from these sources.
If the port authority makes a greater investment, it can establish more state-of-the-art tools, equipment, and infrastructures. These more sophisticated tools and equipment can lead to more efficient actions against climate change and the CF can be reduced. Hence, the policies and the supply of funds allocated by these policies determine the possibility of success.
In addition, while creating rules, standards, and guidelines, the local, regional, national, and international entities, authorities, and bodies must also respect the executive commitment, which necessitates time, attention, monitoring, and oversight. The review of this study indicates that there are sufficient rules and regulations in place; these regulations need to be efficiently implemented.
This research raises the following question for future work: ‘Can we trust that the steps taken by ports to lessen their CF are adequate to reach sustainability objectives’? From the actual information and findings, one can answer that they are inadequate because if ports remain some of the most prominent economic centres in a region or country, they will always take priority over other concerns and the importance of environmental issues cannot be the only factor considered in decision-making.
Implementing strategies, establishing the necessary infrastructure, and ensuring the availability of required equipment are all essential to reduce the CF of ports. Much work still remains to be conducted before realising a green world and the sovereignty of regional, national, and international institutions is in jeopardy.
The limitations of this work include the scoping review timeline, which is limited to a time range from 2018 to earlier than 2023. It focuses on literature on the same area, which limits the review of this research scope. Various components and projects changed because of the COVID-19 pandemic, international disputes, economic issues, and other limitations and alterations in global trade.
Future review works can concentrate on initiatives including the development of infrastructures, instruments, and procedures, as well as other components that influence port CF mitigation methods. This will help consider the recent environmental and economic situations of ports to deal with restrictions and move toward the vision of sustainable ports by 2030 and finally 2050.

Author Contributions

Conceptualisation, methodology, formal analysis, investigation, resources, data curation, validation, writing—original draft preparation, project administration, S.B.I.Z.; visualisation, writing—review and editing, S.B.I.Z. and C.L.G.-R.; supervision, J.S.L.G. and M.D.E.; co-mentoring, G.F.-S.; funding acquisition, C.L.G.-R. All authors have read and agreed to the published version of the manuscript.

Funding

The APC was funded by Fondo de Apoyo a Publicaciones (FAP), Tecnológico de Monterrey, México.

Institutional Review Board Statement

Not applicate.

Informed Consent Statement

Not applicable.

Data Availability Statement

The qualitative data regarding the scoping review presented in this study are available on request from the corresponding authors (S.B.I.Z. and C.L.G.-R.).

Acknowledgments

The authors wish to acknowledge the technical and financial support of Tecnológico de Monterrey, Mexico, in the production of this work.

Conflicts of Interest

The authors declare no conflict of interest. The funders had no role in the design of the study, in the collection, analysis, or interpretation of data, in the writing of the manuscript, or in the decision to publish the results.

References

  1. Global Greenhouse Gas Emissions: 1990–2020 and Preliminary 2021 Estimates|Rhodium Group. Available online: https://rhg.com/research/global-greenhouse-gas-emissions-2021/ (accessed on 11 April 2023).
  2. International Maritime Organization. Fourth IMO GHG Study 2020. 2020. Available online: https://www.imo.org/en/OurWork/Environment/Pages/Fourth-IMO-Greenhouse-Gas-Study-2020.aspx (accessed on 2 May 2023).
  3. UNCTAD. Decarbonizing the Maritime Sector: Mobilizing Coordinated Action in the Industry Using an Ecosystems Approach. Available online: https://unctad.org/news/decarbonizing-maritime-sector-mobilizing-coordinated-action-industry-using-ecosystems-approach (accessed on 11 April 2023).
  4. Alzahrani, A.; Petri, I.; Rezgui, Y.; Ghoroghi, A. Decarbonisation of seaports: A review and directions for future research. Energy Strat. Rev. 2021, 38, 100727. [Google Scholar] [CrossRef]
  5. United Nation Department of Economic and Social Affairs. Sustainable Development Goals (SDGs). Available online: https://www.globalgoals.org/goals/ (accessed on 11 April 2023).
  6. International Maritime Organization. MARPOL. 2005. Available online: https://www.imo.org/en/About/Conventions/Pages/International-Convention-for-the-Prevention-of-Pollution-from-Ships-(MARPOL).aspx (accessed on 11 April 2023).
  7. World Ports Climate Initiative; International Maritime Organization; Port of Los Angeles. Carbon Footprinting Guidance for Ports. 2010. Available online: https://sustainableworldports.org/wp-content/uploads/Carbon_Footprinting_Guidance_Document.pdf (accessed on 27 April 2023).
  8. A European Green Deal|European Commission. Available online: https://ec.europa.eu/info/strategy/priorities-2019-2024/european-green-deal_en (accessed on 10 November 2021).
  9. Global CO2 Emissions by Sector 2021|Statista. Available online: https://www.statista.com/statistics/276480/world-carbon-dioxide-emissions-by-sector/ (accessed on 11 April 2023).
  10. World Resources Institute. Greenhouse Gas Protocol. 2004. Available online: https://ghgprotocol.org/ (accessed on 27 April 2023).
  11. European Federation of Inland Ports (EFIP). EU Ports’ Climate Performance. 2022. Available online: https://www.transportenvironment.org/wp-content/uploads/2022/02/2202_Port_Rankings_briefing-1.pdf (accessed on 2 May 2023).
  12. Alzahrani, A.; Petri, I.; Rezgui, Y. Analysis and simulation of smart energy clusters and energy value chain for fish processing industries. Energy Rep. 2020, 6, 534–540. [Google Scholar] [CrossRef]
  13. Economist Intelligence Unit. Energy Transition Will Move Slowly over the Next Decade—Economist Intelligence Unit. 2022. Available online: https://www.eiu.com/n/energy-transition-will-move-slowly-over-the-next-decade/ (accessed on 12 April 2023).
  14. Sdoukopoulos, E.; Boile, M.; Tromaras, A.; Anastasiadis, N. Energy Efficiency in European Ports: State-of-Practice and Insights on the Way Forward. Sustainability 2019, 11, 4952. [Google Scholar] [CrossRef]
  15. ISO 50001; Energy Management. ISO: Geneva, Switzerland, 2018. Available online: https://www.iso.org/iso-50001-energy-management.html (accessed on 11 April 2023).
  16. EN 16001; Energy Management Systems, Requirements with Guidance for Use. Sustainable Energy Ireland: Dublin, Ireland, 2009.
  17. Sifakis, N.; Vichos, E.; Smaragdakis, A.; Zoulias, E.; Tsoutsos, T. Introducing the cold-ironing technique and a hydrogen-based hybrid renewable energy system into ports. Int. J. Energy Res. 2022, 46, 20303–20323. [Google Scholar] [CrossRef]
  18. Molavi, A.; Lim, G.J.; Race, B. A framework for building a smart port and smart port index. Int. J. Sustain. Transp. 2020, 14, 686–700. [Google Scholar] [CrossRef]
  19. Kenzhina, M.; Kalysh, I.; Ukaegbu, I.; Nunna, S.K. Virtual Power Plant in Industry 4.0: The Strategic Planning of Emerging Virtual Power Plant in Kazakhstan. In Proceedings of the International Conference on Advanced Communication Technology, ICACT, PyeongChang, Republic of Korea, 17–20 February 2019; pp. 600–605. [Google Scholar] [CrossRef]
  20. Russo, F.; Musolino, G. Emerging ICT in port operations: Case studies. Trends Marit. Technol. Eng. 2022, 2, 91–96. [Google Scholar] [CrossRef]
  21. Faheem, M.; Shah, S.; Butt, R.; Raza, B.; Anwar, M.; Ashraf, M.; Ngadi, M.; Gungor, V. Smart grid communication and information technologies in the perspective of Industry 4.0: Opportunities and challenges. Comput. Sci. Rev. 2018, 30, 1–30. [Google Scholar] [CrossRef]
  22. Sarabia-Jacome, D.; Lacalle, I.; Palau, C.E.; Esteve, M. Enabling Industrial Data Space Architecture for Seaport Scenario. In Proceedings of the IEEE 5th World Forum on Internet of Things, WF-IoT 2019, Limerick, Ireland, 15–18 April 2019; pp. 101–106. [Google Scholar] [CrossRef]
  23. Piris, A.O.; Díaz-Ruiz-Navamuel, E.; Pérez-Labajos, C.A.; Chaveli, J.O. Reduction of CO2 emissions with automatic mooring systems. The case of the port of Santander. Atmos. Pollut. Res. 2018, 9, 76–83. [Google Scholar] [CrossRef]
  24. Bakar, N.N.A.; Guerrero, J.M.; Vasquez, J.C.; Bazmohammadi, N.; Yu, Y.; Abusorrah, A.; Al-Turki, Y.A. A review of the conceptualization and operational management of seaport microgrids on the shore and seaside. Energies 2021, 14, 7941. [Google Scholar] [CrossRef]
  25. Mac Kinnon, M.; Razeghi, G.; Samuelsen, S. The role of fuel cells in port microgrids to support sustainable goods movement. Renew. Sustain. Energy Rev. 2021, 147, 111226. [Google Scholar] [CrossRef]
  26. Ahmad, M.W.; Reynolds, J.; Rezgui, Y. Predictive modeling for solar thermal energy systems. J. Clean. Prod. 2018, 203, 810–821. [Google Scholar] [CrossRef]
  27. Hoang, A.T.; Foley, A.M.; Nižetić, S.; Huang, Z.; Ong, H.C.; Ölçer, A.I.; Pham, V.V.; Nguyen, X.P. Energy-related approach for reduction of CO2 emissions: A critical strategy on the port-to-ship pathway. J. Clean. Prod. 2022, 355, 131772. [Google Scholar] [CrossRef]
  28. Zhang, Y.; Liang, C.; Shi, J.; Lim, G.; Wu, Y. Optimal Port Microgrid Scheduling Incorporating Onshore Power Supply and Berth Allocation under Uncertainty. Appl. Energy 2022, 313, 118856. [Google Scholar] [CrossRef]
  29. Mehigan, L.; Deane, J.; Gallachóir, B.; Bertsch, V. A review of the role of distributed generation (DG) in future electricity systems. Energy 2018, 163, 822–836. [Google Scholar] [CrossRef]
  30. International Energy Agency. Global Energy Review 2021. 2022. Available online: https://www.iea.org/reports/global-energy-review-2021/renewables (accessed on 17 October 2022).
  31. Kandiyil, D.R. Use of Marine Renewable Energy in Ports of Middle East: A Step toward Sustainable Ports. In Advances in Science, Technology & Innovation; Springer: Berlin/Heidelberg, Germany, 2022; pp. 349–356. [Google Scholar] [CrossRef]
  32. Wang, W.; Peng, Y.; Li, X.; Qi, Q.; Feng, P.; Zhang, Y. A two-stage framework for the optimal design of a hybrid renewable energy system for port application. Ocean Eng. 2019, 191, 106555. [Google Scholar] [CrossRef]
  33. Sadek, I.; Elgohary, M. Assessment of renewable energy supply for green ports with a case study. Environ. Sci. Pollut. Res. 2020, 27, 5547–5558. [Google Scholar] [CrossRef] [PubMed]
  34. Fossile, D.K.; Frej, E.A.; da Costa, S.E.G.; de Lima, E.P.; de Almeida, A.T. Selecting the most viable renewable energy source for Brazilian ports using the FITradeoff method. J. Clean. Prod. 2020, 260, 121107. [Google Scholar] [CrossRef]
  35. Calheiros-Cabral, T.; Majidi, A.G.; Ramos, V.; Giannini, G.; Rosa-Santos, P.; Taveira-Pinto, F. Development and Assessment of a Hybrid Breakwater-Integrated Wave Energy Converter. Int. Mar. Energy J. 2022, 5, 281–291. [Google Scholar] [CrossRef]
  36. Herrero, A.; Piris, A.O.; Diaz-Ruiz-Navamuel, E.; Gutierrez, M.A.; Lopez-Diaz, A.-I. Influence of the Implantation of the Onshore Power Supply (OPS) System in Spanish Medium-Sized Ports on the Reduction in CO2 Emissions: The Case of the Port of Santander (Spain). J. Mar. Sci. Eng. 2022, 10, 1446. [Google Scholar] [CrossRef]
  37. Zhu, L.; Qin, C.; Peng, C. Analysis on energy saving and emission reduction of clean energy technology in ports. IOP Conf. Ser. Earth Environ. Sci. 2018, 121, 052060. [Google Scholar] [CrossRef]
  38. Segovia, E.; Short, M.; Hassan, F.; Coleman, D.; Walker, M. A feasibility study on emissions reductions and demand response in a seaport building. In Proceedings of the 26th International Conference on Circuits, Systems, Communications and Computers, CSCC 2022, Crete, Greece, 19–22 July 2022; Institute of Electrical and Electronics Engineers Inc.: Piscataway, NJ, USA, 2022; pp. 188–195. [Google Scholar] [CrossRef]
  39. Arena, F.; Malara, G.; Musolino, G.; Rindone, C.; Romolo, A.; Vitetta, A. From green-energy to green-logistics: A pilot study in an Italian port area. Transp. Res. Procedia 2018, 30, 111–118. [Google Scholar] [CrossRef]
  40. Wang, W.; Huang, L.; Gu, J.; Jiang, L. Green port project scheduling with comprehensive efficiency consideration. Marit. Policy Manag. 2019, 46, 967–981. [Google Scholar] [CrossRef]
  41. Ding, Y.; Yang, Y.; Heilig, L.; Lalla-Ruiz, E.; Voss, S. Deployment and retrofit strategy for rubber-tyred gantry cranes considering carbon emissions. Comput. Ind. Eng. 2021, 161, 107645. [Google Scholar] [CrossRef]
  42. Tovar, B.; Wall, A. Environmental efficiency for a cross-section of Spanish port authorities. Transp. Res. Part D Transp. Environ. 2019, 75, 170–178. [Google Scholar] [CrossRef]
  43. Yun, P.; Li, X.; Wang, W.; Liu, K.; Li, C. A simulation-based research on carbon emission mitigation strategies for green container terminals. Ocean Eng. 2018, 163, 288–298. [Google Scholar] [CrossRef]
  44. Wang, L.; Peng, C.; Shi, W.; Zhu, M. Carbon dioxide emissions from port container distribution: Spatial characteristics and driving factors. Transp. Res. Part D Transp. Environ. 2020, 82, 102318. [Google Scholar] [CrossRef]
  45. Twrdy, E.; Zanne, M. Improvement of the sustainability of ports logistics by the development of innovative green infrastructure solutions. Transp. Res. Procedia 2020, 45, 539–546. [Google Scholar] [CrossRef]
  46. Fahdi, S.; Elkhechafi, M.; Hachimi, H. Green Port in Blue Ocean: Optimization of Energy in Asian Ports. In Proceedings of the 2019 International Conference on Optimization and Applications, ICOA 2019, Kenitra, Morocco, 25–26 April 2019; pp. 1–4. [Google Scholar] [CrossRef]
  47. Gutierrez-Romero, J.E.; Esteve-Pérez, J.; Zamora, B. Implementing Onshore Power Supply from renewable energy sources for requirements of ships at berth. Appl. Energy 2019, 255, 113883. [Google Scholar] [CrossRef]
  48. Alzahrani, A.; Petri, I.; Rezgui, Y. Modelling and implementing smart micro-grids for fish-processing industry. In Proceedings of the 2019 IEEE International Conference on Engineering, Technology and Innovation (ICE/ITMC), Valbonne Sophia-Antipolis, France, 17–19 June 2019. [Google Scholar] [CrossRef]
  49. Colarossi, D.; Lelow, G.; Principi, P. Local energy production scenarios for emissions reduction of pollutants in small-medium ports. Transp. Res. Interdiscip. Perspect. 2022, 13, 100554. [Google Scholar] [CrossRef]
  50. Haibo, L.; Wen, L.; Xiaowei, S. Study on Port Energy Consumption Inventory and Monitoring Technology. In Proceedings of the 2019 5th International Conference on Transportation Information and Safety (ICTIS), Liverpool, UK, 14–17 July 2019; pp. 298–302. [Google Scholar] [CrossRef]
  51. ISO—ISO/TR 14069:2013; Greenhouse Gases—Quantification and Reporting of Greenhouse Gas Emissions for Organizations—Guidance for the Application of ISO 14064-1. ISO: Geneva, Switzerland, 2013. Available online: https://www.iso.org/standard/43280.html (accessed on 19 October 2022).
  52. International Associations of Ports and Harbors and International Maritime Organization. Port Emissions Toolkit No.2. 2018. Available online: https://gmn.imo.org/wp-content/uploads/2018/10/port-emissions-toolkit-g2-online-1.pdf (accessed on 11 April 2023).
  53. International Maritime Organization and Green Voyage 2050 Project Coordination Unit. Energy Efficiency Measures. 2022. Available online: https://www.imo.org/fr/ourwork/environment/pages/technical-and-operational-measures.aspx (accessed on 19 April 2023).
  54. Angie Farrag Thbault. CCWG C.F Methodology. 2015. Available online: https://www.bsr.org/files/clean-cargo/BSR-CCWG-Carbon-Emissions-Methodology.pdf (accessed on 11 April 2023).
  55. International Maritime Organization. IMO Strategy. 2018. Available online: www.theicct.org/sites/default/files/publications/IMO_GHG_StrategyFlnalPolicyUpdate042318.pdf (accessed on 4 January 2023).
  56. Water Born Transport Asso. PIANC. Available online: https://www.pianc.org/publications/envicom/wg188 (accessed on 25 December 2022).
  57. Ports and Harbors Asso. WPCAP, WPS Program. 2019. Available online: https://sustainableworldports.org/wpcap/ (accessed on 25 December 2022).
  58. International Maritime Organization. IMO 2020 Sulphur Limit Implementation—Carriage Ban Enters into Force. 2016. Available online: https://www.imo.org/en/MediaCentre/PressBriefings/pages/34-IMO-2020-sulphur-limit-.aspx (accessed on 16 April 2023).
  59. Pianc. Available online: https://www.pianc.org/publications/envicom/wg178 (accessed on 10 May 2023).
  60. European Port Org. ESPO’s Roadmap. 2020. Available online: www.espo.be/media/ESPO%20Green%20Deal20%position%20paper%20Green%20Deal-FINAL.pdf (accessed on 25 December 2022).
  61. Ančić, I.; Perčić, M.; Vladimir, N. Alternative power options to reduce carbon footprint of ro-ro passenger fleet: A case study of Croatia. J. Clean. Prod. 2020, 271, 122638. [Google Scholar] [CrossRef]
  62. Lee, H.; Pham, H.T.; Chen, M.; Choo, S. Bottom-Up Approach Ship Emission Inventory in Port of Incheon Based on VTS Data. J. Adv. Transp. 2021, 2021, 5568777. [Google Scholar] [CrossRef]
  63. Spengler, T.; Tovar, B. Potential of cold-ironing for the reduction of externalities from in-port shipping emissions: The state-owned Spanish port system case. J. Environ. Manag. 2021, 279, 111807. [Google Scholar] [CrossRef] [PubMed]
  64. Azarkamand, S.; Ferré, G.; Darbra, R. Calculating the Carbon Footprint in ports by using a standardized tool. Sci. Total Environ. 2020, 734, 139407. [Google Scholar] [CrossRef]
  65. Botana, C.; Fernández, E.; Feijoo, G. Towards a Green Port strategy: The decarbonisation of the Port of Vigo (NW Spain). Sci. Total Environ. 2023, 856, 159198. [Google Scholar] [CrossRef]
  66. Renewable Electricity—Analysis—IEA. Available online: https://www.iea.org/reports/renewable-electricity (accessed on 13 April 2023).
  67. Psaraftis, H.N.; Kontovas, C.A. Decarbonization of Maritime Transport: Is There Light at the End of the Tunnel? Sustainability 2020, 13, 237. [Google Scholar] [CrossRef]
Figure 1. Worldwide share of 2020 net GHG emissions retrieved from [1] (in percentage).
Sustainability 15 08558 g001
Figure 2. Methodology phases PRISMA-ScR literature review steps.
Sustainability 15 08558 g002
Figure 3. CO2 emission by sectors in the last decade is based on ‘Statista’ report [9].
Sustainability 15 08558 g003
Figure 4. Carbon reduction actions at seaports (author’s work).
Sustainability 15 08558 g004
Figure 5. Distributed energy resources (DER) components of an energy management system (EMS) (author’s work).
Sustainability 15 08558 g005
Figure 6. Intelligent network in a smart seaport (author’s work).
Sustainability 15 08558 g006
Figure 7. Microgrid system in a smart seaport (author’s work).
Sustainability 15 08558 g007
Figure 8. Share of renewable energies over the past decade (2011–2021) based on a report by the International Energy Agency [66].
Sustainability 15 08558 g008
Figure 9. Interrelation of different categories of carbon footprint (CF) mitigation actions for seaports (author’s work).
Sustainability 15 08558 g009
Figure 10. Interrelation between a smart network system and CF mitigation (author’s work).
Sustainability 15 08558 g010
Table 1. Studies discussed in this section.
Creating and Developing Infrastructure to
Reduce Carbon Footprint in Seaports
Equipment, Tools, and Installation of Carbon Footprint Reduction in Seaports
Subject: InfrastructureAuthorSubject: Equipment and ToolsAuthorSubject: InstallationAuthor
Possibility of deploying marine and renewable wind energies convertors in portTomás
Calheiros Cabral
et al., 2022 [35]
Applying onshore power
supply (OPS) or CI and alternative marine power (AMP)
in ports
Alvaro Herrero
et al., 2022 [36]
Use of clean energy
and reduce energy consumption.
Zhu et al.,
2018 [37]
Employing microgrid digital twins (MGDT) in ports buildingEdgar
Segovia et al.,
2022 [38]
Ship’s Automatic Mooring System (AMS).Ortega et al.,
2018 [23]
Installing energy production systems and electric vehicles for transportation.Arena et al.,
2018 [39]
Green port design model for building a seaport.W. Wang et al., 2019 [40]Utilising rubber-tired gantry cranes (RTGs) in Shanghai port.Yi Ding et al.,
2021 [41]
The output-direction distance boundary.Tovar et al.,
2019 [42]
Intelligent network (ITC) in a seaport and intelligent management in smart ports.Molave et al., 2020 [18]Simulation port-based power source to supply ships in seaports.Yun et al.,
2018 [43]
Ports Container Distribution (PCD) method for computing carbon emissions.Wang et al.,
2020 [44]
Plans for seaport locations and implementing green practices.Twrdy et al., 2020 [45]Electric Rubber Tire
Gantry (E-RTG)
Fahdi et al.,
2019 [46]
Implementing Onshore
Power Supply from 1037
renewable energy sources for requirements of ships at berth.
Gutierrez et al., 2019 [47]
Intelligent microgrid for fishing seaports using Photovoltaic (PV) electricity generated on-site.Alzahrani et al., 2019 [48]
Table 2. Overview of international legislation on reducing carbon emissions and climate change at seaports and in maritime industries.
NoName of RegulationYearApproving OrganisationSummary of Performance
1Maritime Pollution Regulation (MARPOL) [6].2005
(Last revision 2022)
International Maritime
Organisation
(IMO).
By adding Annex VI to MARPOL in 1997, these rules were introduced to limit air pollution from ships.
2Toolbox for Port Clean Air Programs [52].2011
(Last revision 2018)
International Association
of Ports and
Harbours (IAPH).
The “IAPH Toolbox for Port Clean Air Programs” Web-based guideline aims to give all ports worldwide and all stakeholders involved easy access to information, choices, and tools that may be utilised to start the planning process to address port-related air quality challenges while fostering commercial growth.
3Ship Energy Efficiency Index Regulations and Related Guidelines [53].2011
(Last revision 2020)
International Maritime
Organisation
(IMO).
The most crucial technological measure for new ships is the EEDI, which promotes using more energy-efficient (lower polluting) equipment and engines.
4Clean Cargo Working Group Carbon Emissions Accounting Methodology [54].2015
(Last revision 2019)
The Clean Cargo
Working Group
(CCWG).
This project created tools for calculating the carbon footprint of a single or entire approach in the logistics chain.
5IMO, strategy to reduce GHG emissions from ships [55].2018
(Last revision 2021)
Marine Environment
Protection Committee
(MEPC 72).
This is the IMO strategy for reducing GHG emissions from ships adopted.
6Carbon Management for Port and Navigation Infrastructure [56].2019PIANC’s Working
Group 188.
Including dredged material management, this investigated the C.F. of port infrastructure and navigation channel activities.
7World Ports Climate Action Program (WPCAP) [57].2019
(Last revision 2021)
The World Ports
Sustainability Program (WPSP).
This vowed to demonstrate Port leadership in CO2 reduction by port membership in the Paris Agreement.
8IMO 2020 regulation [58].DEC 2019International Maritime
Organisation (IMO).
The regulation limits the sulphur content in marine fuels to 0.5% by mass, down from the previous limit of 3.5%.
9Climate Change Adaptation Planning for Ports and Inland Waterways [59].2020PIANC’s Working
Group 178.
This produced a technical guidance document to aid in adapting sea transportation to climate change.
10ESPO’s Roadmap to implement the European Green Deal objectives in ports [60].2020European Sea Ports
Organisation (ESPO).
The European Green Deal calls for a reduction in CO2 emissions from ships at anchor and ports of at least 50% across all maritime segments by 2030.
Disclaimer/Publisher’s Note: The statements, opinions and data contained in all publications are solely those of the individual author(s) and contributor(s) and not of MDPI and/or the editor(s). MDPI and/or the editor(s) disclaim responsibility for any injury to people or property resulting from any ideas, methods, instructions or products referred to in the content.

