Abstract
The Lower Mekong Basin (LMB) is a subsidiary region of the Mekong River, with approximately 50 million people directly dependent on the river for livelihood and economic activities. However, communities in the region are increasingly exposed to multiple hazards that have significant direct and indirect impacts on their livelihoods. To implement efficient risk management strategies, it is important to understand the interlinkages between the different dimensions and factors that influence livelihood security and resilience in such communities. Through a literature review and expert workshop, this paper studies the multi-hazard scenario and impacts in the LMB region and the interlinkages between livelihoods and resilience in the LMB communities. The paper consolidates these findings and proposes a localized assessment framework that can be used by stakeholders in decision-making process. Floods and droughts were identified as primary natural hazards, while a multi-hazard assessment highlighted a wide spatial variation in the hazard levels across the region. The primary impacts of such hazards are on the agricultural communities dependent on the basin’s ecosystem and natural resources for their livelihoods. A holistic framework has been proposed to measure the multi-hazard livelihood security and resilience in LMB communities that can be used by government authorities and development partners in planning and implementing mitigation and preparedness activities to manage and reducing the risk of hazards.
1. Introduction
The Mekong River is the 11th longest river in the world and has a diversified socio-ecological system [1]. It originates in the Tibetan Plateau and flows through six countries on its way to the South China Sea. It has a total drain catchment area of 795,000 sqkm. and 76% of its total annual flow of 460 billion cubic meters is received during the tropical monsoon season, between July and October [1]. Geographically, the basin is divided into two major sections: the Upper Mekong Basin (UMB) and the Lower Mekong Basin (LMB) (Figure 1a). The southern section of the basin, the LMB, includes Lao PDR, Thailand, Cambodia, and Vietnam. Approximately sixty five million people reside within the LMB’s boundaries, and approximately 50 million people are directly dependent on the river for socio-economic and livelihood activities. The river basin has a profound influence on the socio-cultural, economic, and administrative aspects of the communities, and has been regarded as a valuable resource for a long time [2,3,4].
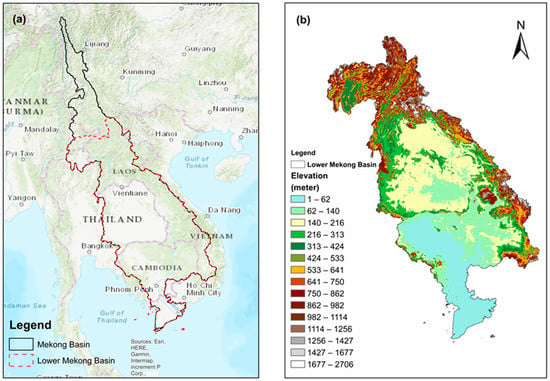
Figure 1.
(a) The geographical map of the Mekong River basin showing the two parts: Upper Mekong Basin (black boundary line) and (red boundary line), (b) Digital Elevation Model showing the topographical variation in the LMB (30 m resolution).
The LMB lies between 8.25 and 22.50° N latitude and 97 and 110° E longitude, covering 76% of the basin’s entire area and 4,900 km of the Mekong River Basin length. The terrain of the LMB is not geographically homogenous (Figure 1b) and is characterized by high hills and deep valleys. The LMB includes the Northern Highlands, Khorat Plateau, Tonle Sap Basin, and the Mekong Delta as the four physiographic zones. The region that is very similar to a plain is situated in Thailand, Cambodia, and the Vietnamese Mekong region; it has an altitude lower than 250 m from mean sea level, and the high land areas cover northern Thailand and Lao PDR.
Changing environmental and social-ecological systems in the LMB pose incremental threats to the community and infrastructures, especially the agriculture and aquaculture systems [5]. Recurring and unpredictable impacts of floods and droughts in LMB are pushing the communities to more economic and socially vulnerable conditions [1,5]. Paradoxically, although large floods, such as those that occurred in 2000 or 2011, result in considerable economic and social damages [1], flooding is the backbone of agricultural production in the region. Moderate floods, commonly perceived as “good floods” by the local population, bring various benefits, such as reduction in soil acidity; removal of residual pesticides and other pollutants in paddy fields; an immense wealth of wild fish in the rivers, channels and inundated floodplains; and essential nutrients through deposited sediments.
Growing exposure of people, property, and infrastructure to the risk of disasters in recent decades has led to a paradigm shift in disaster management from the response-centric approach to the risk-reduction approach through international frameworks, such as the Hyogo Framework of Action, Sendai Framework for Disaster Risk Reduction, and Sustainable Development Goals (SDGs). Understanding the multi-hazard impacts on the livelihood system will help generate a framework for livelihood security, which can support adaptation strategies by minimizing the risk of multiple and cascading hazards for resilient communities [6].
Hence, this study aims to study the multi-hazard scenario and its impacts and to understand the livelihood security and resilience perspectives of the communities in the LMB. It studies the profile of hydrological hazards (flood and drought) and its impacts on primary livelihoods in the LMB. The paper consolidates the fragmented concepts and evidence of multi-hazard livelihood security and resilience in the LMB by established theoretical principles and proposes an integrated and holistic framework for assessing livelihood security and resilience in the LMB communities that can be used by stakeholders for decision-making and interventions.
2. Literature Review
2.1. Multi-Hazard Vulnerability and Risk in the LMB
The communities in the LMB are exposed to multiple hazards, mostly hydrometeorological and climatological [7]. Several studies [8,9,10] show that the exposure of communities located in the LMB to hydrometeorological and climatological hazards are increasing. In addition, anthropogenic actions, such as infrastructure development, river damming, pollution, and encroachment are further pushing the LMB toward the risk zone [2]. Scholars [11] have also discussed the cascading impact of anthropogenic activity and its direct impact on the characteristics of the river system in LMB. Furthermore, climate change is expected to further stress the LMB region’s ecosystems; Bui et al. [6] studied the climate change impact in Tien Giang province of Vietnam and identified that drought levels would increase in the province in the future, while the adaptation levels of the communities were only moderate.
The Mekong River plays a vital role in the region due to its direct contribution to several environmental, political, and economic development phenomena [3]. Most importantly, it is linked with people’s livelihood, as agriculture and fisheries are the region’s primary sources of income and economy [12]. It is essential to understand that a community’s vulnerability to hazards is primarily influenced by rising poverty, lack of capacities, and a heavy reliance on the environment for its livelihood [13]. This indicates that hydrometeorological and climatological hazards have become a prime threat to the environment, lives, and livelihood of people residing in the LMB. Zhang et al. [14] showed that significant differences exist in the spatial distributions of climatological hazard and vulnerability in the LMB and have also pinpointed some vulnerable areas. On the other hand, as an adaptation approach, people are seeking alternative options for livelihood and are migrating, further unbalancing societal functioning [13].
Morton and Olson [4] discussed the productive Mekong ecological system and how the tropical climate has supported rural livelihoods, human civilizations, and empires. Unfortunately, the change in the region’s environment over the last few decades due to deforestation, increased river damming, urbanization, growing human population, and natural disasters [15] have directly affected the livelihood security and resilience of the people dependent on the river. It is also evident that rapid urbanization and economic development are pushing the human settlement in the basin catchment area into more vulnerable conditions [13,16]. In addition, the increasing frequency of natural hazards and potential impacts of climate change are further exacerbating the risk [17].
The LMB is economically active and highly prone to climate and rapid socio-economic changes, posing challenges to hazard-risk management [9,10]. The Mekong River Commission (MRC) and its member countries (Cambodia, Lao PDR, Thailand, and Vietnam) have made significant scientific advances in sustainable water resource management. However, there are policy and implementation steps that must still be achieved, and the current governance and institutional settings are becoming a key challenge because of weak cooperation, competing management goals, and slow response to new problems [18,19]. As a transboundary river basin shared by four countries, it is a source of many small and large-scale conflicts and poses several challenges in transboundary water governance in resilience building [3,13]. Significant public–private investments and projects have been implemented along the river basin to develop and modernize the LMB countries, grow national economies, raise incomes, and ensure access to clean water and electricity [20]. While these changes benefited some sectors and communities, they harmed the livelihoods of many rural people [5].
With the changing phenomena in the climate and increasing hydrological and meteorological hazards, farmers in the region have started considering agriculture as an uncertain livelihood option [21]. Nguyen and Sean [13] show that young farmers often opt to migrate for the short or long term since farming does not meet their fundamental human needs, such as physiological, safety, social, self-worth, and self-actualization. Another important aspect is that the LMB wetlands are important biodiversity hotspots that influence the region’s economy, society, and culture. However, these wetlands have undergone significant changes due to increased regional anthropogenic activities, global climate change, and sea-level rise [22]. Thus, understanding the emerging risk, the Mekong River Commission has adopted several strategies and plans of action, such as the Basin Development Strategy and Drought Management Strategy, as regional strategies that address the region’s urgent need to address the growing risk. These strategies are expected to produce tangible results in the Mekong region immediately [20]. In addition, although governments have introduced several community-based risk management programs, a better understanding of the adaptation process is critical to improving interventions for the security and resilience of the livelihoods of disaster-prone communities [13]. A comprehensive multi-hazard livelihood security and resilience assessment system is lacking, acting as a barrier to effective disaster risk governance and management [23].
The introduction of new perspectives into the resilience building of LMB communities, such as systems thinking and complexity, has been facilitated by research [5,24,25]; however, efforts to standardize metrics have been hindered by conceptual diversity [26,27,28,29]. Although the number of resilience measurement approaches has increased dramatically in recent years, many stakeholders are still struggling to find frameworks that meet their specific evidence requirements [30]. According to Uddin et al. [31], several research gaps exist, such as disaster-induced disruptions and changes in livelihood assets and resources, post-disaster reconstruction plans, and how local people created resilience and adapted to hazards.
2.2. Concept of Livelihood and Resilience
The concept of resilience is used to manage resources sustainably for both ecosystem function and human development and well-being [32]. In recent years, the concept of resilience has gained popularity among international development and humanitarian organizations [30,33,34,35,36]. UNDP [37] simplifies the understanding of resilience by stating communities that can bounce back to their pre-crisis condition or even improve are considered resilient, while those that are collapsing or recovering but are worse off than before are not. Mayunga [38] says community disaster resilience refers to a community’s ability to anticipate, prepare for, respond to, and recover quickly from disasters and assesses the speed of recovery from disasters and the community’s ability to learn, cope, and adapt.
Resilience is a broad term; it can be further classified into ecological, social, economic and livelihood resilience, as shown in Figure 2 below. Adger [33] defines social resilience as the ability of groups or communities to adapt to social, political, and environmental change. This definition emphasizes social resilience in relation to ecological resilience, which is the ability of ecosystems to survive disturbances. There is a clear link between social and ecological resilience, especially for groups or communities that rely on natural resources for survival. However, whether resilient ecosystems enable resilient communities is unclear [39]. In addition to that, looking at the social-ecological perspectives, Folke [34] defines resilience as an approach and a way of thinking that provides a valuable context for the analysis of social-ecological systems, which is an area of explorative research that has policy implications for sustainable development. Tanner et al. [16] define livelihood resilience as “the capacity of all people throughout generations to maintain and improve their livelihood opportunities and well-being in the face of environmental, economic, social, and political disruptions.” Jones et al. [30] recommend three approaches to ensure resilience measurement: must be able to be quickly deployed at critical junctures; evidence requirements will change as a result of the various stages of risk preparedness and recovery; and should be organized as a collaborative effort. Patel et al. [40] discussed the shift among the actors in prioritizing “disaster vulnerability” to “disaster resilience,” which can be taken as a more proactive and positive action. The essence of the resilience concept is that it captures the factors that enable individuals and organizations to function in adverse circumstances. The study of resilience draws on a wide range of disciplinary ideas and approaches, and certain aspects of the social sciences have parallels with those of the natural sciences. Resilience is determined by the degree to which they adhere to norms, demonstrating that resilience can be either a descriptive or a normative concept, or a combination of the two [41].
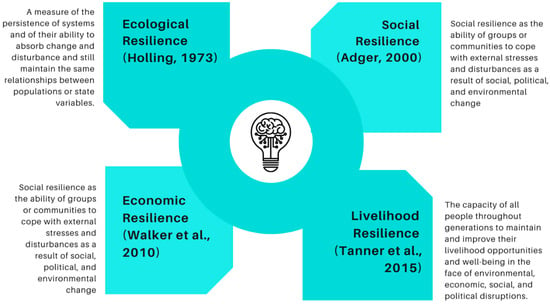
Figure 2.
Definitions and measures of resilience [41].
Across the different dimensions, the existing literature also distinguishes between two different forms: specified resilience and general resilience. General resilience is defined as the resilience of all components of a system to various kinds of shocks and stressors, including those that are not uncertain or novel, and are an intangible capacity of the entire system for adaptation and transformation [42]. On the other hand, specified resilience refers to the resilience of a system’s specific components and their ability to identify disruptions [43]. While the specified resilience approach allows a much deeper understanding of the resilience parameters and attributes, general resilience emerges as new capacities that are developed to respond to unforeseen threats where predetermined plans are not adequate [44,45].
2.3. Livelihood and Resilience Assessment
The notions of livelihood sustainability and resilience thinking are inextricably linked to one another. The ability of people to cope with hardship, lean seasons, unfavorable circumstances, and resource constraints are just a few of the factors that contribute to the long-term viability of their livelihoods [31]. Thu Trang and Loc [46] assessed the capacity of farmers living in LMB to understand how ecological shrimp aquaculture techniques are adopted in the face of environmental challenges using the DFID sustainable livelihood framework and found financial and social constraints in attaining long-term livelihood sustainability. The perspectives consider what causes livelihood problems and how to respond to them. For instance, local people care about their daily income changes (risk management approach) while local governments consider possible solutions for the problems (i.e., direct support for urgent needs and policies). When conducting a resilience assessment, it is necessary to characterize and assess the exposure to shocks and stresses. However, further conceptualization of the question of “what constitutes livelihood resilience” is required. Various studies [41,47,48] have tried to link livelihood resilience with capacity, adaptability, assets, and accessibility, yet the need for considering the uniqueness of subjects and the complexity of the livelihood systems have been highlighted to comprehensively assess livelihood resilience [49].
The resilience perspective in the LMB is the big picture of the causes and effects of natural changes in which humans are central. Resilience is derived from experiences in adapting to environmental changes and novel approaches that are responses to the learning that comes from responding to the changes. The current perspectives consider potential technologies for resilience. For instance, comprehensive technologies related to water management, such as irrigation schemes and salinity control in the Mekong delta [50], are needed for resilience. The other consideration is agricultural production technologies. In other words, there is a need for human resources that use technology to support resilience.
Disasters have been shown to disrupt people’s lives by destroying homes, assets, and other capital, as well as income and stocks, resulting in poverty, long-term shocks, and stress [9,10,13,15]. Livelihoods are sustainable when people can cope and recover quickly from stresses and shocks [31]. In the case of multi-hazards, the scenario worsens. Thus, additional detailed studies need to be conducted [51].
Quandt [52] has demonstrated the effectiveness of the Household Livelihood Resilience Approach (HLRA) in measuring livelihood resilience and the effectiveness of agroforestry in building livelihood resilience for agricultural households. Furthermore, five ways have been suggested that the HLRA improves on previous frameworks, including; providing practical methods and tools, integrating subjective measures of livelihood resilience, focusing on the household scale rather than the community scale, providing methods to analyze, visualize, and interpret results of livelihood resilience measures, and highlighting the importance of integrating subjective measures of livelihood resilience. The resilience approach emphasizes non-linear dynamics, thresholds, uncertainty, and how these interact across temporal and spatial scales. A study by Tariq et al. [29] shows that the majority of resilience framework has adopted objective approaches to measure resilience, showing a gap for more frameworks using subjective or participatory approaches to assess community resilience [53]. The framework developed in subjective approaches serves as the foundation for an in-depth empirical analysis of resilience from the perspectives of actors and livelihoods.
The concept of resilience and adaptive capacity in livelihoods and related development discourse is just emerging [40,54,55]; while much progress has been made in understanding and analyzing these concepts in disaster risk management and climate change, a significant gap remains in integrating resilience and adaptive capacity into sustainable livelihoods [56]. An adaptable framework could help in conducting ground resilience assessments by incorporating local stakeholders’ perspectives, resulting in a better understanding of community resilience [29]. Thus, measuring multi-hazard livelihood security and resilience is essential for evidence-based decision-making and interventions [51]. Furthermore, assessing livelihood security and resilience is essential in maintaining the societal balance [57]. Triet et al. [58] have shown that multiple hazards are emerging as a primary threat to people’s livelihood in the LMB. Henceforth, a new framework is necessary to define all critical dimensions with a proper interrelation of physical, technical, and social aspects to assess multi-hazard livelihood security and resilience so that the mitigation and preparedness activities can be planned appropriately by the government authorities and development partners to contribute to managing and reducing the risk of hazards.
3. Material and Methods
3.1. Study Area
The entire LMB region has been considered as a study area for assessing the drought and flood hazards in the region. The transboundary nature of the river basin and natural hazards makes this useful. The primary focus of this study is the livelihood and resilience perspectives and is designed to identify the dimensions and interlinkages and generate the framework primarily focused on three of the four LMB countries, Cambodia, Vietnam and Thailand; only three of the countries are considered due to project and administrative limitations.
3.2. Data and Methods
The present study applied the Standardized Precipitation Index (SPI), one of the widely accepted indicators for meteorological drought monitoring and assessment over a range of timescales (1, 3, 6, 9, and 12 months), using monthly input data. The World Meteorological Organization (WMO) has also suggested that SPI be used to monitor meteorological droughts [59,60]. The Standardized Precipitation Index (SPI) is used to quantify the actual precipitation as a standardized deviation from the probability distribution function. As a result, it has gained popularity in recent years as a potential drought indicator that allows for comparison across space and time. The long-term (>30 years) raw precipitation data is used to estimate the probability distribution function (gamma or Pearson Type III distribution), which is then transformed into a normal distribution with a mean of zero and a standard deviation of one. As a result, SPI values are given as standard deviations, where positive SPI values refer to precipitation above the median, and negative values indicate precipitation below the median [61].
In this study, gridded monthly data from Climate Hazard Group InfraRed Precipitation with Stations (CHIRPS) has been used, estimated by combining data from real-time observations from meteorological stations with infrared data. To calculate the SPI values for time scales of 3, 6, 9, and 12 months, a monthly time series of 854 precipitation grid stations was used with a high spatial resolution of 0.25 × 0.25 for a spatial domain of 8.625° N to 22.375° N latitude and 99.125° E to 108.625° E longitude covering the LMB. The CHIRPS data was developed at the University of California at Santa Barbara (UCSB) Climate Hazards Group (CHG) in collaboration with the U.S. Geological Survey (USGS) Earth Resources Observation and Science (EROS) center. Data for the period of 41 years (1981–2021) were obtained from the CHG webpage [62]. The dataset described in this study is accessible as a part of the data collection “Flood Hazard Maps at European and Global Scale” at the JRC data catalogue [63]. The dataset comprises the river flood hazard maps at a global scale for return periods of 10, 20, 50, 100, 200, and 500 years [64].
In this study, SPI values are computed in R studio using the SPEI package and using the 41 years (from 1981 to 2021) of raw precipitation data. Table 1 represents the SPI magnitude and its interpretation. To investigate short-term and long-term drought events in the Mekong River Basin, monthly SPIs of varying durations, i.e., 3 months (SPI-3), 6 months (SPI-6), 9 months (SPI-9), and 12 months (SPI-12), have been used. SPI-3 is computed for shorter accumulation periods and can be used as an indicator for immediate impacts, such as reduced soil moisture. SPI-6 and SPI-9 are computed for medium accumulation periods and can be used as indicators for reduced stream flow and reservoir storage. SPI-12 is computed for longer accumulation periods, and it can be used as an indicator for reduced reservoir and groundwater recharge. The various SPI values and respective interpretation on the drought level is given in Table 1.

Table 1.
SPI values and their interpretation.
Drought characteristics, including duration, severity, and intensity, were calculated to examine their spatial distribution across the LMB for 41 years of precipitation data. The duration of the event (dry or wet) is the duration (in months) between the initiation and termination of the event; the severity is defined as the cumulative value of the index from the first to the last month of the event, which is represented as a water surplus for wet events and deficit for the dry events. Drought intensity is the average value of the index below a critical level and is measured as the ratio of severity to duration. So, in this study, these characteristics were computed for dry events only. Here, for the study period of 41 years, the total, average, and maximum values of duration, intensity, and severity were calculated.
For the proposed Livelihood Security and Resilience Assessment (LiSeRA) framework, sustainable livelihood dimensions are adopted from Department for International Development (DFID) [65] in line with the objective of the study. The methodological framework shown in Figure 3 was adopted to identify the specified resilience perspectives in the LMB communities. Livelihood resilience perspectives of LMB communities were studied through the lens of specified resilience, identified by the decomposition of the system through five key questions: (i) resilience of what, (ii) resilience to what, (iii) resilience for what purpose, (iv) what are the resilience capacities, and (v) what enhances resilience [66,67,68].
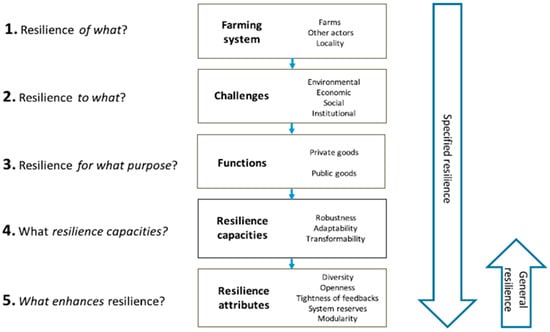
Figure 3.
Conceptual framework adopted from Meuwissen et al. [67].
A workshop was held at the Asian Institute of Technology, Thailand, in May 2022. There were 12 invited experts, including faculty members and researchers in the fields of agriculture, livelihoods, food security, climate change, sustainability, and disaster management. The workshop discussed the five key questions to understand the multi-hazard scenario, livelihood impacts, and adaptation strategies as well as the perspectives and concepts of resilience in the LMB communities. These perspectives were used to further determine the dimensions and sub-dimensions of livelihood security and resilience in the LMB communities and their interlinkages.
4. Results
4.1. Spatial Distribution of Annual Precipitation
The LMB is in a tropical monsoon climate zone with two seasons; the wet summer season lasts from May to September and is dominated by the Southwest monsoon, and the dry winter season lasts from November to March and is dominated by the Northern monsoon [6,69].
The 40-year (1981–2021) mean average annual precipitation of the entire region is shown in Figure 4. The eastern region and mid-northern region of the basin receive the maximum amount of rainfall, reaching approximately 3500 mm per year. In comparison with the digital elevation model (DEM) map shown in Figure 1b, it can be seen that higher precipitation occurs along the eastern boundary of the basin in the regions of higher elevation. Similarly, the southern region of Lao PDR and the northeastern region of Thailand, which borders Laos, receive higher levels of precipitation, whereas the central and south-eastern regions of Thailand and the deltaic regions of Cambodia receive lower levels of precipitation. The northern region of Lao PDR also receives lower precipitation despite higher elevation due to its leeward location.
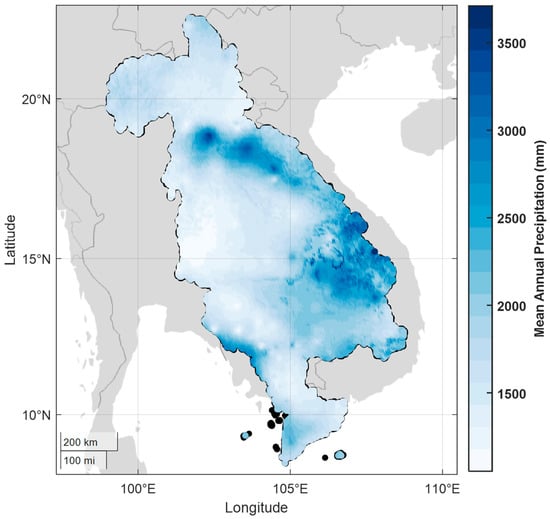
Figure 4.
Spatial distribution of CHIRPS average precipitation over the LMB from 1981 to 2021 (in mm).
Similarly, the average annual precipitation in the LMB region in the three driest (1991, 1993, and 2015) and wettest years (2000, 2011, and 2017) are given in Figure 5. In wet years, certain regions of the basin received as much as 4500 mm of precipitation, compared to a maximum of approximately 3000 mm during the dry years.
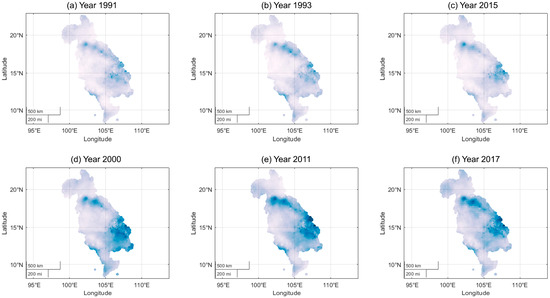
Figure 5.
Spatial distribution of annual precipitation across the LMB in the three driest years (a–c), which had lower average annual precipitation, and the three wettest years (d–f), which had higher average annual precipitation.
The precipitation distribution of the region is analogous to the occurrence of natural hazards and disasters in the region, such as the heavy flooding in Thailand in 2011, and the prolonged drought in Cambodia from 2015 to 2019, which resulted in widespread economic losses and damages.
4.2. Temporal Distribution of Drought Events
The Standard Precipitation Index (SPI) was adopted for drought detection and characterization of dry events with different severity classes (moderate, severe, and extreme dry events). It allows for temporal comparisons of drought characteristics. For the purposes of this study, SPI time series at 3-month (SPI-3), 6-month (SPI-6), 9-month (SPI-9), and 12-month (SPI-12) timescales were calculated to discuss the comparison for short-term, medium-term, and long-term precipitation patterns and their impacts, such as reduced soil moisture, reservoir storage, and groundwater recharge, respectively [70]. The SPI-3, 6, 9, and 12 values for the study area are plotted for each respective year and are presented in Figure 6; the positive blue area denotes the rainy or wet periods and the negative red area denotes the dry periods.
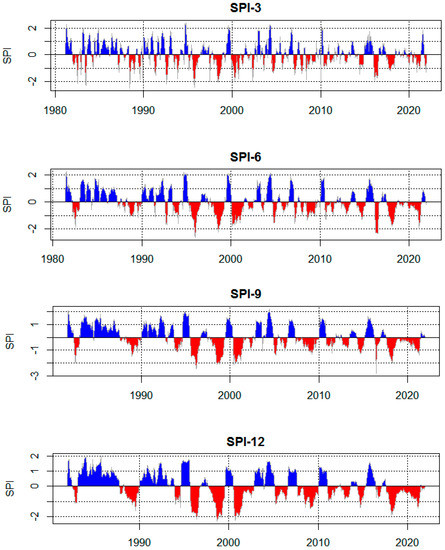
Figure 6.
The SPI values at different time scales: 3 months (SPI-3), 6 months (SPI-6), 9 months (SPI-9), and 12 months (SPI-12). The blue portions indicate wet periods while red portions indicate dry periods.
A drought or dry event begins when the SPI falls below −1 and lasts until it becomes positive again. Figure 6 shows that the LMB experienced both dry and wet events, and that the SPI-3 timescale experienced dry and wet events more frequently than other timescales (at 6, 9, and 12 months). As the SPI timescale increased (from SPI-3 to SPI-12), a shift/change of dry to wet and wet to dry events can be clearly noticed, and the duration of events increases while the number of events that occur decreases. Droughts that were between moderate and extreme in terms of their duration mainly began to occur after the mid-1990s. From 1995 to 2021, the three extreme dry events that occurred continued for longer, and few were between moderate and high severity. Overall, from SPI-12, it is evident that drought periods outnumbered wet periods before 1995, and that the number of dry periods significantly increased after 2000.
4.3. Analysis of Drought Characteristics
The maps of dry duration, dry severity, and dry intensity are presented in Figure 7, Figure 8 and Figure 9, respectively. The spatial distribution of total (TDD), average (ADD), and maximum dry duration (MDD) of dry events is displayed in Figure 7. The total dry duration over the study region varies from 0 to 28 months for SPI-3, 0 to 90 months for SPI-6, 0 to 100 months for SPI-9, and 0 to 112 months for SPI-12; values for Total Dry Duration (TDD), Average Dry Duration (ADD) and Maximum Dry Duration (MDD) are presented in Table 2. The Total Dry Duration (TDD) is low in the upper part and high in the middle to lower part of the LMB. Therefore, we can say that the TDD is increasing from the northwestern to the southeastern region of the basin, and a similar pattern can be seen in ADD and MDD.
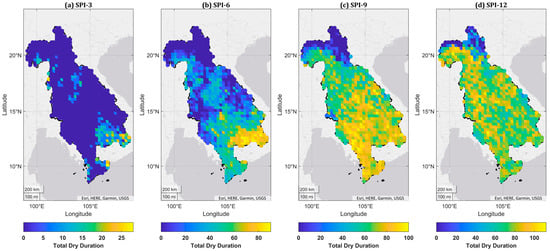
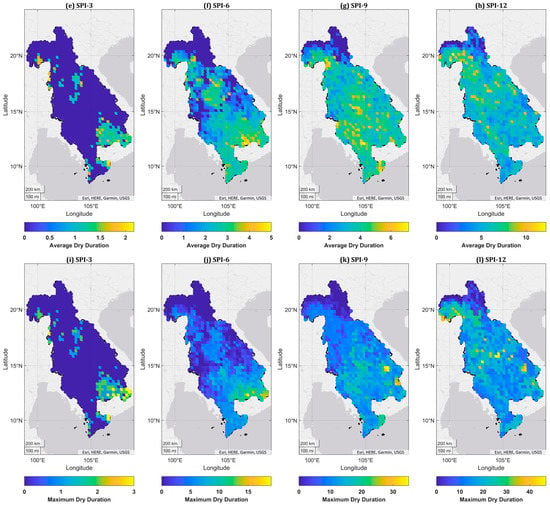
Figure 7.
Spatial distribution of total dry duration (a–d), average dry duration (e–h), and maximum dry duration (i–l) for the period of 41 years (1981–2021).
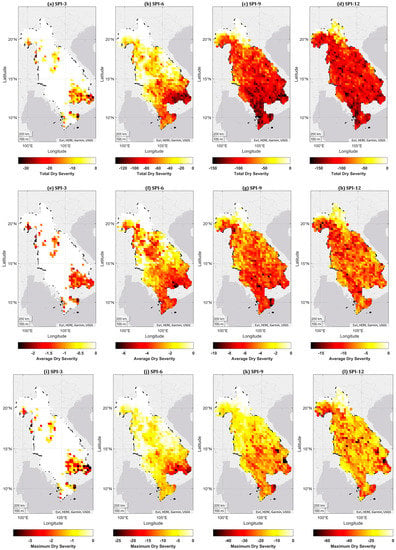
Figure 8.
Spatial distribution of total dry severity (a–d), average dry severity (e–h), and maximum dry severity (i–l) for the period of 41 years (1981–2021).
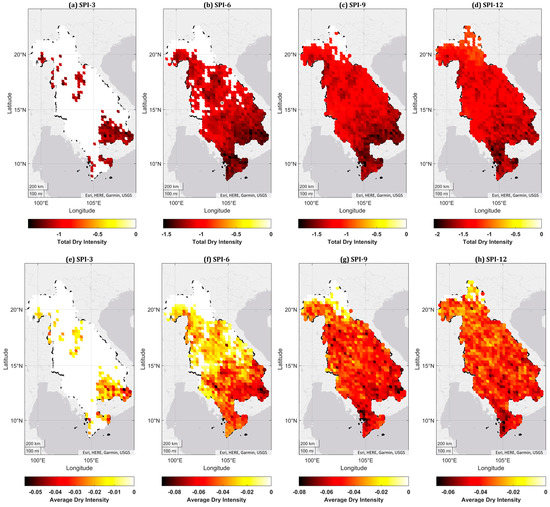
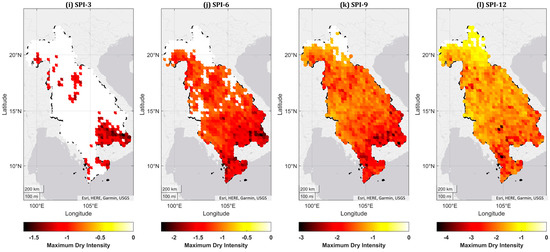
Figure 9.
Spatial distribution of total dry intensity (a–d), average dry intensity (e–h), and maximum dry intensity (i–l) for the period of 41 years (1981–2021).

Table 2.
Range of TDD, ADD and MDD for SPI-3, SPI-6, SPI-9 and SPI-12 (months).
The spatial distribution of total dry severity (TDS), average dry severity (ADS), and maximum dry severity (MDS) of dry events is displayed in Figure 8. All severity maps show a similar pattern as of duration maps. The map shows that TDS is relatively high in the basin’s central to southeast regions, which shows the more extreme dry events that occur in these parts of the LMB. The reason for higher TDS could be the lack of sufficient rainfall during the wet season; the lower amount of rainfall is caused by the delayed arrival and the early departure of the monsoon rainfall combined with El Nino events, which result in exceptionally high temperatures and evapotranspiration. The TDS, ADS, and MDS ranges for SPI-3, 6, 9, and 12 are given in Table 3.

Table 3.
Range of TDS, ADS, and MDS for SPI-3, SPI-6, SPI-9, and SPI-12.
The intensity of the dry events was computed as the ratio between severity and duration, and its spatial distribution is illustrated in Figure 9. The figure shows the total (TDI), average (ADI), and maximum (MDI) dry intensities for the LMB region across the time period. The total dry intensity varies from moderately dry to extremely dry with a range of 0 to −1.403 for SPI-3, 0 to −1.545 for SPI-6, 0 to −1.806 for SPI-9, and −1.034 to −2.067 for SPI-12 (Table 4).

Table 4.
Range of TDI, ADI and MDI for SPI-3, SPI-6, SPI-9 and SPI-12.
TDI is predominantly more intense in the basin’s lower part, relatively low intense in the central part, and normal in the upper part of the basin.
4.4. Analysis of Flood Characteristics
In LMB, flooding is a recurrent event that occurs every year and has both positive and negative impacts on the livelihood of people in the basin. However, in recent years, large-scale flooding in the LMB region has decreased significantly due to the construction of hydrologic structures upstream in the Mekong River. Figure 10 shows the timeline of the number of flood occurrences in the three LMB countries focused in this study: Thailand, Cambodia, and Vietnam. Although the distribution of year-to-year flood occurrences is highly variable, a distinct increase can be observed over the course of 41 years from 1981 to 2022. In 2000, the region experienced one of the worst floods, which took the lives of over 480 people and displaced thousands [18]. Similarly, seasonal floods in Cambodia inundated 423,449 ha of farmland and displaced 1.64 million people in 2011, directly impacting USD 521 million in economic loss [12].
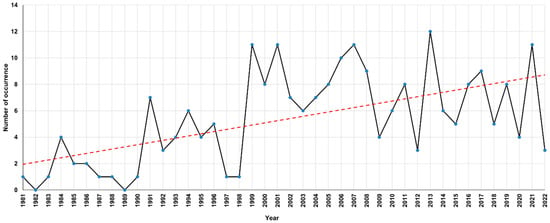
Figure 10.
Numbers of Flood occurrences in Thailand, Cambodia, and Vietnam (1981–2022). The red line denotes the increasing trend in flood occurrences (linear) in the countries.
Hydrologists mostly use flood frequency analysis to understand the nature and magnitude of the river’s flow and to forecast discharge (or flow) values corresponding to defined return periods along the river [32,71,72]. Understanding flood frequency is essential for many hydrological applications, for example, flood early warning systems and designing structures such as dams, spillways, bridges, culverts etc. Flood frequency analysis works with the concept of the return period. The return period is the inverse of probability (expressed in percent), giving the estimated time interval between incidents of equivalent size or intensity [73]. In general, it is also referred to as recurrence interval and thus describes the likelihood of event occurrence at or above a certain intensity level within a time frame (e.g., year) defined by a probability. For example, a 100-year return period of flood corresponds to a flood with an exceedance probability of 1/100 or 1% in any one year [74]. It is essential to understand that just because a flood with a 100-year return period occurs now does not guarantee that another flood of this magnitude will not happen in the next 100 years. The return period estimates the probability of a particular flow exceeding its limit. So, for example, the 10-year return period flow value for LMB is 4000 cumec, which means that there is 1/10 or 10% chance of this flow being exceeded in any single year. A more extended return period suggests a lower probability of a recurrent event and vice-versa.
Figure 11 depicts the flood-prone areas for flood events with six return periods: (a) 10, (b) 20, (c) 50, (d) 100, (e) 200, and (f) 500-year. A large area in the LMB has a relatively shallow inundation water depth. The high-water depth, nearly 30 m (in purple color), is found in an upper basin region and along the mainstream of the Mekong River. However, although potential inundation depths are low to average water depths, the southern part of the basin is highly prone to flooding, with a higher frequency of occurrences than the northern part.
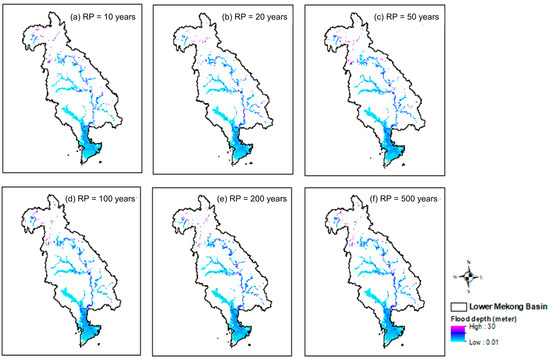
Figure 11.
Inundation water depth (in meters) at different return periods (RP) in the LMB.
4.5. Resilience Capacities of LMB Communities
Following the multi-hazard assessment of the LMB region and identification of critical risk drivers (hazards), an expert workshop was conducted to understand the national and local perspectives of multi-hazard livelihood resilience. Discussions were made based on five key questions: (1) Resilience of WHAT, (2) Resilience to WHAT, (3) Resilience for WHAT Purposes, (4) WHAT are Resilience Capacities? and (5) WHAT (strategies) enhance resilience? (Table 5). The livelihood system of LMB communities in all three countries are primarily agrarian and are dependent largely on paddy farming, livestock rearing, and aquaculture. This dependency is the major challenge for livelihood security among such communities, as such economic activities are highly exposed to hydro-meteorological hazards such as floods, droughts and tropical storms that are frequent in the region. The interaction of the hazards with the exposed livelihood activities must be adequately considered to ensure resilience, i.e., to enhance the ability of the farmers to maintain and increase production, improve food and bio-resources security and economic status of the communities, and protect the physical and financial capital and assets from negative impacts. To mitigate hazard impacts, actions such as the development of flood early warning systems, protection structures, and proper water resource management, along with agriculture-specific advisories and innovations in farming technologies (crop varieties, tools, and equipment), are being implemented and are the core capacities of the communities and governments. These actions are implemented through a wide range of collaborative strategies and mechanisms, including capacity building and mobilization of communities, government agencies, academia, and non-governmental and community-based organizations, to invest in the improvement of agricultural systems, market supply chain, and disaster management.

Table 5.
Information collected from the expert workshop to finalize the framework.
5. Discussion
5.1. Multi-Hazard Livelihood Resilience Perspective in the LMB
Findings from this study correlate to the multi-hazard scenarios discussed in previous studies. Figure 7, Figure 8, Figure 9 and Figure 11 show that a large portion of the LMB’s southern region is prone to both flooding and droughts. In fact, previous studies show that seasonal flooding has wreaked havoc in the region, resulting in loss of lives and agricultural lands, displacement, and infrastructure damages [12,18]. Cascading forms of hazards due to heavy precipitation and flooding, such as river bank erosion and landslides, also pose a major challenge for the communities. Similarly, tropical cyclones pose annual threats to the LMB, along with extreme weather and common seasonal fluctuations. Hydrological factors, such as variation in rainfall, evapotranspiration, changes in the ground water table, and changes to the natural flow system (increase in the built-up area, river channel width, erosion, damming) have widespread adverse effects on river ecosystems and livelihoods [21]. Climate hazards affect most parts of the Mekong region [19]. Their effects are likely to be exacerbated in many cases by the impacts of climate change.
Multi-hazard disasters are highly complex due to the mutual interactions of hazards and their effects on the economy, development strategies and actions, environment, and people’s lives. The exposure of LMB communities to both flooding and droughts creates a complex paradox for adaptation. Results from the experts’ workshop reveal that most of the vulnerable livelihood systems in the LMB region are closely associated with the river basin, such as farming and aquaculture. Previous studies have highlighted the impacts of climate change on livelihoods, particularly those that rely on climate and weather, such as agriculture [16]. Changes in the frequency, magnitude, and distribution of climatic hazards worsen an already severe problem, particularly in the lower-income countries of the LMB. Since the LMB receives so much rain during the monsoon season, socio-economic activities are planned for and adjusted based on expected conditions, making them vulnerable to deviations from regular precipitation patterns. The rain-fed agriculture-based rural economy is the most vulnerable sector in the LMB. Rice farming uses limited irrigation, particularly in northeastern Thailand and the Mekong Delta at the river’s mouth near the South China Sea [10]. Droughts in the Lower Mekong countries have significantly strained the natural ecology, rice productivity, and water resources, which illustrates the increasing risk and vulnerability [8].
The LMB’s wet season flow is dependent on the Asian monsoon, whose rhythm and intensity have changed recently [75]. Floods and droughts have increased, destroying crops and altering aquatic ecosystems, affecting rural livelihoods [16]. Climate change has put great strain on LMB, causing primary food and water security challenges [8,10]. Temperature increases in the headwaters are changing stream flow seasonality, affecting agricultural productivity and aquatic ecosystems. Rising sea levels and saltwater intrusion have impacted the coastal regions, whereas over-exploitation of groundwater and aquifer contamination further add to downstream pressures on water quantity and quality. The proliferation of dams, climate change, and sea-level rise will likely cause unprecedented changes in the LMB’s hydrologic, agricultural, and aquatic systems [72], such as an increase in the frequency and intensity of hot extremes, tropical cyclones, and variable precipitation, resulting in agricultural and ecological droughts. In addition, the social dimensions of vulnerability (such as poverty, sub-standard housing, absence of critical social infrastructures, etc.) also plays a role in consequences related to climatic hazards [7].
Transboundary water governance on LMB also plays a significant role on the adaptation strategies [76]. Dang et al. [77] have shown that changes in hydrological regimes caused by the construction of hydropower dams (existing and under construction) would directly affect water levels in the Cambodian lowlands, which are dominated by rivers. Hydropower reservoirs that affect seasonal water levels, fluctuations, and rising and falling rates would need to be operated to minimize regional impacts. Irrigation and flood protection infrastructure, such as water storage, regulation, and channels, have been widely used by communities and administrators in the LMB region. However, their ability to measure, interpret, and adapt to climate change trends is still developing. To ensure that the LMB fully mainstreams climate change concerns in a coordinated and consistent manner, each government has demonstrated its commitment to tackling issues [20].
The conceptualization of resilience is an important step in determining adaptation strategies and actions [38]. Discussions held during the expert workshop suggested that resilience for the LMB communities must focus on enhancing the ability of the farming communities to maintain and increase production, thereby improving household food and bio-resources security and protecting land and other assets from physical damage. Similarly, cognitive and socio-economic dimensions must also be considered, such as improving the economic status of the communities, ensuring continuity of business and operations, and enhancing psychological well-being. Communities exposed to hazards often develop several hard and soft adaptation strategies to enhance resilience capacities. In the LMB, structural measures including flood control dikes and embankments, irrigation systems, food storage structures, and non-structural measures such as agro-advisory, early warning, land use planning and development of drought-resistant crop varieties have helped enhance the capacity of the communities to cope with hazards and other stressors [50,78]. Migration is a major adaptation strategy, especially among the youths to cope with livelihood stress caused by climate variability, uncertainty, and weather events. However, the impact of migration on adaptation and resilience is often difficult to document and less concern because it is typically a gradual process. Nevertheless, people from rural households frequently migrate to secure their livelihoods and diversify their income in times of adversity [7,13].
5.2. Need for Livelihood Resilience Framework in the LMB
The concepts of resilience and adaptive capacity have gained popularity in discussions about ecology, climate change, disaster risk reduction, and other aspects of development. However, although these concepts are widely used in theory, there has been little clarity in the understanding, substance, definition, and applicability of these concepts in practice. Most importantly, if the resilience concept is to address the limits of adaptation strategies and the development needs of the planet’s poorest and most vulnerable people, it must pay more attention to human livelihoods [16].
However, few studies that look at resilience from the perspective of livelihoods take different approaches and only look at certain aspects [38]. Currently, many sciences are involved in exploratory studies and new discoveries of linked social-ecological systems [79]. Hence, the conceptual definition of livelihood resilience must first be established to develop and use assessment frameworks and tools. Individuals, groups, and communities may have varying degrees of resilience. In the LMB, local livelihoods are closely intertwined with social and economic practices, infrastructure development, and national and regional policies [5,13,80]. The fact that existing frameworks of international institutions do not consider local communities and citizens as legitimate participants at the international level is at the heart of these issues [80]. The dynamic interactions of people, communities, societies, and environments make assessing community resilience difficult [2,24]. Generally, these frameworks focus on similar factors that could reduce vulnerability and increase community resilience, centered on “community capital”. However, most of these frameworks tend to focus on one or two aspects of disaster resilience rather than a holistic approach [37]. An innovative approach is necessary to measure and act accordingly to mitigate and manage the possible losses from multiple hazards [51].
International development and humanitarian organizations are increasingly focusing on measuring and building livelihood resilience to specific shocks, such as floods and droughts [52]. Many people living in the LMB are still struggling to strengthen and secure their properties against floods, bank erosion, and winds; in most cases, these were temporary measures that do not develop into permanent structures [7], which shows the need to access their capacity by achieving community resilience. A localized framework is paramount to gather information that is particularly useful for local governments and stakeholders in aiding decision-making and improving the understanding of environmental circumstances by giving a perspective to assist and enhance decision-making [8]. Hence, it is necessary to develop an indicator framework that encompasses the overarching principles of livelihood and resilience for the LMB by identifying attributes and indicators that can be used to measure or assess livelihood resilience and illustrating it with examples.
5.3. Livelihood Security and Resilience Assessment Framework (LiSeRA) for LMB
As discussed earlier, “livelihood resilience” refers to the factors and processes that sustain livelihoods in the face of change. LMB communities have been engaged in agriculture for a long period of time and are primarily dependent on the river’s ecosystem. Therefore, livelihood resilience in the LMB entails the community’s capacity to maintain and enhance their farming and agricultural practices to improve their social and economic status and well-being.
The communities achieve livelihood resilience through various capacities. Farmers may reduce their livelihood vulnerability and increase their ability to resist risks if they have access to high-quality and efficient livelihood capital [47]. The perspectives of livelihood resilience may vary by context. For example, in the Mekong Delta, local people care about the resilience to sea level rise, but those in the drought-prone regions may prioritize irrigation infrastructure while those living downstream from hydropower dams may focus on fish and biodiversity conservation. Similarly, livelihood resilience is also linked to income source protection, and LMB communities employ a wide range of strategies such as diversification of income sources, high-value crops, livestock, and off-farm activities [81].
Figure 12 shows the Livelihood Security and Resilience Assessment (LiSeRA) framework. Livelihood capital and the definition of community-based vulnerability provided the baseline understanding of LiSeRA. The integrated framework consists of two segments, livelihood dimension, and resilience dimension, which are interlinked by an institutional mechanism. Livelihood dimension has been represented by five interrelated capitals and twelve sub-capitals. The five capital assets required for a sustainable livelihood form the basis of the sustainable livelihoods approach: financial, physical, natural, human, and social capital assets [46,65]. These capitals are determined by a specific vulnerability context, i.e., the insecurity of one’s well-being in the face of external changes in one’s living environment. The DFID’s vulnerability context reflects both external phenomena (such as shocks, seasonality, and unfavorable environmental trends) and the intrinsic issues of households (i.e., lack of capacity and resilience to cope with unfavorable factors) [51,65]. These capital assets make up a stock of capital that can be stored, accumulated, exchanged, or allocated to activities that generate income and provide subsistence and other benefits to the stock owner. In addition, it is possible to accumulate livelihood capital to build up reserves and buffers in preparation for times of stress or shock [16,52].
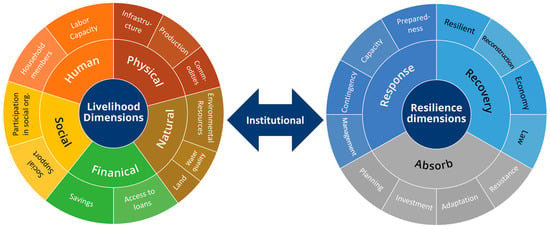
Figure 12.
Conceptual Layout of LiSeRA framework.
The sub-dimensions for each of the livelihood capitals have been identified based on the synthesis of the existing literature on livelihood security in the LMB discussed earlier with the definitions of the capitals. Human capital in the LMB is measured by the household members and labor capacity, particularly as the LMB faces increasing shortages of labor due to migration and change of trade towards more formal sectors [13,57]. Similarly, the status of infrastructure development (and health), measures implemented to increase food production and storage and availability, accessibility, and quality of commodities and basic services for sustainable livelihoods have been categorized in the physical capitals in the LMB. Similarly, considering the primary reliance of LMB communities on their natural resources for livelihood [13], the natural dimension incorporates the quality of land and water and the bio-diversity and environmental resources within the community. The financial capital includes the household’s savings and their accessibility to financial support, such as loans. Finally, social dimensions for the LMB include participation and engagement in various community-based organizations, networks, and groups, and the availability of support from the community.
Similarly, Figure 12 also shows the resilience dimension proposed in the LiSeRA framework. Resilience in this framework is defined as a composite of a community’s capacity to absorb, respond to, and recovery from shocks and stressors. The dimensions have been adopted from previous definitions of resilience [82,83,84,85]. A community’s capacity to absorb the impacts of threats and stressors relies on its planning and risk reduction strategies, including the efficient use of community resources, engagement, and collective action [86]; the availability of funds and investment; the capacity to adapt to changes and shocks; and the capacity to resist or avoid disfunction. In the LMB communities, flood and water management infrastructure, advisories and early warning systems, and technological innovations in agricultural and farming practices contribute to their capacity to absorb the impacts of hazards.
The response capacity includes the ability to manage stressors, i.e., to identify and prioritize problems and initiate solutions with effective and efficient mobilization of resources [87,88]. The availability of contingent resources within the community, the capacity of the community to react and respond to changes within its environment, and their knowledge and capacity to prepare for imminent or current disasters also form the response dimension. LMB communities rely largely on community engagement and collaboration with the government, organizations, and institutions to develop and enhance their management and preparedness capacities to withstand the impact of hazards.
Finally, the recovery capacity of the community is defined through its ability to withstand shocks, the capacity of the community to undertake reconstruction, and the economic and legal capacity to support the recovery process to its original state or a new equilibrium. Improved institutional functions and capacities, robust policies, strategies, and technical and financial support for sustainable and disaster-resilient housing and settlements help enhance the LMB communities’ recovery capacity.
The framework also proposes that, while conceptually similar and complimentary, livelihood and resilience dimensions are functionally different and require institutional linkages to introduce systems perspective and thinking into resilience building. People in the community, policymakers, and development actors must focus on fostering such interlinkages across the two dimensions to strengthen the systems approach in risk reduction and resilience. More importantly, the institutional linkages should help develop policies, programs, and adaptable processes that allow the community to adjust to threats and stressors.
6. Conclusions
Livelihoods of LMB communities are highly exposed to environmental and anthropogenic hazards and stressors. Floods and droughts have a significant impact on people’s livelihoods, where a major portion of the people are directly reliant on the river’s ecosystem and basin hydrology for economic activities. Disaster in a community is determined by human, environmental, or economic losses [89]. As such, disaster resilience actions in the LMB must consider the interlinkages and interaction between livelihoods and resilience perspectives for efficient risk management. In the face of hazards and stressors, agricultural communities in the LMB have initiated several actions to enhance their capital and capacity to manage disaster risks. The characteristics of the communities, defined as their physical, social, natural, financial, and human capital, play a significant role in disaster risk reduction and management, which also determines their capacity to absorb, respond to, and recover from hazard impacts. Moreover, livelihood and resilience dimensions are closely interlinked through institutional mechanisms. Thus, to understand the livelihood security and resilience of the community, it is essential to have a systematic investigation of associated factors influencing and their critical dimensions.
The most efficient approach to disaster mitigation is to improve the inherent capabilities of local communities to mitigate the impacts. Proper policy intervention is required to reduce disparities, which can be recommended through a detailed study using critical dimensions and indices that help in the comprehensive understanding of the adaptation behavior of the people, their livelihood risks, and possible approaches for sustainability. Risk reduction, proper management, and governance of these hazards are becoming key challenges for the regional, national, and local authorities of LMB. Therefore, proper adaptation strategies to address the people’s concerns are required for the socio-economic growth of LMB to ensure livelihood security and resilience. Hence, the regional, national, and local governments can improve the strategies for an effective management configuration, combining technical and infrastructure measures with institutional and governance decisions.
This study has filled an existing gap in multi-hazard livelihood security and resilience in the LMB region. Most notably, the study has consolidated the fragmented concepts of livelihood security and resilience in previous studies conducted in the region and adopted them into a holistic framework. This framework can be useful for policymakers and development planners to generate appropriate assessment indicators and conduct multi-hazard livelihood security and resilience assessment in communities of the LMB. Such assessments will help to develop detailed risk reduction, mitigation, and management plans.
The findings of this study also contribute to filling the gap in terms of providing a clearer definition and understanding of livelihood resilience and adaptive capacity in the LMB. The framework will be helpful in the development of effective communication and dissemination of information between scientific and technological communities, stakeholders and policymakers, development partners, and community-based organizations, as well as in promoting risk awareness and resilient thinking to foster community resilience and an informed society.
At the Mekong regional level, the study directly supports the MRC in achieving strategic Priority 4: Strengthen resilience against climate risks, extreme floods, and droughts envisioned in the Basin Development Strategy for the MRB 2021–2030 and MRC Strategic Plan 2021–2025 [90]. It is assumed that actors, institutions, and platforms will be strengthened to facilitate a more efficient, productive, and satisfying exchange of knowledge among scientists, policymakers, and communities in developing resilient societies [91]. The integrated approach for risk reduction and management by measuring the multi-hazard livelihood security and resilience is consistent with the strategic plan of the MRC.
Author Contributions
Conceptualization, I.P., P.U. and G.D.; methodology, I.P., P.U., M.A.G., P.D., T.T.N.N., S.S. and G.D.; software, P.U. and M.A.G.; validation, I.P.; formal analysis, P.U. and M.A.G.; investigation, I.P., G.D. and A.B.; resources, I.P.; data curation, P.U. and M.A.G.; writing—original draft preparation, I.P., P.U. and G.D.; writing—review and editing, I.P., A.B., P.D., T.T.N.N. and S.S.; visualization, M.A.G. and G.D.; supervision, I.P. and G.D.; project administration, I.P.; funding acquisition, I.P. All authors have read and agreed to the published version of the manuscript.
Funding
This research was funded by “Asia-Pacific Network for Global Change Research”, grant number CBA2020-SP1110-Pal. The APC was funded by the project “Capacity building for measuring multi-hazard livelihood security and resilience in the Lower Mekong Basin” (CBA2020-SP1110-Pal).
Institutional Review Board Statement
Not applicable.
Informed Consent Statement
Not applicable.
Data Availability Statement
Data used in this study is primarily open access.
Acknowledgments
The authors would like thank Sangam Shrestha and Linda Anne Stevenson for the supporting the conceptualization of this project’s research ideas.
Conflicts of Interest
The authors declare no conflict of interest. The funders had no role in the design of the study; in the collection, analyses, or interpretation of data; in the writing of the manuscript; or in the decision to publish the results.
References
- Mekong River Commission. State of the Basin Report 2010; Mekong River Commission: Laos, Vientiane, 2010. [Google Scholar]
- Osborne, M. Why We Should be Worried about the Mekong River’s Future: A Perspective on Forty Years of Great Change. Perspective 2019, 105, 1–6. [Google Scholar]
- Jacobs, J.W. Mekong Committee History and Lessons for River Basin Development. Geogr. J. 1995, 161, 135. [Google Scholar] [CrossRef]
- Morton, L.W.; Olson, K.R. The Pulses of the Mekong River Basin: Rivers and the Livelihoods of Farmers and Fishers. J. Environ. Prot. 2018, 9, 431–459. [Google Scholar] [CrossRef]
- Pal, I.; Doydee, P.; Utarasakul, T.; Jaikaew, P.; Bin Razak, K.A.; Fernandez, G.; Huang, T.; Chen, C.S. System approach for flood vulnerability and community resilience assessment at the local level—A case study of Sakon Nakhon Province, Thailand. Kasetsart J. Soc. Sci. 2021, 42, 107–116. [Google Scholar] [CrossRef]
- Bui, N.; Pal, I.; Pramanik, M.; Dasgupta, R. The Impact of Climate Change on Drought and Its Adaptation Strategies: Findings from Regional Climate Models and Households in Tien Giang Province, Vietnam. Clim. Change 2022, 175, 18. [Google Scholar] [CrossRef]
- Few, R.; Tran, P.G. Climatic hazards, health risk and response in Vietnam: Case studies on social dimensions of vulnerability. Glob. Environ. Chang. 2010, 20, 529–538. [Google Scholar] [CrossRef]
- Abhishek, A.; Das, N.N.; Ines, A.V.; Andreadis, K.M.; Jayasinghe, S.; Granger, S.; Ellenburg, W.L.; Dutta, R.; Quyen, N.H.; Markert, A.M.; et al. Evaluating the impacts of drought on rice productivity over Cambodia in the Lower Mekong Basin. J. Hydrol. 2021, 599, 126291. [Google Scholar] [CrossRef]
- Chen, A.; Emanuel, K.A.; Chen, D.; Lin, C.; Zhang, F. Rising future tropical cyclone-induced extreme winds in the Mekong River Basin. Sci. Bull. 2020, 65, 419–424. [Google Scholar] [CrossRef]
- Thilakarathne, M.; Sridhar, V. Characterization of future drought conditions in the Lower Mekong River Basin. Weather. Clim. Extrem. 2017, 17, 47–58. [Google Scholar] [CrossRef]
- Trung, L.D.; Duc, N.A.; Nguyen, L.T.; Thai, T.H.; Khan, A.; Rautenstrauch, K.; Schmidt, C. Assessing cumulative impacts of the proposed Lower Mekong Basin hydropower cascade on the Mekong River floodplains and Delta—Overview of integrated modeling methods and results. J. Hydrol. 2018, 581, 122511. [Google Scholar] [CrossRef]
- Liu, L.; Bai, P.; Liu, C.; Tian, W.; Liang, K. Changes in Extreme Precipitation in the Mekong Basin. Adv. Meteorol. 2020, 2020, 8874869. [Google Scholar] [CrossRef]
- Nguyen, T.P.L.; Sean, C. Do climate uncertainties trigger farmers’ out-migration in the Lower Mekong Region? Curr. Res. Environ. Sustain. 2021, 3, 100087. [Google Scholar] [CrossRef]
- Zhang, L.; Song, W.; Song, W. Assessment of Agricultural Drought Risk in the Lancang-Mekong Region, South East Asia. Int. J. Environ. Res. Public Health 2020, 17, 6153. [Google Scholar] [CrossRef]
- Spruce, J.; Bolten, J.; Mohammed, I.N.; Srinivasan, R.; Lakshmi, V. Mapping Land Use Land Cover Change in the Lower Mekong Basin From 1997 to 2010. Front. Environ. Sci. 2020, 8, 21. [Google Scholar] [CrossRef] [PubMed]
- Tanner, T.; Lewis, D.; Wrathall, D.; Bronen, R.; Cradock-Henry, N.; Huq, S.; Lawless, C.; Nawrotzki, R.; Prasad, V.; Rahman, M.A.; et al. Livelihood resilience in the face of climate change. Nat. Clim. Chang. 2014, 5, 23–26. [Google Scholar] [CrossRef]
- Orencio, P.M.; Fujii, M. A localized disaster-resilience index to assess coastal communities based on an analytic hierarchy process (AHP). Int. J. Disaster Risk Reduct. 2013, 3, 62–75. [Google Scholar] [CrossRef]
- Hoang, L.P.; Biesbroek, R.; Tri, V.P.D.; Kummu, M.; van Vliet, M.T.H.; Leemans, R.; Kabat, P.; Ludwig, F. Managing flood risks in the Mekong Delta: How to address emerging challenges under climate change and socioeconomic developments. AMBIO 2018, 47, 635–649. [Google Scholar] [CrossRef] [PubMed]
- Arias, M.E.; Holtgrieve, G.W.; Ngor, P.B.; Dang, T.D.; Piman, T. Maintaining perspective of ongoing environmental change in the Mekong floodplains. Curr. Opin. Environ. Sustain. 2019, 37, 1–7. [Google Scholar] [CrossRef]
- Mekong River Commission. Annual Report of MRC 2019; Mekong River Commission Secretariat: Laos, Vientiane, 2020. [Google Scholar]
- Gunawardana, S.K.; Shrestha, S.; Mohanasundaram, S.; Salin, K.R.; Piman, T. Multiple drivers of hydrological alteration in the transboundary Srepok River Basin of the Lower Mekong Region. J. Environ. Manag. 2020, 278, 111524. [Google Scholar] [CrossRef]
- Dang, A.T.N.; Kumar, L.; Reid, M.; Nguyen, H. Remote Sensing Approach for Monitoring Coastal Wetland in the Mekong Delta, Vietnam: Change Trends and Their Driving Forces. Remote. Sens. 2021, 13, 3359. [Google Scholar] [CrossRef]
- Dore, J.; Lebel, L. Deliberation and Scale in Mekong Region Water Governance. Environ. Manag. 2010, 46, 60–80. [Google Scholar] [CrossRef] [PubMed]
- Islam, S.T.; Akand, K.; Islam, N.; Samad, S.; Rishal, F.H. Systems thinking approach for disaster resilient and climate smart agriculture in Bangladesh. Int. J. Disaster Resil. Built Environ. 2022, 13, 286–303. [Google Scholar] [CrossRef]
- Mavhura, E. Applying a systems-thinking approach to community resilience analysis using rural livelihoods: The case of Muzarabani district, Zimbabwe. Int. J. Disaster Risk Reduct. 2017, 25, 248–258. [Google Scholar] [CrossRef]
- Hansson, S.; Orru, K.; Siibak, A.; Bäck, A.; Krüger, M.; Gabel, F.; Morsut, C. Communication-related vulnerability to disasters: A heuristic framework. Int. J. Disaster Risk Reduct. 2020, 51, 101931. [Google Scholar] [CrossRef]
- Lecegui, A.; Olaizola, A.M.; López-I-Gelats, F.; Varela, E. Implementing the livelihood resilience framework: An indicator-based model for assessing mountain pastoral farming systems. Agric. Syst. 2022, 199, 103405. [Google Scholar] [CrossRef]
- Sina, D.; Chang-Richards, A.Y.; Wilkinson, S.; Potangaroa, R. A conceptual framework for measuring livelihood resilience: Relocation experience from Aceh, Indonesia. World Dev. 2019, 117, 253–265. [Google Scholar] [CrossRef]
- Tariq, H.; Pathirage, C.; Fernando, T. Measuring community disaster resilience at local levels: An adaptable resilience framework. Int. J. Disaster Risk Reduct. 2021, 62, 102358. [Google Scholar] [CrossRef]
- Jones, L.; Constas, M.A.; Matthews, N.; Verkaart, S. Advancing resilience measurement. Nat. Sustain. 2021, 4, 288–289. [Google Scholar] [CrossRef]
- Uddin, M.S.; Haque, C.E.; Khan, M.N.; Doberstein, B.; Cox, R.S. “Disasters threaten livelihoods, and people cope, adapt and make transformational changes”: Community resilience and livelihoods reconstruction in coastal communities of Bangladesh. Int. J. Disaster Risk Reduct. 2021, 63, 102444. [Google Scholar] [CrossRef]
- Kim, V.; Tantanee, S.; Suparta, W. Gis-based flood hazard mapping using hec-ras model: A case study of lower mekong river, cambodia. Geogr. Tech. 2020, 15, 16–26. [Google Scholar] [CrossRef]
- Adger, W.N. Social and ecological resilience: Are they related? Prog. Hum. Geogr. 2000, 24, 347–364. [Google Scholar] [CrossRef]
- Folke, C. Resilience: The emergence of a perspective for social–ecological systems analyses. Glob. Environ. Chang. 2006, 16, 253–267. [Google Scholar] [CrossRef]
- Hills, T.; Pramova, E.; Neufeldt, H.; Ericksen, P.; Thornton, P.; Noble, A.; Weight, E.; Campbell, B.; McCartney, M. A Monitoring Instrument for Resilience; CCAFS Working Paper No. 96; CGIAR Research Program on Climate Change, Agriculture and Food Security (CCAFS): Copenhagen, Denmark, 2015; Available online: http://hdl.handle.net/10568/56757 (accessed on 4 January 2023).
- Keck, M.; Sakdapolrak, P. What is social resilience? Lessons learned and ways forward. Erdkunde 2013, 67, 5–19. [Google Scholar] [CrossRef]
- UNDP. Community Based Resilience Assessment (CoBRA) Conceptual Framework and Methodology; UNDP Drylands Development Centre: Nairobi, Kenya, 2013. [Google Scholar]
- Mayunga, J.S. Understanding and Applying the Concept of Community Disaster Resilience: A Capital-Based Approach; Summer Academy for Social Vulnerability and Resilience Building: Bonn, Germany, 2007; p. 1. [Google Scholar]
- Pimm, S.L. The complexity and stability of ecosystems. Nature 1984, 307, 321–326. [Google Scholar] [CrossRef]
- Patel, S.; Rogers, M.B.; Amlôt, R.; Rubin, G.J. What Do We Mean by ‘Community Resilience’? A Systematic Literature Review of How It Is Defined in the Literature. PLoS Curr. 2017, 9. [Google Scholar]
- Speranza, C.I.; Wiesmann, U.; Rist, S. An indicator framework for assessing livelihood resilience in the context of social–ecological dynamics. Glob. Environ. Chang. 2014, 28, 109–119. [Google Scholar] [CrossRef]
- Folke, C.; Carpenter, S.R.; Walker, B.; Scheffer, M.; Chapin, T.; Rockström, J. Resilience Thinking: Integrating Resilience, Adaptability and Transformability. Ecol. Soc. 2010, 15, 9. [Google Scholar] [CrossRef]
- Walker, B.H.; Abel, N.; Anderies, J.M.; Ryan, P. Resilience, Adaptability, and Transformability in the Goulburn-Broken Catchment, Australia. Ecol. Soc. 2009, 14, 24. [Google Scholar] [CrossRef]
- Lee, A.V.; Vargo, J.; Seville, E. Developing a Tool to Measure and Compare Organizations’ Resilience. Nat. Hazards Rev. 2013, 14, 29–41. [Google Scholar] [CrossRef]
- Sweetapple, C.; Fu, G.; Farmani, R.; Butler, D. General resilience: Conceptual formulation and quantitative assessment for intervention development in the urban wastewater system. Water Res. 2022, 211, 118108. [Google Scholar] [CrossRef]
- Trang, N.T.T.; Loc, H.H. Livelihood sustainability of rural households in adapting to environmental changes: An empirical analysis of ecological shrimp aquaculture model in the Vietnamese Mekong Delta. Environ. Dev. 2021, 39, 100653. [Google Scholar] [CrossRef]
- Zhou, W.; Guo, S.; Deng, X.; Xu, D. Livelihood resilience and strategies of rural residents of earthquake-threatened areas in Sichuan Province, China. Nat. Hazards 2021, 106, 255–275. [Google Scholar] [CrossRef] [PubMed]
- Mekuyie, M.; Jordaan, A.; Melka, Y. Understanding resilience of pastoralists to climate change and variability in the Southern Afar Region, Ethiopia. Clim. Risk Manag. 2018, 20, 64–77. [Google Scholar] [CrossRef]
- Fan, Y.; Shi, X.; Li, X.; Feng, X. Livelihood resilience of vulnerable groups in the face of climate change: A systematic review and meta-analysis. Environ. Dev. 2022, 44, 100777. [Google Scholar] [CrossRef]
- Nguyen, M.T.; Renaud, F.G.; Sebesvari, Z. Drivers of change and adaptation pathways of agricultural systems facing increased salinity intrusion in coastal areas of the Mekong and Red River deltas in Vietnam. Environ. Sci. Policy 2019, 92, 331–348. [Google Scholar] [CrossRef]
- Eshrati, L.; Mahmoudzadeh, A.; Taghvaei, M. Multi hazards risk assessment, a new methodology. Int. J. Health Syst. Disaster Manag. 2015, 3, 79–88. [Google Scholar]
- Quandt, A. Measuring livelihood resilience: The Household Livelihood Resilience Approach (HLRA). World Dev. 2018, 107, 253–263. [Google Scholar] [CrossRef]
- Lwin, K.K.; Pal, I.; Shrestha, S.; Warnitchai, P. Assessing social resilience of flood-vulnerable communities in Ayeyarwady Delta, Myanmar. Int. J. Disaster Risk Reduct. 2020, 51, 101745. [Google Scholar] [CrossRef]
- Abenir, M.A.D.; Manzanero, L.I.O.; Bollettino, V. Community-based leadership in disaster resilience: The case of small island community in Hagonoy, Bulacan, Philippines. Int. J. Disaster Risk Reduct. 2022, 71, 102797. [Google Scholar] [CrossRef]
- Koliou, M.; van de Lindt, J.W.; McAllister, T.P.; Ellingwood, B.R.; Dillard, M.; Cutler, H. State of the research in community resilience: Progress and challenges. Sustain. Resilient Infrastruct. 2018, 5, 131–151. [Google Scholar] [CrossRef]
- Thulstrup, A.W. Livelihood resilience and adaptive capacity: Tracing changes in household access to capital in central Vietnam. World Dev. 2015, 74, 352–362. [Google Scholar] [CrossRef]
- Mallick, B.; Sultana, Z.; Bennett, C.M. How do sustainable livelihoods influence environmental (non-)migration aspirations? Appl. Geogr. 2020, 124, 102328. [Google Scholar] [CrossRef]
- Triet, N.V.K.; Dung, N.V.; Hoang, L.P.; Le Duy, N.; Tran, D.D.; Anh, T.T.; Kummu, M.; Merz, B.; Apel, H. Future projections of flood dynamics in the Vietnamese Mekong Delta. Sci. Total. Environ. 2020, 742, 140596. [Google Scholar] [CrossRef] [PubMed]
- Bayissa, Y.; Maskey, S.; Tadesse, T.; Van Andel, S.J.; Moges, S.A.; Van Griensven, A.; Solomatine, D. Comparison of the Performance of Six Drought Indices in Characterizing Historical Drought for the Upper Blue Nile Basin, Ethiopia. Geosciences 2018, 8, 81. [Google Scholar] [CrossRef]
- Hayes, M.J.; Svoboda, M.; Wall, N.A.; Widhalm, M. The Lincoln Declaration on Drought Indices: Universal Meteorological Drought Index Recommended. Bull. Am. Meteorol. Soc. 2011, 92, 485–488. [Google Scholar] [CrossRef]
- Edwards, D.C.; McKee, T.B. Characteristics of 20th Century Drought in the United States at Multiple Time Scales. Department of Atmospheric Science, Colorado State University. 1997. Available online: http://weather.uwyo.edu/upperair/sounding.html (accessed on 3 May 2023).
- Climate Hazarad Center UC Santa Barbara. CHIRPS: Rainfall Estimates from Rain Gauge and Satellite Observations; Climate Hazards Group InfraRed Precipitation with Station Data (CHIRPS). 2023. Available online: https://www.chc.ucsb.edu/data/chirps (accessed on 3 May 2023).
- Joint Research Centre Data Catalogue. “Datasets: Floods”. Datasets. European Commission. 2023. Available online: https://data.jrc.ec.europa.eu/dataset?collection=FLOODS&q=Floods (accessed on 3 May 2023).
- Dottori, F.; Alfieri, L.; Bianchi, A.; Skoien, J.; Salamon, P. River Flood Hazard Maps for Europe and the Mediterranean Basin Region. 2021. Available online: https://dataoi.jorcg/10.ec.europa.eu/dataset2905/1d128b6c-a4ee-4858-9e34-6210707f3c81#citation (accessed on 3 May 2023).
- DFID. Sustainable Livelihoods Guidance Sheets; Department for International Development: London, UK, 1999; Available online: http://www.livelihoodscentre.org/documents/20720/100145/Sustainable+livelihoods+guidance+sheets/8f35b59f-8207-43fc-8b99-df75d3000e86 (accessed on 3 May 2023).
- IPCC. Climate Change 2022: Impacts, Adaptation and Vulnerability Summary of Policy Makers. In Climate Change 2022: Impacts, Adaptation and Vulnerability. Contribution of Working Group II to the Sixth Assessment Report of the Intergovernmental Panel on Climate Change; Cambridge University Press: Cambridge, UK; New York, NY, USA, 2022; pp. 3–33. [Google Scholar]
- Meuwissen, M.P.M.; Feindt, P.H.; Spiegel, A.; Termeer, C.J.A.M.; Mathijs, E.; De Mey, Y.; Finger, R.; Balmann, A.; Wauters, E.; Urquhart, J.; et al. A Framework to Assess the Resilience of Farming Systems. Agric. Syst. 2019, 176, 102656. [Google Scholar] [CrossRef]
- Carpenter, S.; Walker, B.; Anderies, J.M.; Abel, N. From Metaphor to Measurement: Resilience of What to What? Ecosystems 2001, 4, 765–781. [Google Scholar] [CrossRef]
- Nghia, B.P.Q.; Pal, I.; Chollacoop, N.; Mukhopadhyay, A. Applying Google earth engine for flood mapping and monitoring in the downstream provinces of Mekong river. Prog. Disaster Sci. 2022, 14, 100235. [Google Scholar] [CrossRef]
- World Meteorological Organization. Standardized Precipitation Index User Guide; World Meteorological Organization: Geneva, Switzerland, 2012. [Google Scholar]
- Perera, E.D.P.; Sayama, T.; Magome, J.; Hasegawa, A.; Iwami, Y. RCP8.5-Based Future Flood Hazard Analysis for the Lower Mekong River Basin. Hydrology 2017, 4, 55. [Google Scholar] [CrossRef]
- Try, S.; Tanaka, S.; Tanaka, K.; Sayama, T.; Hu, M.; Sok, T.; Oeurng, C. Projection of extreme flood inundation in the Mekong River basin under 4K increasing scenario using large ensemble climate data. Hydrol. Process. 2020, 34, 4350–4364. [Google Scholar] [CrossRef]
- Kang, L.; Jiang, S.; Hu, X.; Li, C. Evaluation of Return Period and Risk in Bivariate Non-Stationary Flood Frequency Analysis. Water 2019, 11, 79. [Google Scholar] [CrossRef]
- Osetinsky-Tzidaki, I.; Fredj, E. The 50- and 100-year Exceedance Probabilities as New and Convenient Statistics for a Frequency Analysis of Extreme Events: An Example of Extreme Precipitation in Israel. Water 2022, 15, 44. [Google Scholar] [CrossRef]
- Pokhrel, Y.; Burbano, M.; Roush, J.; Kang, H.; Sridhar, V.; Hyndman, D.W. A Review of the Integrated Effects of Changing Climate, Land Use, and Dams on Mekong River Hydrology. Water 2018, 10, 266. [Google Scholar] [CrossRef]
- Rahman, K.F.; Pal, I.; Szabo, S.; Pramanik, M.; Udmale, P. Transboundary Water Risk Governance Frameworks in Deltaic Socio-Economic Regions: A Case Study of River Deltas in Bangladesh, India, and Vietnam; Elsevier: Amsterdam, The Netherlands, 2021; pp. 49–72. [Google Scholar] [CrossRef]
- Dang, T.D.; Cochrane, T.A.; Arias, M.E.; Tri, V.P.D. Future hydrological alterations in the Mekong Delta under the impact of water resources development, land subsidence and sea level rise. J. Hydrol. Reg. Stud. 2018, 15, 119–133. [Google Scholar] [CrossRef]
- Bastakoti, R.C.; Gupta, J.; Babel, M.S.; van Dijk, M.P. Climate risks and adaptation strategies in the Lower Mekong River basin. Reg. Environ. Chang. 2013, 14, 207–219. [Google Scholar] [CrossRef]
- Sharifi, A. A critical review of selected tools for assessing community resilience. Ecol. Indic. 2016, 69, 629–647. [Google Scholar] [CrossRef]
- Myint, T. Beyond a ‘Two-Level’ Game: Local Livelihood Issues and International Development Institutions in the Mekong River Basin. TRaNS: Trans -Regional -National Stud. Southeast Asia 2014, 2, 223–245. [Google Scholar] [CrossRef]
- Ho, T.D.N.; Kuwornu, J.K.M.; Tsusaka, T.W.; Nguyen, L.T.; Datta, A. An assessment of the smallholder rice farming households’ vulnerability to climate change and variability in the Mekong delta region of Vietnam. Local Environ. 2021, 26, 948–966. [Google Scholar] [CrossRef]
- Armitage, D.; Béné, C.; Charles, A.T.; Johnson, D.; Allison, E.H. The Interplay of Well-being and Resilience in Applying a Social-Ecological Perspective. Ecol. Soc. 2012, 17, 17. [Google Scholar] [CrossRef]
- Béné, C.; Newsham, A.; Davies, M.; Ulrichs, M.; Godfrey-Wood, R. Review article: Resilience, poverty and development. J. Int. Dev. 2014, 26, 598–623. [Google Scholar] [CrossRef]
- Graveline, M.-H.; Germain, D. Disaster Risk Resilience: Conceptual Evolution, Key Issues, and Opportunities. Int. J. Disaster Risk Sci. 2022, 13, 330–341. [Google Scholar] [CrossRef]
- Tierney, K.; Bruneau, M. Conceptualizing and measuring resilience: A key to disaster loss reduction. TR News 2007, 250, 14–17. [Google Scholar]
- Magis, K. Community Resilience: An Indicator of Social Sustainability. Soc. Nat. Resour. 2010, 23, 401–416. [Google Scholar] [CrossRef]
- Berkes, F.; Ross, H. Community Resilience: Toward an Integrated Approach. Soc. Nat. Resour. 2013, 26, 5–20. [Google Scholar] [CrossRef]
- Kulig, J.C.; Edge, D.S.; Townshend, I.; Lightfoot, N.; Reimer, W. Community resiliency: Emerging theoretical insights. J. Community Psychol. 2013, 41, 758–775. [Google Scholar] [CrossRef]
- Ba, R.; Deng, Q.; Liu, Y.; Yang, R.; Zhang, H. Multi-hazard disaster scenario method and emergency management for urban resilience by integrating experiment–simulation–field data. J. Saf. Sci. Resil. 2021, 2, 77–89. [Google Scholar] [CrossRef]
- Mekong River Commssion. Basin Development Strategy for the Mekong River Basin 2021–2030 & MRC Strategic Plan 2021–2025; Mekong River Commission: Laos, Vientiane, 2021; p. 37. [Google Scholar]
- Zuccaro, G.; Leone, M.; Martucci, C. Future research and innovation priorities in the field of natural hazards, disaster risk reduction, disaster risk management and climate change adaptation: A shared vision from the ESPREssO project. Int. J. Disaster Risk Reduct. 2020, 51, 101783. [Google Scholar] [CrossRef]
Disclaimer/Publisher’s Note: The statements, opinions and data contained in all publications are solely those of the individual author(s) and contributor(s) and not of MDPI and/or the editor(s). MDPI and/or the editor(s) disclaim responsibility for any injury to people or property resulting from any ideas, methods, instructions or products referred to in the content. |
© 2023 by the authors. Licensee MDPI, Basel, Switzerland. This article is an open access article distributed under the terms and conditions of the Creative Commons Attribution (CC BY) license (https://creativecommons.org/licenses/by/4.0/).