Article

High-Energy Synthesis Gases from Waste as Energy Source for Internal Combustion Engine

Faculty of Mechanical Engineering, Slovak University of Technology in Bratislava, Námestie Slobody 17, 812 31 Bratislava, Slovakia
*
Author to whom correspondence should be addressed.
Sustainability 2023, 15(10), 7806; https://doi.org/10.3390/su15107806
Submission received: 3 April 2023 / Revised: 28 April 2023 / Accepted: 5 May 2023 / Published: 10 May 2023
(This article belongs to the Special Issue Fuels for the Future)

Abstract

:
The aim of the presented article is to analyse the influence of the composition of synthesis gases with mass lower heating values in the range from 12 to 20 MJ/kg on the performance, economic, and internal parameters of an atmospheric two-cylinder spark-ignition combustion engine suitable for a micro-generation unit. The analysed performance parameter was the torque. The economic parameters analysed were the hourly fuel consumption and the engine’s effective efficiency. The analysed internal parameters of the engine were the indicated mean effective pressure, the pressure profiles in the cylinder, the course of the maximum pressure in the cylinder, and the course of the burning-out of the fuel in the cylinder. The analysed synthesis gases were produced by thermo-chemical processes from waste containing combustible components (methane, hydrogen and carbon monoxide) as well as inert gases (carbon dioxide and nitrogen). Higher hydrocarbons, which may be present in a synthesis gas, were not considered in this contribution because of their easy liquefaction at higher pressures in pressure bottles. A total of ten gases were analysed, all of which fall into the category of high-energy synthesis gases. The measured data from the operation of the combustion engine running on the examined gases were compared with the reference fuel methane. The measured results show a decrease in the performance parameters and an increase in the hourly fuel consumption for all operating loads. Specifically, at the engine speed of 1500 rpm, the drop in performance parameters was in the range from 9% to 24%. The performance parameters were directly proportional to the lower volumetric heating value of the stoichiometric mixture of gases with air. The rising fuel consumption proportionally matched the increase in the mass proportion of fuel in the stoichiometric mixture with air. The effective efficiency of the engine varied from 27.4% to 31.3% for different gas compositions, compared to 31.6% for methane. The conclusive results indicate that the proportion of hydrogen, methane and inert gases in the stoichiometric mixture of synthesis gases with air has the greatest influence on the course of fuel burning-out. The article points to the potential of energy recovery from waste by transforming waste into high-energy synthesis gases and their use in cogeneration.

1. Introduction

Combustible components of the individual synthesis gases analysed in this contribution present mass heating values of the fuel varying from 12 MJ/kg to approximately 19.5 MJ/kg. We have named them high-energy synthesis gases, and by analysing them, we build on our experimental results with low- and medium-energy gases published in previous work [1,2]. The composition of the gases presented in this article compares with the technologies of gasification and pyrolysis of municipal waste and, in most cases, pyrolysis of plastics.
Due to the increasing production of plastic products in recent decades (from approx. 2 million tons in 1950 to approx. 150 million tons in 2000 and more than 320 million tons in 2018), a problem arises with the plastic products’ life cycle after the end of their use for their original planned purpose. Moreover, a large part of plastic waste comes from plastic packaging, which is usually intended for one or only a limited number of uses and such products make up 42% of all produced plastic products [3,4,5,6,7,8]. This state is also influenced by the rather long time of their natural decomposition, which pollutes the environment and individual ecosystems with plastic waste [3,4,9,10,11]. One of the possible solutions is the recycling of plastics, which can be processed back as an input raw material to produce new products. The problem, however, is that many types of plastics are problematic to recycle (e.g., thermosets) either due to the degradation of the original structures of the material or due to their original form (e.g., plastic bags and foils); when the input material processing becomes hard, it can easily clog recycling facilities. Other problems of plastic recycling are that the input material is a part of mixed waste, or is too dirty (which also results from its frequent use as the aforementioned packaging material). Thus, the following sorting and cleaning are difficult and unprofitable. For the reasons mentioned above, the amount of recycled plastics is low, only about 9%, and only 2% are recycled repeatedly [5,8,10,12,13,14,15,16]. In addition to recycling, we can also reduce the amount of plastic waste by incinerating it, the share of which has increased in recent times, especially in Europe and China [10]. Although incineration brings about a reduction in the volume of plastic in landfills with possible leakage and damage to ecosystems, it also causes the production of toxic and acidic gases, as well as solid particles, which are released into the surrounding air, thereby only shifting the environmental burden to another area [6,11,17]. Another possible way to recover plastics from waste in order to prevent their accumulation in landfills is their gasification or a commonly called process “Plastic-to-Fuel”, which falls under the so-called chemical recycling [6,7,18]. With this method, we can effectively reduce the volume and weight of the original waste, as well as obtain gaseous and liquid substances that can be further used. With the aforementioned procedures and cleaning, we can obtain a mixture of gaseous substances from plastic waste, the so-called synthesis gas. This is composed primarily of hydrogen, carbon monoxide, methane, carbon dioxide, various hydrocarbons and possibly nitrogen (the specific composition depends on the composition of the input raw material “feedstock” as well as the processing method used) [16,18,19,20,21,22,23,24,25,26,27,28]. The synthesis gas obtained in this way can possibly be used for the production of hydrogen, which can be used as an input raw material in the chemical production of synthesis fuels. Another possibility is to use synthesis gas as a gaseous fuel [18,19,24,25,26,29,30,31]. Of course, synthesis fuels can be created from various organic substrates. The benefits of using such synthesis fuels to reduce carbon dioxide production have been theoretically proven [32,33].
Thanks to the revaluation of products after the end of their life cycle, we can reduce our dependence on fossil fuels produced directly from oil. This revaluation is a great advantage in the fight against ever-increasing energy consumption. The revaluation process also means a higher energy utilization of the primary raw material source, which leads to a reduction in the necessary amount of energy in circulation, which brings several positives, since the acquisition of the primary raw material negatively affects the quality of the environment [8,15,26,34,35]. However, it is also important to note that synthesis gas can be produced not only from waste products, but also directly from fossil fuels, which means that when using synthesis gas thus obtained, we do not achieve the same ecological benefits that we are able to achieve when using waste [19,24,31,36]. Fuels produced from alternative sources can help countries, e.g., in Central Europe and elsewhere, to diversify their energy sources, to reduce the use of fossil resources and thus to fulfil the goals of international agreements [37,38].
The synthesis gases obtained from plastic waste reach relatively high heating values and are therefore referred to as high-energy synthesis gases. The gases obtained in this way can reach values of a lower volumetric heating value (LHV) of more than 14 MJ/m3 [20,25,27,39]. For this reason, they are a welcome alternative fuel for propulsion either in gas turbines or internal combustion engines or in cogeneration units. As already mentioned, the relative representation of the individual components of these gases varies significantly depending on the composition of the input raw material, the processing method used and the boundary conditions, such as temperature, pressure, processing time, catalyst material, etc. Commonly in the synthesis gas, the volume percentage of hydrogen is usually in the range of 2 to 70%; carbon monoxide up to 41%; carbon dioxide up to 29%; methane up to 15% and higher hydrocarbons up to 7%. However, if nitrogen is used during the gasification or subsequent treatment processes, its presence in the resulting gas can also be significant, which can result in a decrease in the heating value of synthesis gas (syngas) [22,23,25,27,40,41,42].
The use of “syngas” as a fuel in reciprocating combustion engines (cogeneration units) has been investigated for a long time. In addition to the already mentioned advantages, we can note that in the case of sufficiently clean synthesis gas, it is possible to achieve a reduction in harmful gas emissions in the exhaust during combustion. These are also reduced by the catalyst technology in the engine exhaust, which is why we use a fundamentally stoichiometric mixture in our experiments. Depending on the synthesis gas composition, the advantages also include sufficient resistance to abnormal combustion, thanks to which resistance synthesis gas can also be used in engines with a higher compression ratio [43,44]. Synthesis gases are also an advantageous alternative fuel mainly for gaseous fossil fuels, such as natural gas, without the need for major engine adaptations [45,46].

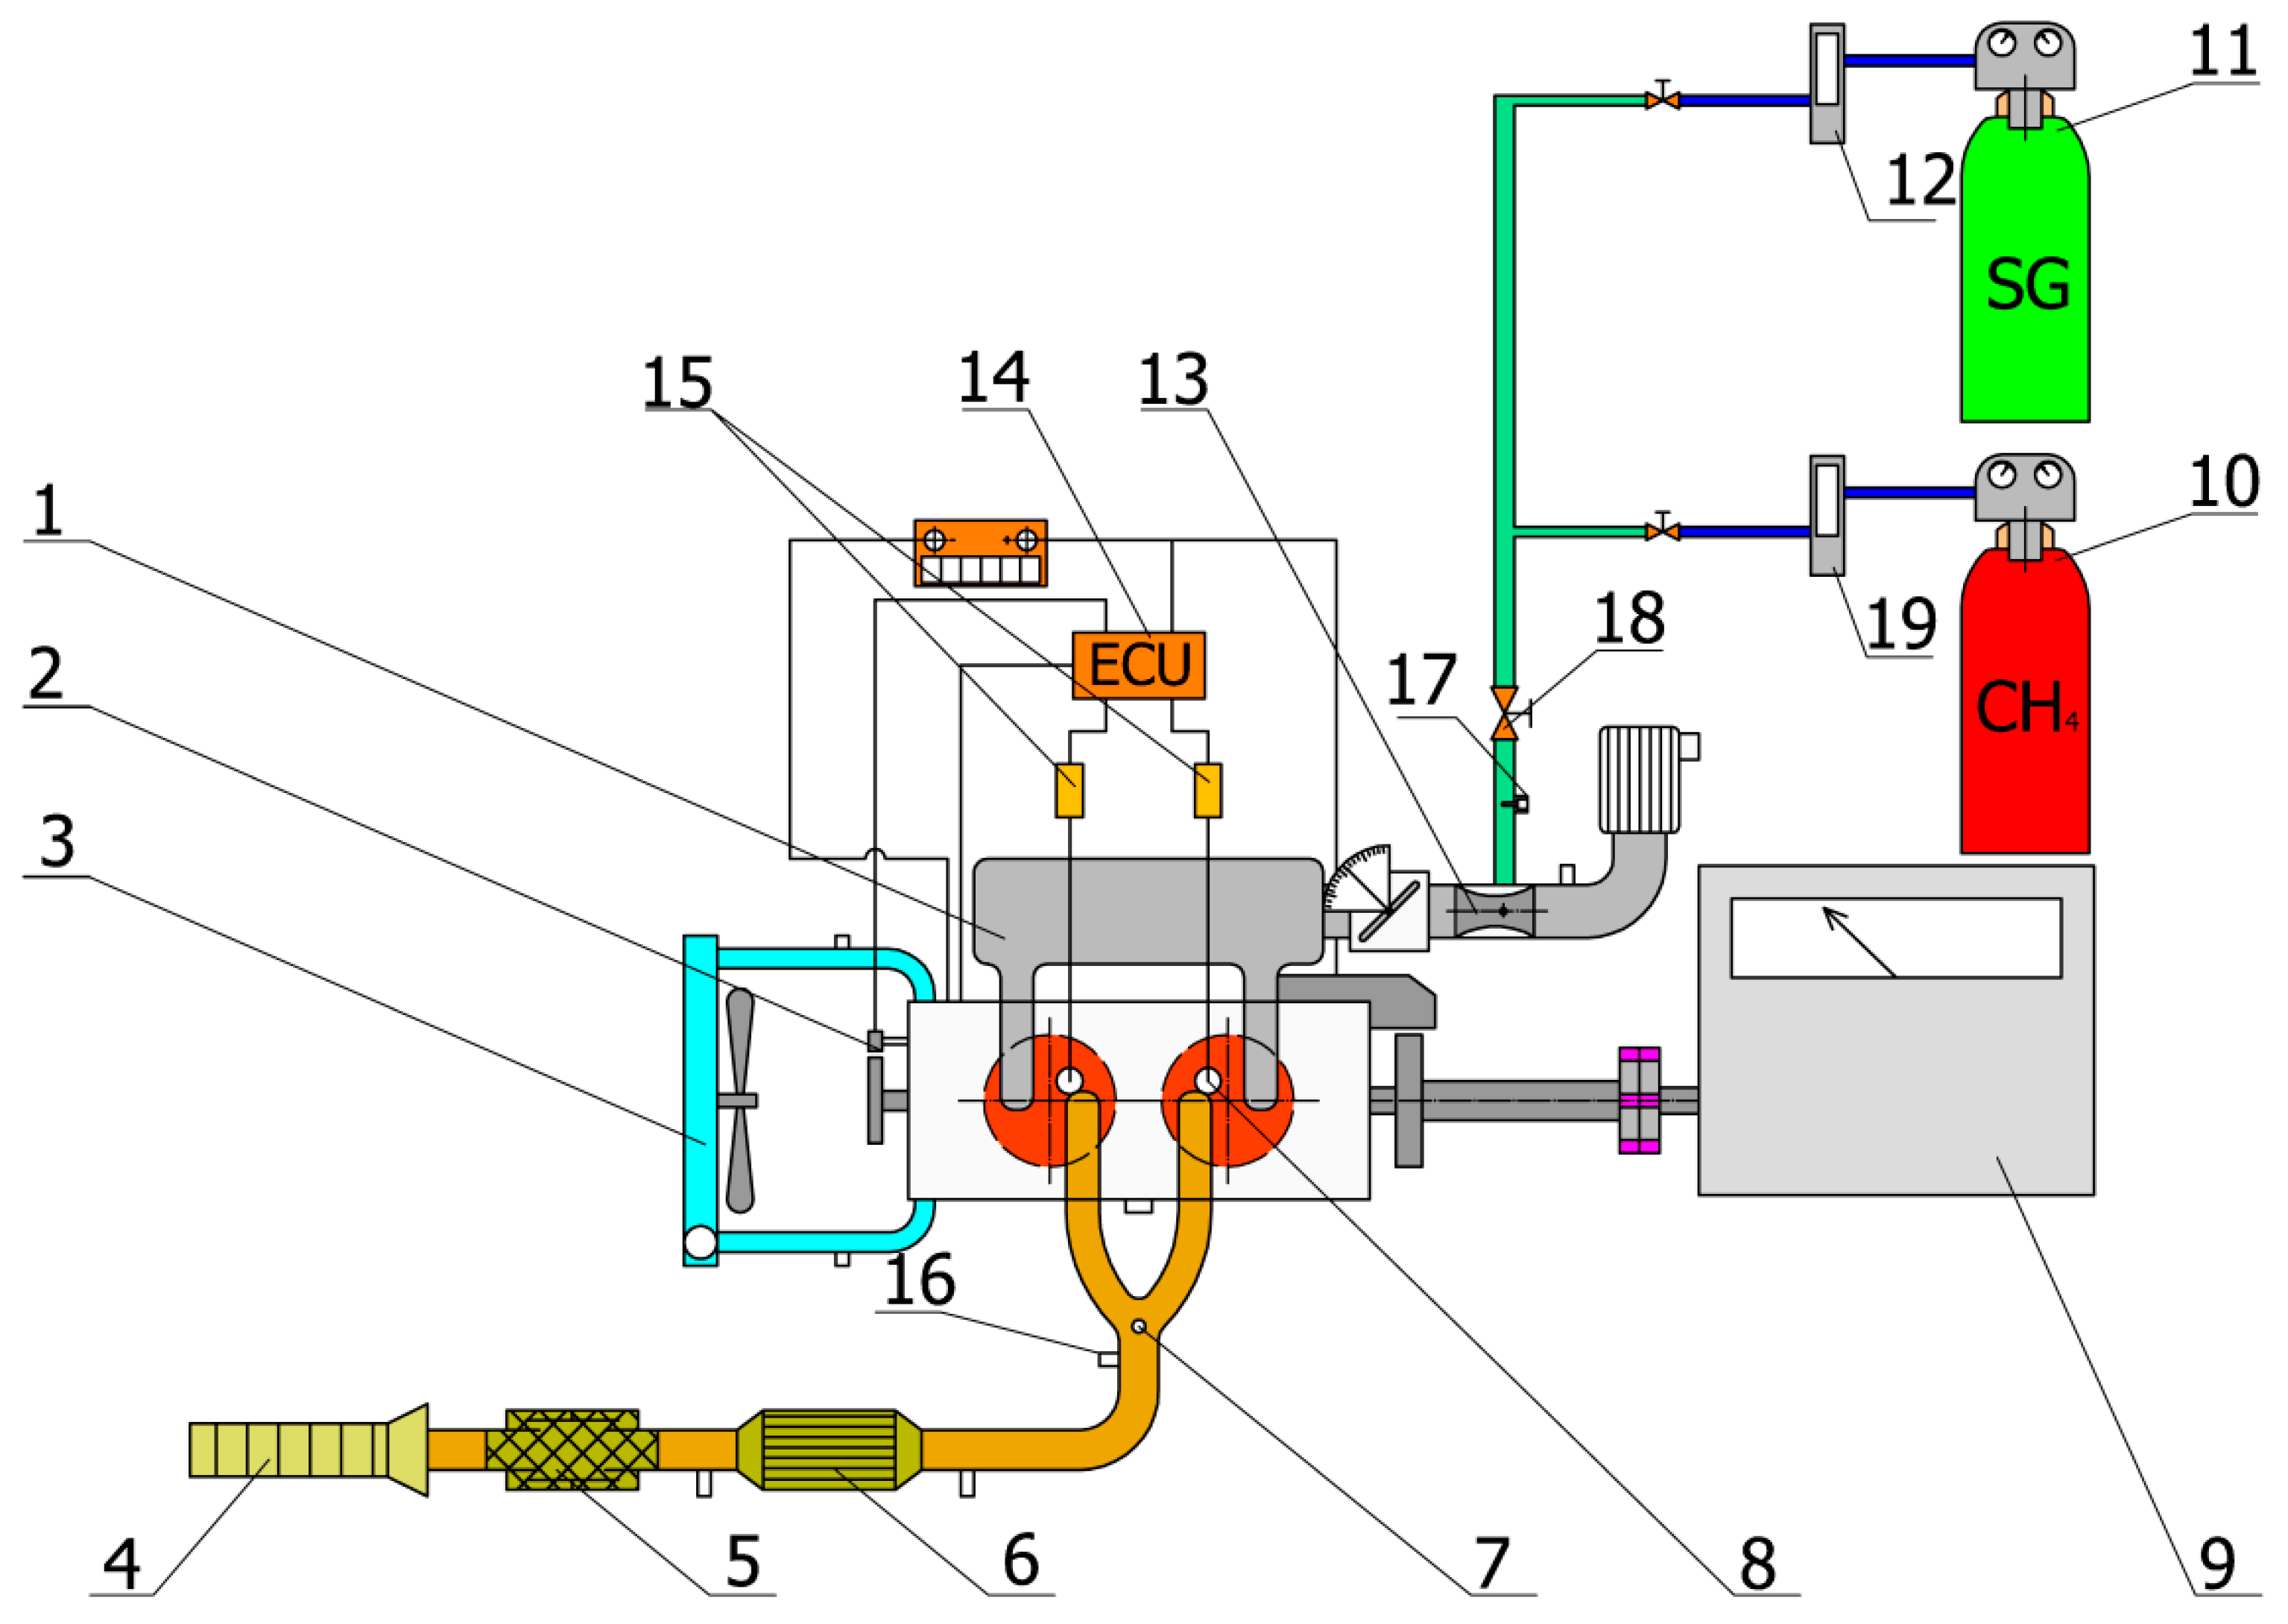
2. Experimental Methods

The following parts of the text of this contribution present selected compositions of synthesis gases, which were developed based on the above-mentioned analysis of synthesis gases produced by the pyrolysis of plastics. In this article, ten synthesis gases are presented, which, because of their lower heating value (12–20 MJ/kg), fall into the category of high-energy gases. As mentioned above, the authors of this article published the use of low-energy as well as medium-energy synthesis gases, produced by gasification of municipal waste, and their utilisation in the combustion engine in 2020 or 2022 [1,2]. The following figure (Figure 1) shows a ternary diagram with the area covered by the selected and analysed synthesis gases (numbers 1 to 10 in the inner area of the diagram) depending on the combustible components of the synthesis gas, namely, on the percentage volume representation of methane CH4, hydrogen H2 and carbon monoxide CO in the gas. The proportion of inert gases was constant for all gases examined (30% vol.).
The basic physical–chemical properties of the experimentally verified synthesis gases are shown in the following table (Table 1). The individual synthesis gases are ranked in ascending order of increasing the lower heating value of the fuel. It is known that the performance parameters of an internal combustion engine will be largely influenced by the amount of released energy contained in the fuel located in the combustion chamber for one cycle. This amount of energy is best characterized by the lower volume heating value of the mixture (LHVmixture) of fuel and air. Other parameters that affect engine performance are the filling of the cylinders with a fresh mixture, represented by their volumetric efficiency, as well as the course of fuel combustion in the engine combustion chamber. Last, but not least, the resulting volumetric amount of products after combustion also impacts the output performance parameters.
Similar to our previous publications [1,2], the experimental measurements were carried out on the Lombardini LGW702 atmospheric spark-ignition engine (Table 2). Modifications of this two-cylinder engine lay in the modification of the head of the combustion engine, the compression ratio and the intake manifold as well as the method of preparation of the mixture. Because of its small displacement, the engine reduces fuel costs for experiments.
The arrangement diagram of the experimental equipment together with the description of the individual components is shown in the following figure (Figure 2). The internal combustion engine was braked by an electric induction dynamometer MEZ Vsetín (1DS 736 V), which can work in two modes: in motor mode and generator mode of operation. The mass flow rate of the gaseous fuels was measured with the flow meter F-113AC-M50-AAD-55-V from the Bronkhorst company. This mass flow meter used nitrogen as the reference fuel. The actual flow rate was multiplied by the multiplication factor specific to each syngas composition to obtain the actual syngas mass flow rate. All experimental measurements, published in this article, were carried out during stoichiometric operation, which was ensured by the feedback regulation of the control unit by the broadband lambda probe (Bosch LSU 4.9, Bosch Engineering GmbH, Abstatt, Germany) located in the exhaust pipe and by the action member—a stepper motor that regulated the flow of gas in the fuel line leading to the mixer.

Pressure Analysis

The measurement of pressure curves was carried out at the speed of the micro-cogeneration unit (or combustion engine) at 1500 rpm (or min−1). It was measured with the system of Kistler sensors. The pressure in the cylinder was measured with a piezoelectric pressure sensor integrated into the spark plug KISTLER (6118CC-4CQ02-4-1) from Kistler Company, Switzerland. The correction of the dynamic course of the pressure in the cylinder was realized by sensing the course of the pressure in the intake manifold in the BDC area during the opening of the intake valve. The absolute value of the pressure in the intake manifold was sensed with the 4075A10 piezo-resistive pressure sensor. The actual crankshaft position was measured with the Kistler 2613B1 encoder. Both devices mentioned above were from Kistler Switzerland. In order for us to be able to analyse the burning-out of the fuel, the actual moment of the spark jump was also measured in each work cycle using a self-developed sensor based on the principle of an optic-coupler with a diode, which was connected in parallel with two combined BOSCH P65-T ignition coils (Bosch Engineering GmbH, Abstatt, Germany) with a maximum spark energy 65 mJ. A program for post-processing and evaluation of measured data was developed in Matlab (version 9.11).
The analysis of the course of the fuel combustion was based on the one-zone zero-dimensional thermodynamic model [47]. The analysis of the fuel burning-out and heat release is based on the Rassweiler–Withrow method. This method is based on the knowledge that the increase in pressure in the combustion chamber of the engine is composed of a partial pressure component from the combustion itself and a partial component from the movement of the piston in the cylinder. The first law of thermodynamics is applicable in the following form:
d U = d Q d W + i h i × d m i
where
  • dU—differential of internal energy of matter in the system.
  • dQ—differential of heat delivered to the system.
  • dW—differential of the work produced by the system.
  • hi × dmi—i-th component of enthalpy of mass flow across system boundaries (during combustion, this term is assumed to be zero).
By writing out and modifying the above Equation (1), we obtain the following form:
d Q c h = 1 κ 1   V d p + κ κ 1 p d V + u r T κ 1 d m c i h i × d m i + d Q h t
where
  • dQchdifferential of the released chemical energy from the fuel.
  • κ—specific heat ratio.
  • u—specific internal energy.
  • r—mass specific gas constant.
  • T—mean thermodynamic temperature.
  • dmctotal mass of charge.
  • dQhtdifferential of the heat transfer to the chamber walls.
During combustion, the last three members of Equation (2) are considered to be zero, and then the final shape of the pressure increment was obtained from the two partial increments:
d p = κ 1 V d Q κ p V d V = d p c + d p p
In Equation (3), the first member (dpc) represents the pressure change due to combustion and the second member (dpp) is the incremental change due to the volume change.
The start and the end of the combustion were determined by the change in entropy during combustion. See [48] for more details. To determine the beginning and the end of the combustion process, we also used another method, namely a method based on the deviation of the combustion curve from the compression or the expansion line in the logarithmic p-V diagram.
In approximately 195 consecutive cycles, the pressure was measured at each measuring point. A statistical analysis was evaluated from them in the form of determined coefficients of variation (COV) for various cyclically repeating parameters. It is calculated as the ratio of the standard deviation to the arithmetic mean of the investigated parameter, as stated by the following relation:
COV = 1 n 1 i = 1 n x i x ¯ x ¯ · 100 %
The cycle variability (COV) deals with the evenness of engine operation and with the overall life of an internal combustion engine. It also affects its performance parameters.
All synthesis gas compositions were examined in the range of engine revolutions from 1200 to 2200 rpm, with stoichiometric composition of a mixture and at full load. The pre-ignition angle was optimized for each engine operating mode in order to achieve the best performance parameters. All output integral parameters were reduced to normal ambient conditions (NTP = 20 °C, 101,325 Pa).

3. Experimental Results

The basic comparative fuel in the analysis of the effects of synthesis gases on the parameters of the combustion engine was methane, to which the results obtained by chosen synthesis gases were compared. The following graphs show integral parameters divided into two groups. The first group includes gases with a constant proportion of carbon monoxide (10% vol.), and the second group includes the remaining synthesis gases. All synthesis gases have a constant proportion of inert gases (30% vol.) and only the proportions of combustible components change.

3.1. Integral Parameters of Combustion Engine

The following graphs (Figure 3 and Figure 4) show the curves of torque and hourly fuel consumption in the main speed characteristics of the engine for different gaseous fuels, divided into the two groups mentioned above. From the preliminary analysis of the physical–chemical properties, it follows that the highest lower volumetric heating value (LHVmixture Table 1) of the stoichiometric mixture of fuel and air (3.023 and 3.025 MJ/m3) was achieved in the synthesis gases SG4, SG7 and SG10, and, on the contrary, the lowest (2.820 MJ/m3) in the synthesis gas SG2. Therefore, when burning synthesis gases SG4, SG7 and SG10, the highest performance parameters can be expected, since the main factor influencing the output performance parameters is the energy contained in the cylinder. Another factor is the value of filling the cylinder with fresh mixture, which is expressed by the volumetric efficiency. An equally important factor (as we mentioned above), is the course of fuel burn and also the volumetric amount of products after combustion. It can be seen from the graphs that the highest torque value (39.7 N·m) at the operating speed of 1500 rpm was achieved exactly during the combustion of the above-mentioned synthesis gas SG4. The torque decrease when running on SG4 is approximately 9% compared to running on methane across the entire engine speed range. Conversely, the lowest torque value (33.2 N·m) was achieved when operating on SG2 fuel with the lowest volumetric lower heating value of the mixture (2.820 MJ/m3).
Compared to the hourly fuel consumption, the reference fuel methane has the lowest hourly consumption (1.56 kg/h), which needs only 9.5% vol. of methane to create a stoichiometric mixture with air. The value of the volume fraction of synthesis gases in the stoichiometric mixture ranges from 16.0% vol. for SG10 up to 29.6% vol. for SG2. The highest hourly fuel consumption (5.79 kg/h) during the micro-cogeneration unit operating speed of 1500 rpm was when combusting synthesis gas SG1, which had the highest mass fraction of fuel (21.5% wt.) in the stoichiometric mixture with air. On the contrary, the lowest hourly fuel consumption (3.68 kg/h) was measured with the gas marked SG10, which had the lowest volume or mass fraction of fuel (26.7% vol. or 13.4% wt.) in the stoichiometric mixture.
The highest value of the total effective efficiency (31.6%) for the speed of 1500 rpm was achieved when operating on methane. Out of all the synthesis gases, the highest efficiency (31.3% or 31.2%) was measured with the synthesis gases labelled SG4 and SG8. Conversely, the lowest effective efficiency (27.4%) was measured while running on the synthesis gas SG2.

3.2. Internal Parameters of Combustion Engine

Figure 5 and Figure 6 show the indicated mean effective pressure (IMEP) curves depending on the angle of rotation of the crankshaft, when 50% of the fuel is burned. The IMEP waveform for each fuel was created from a set of measurements at different start of ignition (SOI) angles ranging from the smallest SOI that ensured continuous engine operation to 40 °CA BTDC (Crank Angle before Top Dead Centre) and 195 consecutive cycles were evaluated in each operating mode. The largest average IMEP value (0.965 MPa) was achieved when operating on methane. At this IMEP value, the angle at which 50% of the mass of fuel is burned was 8.6 °CA ATDC (Crank Angle after Top Dead Centre). The optimal SOI angle was 26 °CA BTDC when burning methane. Among the synthesis gases, the highest IMEP value (0.886 MPa) was achieved by the SG4 gas (the angle α50%MFB has a value of approx. 9.5 °CA ATDC). The lowest value of IMEP (0.774 MPa) was achieved when burning gas labelled SG2 with an angle when 50% of the fuel is burned, approx. 10.5 °CA ATDC. Figure 5 and Figure 6 show the dispersion of the individually measured IMEP values. This dispersion is characterized using the coefficient of variation (COV) of the mean indicated pressure. This value was 0.58% when the engine was running on methane with an optimal SOI angle. During the operation of the combustion engine on synthesis gases, the coefficient of variation ranged from 0.59% for synthesis gas SG1 to 3.3% for synthesis gas SG2. The higher COV value for SG2 gas is caused by a high proportion of hydrogen (50% vol.) and at the same time a low proportion of methane (10% vol.).
The developed diagrams p—α for synthesis gases and methane (Figure 7 and Figure 8) depict the average course of the pressure p in the cylinder during compression and expansion, depending on the angle of rotation of the crankshaft α. The pressure curves are plotted for optimum SOI angles (i.e., for maximum IMEP values) for each fuel. For methane, the highest pressure value (6.04 MPa) was reached at the angle of 12.8 °CA ATDC. Out of the synthesis gases, the highest pressure (5.96 MPa or 5.94 MPa) was reached for the synthesis gases SG8 or SG5. For these two gases, the character of the pressure course was also registered, as mentioned above, at approximately the same IMEP value (0.828 MPa and 0.847 MPa, respectively). The SG9 gas had the lowest value of maximum pressure (4.83 MPa). When comparing the coefficient of variation (COV) of the maximum pressure, the highest value (8.2%) was achieved with the SG9 synthesis gas. On the contrary, the lowest value (5.4%) was measured for the fuel SG2, which contained the highest proportion of hydrogen (50% vol.) out of the investigated gases. In addition, the SG5 gas, which has 40% vol. of hydrogen, has a relatively low value of the coefficient of variation of maximum pressure (5.8%). The reference fuel methane has a coefficient of variation value of maximum pressure 6.8%. In conclusion, increasing the percentage of hydrogen in the synthesis gas decreases the value of the coefficient of variation of maximum pressure.
The optimum SOI value varied from 16 °CA BTDC for SG2 (high proportion of hydrogen 50% vol., which has a high burning rate) to the value of 27 °CA BTDC for SG10, due to the high proportion of methane (50% vol.), which burns the slowest compared to the other flammable components. The pressure rise rate value for the reference fuel (methane) was 0.225 MPa/1 °CA. Burning SG5 or SG8 gas recorded the highest pressure rise rate value (0.217 MPa/1 °CA), which can be attributed to the already mentioned relatively high proportion of hydrogen in the mixture. The lowest pressure rise rate value (0.151 MPa/1 °CA) was achieved with the SG9 synthesis gas.
If the dependence of the maximum pressure values versus the angle was depicted, for 50% of the mass fraction of the fuel burned (MFB), the course would be of the shape depicted in Figure 9 and Figure 10. For each fuel, an analysis of the regulatory characteristics for different SOI angles was carried out (195 consecutive cycles were analysed for each SOI angle), from which a graph was subsequently constructed. As can be seen from Figure 9 and Figure 10, the maximum pressure in the cylinder for methane is stabilized at the value of approximately 8.5 MPa, and with increasing SOI, it does not change. The course of the maximum pressure against the angle of α50%MFB has the character of an inverted S-shape. The position of the inflection point for methane corresponds to the maximum pressure of 6.1 MPa at approximately 8.5 °CA ATDC. The inflection point of the curve is located at the point in which the combustion engine operation was at the optimum SOI angle (26 °CA BTDC) and thus had the highest value of IMEP (0.965 MPa), at which the α50%MFB angle has the value of 8.5 °CA ATDC. The lowest course of the curve of maximum pressure (approximately 7.5 MPa) is registered for SG2. The inflection point for this gas is at the angle α50%MFB 10.5 °CA ATDC, at which the highest IMEP values (0.774 MPa) are achieved. To summarize, the course of the curve for each synthesis gas had an inflection point at the angle α50%MFB, at which the highest performance parameters were also achieved. In other words, the inflection point was always located in the position at which the operation of the combustion engine is optimal (at the optimum SOI angle).
The following diagrams (Figure 11 and Figure 12) show the fuel burning-out curves (MFB) against the crankshaft rotation angle for different synthesis gas compositions compared to methane. The ignition delay (the time between the start of ignition (SOI) and the moment of visible combustion (SOC)) for methane is around 12.5 °CA for the optimum SOI angle. The period between the SOI and the combustion of methane 5% wt. is approximately 20.4 °CA. The main burning-out period (10–90% MFB) lasts 24.4 °CA. The total burning-out period for methane (the period between SOC and EOC) is 56 °CA.
Of the experimentally verified high-energy gases, SG9 synthesis gas has the longest main burning-out period (27.5 °CA), and vice versa, the SG2 synthesis gas has the shortest main burning-out period (22.6 °CA). The reason is the already-mentioned high proportion of hydrogen in the mixture. The shortest period between the moment of SOI and the angle when 5% of the fuel was burned (11.6 °CA) was for the synthesis gas SG2 (containing 50% vol. H2). On the other hand, the longest period (21.6 °CA) was when the engine was operating on the fuel labelled as SG10, which contains the highest proportion of methane (50% vol.) out of all the analysed gases. The coefficient of variation of the position angle (COVα), when a given mass fraction of the fuel has been burned, generally increases with the increasing mass fraction of the burned fuel. When burning-out methane, the values are as follows: COVα10%MFB = 0.36%, COVα50%MFB = 0.53%, and COVα90%MFB = 0.71%. The synthesis gas SG10 has the largest variance of coefficients of variation for each burning-out period, with the following COV values: COVα10%MFB = 0.43%, COVα50%MFB = 0.62%, and COVα90%MFB = 1.01%. Conversely, the greatest repeatability of the combustion process was achieved by the synthesis gas marked SG2, which has individual coefficients of variation with the following values: COVα10%MFB = 0.23%, COVα50%MFB = 0.38%, and COVα90%MFB = 0.64. The low values are caused by the high content of hydrogen in the gaseous fuel.
The preliminary analysis of the pressure rise rate values, as well as of the COV values for the gradual burning-out of the fuel, signals that the synthesis gases with a higher proportion of hydrogen establish a higher pressure rise rate for the engine run; however, on the other hand, they lead to a more stable operation of the combustion engine.

4. Short Discussion

In the sources of energy from municipal waste, we also include synthesis gases that appear to be an easily usable source of drive for the combustion engines intended for stationary applications, e.g., cogeneration units. This type of fuel contributes to reducing the environmental burden on the environment and to the use of carbon-neutral fuels.
From the analysis of the characteristic properties of synthesis gases, the most important parameter is the volumetric heating value of the stoichiometric mixture of fuel with air. In the second place, the very process of burning-out their mixture must be taken into account, i.e., the rate of heat release and the related pressure curve in the cylinder. The courses of pressure for individual gases are influenced by the SOI value, the ignition delay (i.e., the SOI-SOC value), the burning-out rate of the mixture, the volume change in combusted products, the position and value of the maximum pressure, differences in the expansion of individual gases, etc. All these aspects and parameters that characterize the combustion process, together with the effective filling of the cylinder with a fresh mixture as characterized by volumetric efficiency, also affect the resulting value of the total or effective engine efficiency. We encounter these mutually identical connections between the characteristics of the fuel and the engine itself in all types of low-, medium-, and high-energy synthesis gases that we have measured so far.
The relationship between the brake torque Mt 1500 at an engine speed of 1500 rpm and the volumetric heating value of the stoichiometric mixture LHVmixture for the gases SG1 to SG10, which are classified into the category of high-energy fuels, is shown in Figure 13. The growing trend of this performance parameter is linear and is directly related to the increase in the volumetric heating value of the burned mixture. The linear trend line (red straight line), plotted across the measured values, shows that the deviations in the measured data from the trend line in Figure 13 are for all gases in the range up to max. ±5%.
Figure 14 shows the dependence of the hourly fuel consumption of the engine at the speed of 1500 rpm at the full load on the mass proportion of fuel (SGs) in the stoichiometric mixture. The highest hourly consumption is for the SG1 gas (5.79 kg/h); on the contrary, the lowest hourly consumption is for the SG10, with a value of 3.68 kg/h.
The characteristic trend of the dependence of fuel consumption on the mass proportion of fuel in the mixture is linear. It can be concluded that when the mass of the fuel in the stoichiometric mixture increases (Figure 14), its hourly consumption increases as well. Compared to methane CH4 (1.56 kg/h), the synthesis gas consumption is 2.3 (SG10) to 3.6 (SG1) times higher. This is caused by the relatively low quantity of air and the high quantity of SG needed to prepare the stoichiometric mixture (Table 1, A/F ratio).
The measured curves of pressures in the engine cylinder for SGs and methane are shown above in Figure 7 and Figure 8. The curves lead us to the conclusion that the SG5 and SG8 gases (containing 40% and 30% of hydrogen by volume) burn approximately equally fast, but faster than methane, and the fastest of all synthesis gases. Compared to methane, their maximum pressures are slightly closer to the TDC, and after combustion, they reach the maximum pressure only by 0.1 MPa lower than methane. This state also leads to a faster increase in the pressure before TDC, but also to a greater expenditure of compression work. On the other hand, during the expansion stroke, the pressure drop is faster compared to methane, the expansion work is lower, which then leads to the measured torque values shown in Figure 3 and Figure 4. The differences in the composition of the individual gases also affect the pressure curves in the engine cylinder. These differences are described in more detail in Section 3.2. The authors of the article have published on the effect of the individual synthesis gas components on combustion in an internal combustion engine in their publications [49,50]. The combustion process during the compression stroke (thus, the compression work expended) for all SGs differs; however, small differences arise during the expansion stroke in favour of the SG4 and the SG7 gases, which is manifested in the highest Mt values (Figure 4).
These briefly summarized results achieved from high-energy synthesis gases from waste plastics point to their possible effective use in cogeneration units. Therefore, we would gladly repeat that SGs help solve the problem of waste in the environment, both by reducing the amount of landfilled waste and by obtaining clean electrical and thermal energy in the cogeneration process. The presented combustion analysis serves to better understand the obtained results. The presented graphs provide an idea of the general behaviour of SGs during their combustion in the internal combustion engine. In this paper, we have measured, in total, 10 high-energy SGs, and the results point to the tendency in performance achievements and economic parameters of the engine. From their analysis, the authors came at the overall results and recommendations, which are presented in the conclusions.

5. Conclusions

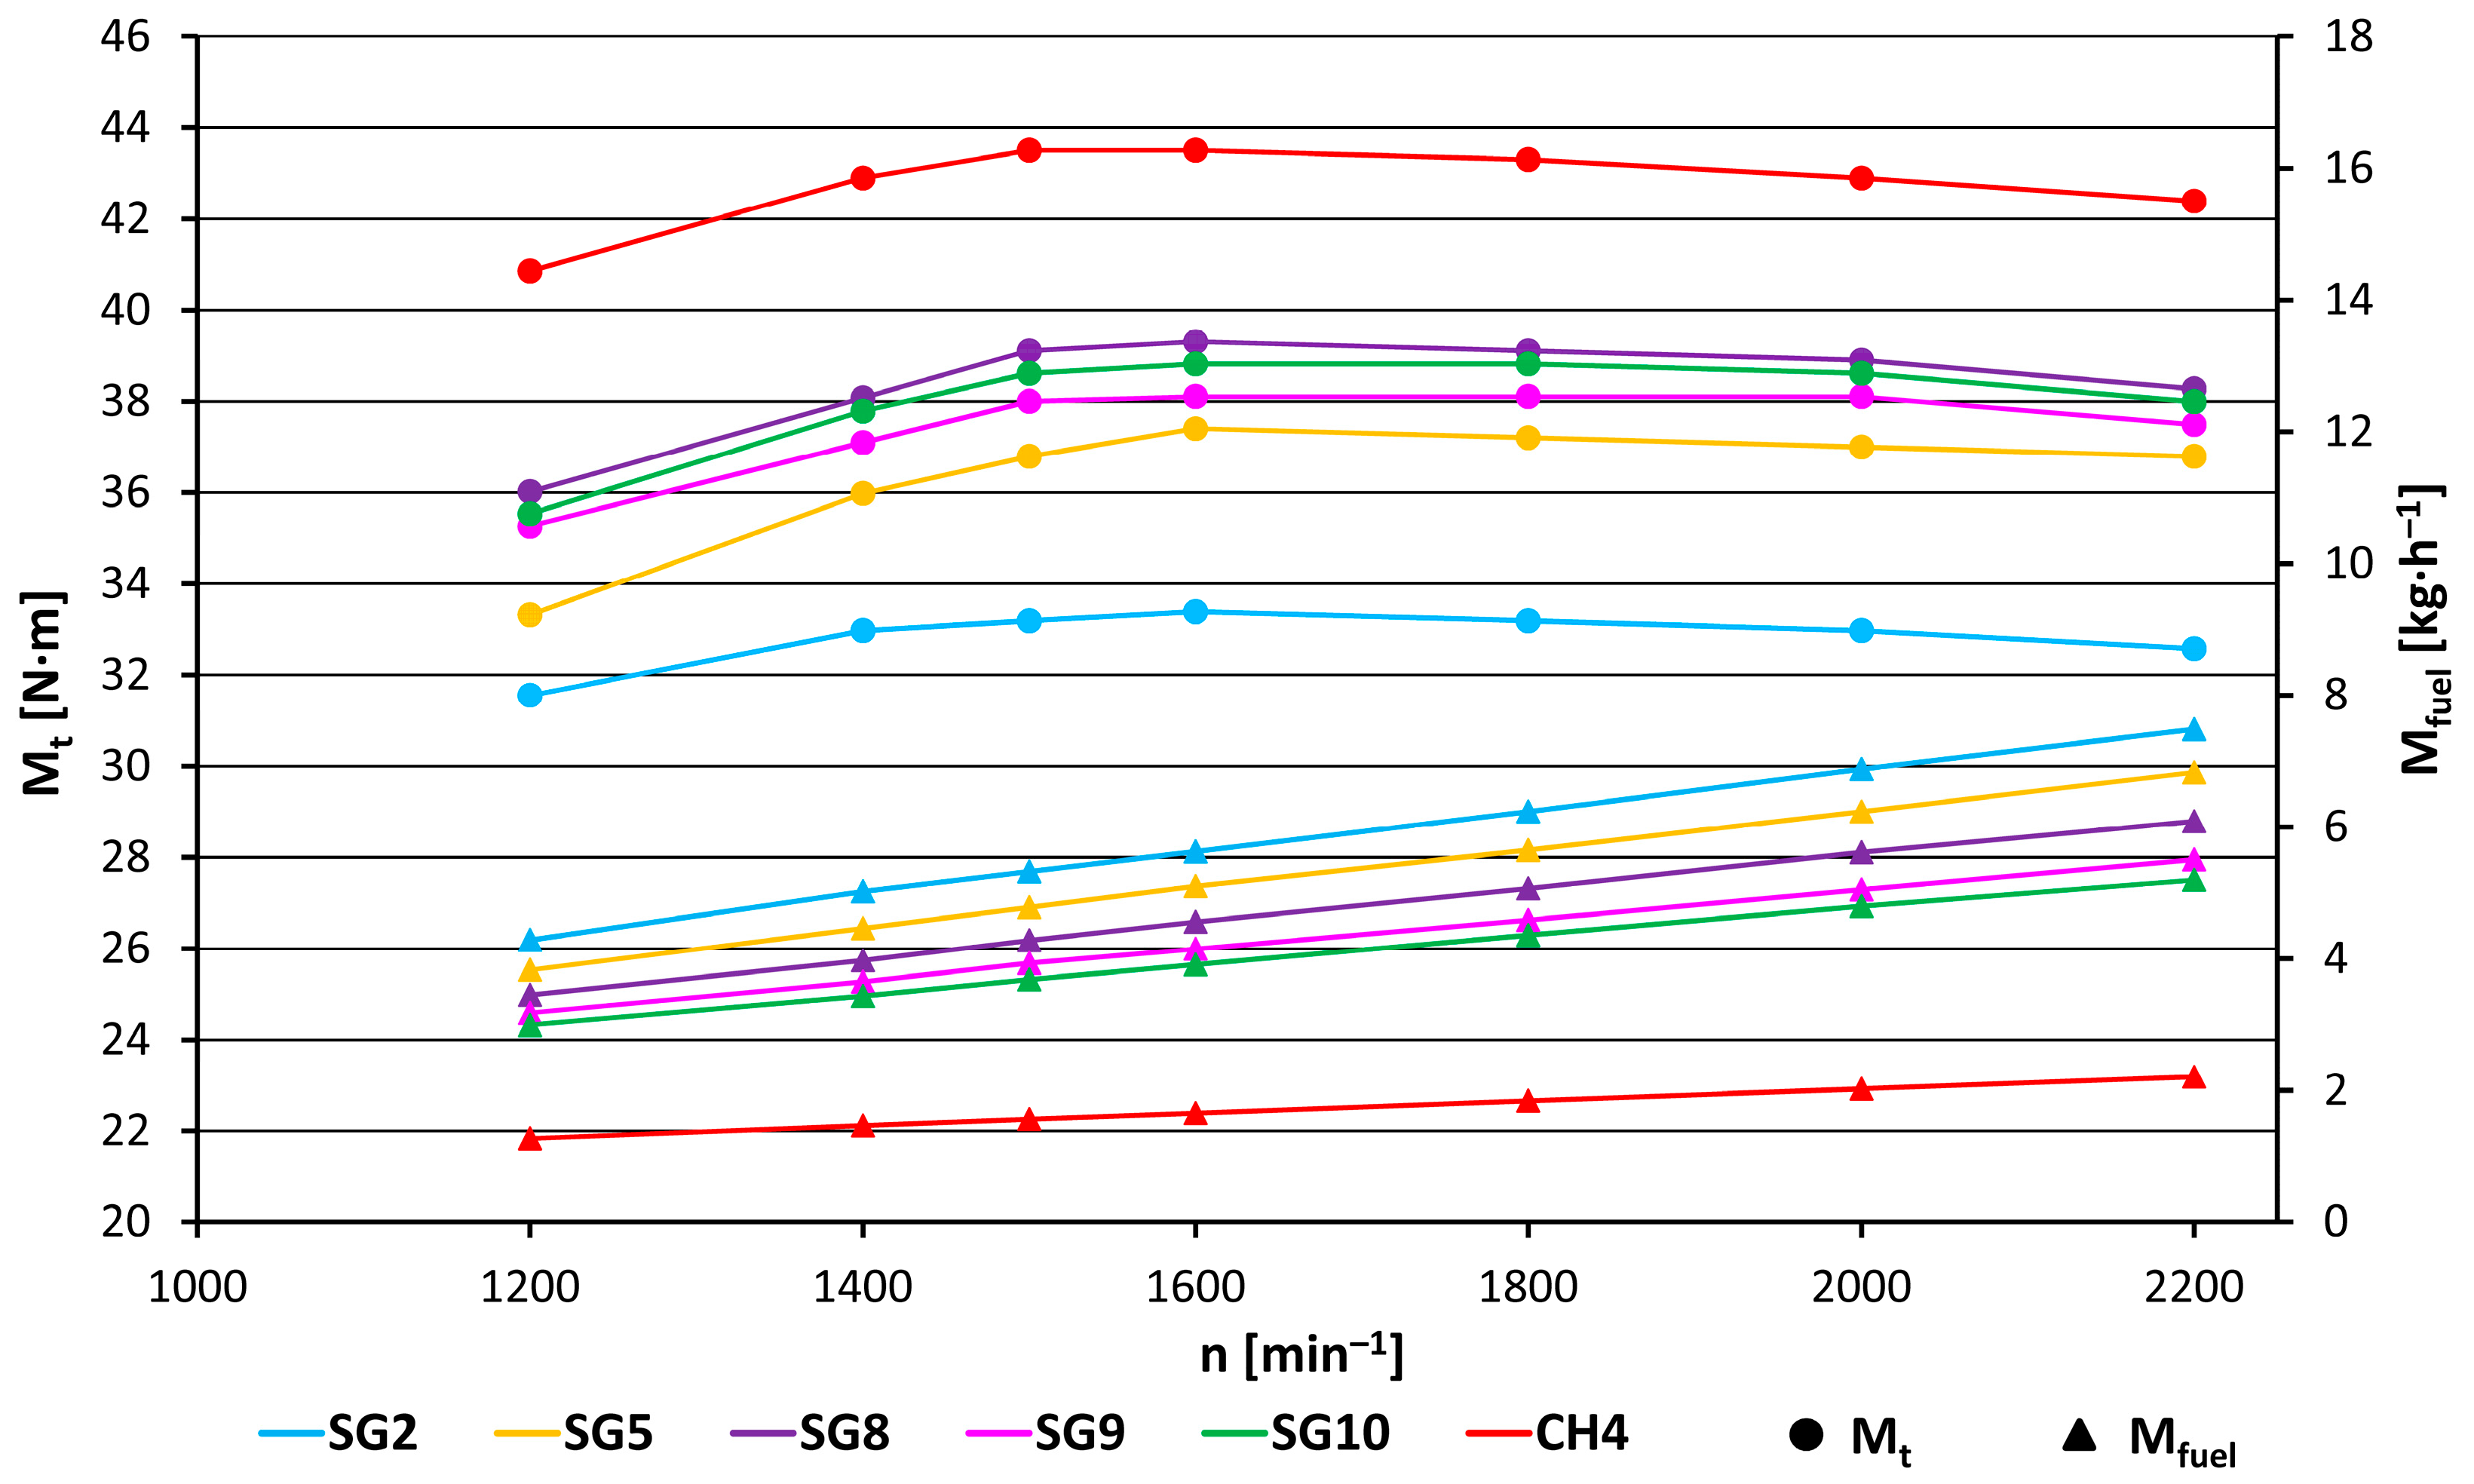
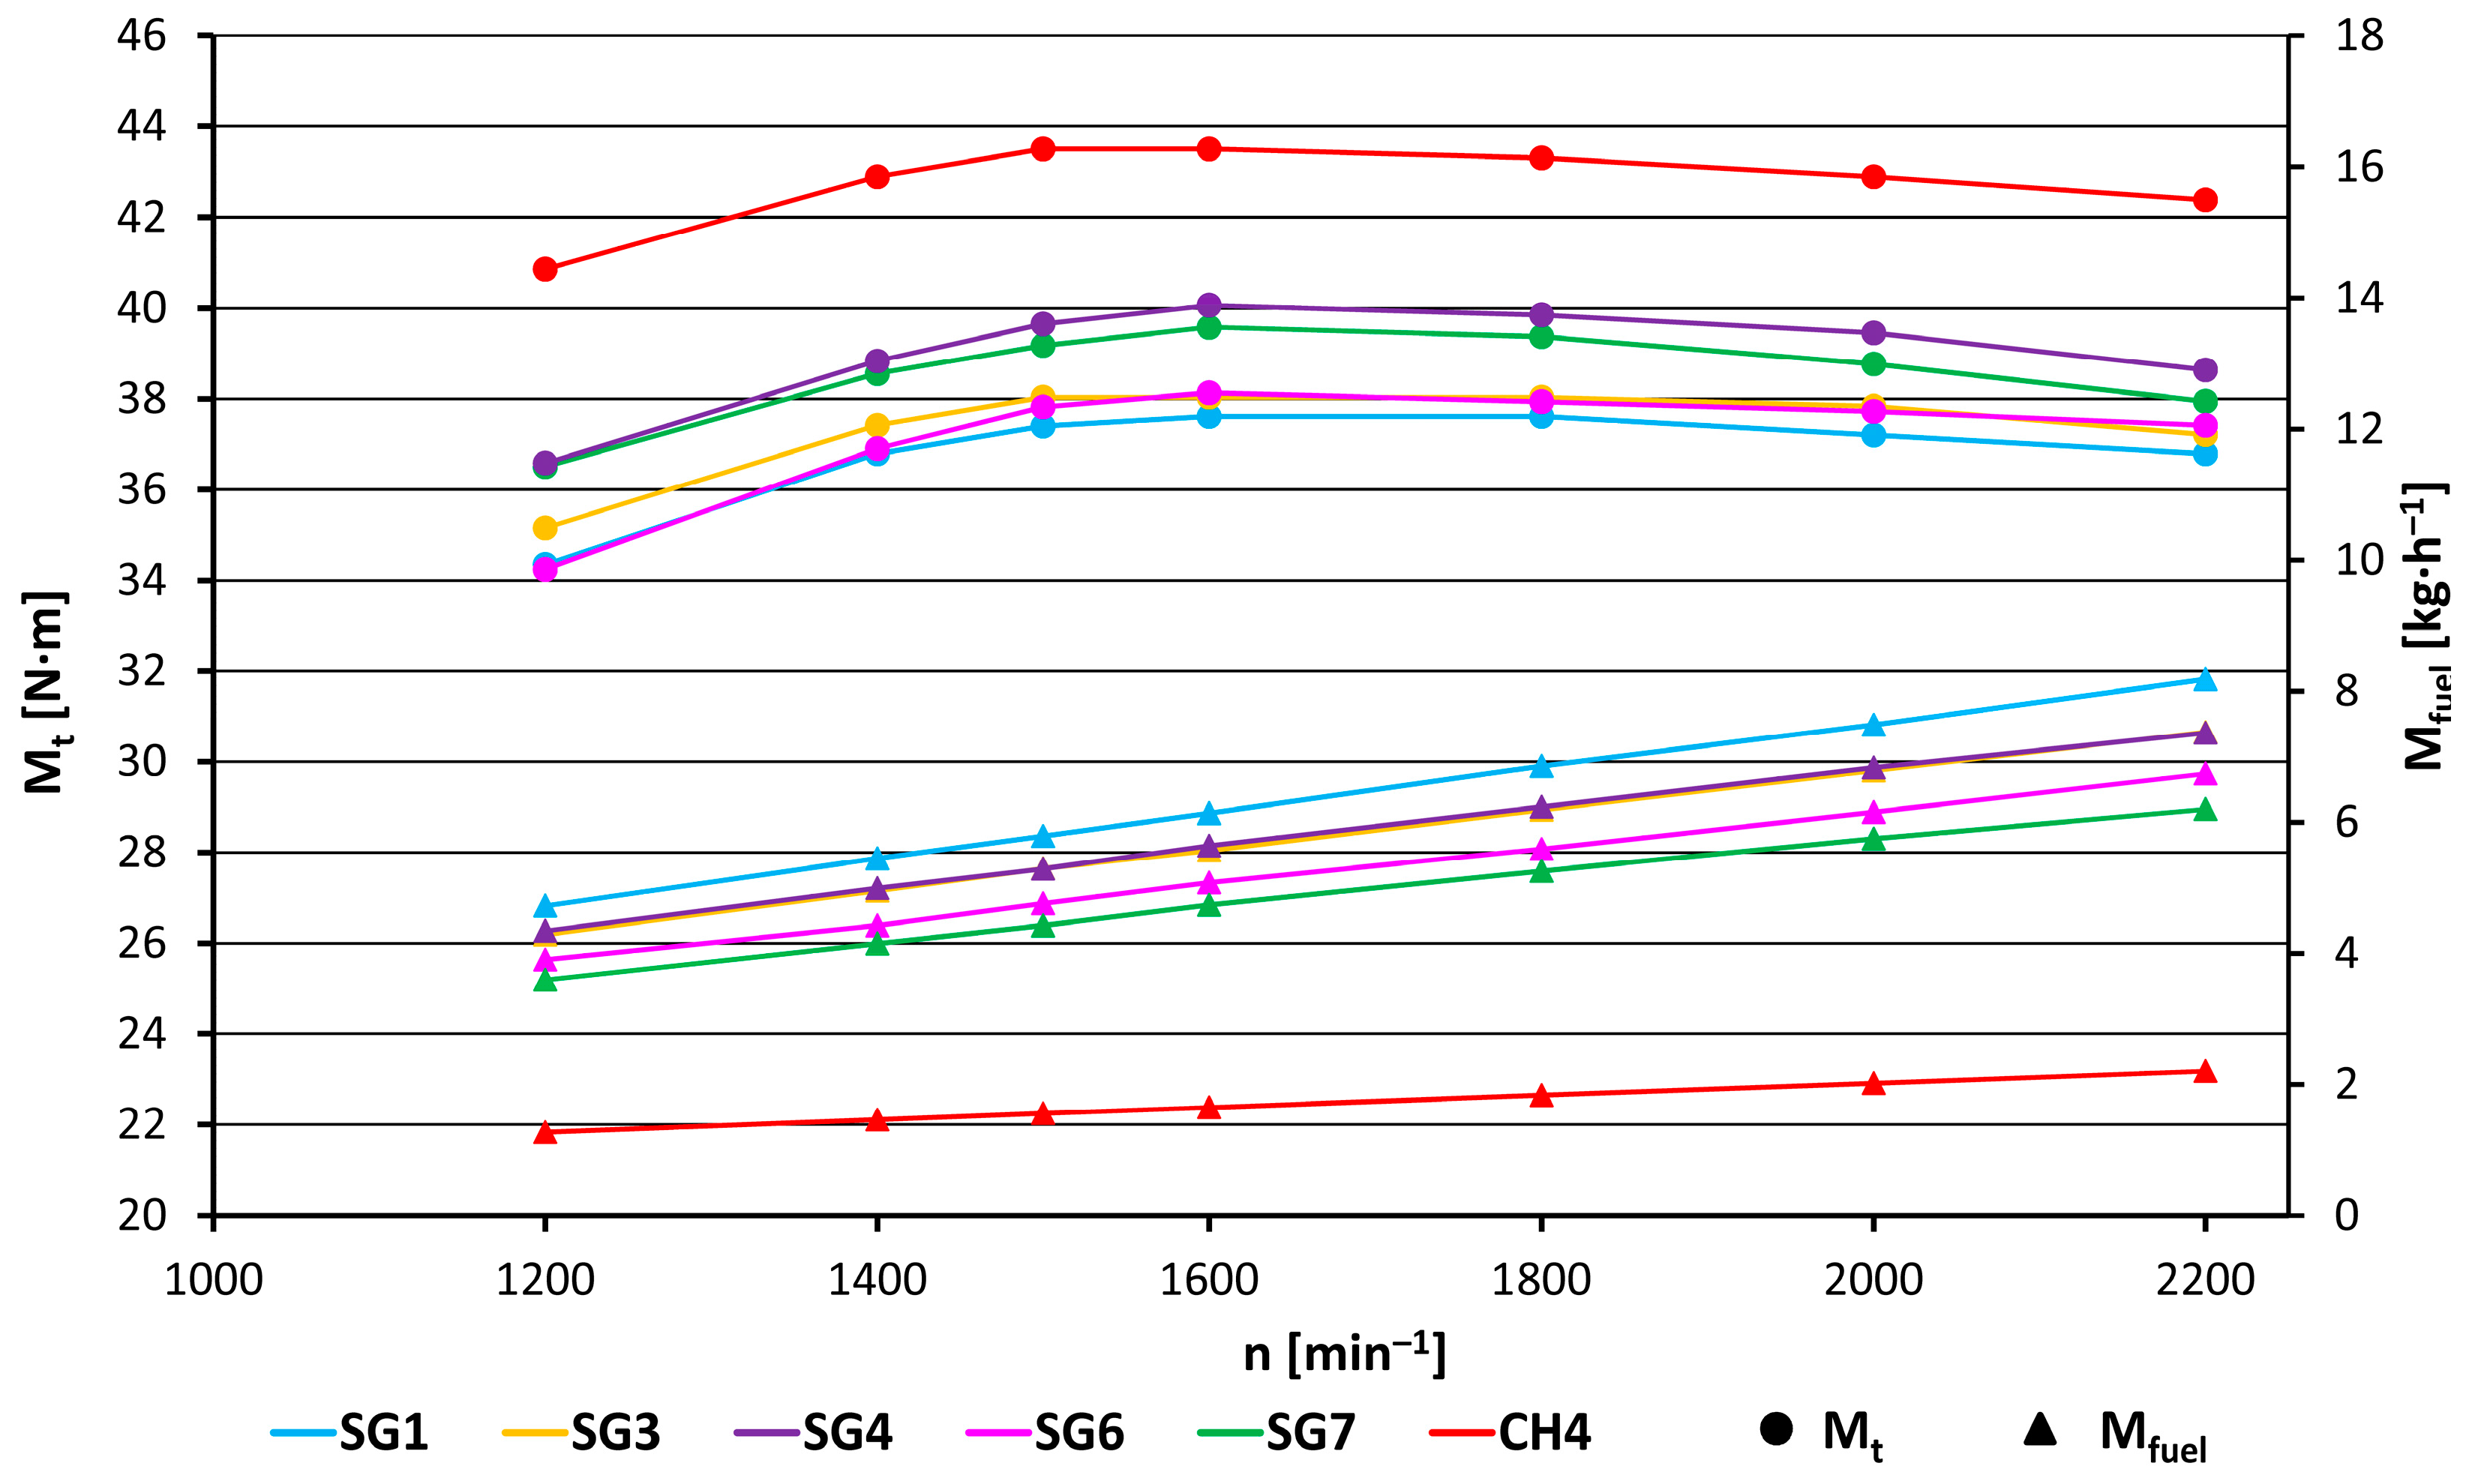
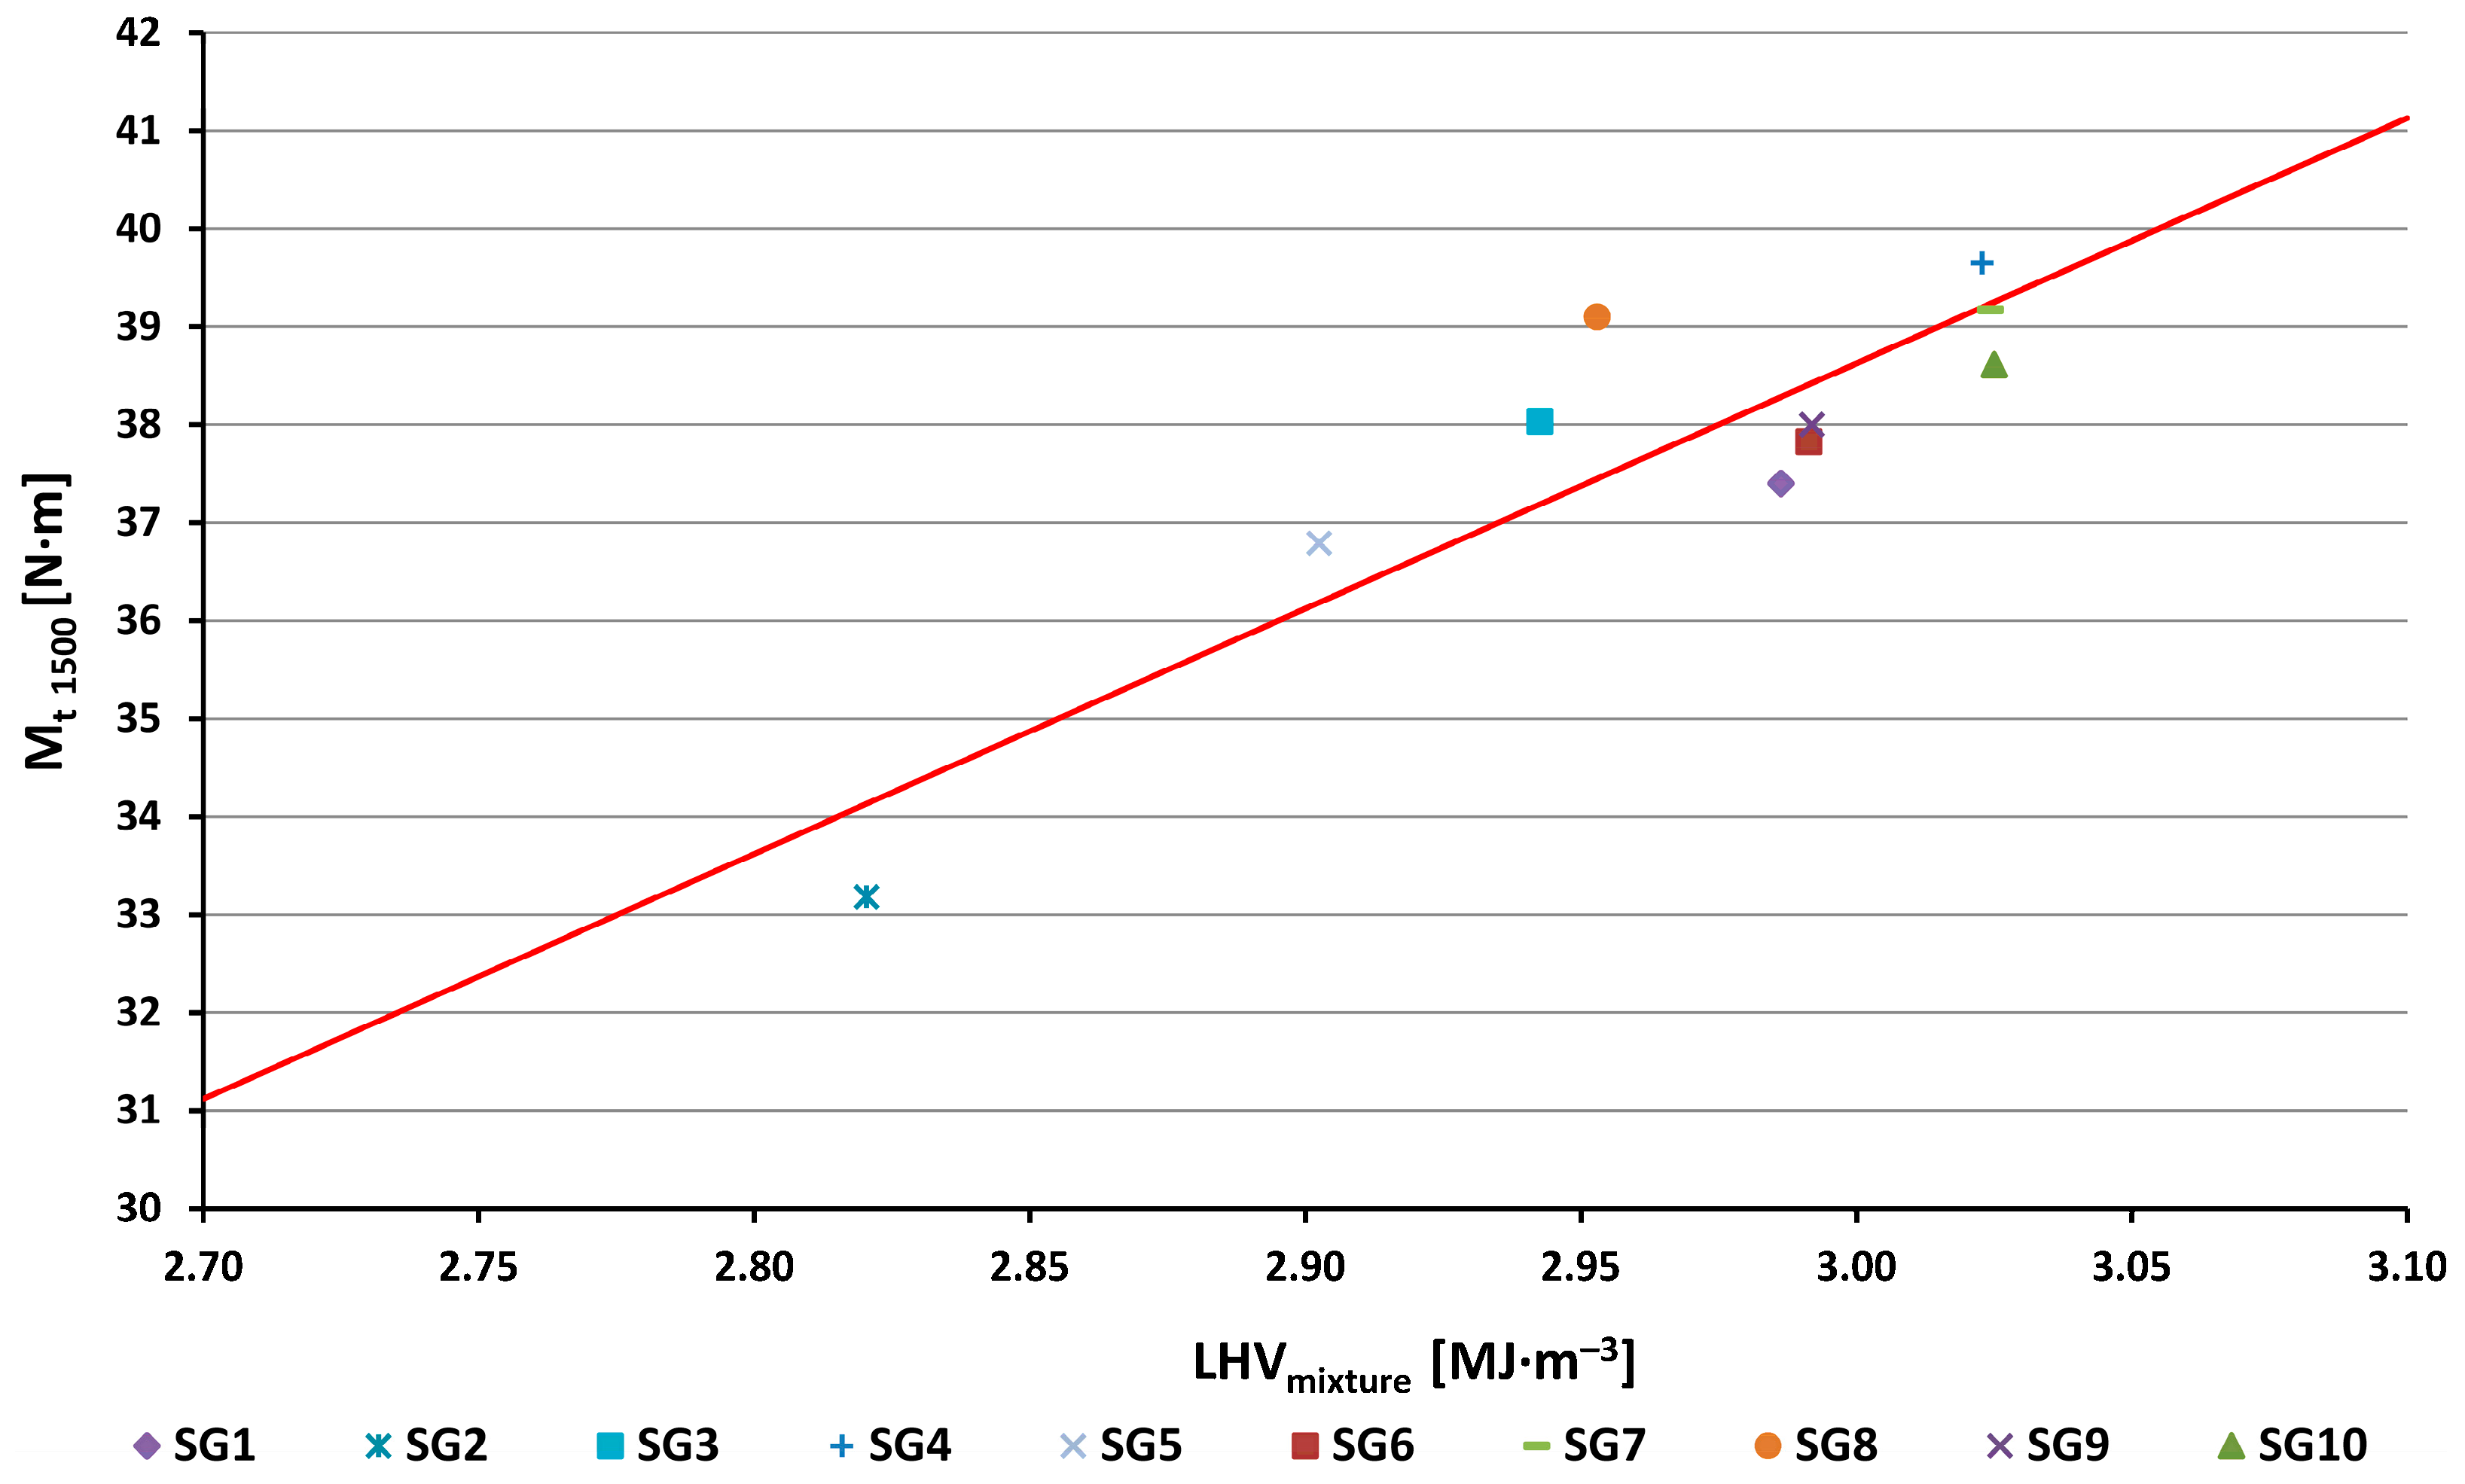
  • At the speed of 1500 rpm the torque value achieved for methane was 43.2 N·m. For the investigated synthesis gases (Figure 3, Figure 4 and Figure 13), this value was lower (from 33.2 N·m for the SG2 to 39.7 N·m for the SG4) due to lower achieved values of the volumetric LHV of the stoichiometric mixture as compared to methane. The linear trend line (red line in Figure 13) drawn through the measured moment values shows that the deviations of the measured data from the trend line in the graph are within ±5%.
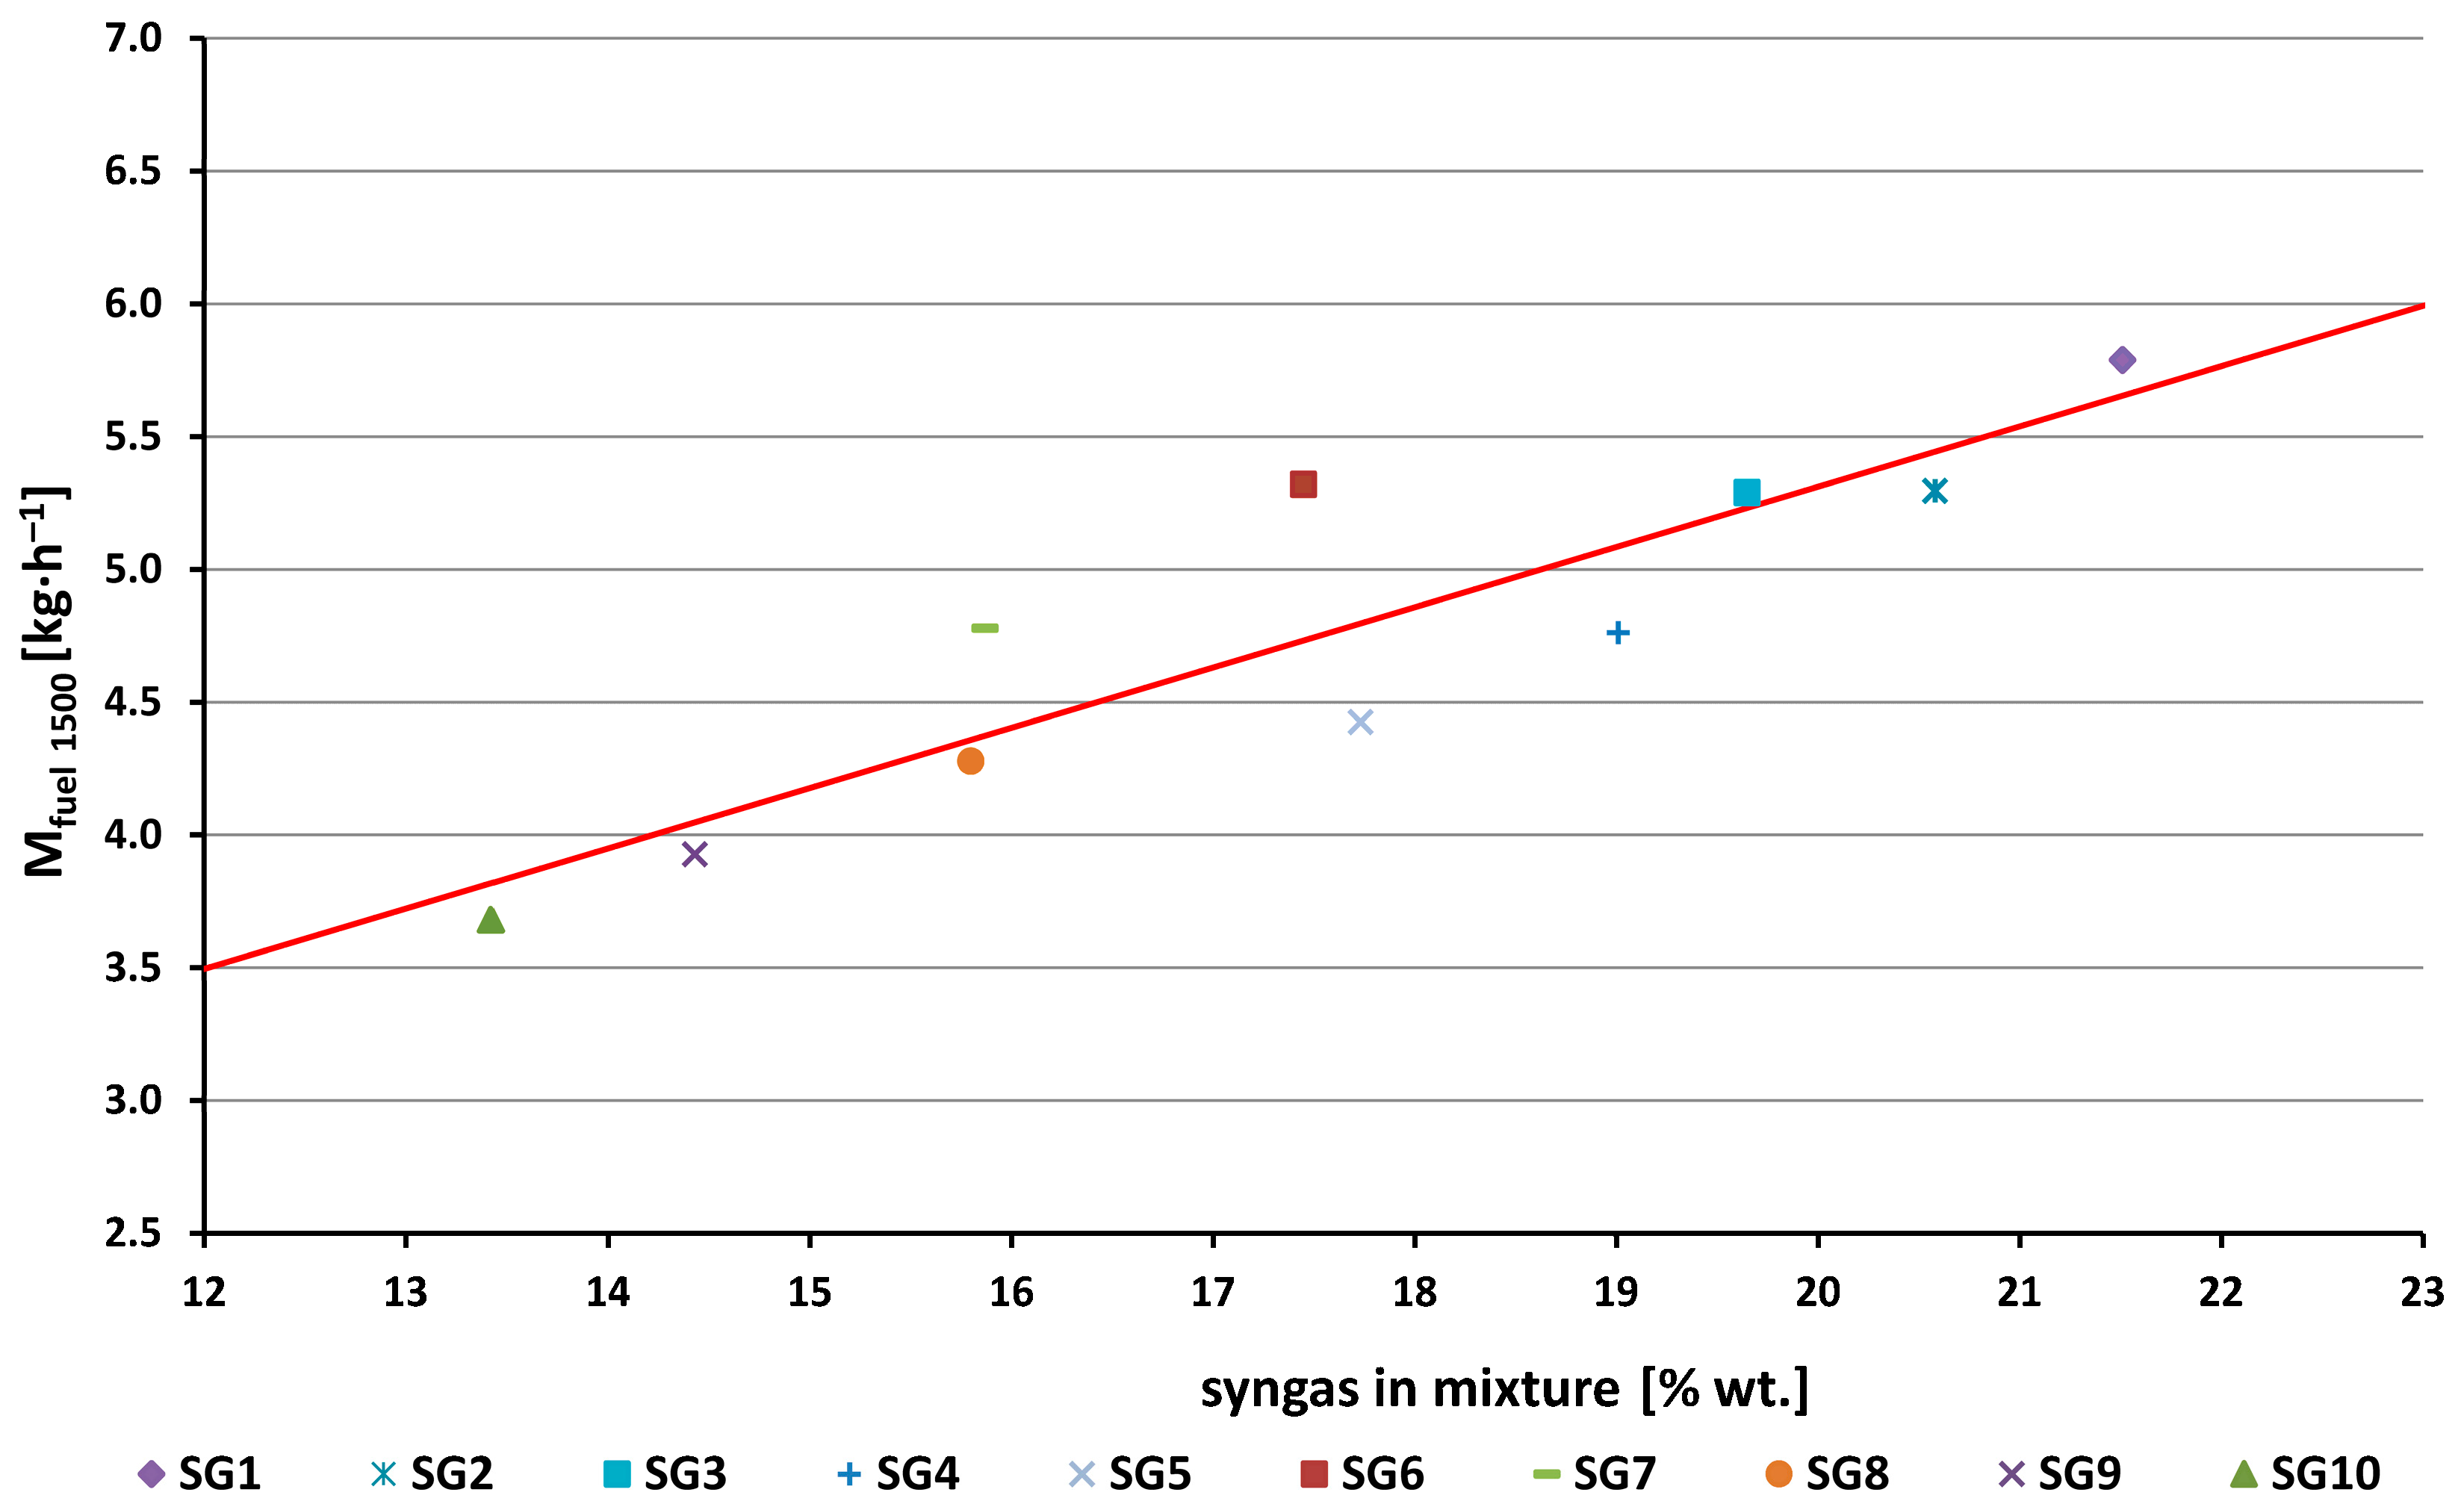
  • The synthesis gas consumption (Figure 3, Figure 4 and Figure 14) was 2.4 to 3.7 times higher than the methane consumption (1.56 kg/h). This is due to the fact that when operating on syngas, a smaller amount of air is consumed to create a stoichiometric mixture (from 3.65 kg/kg for the SG1 to 6.45 kg/kg for the SG10, see the A/F ratio in Table 1) compared to methane (17.12 kg/kg). The hourly fuel consumption increases linearly with the increasing mass representation of a synthesis gas in the stoichiometric mixture (Figure 14).
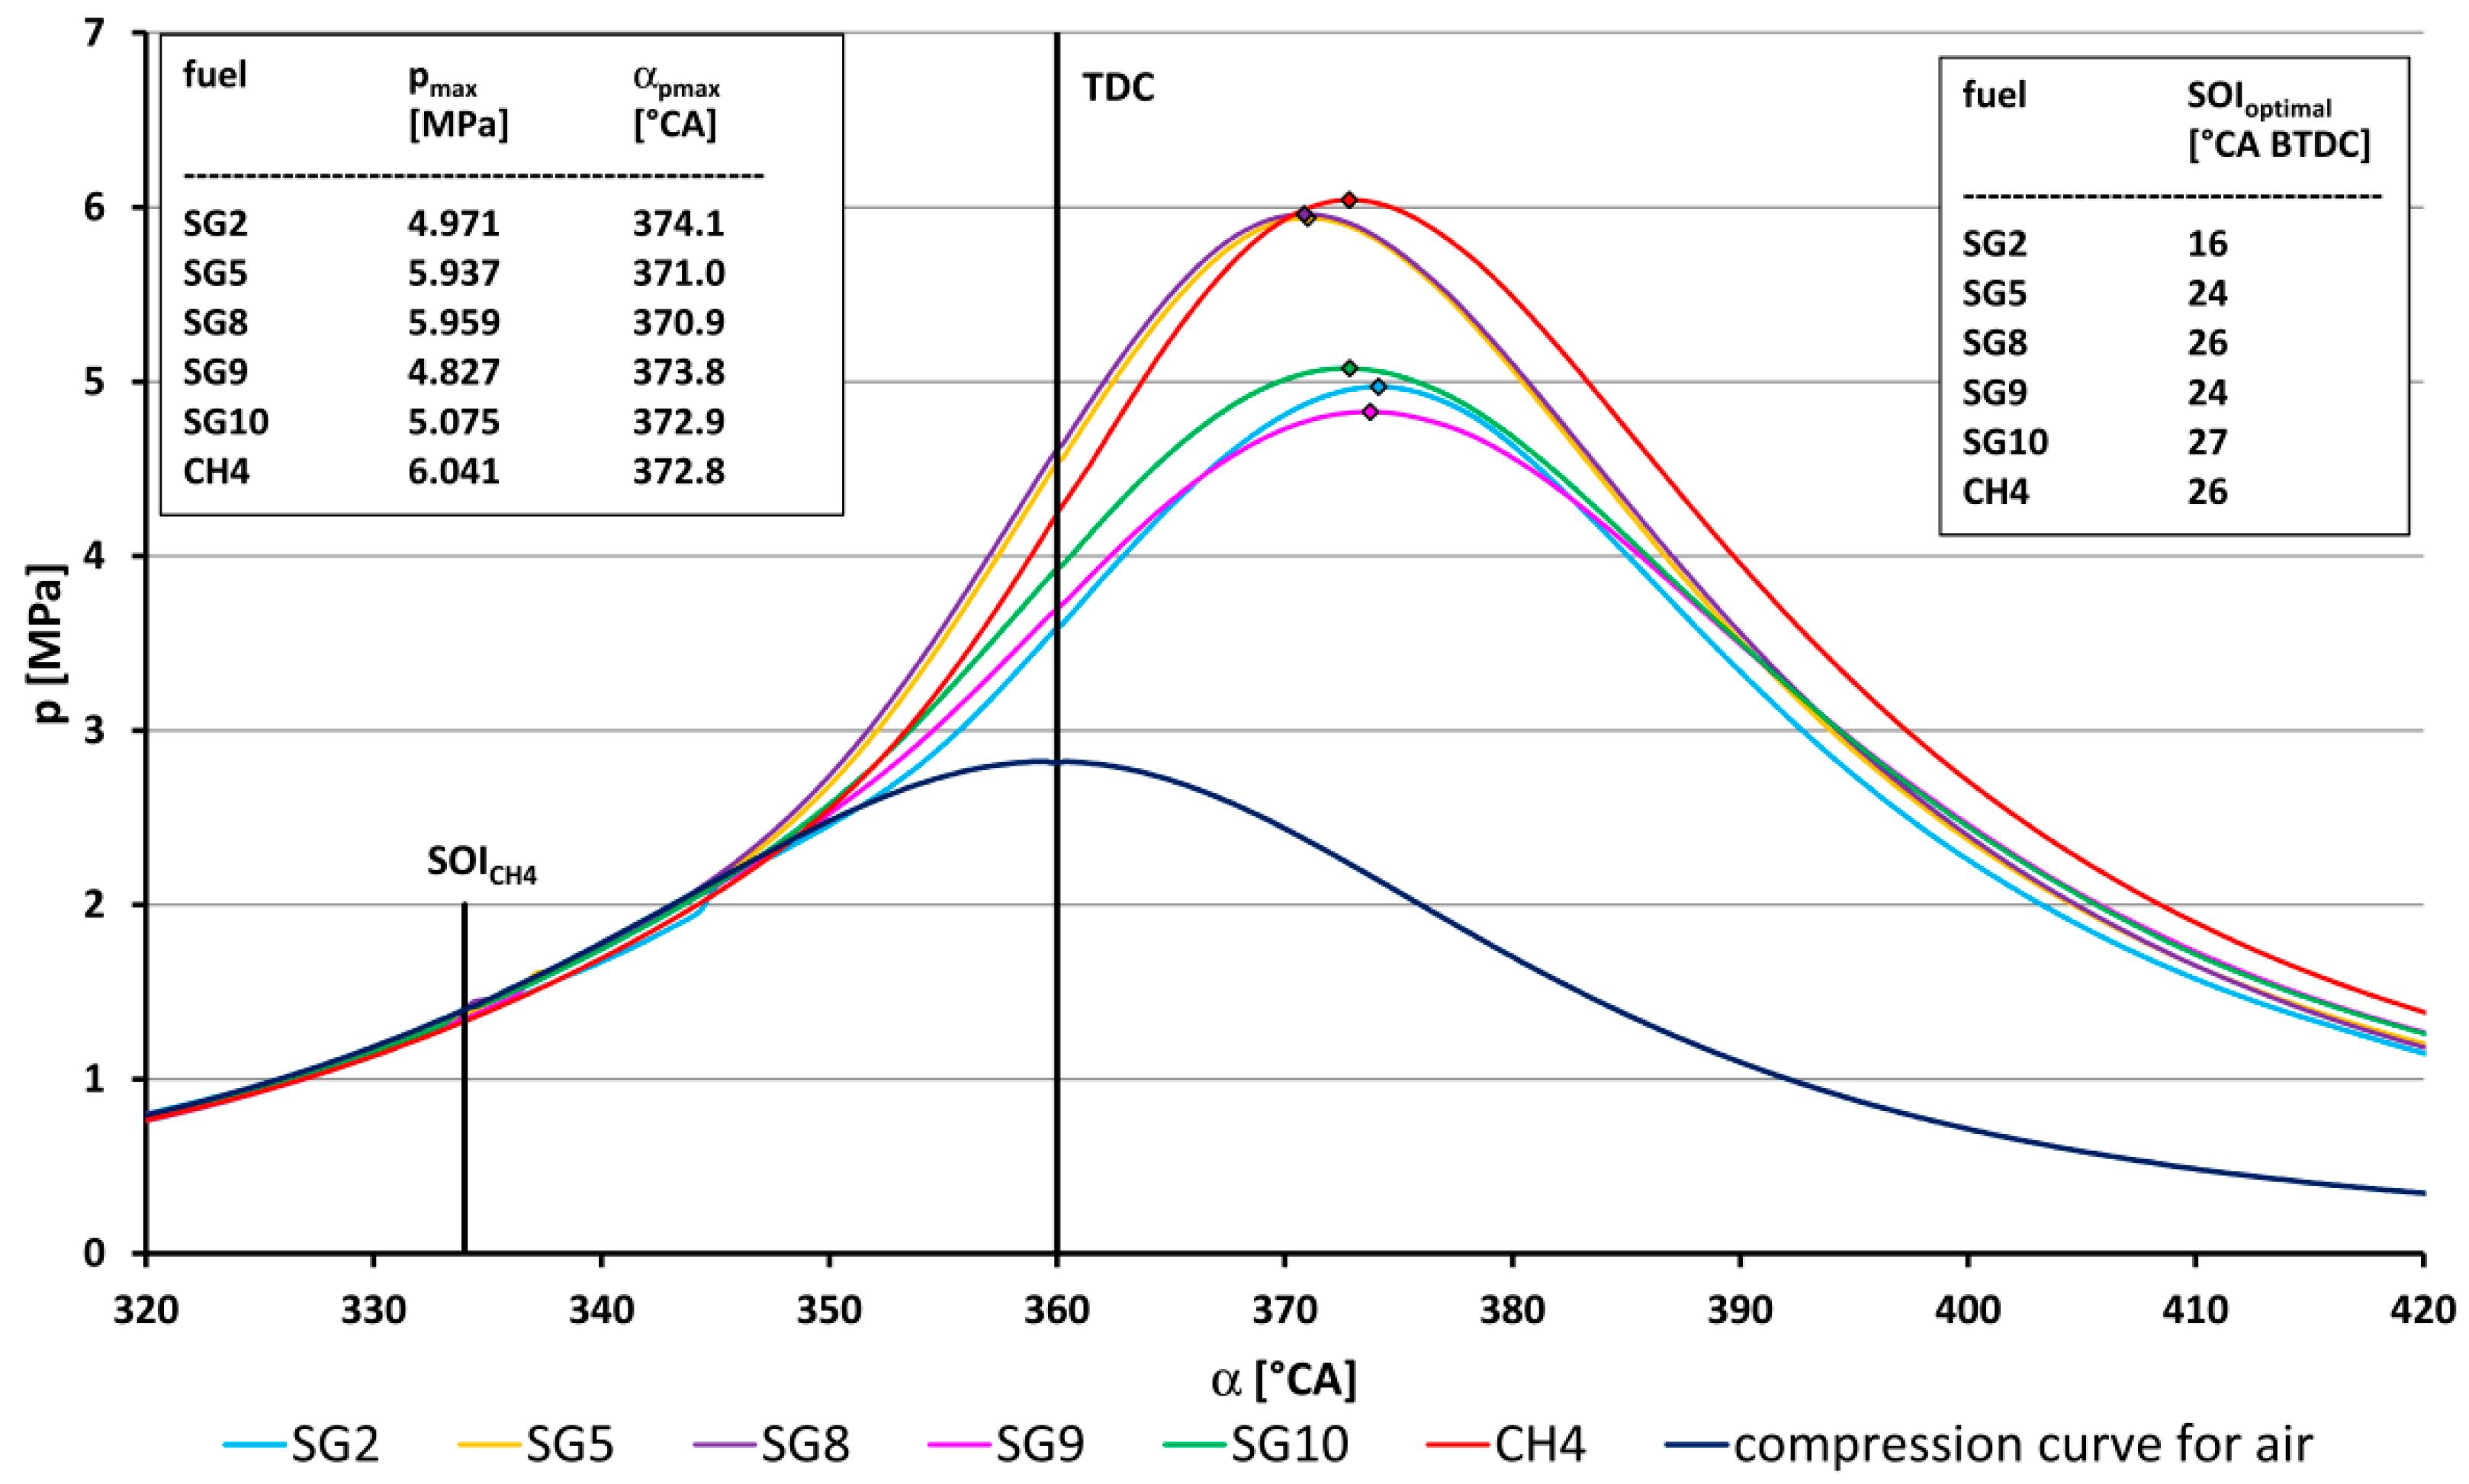
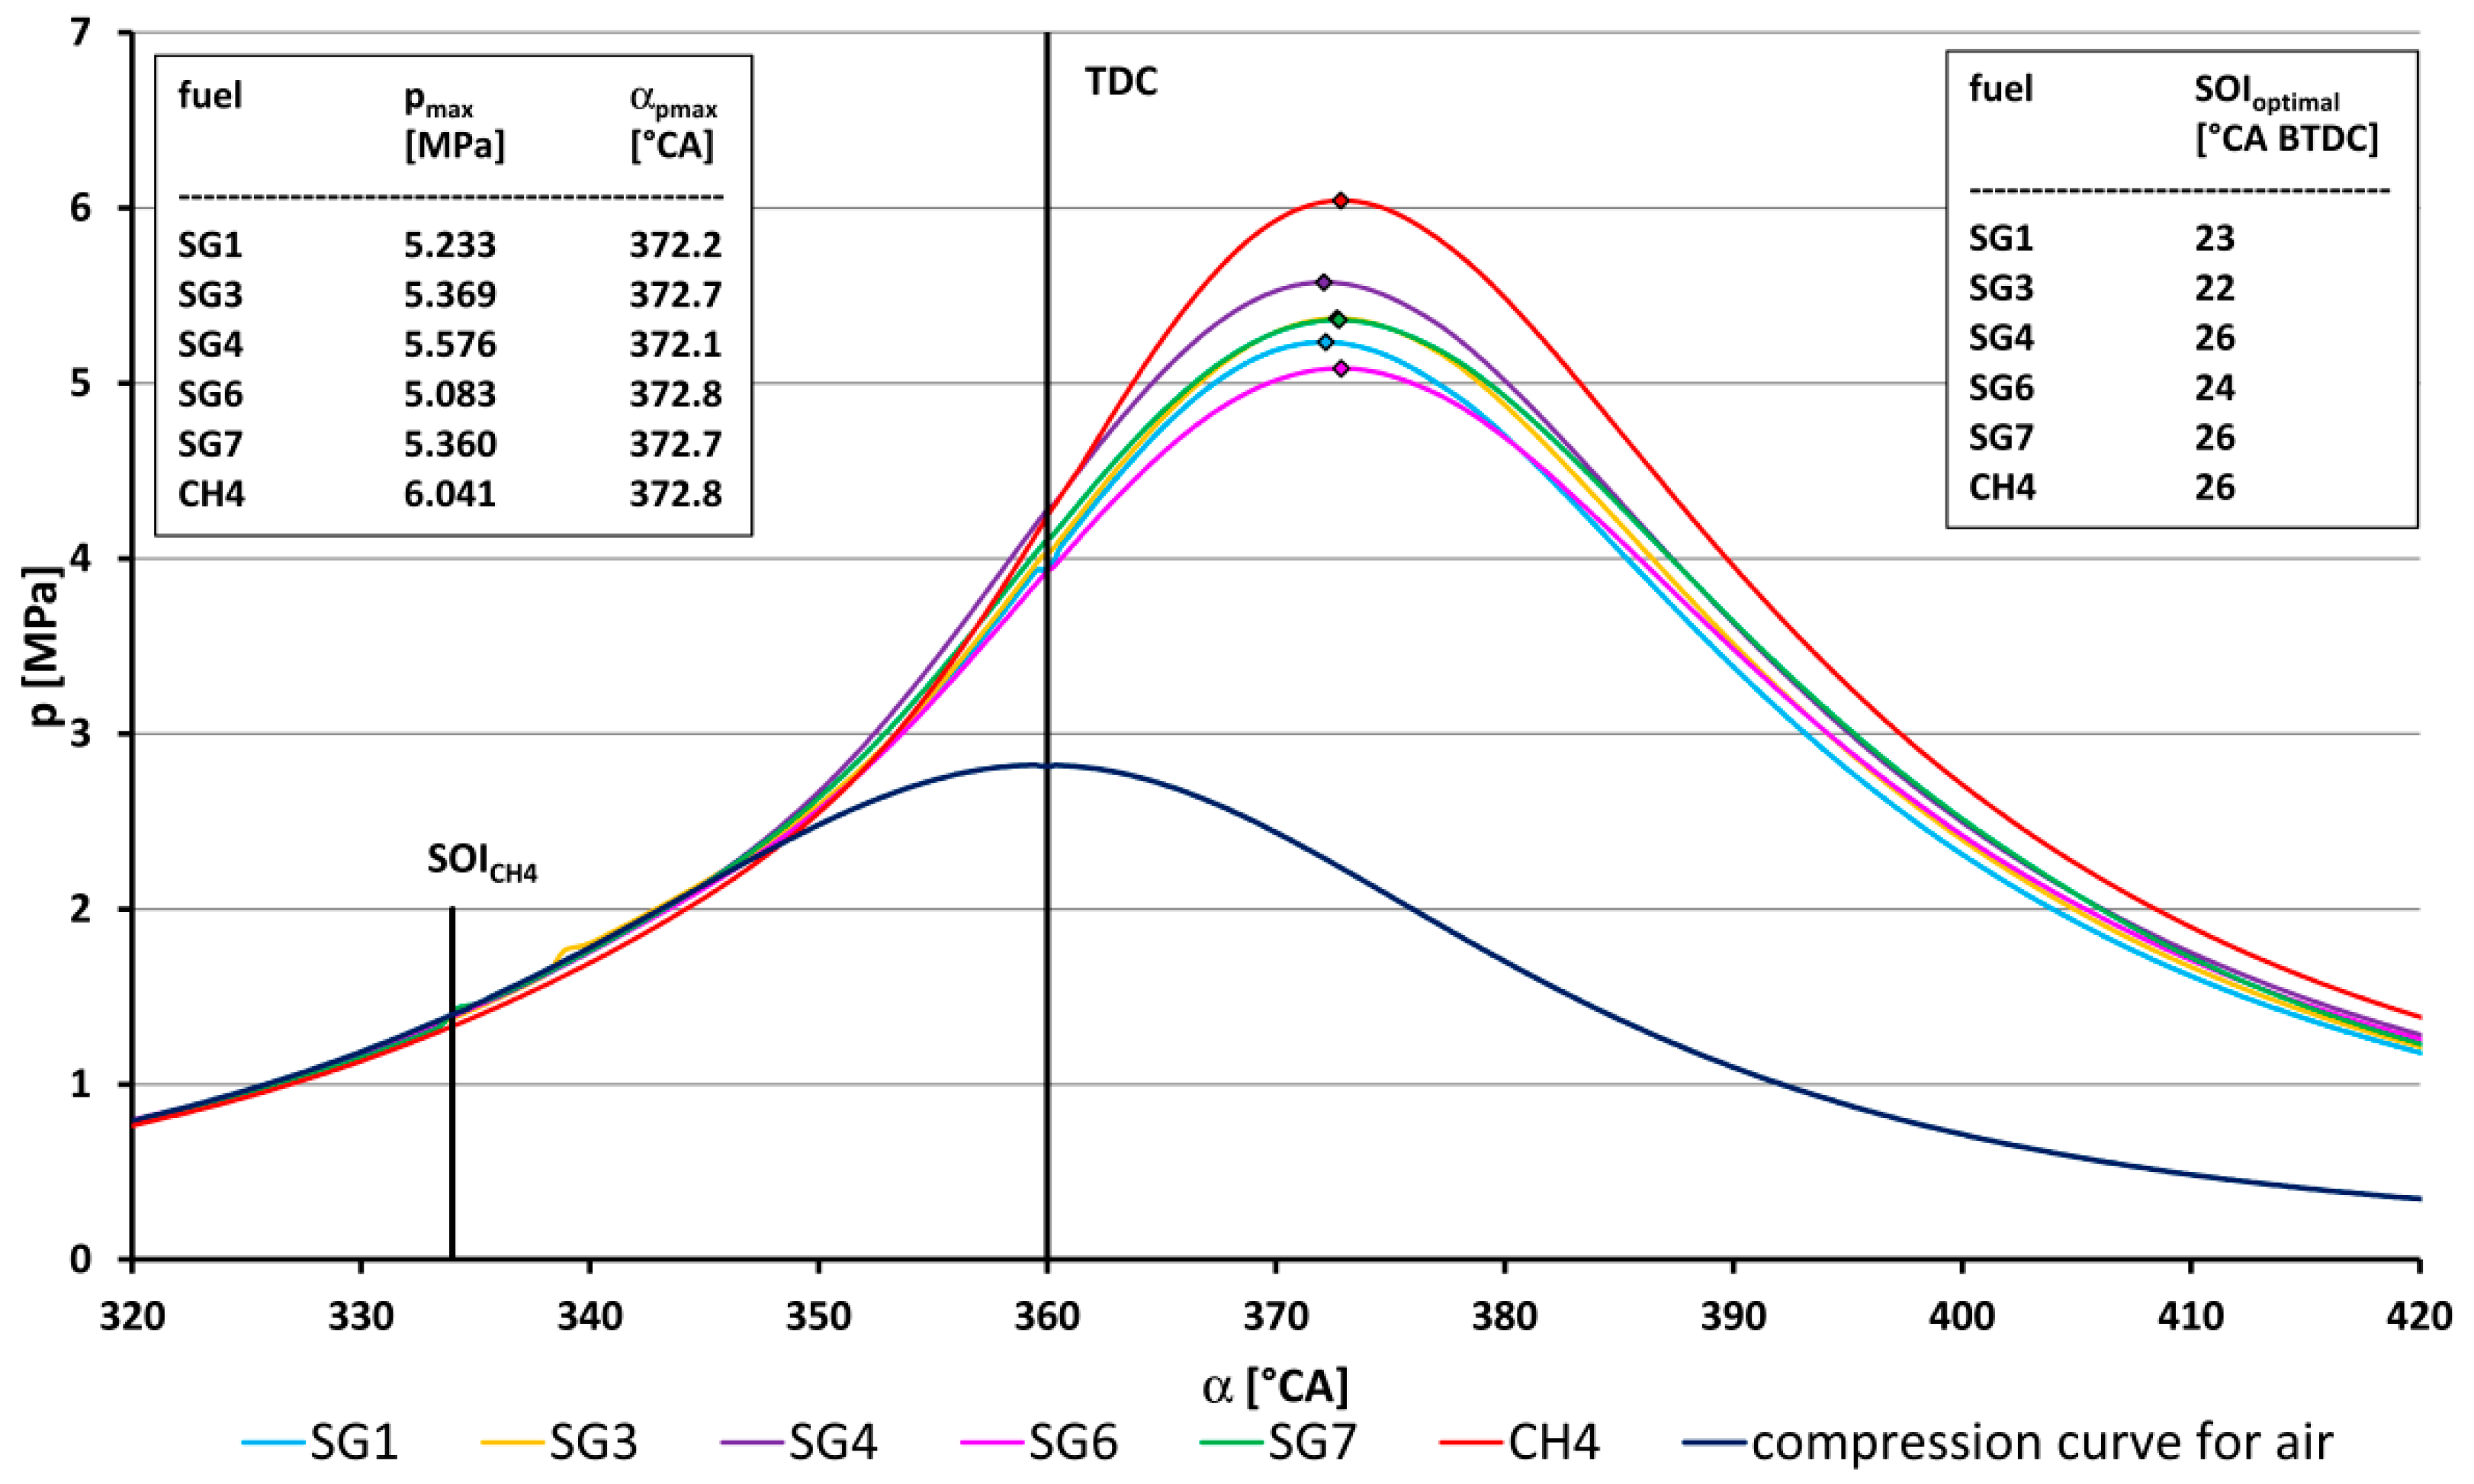
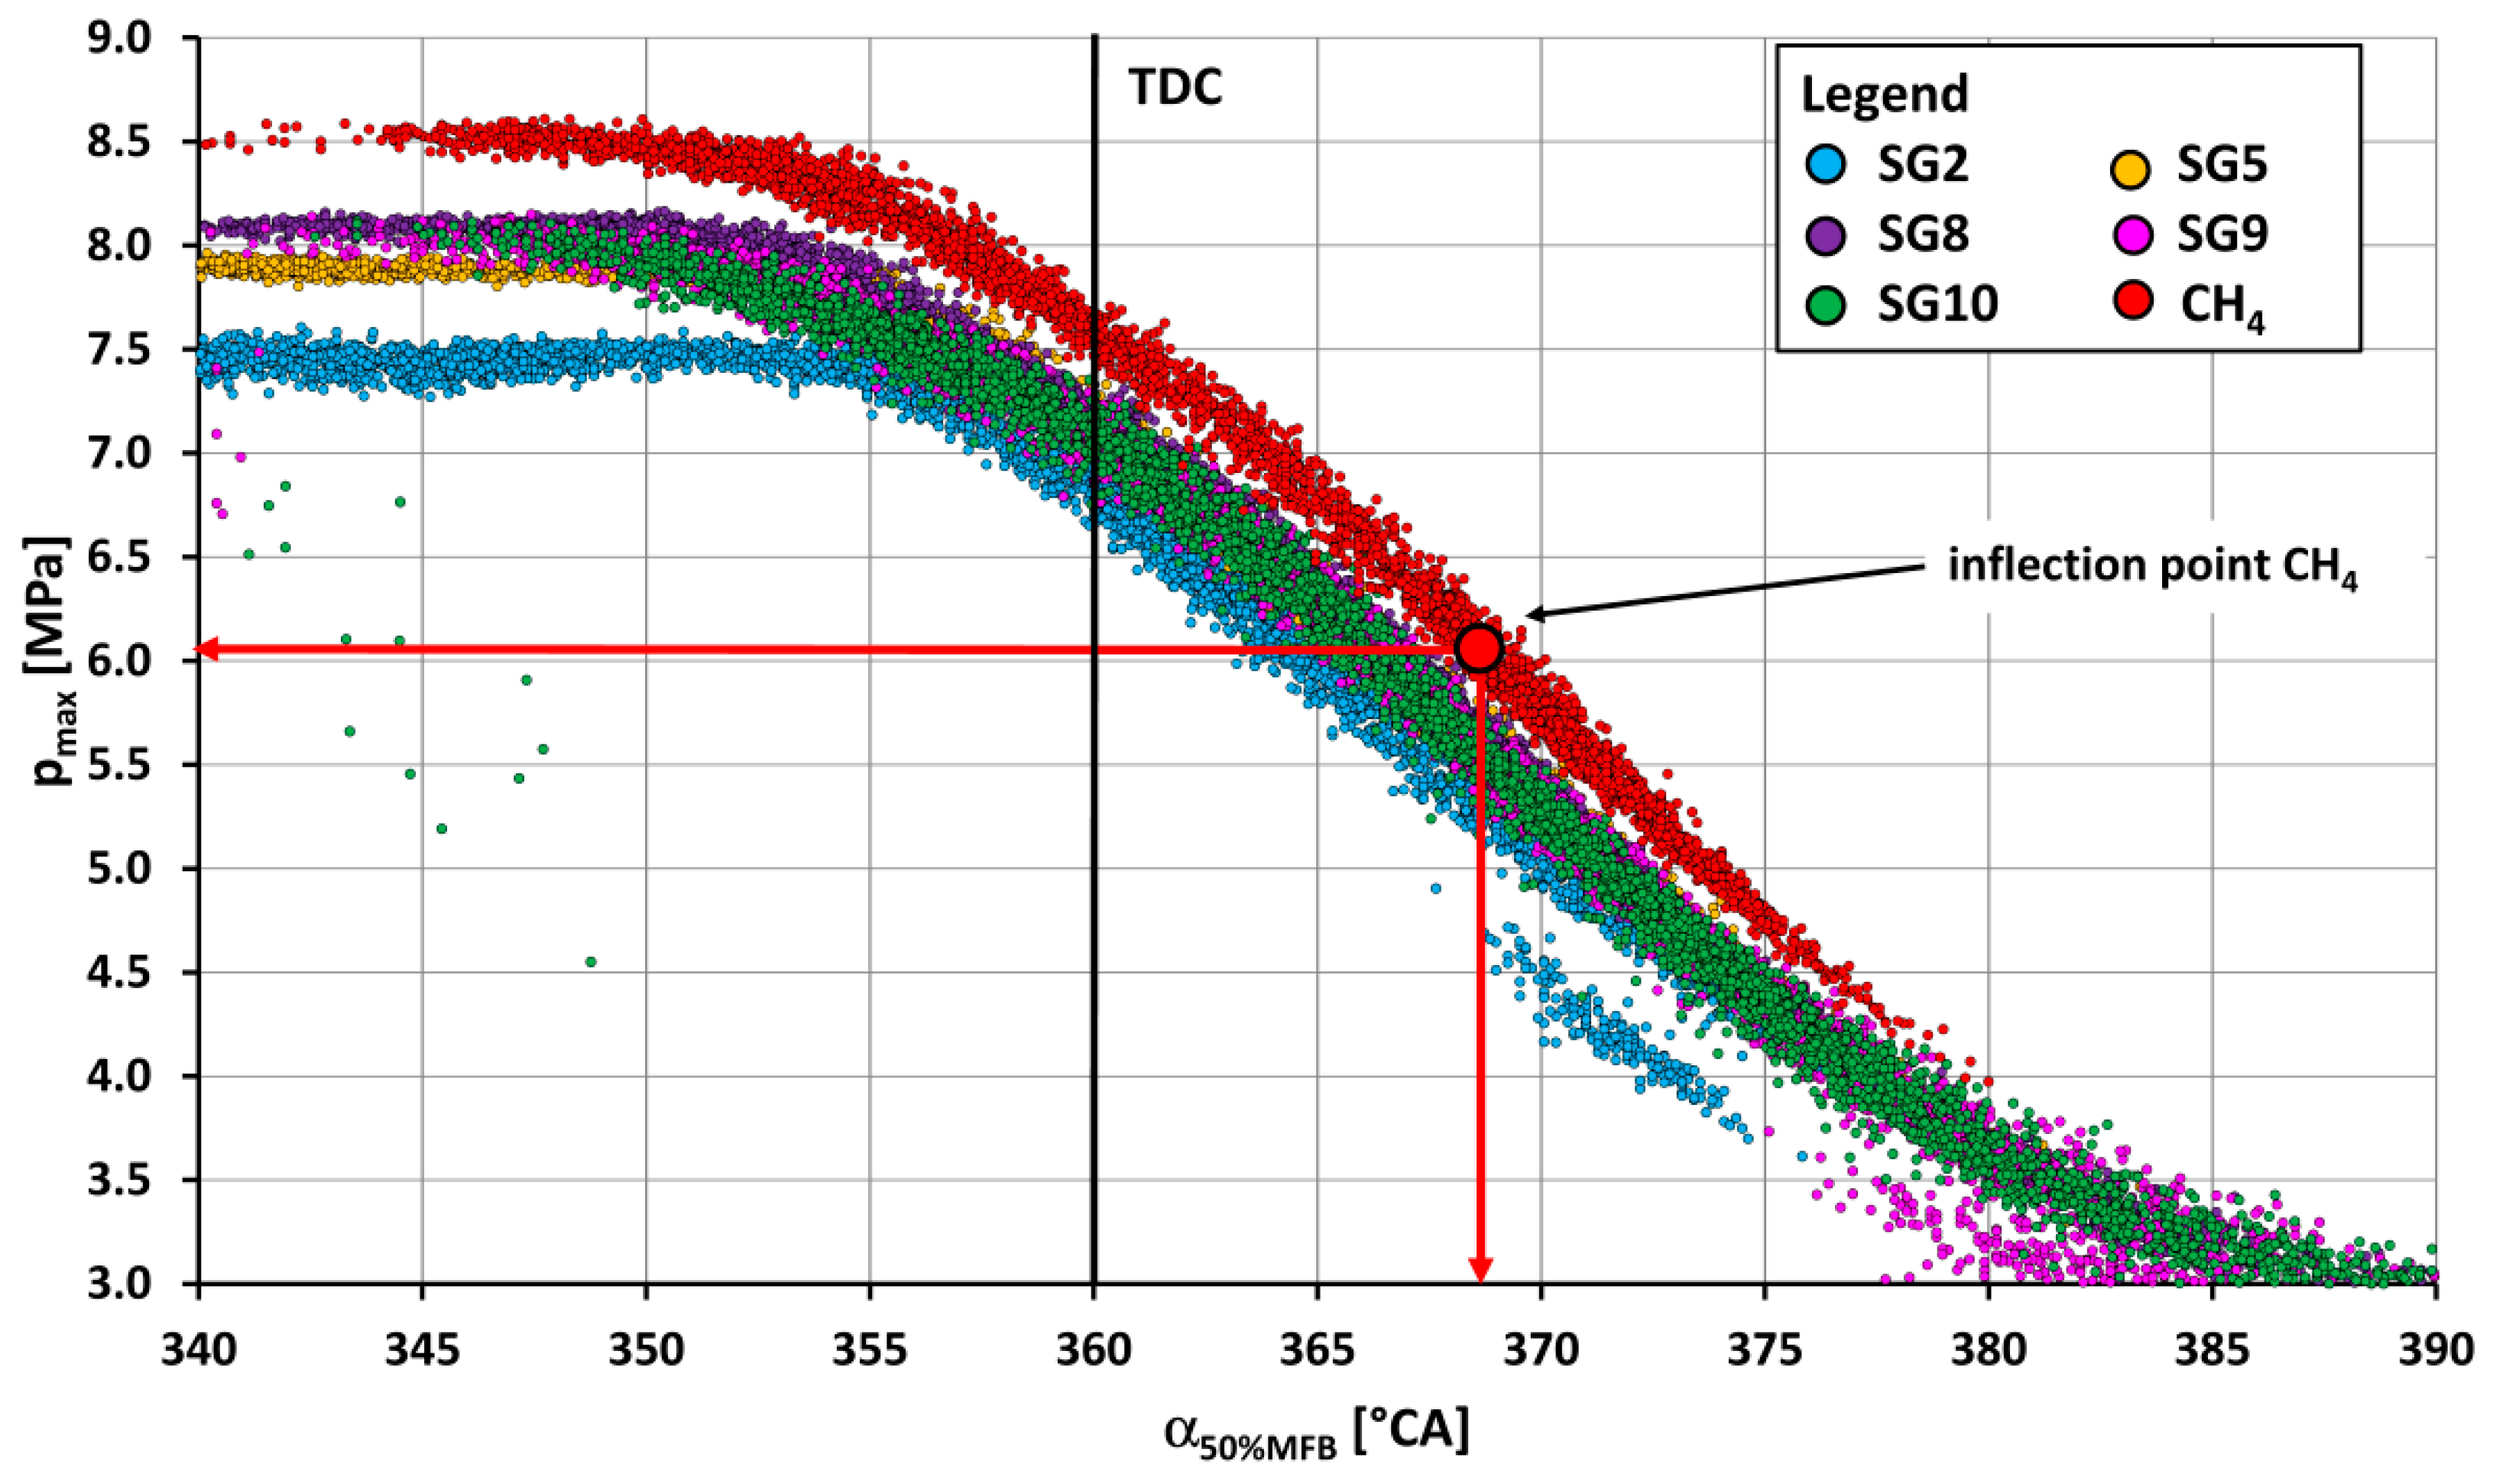
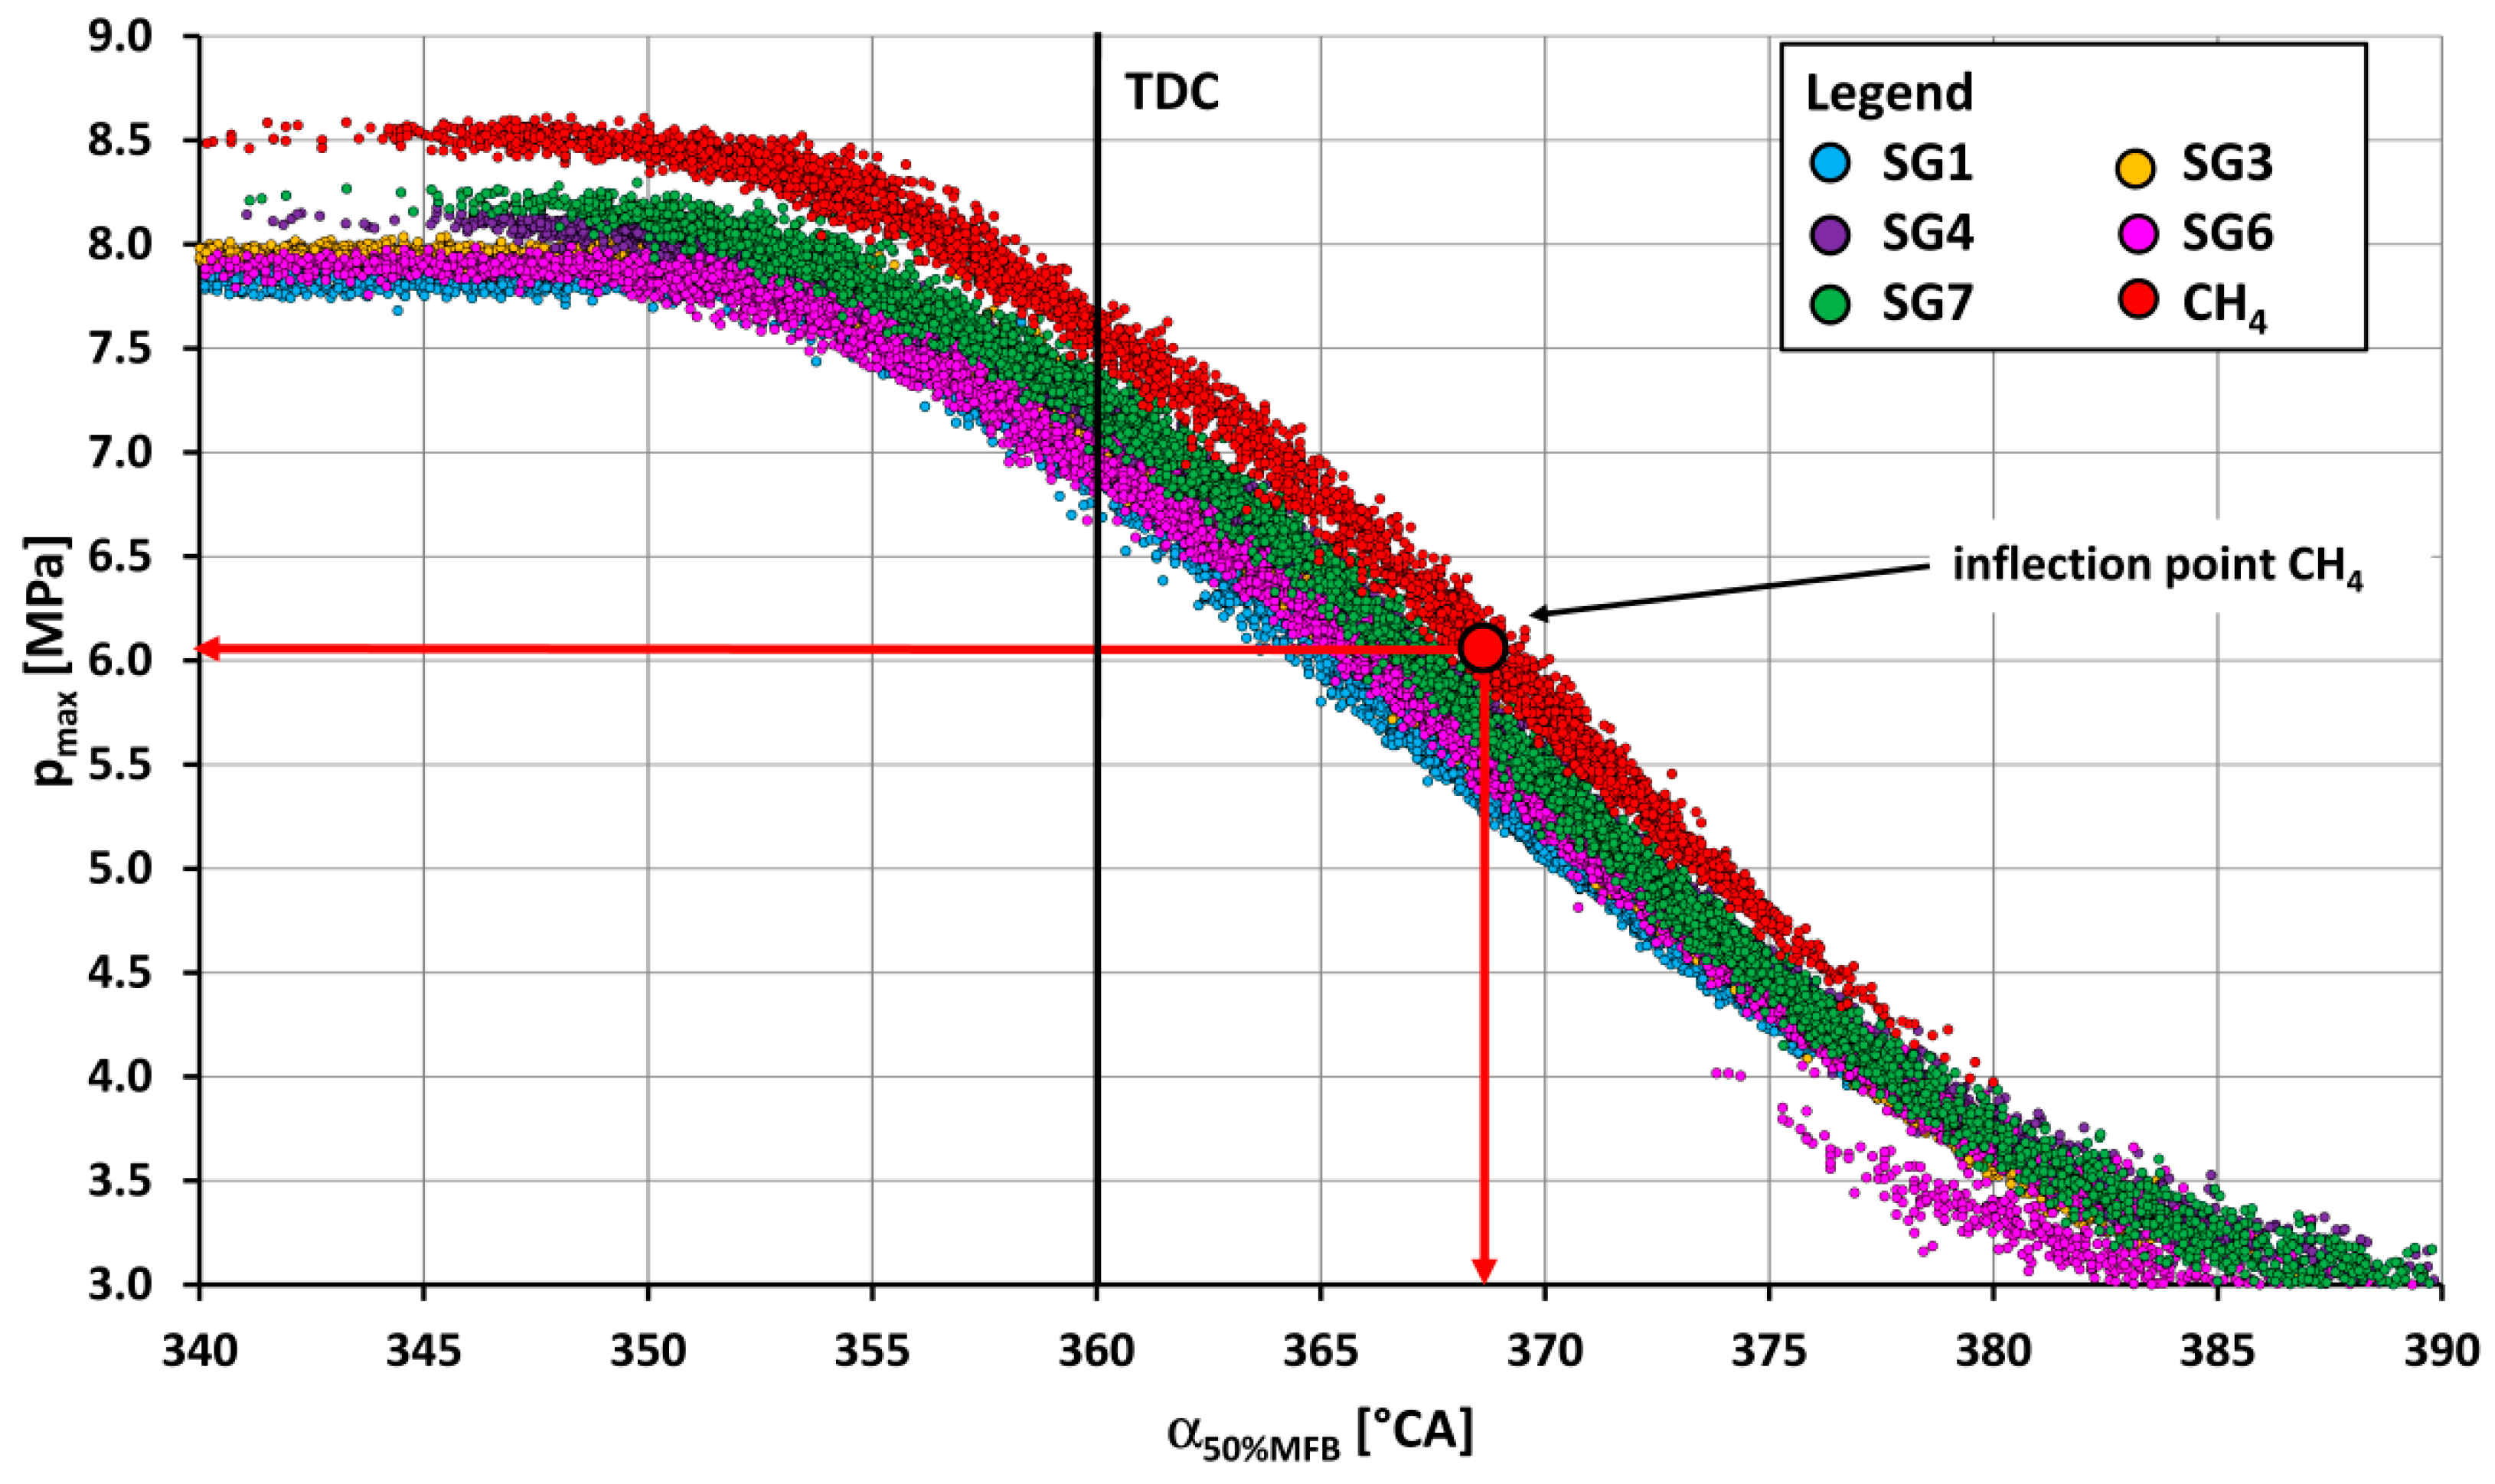
  • The highest value of the maximum combustion pressure (5.96 MPa) out of all measured synthesis gases was achieved for SG8 (Figure 7) and, conversely, the lowest combustion pressure (4.83 MPa) was achieved by the SG9 gas. The coefficient of variation of the maximum pressure was the lowest (5.4%) for the synthesis gas SG2, and, conversely, the highest value (8.2%) was when burning the SG9 gas.
  • The lowest pressure rise rate value (0.151 MPa/1 °CA) was achieved for the SG9, which contained 50% vol. of methane. Gases with a high hydrogen content (40% vol. in the SG5 and 30% vol. in the SG8) achieved the highest values of the pressure rise rate (0.217 MPa/1 °CA) of the engine.
  • The SG2 gas, which, in its composition, contains up to 50% vol. of hydrogen (Table 1), burned the fastest out of all combustible components of SGs, and had the least optimum start of ignition angle, namely, 16 °CA BTDC. On the other hand, the gas SG10, which had the highest methane content, had the largest start of ignition angle, namely, 27 °CA BTDC. In other words, with the same number of inert gases in the fuel, a larger proportion of hydrogen in the fuel mixture, with its faster burning, affects the reduction in the optimum start of ignition SOI angle before TDC.
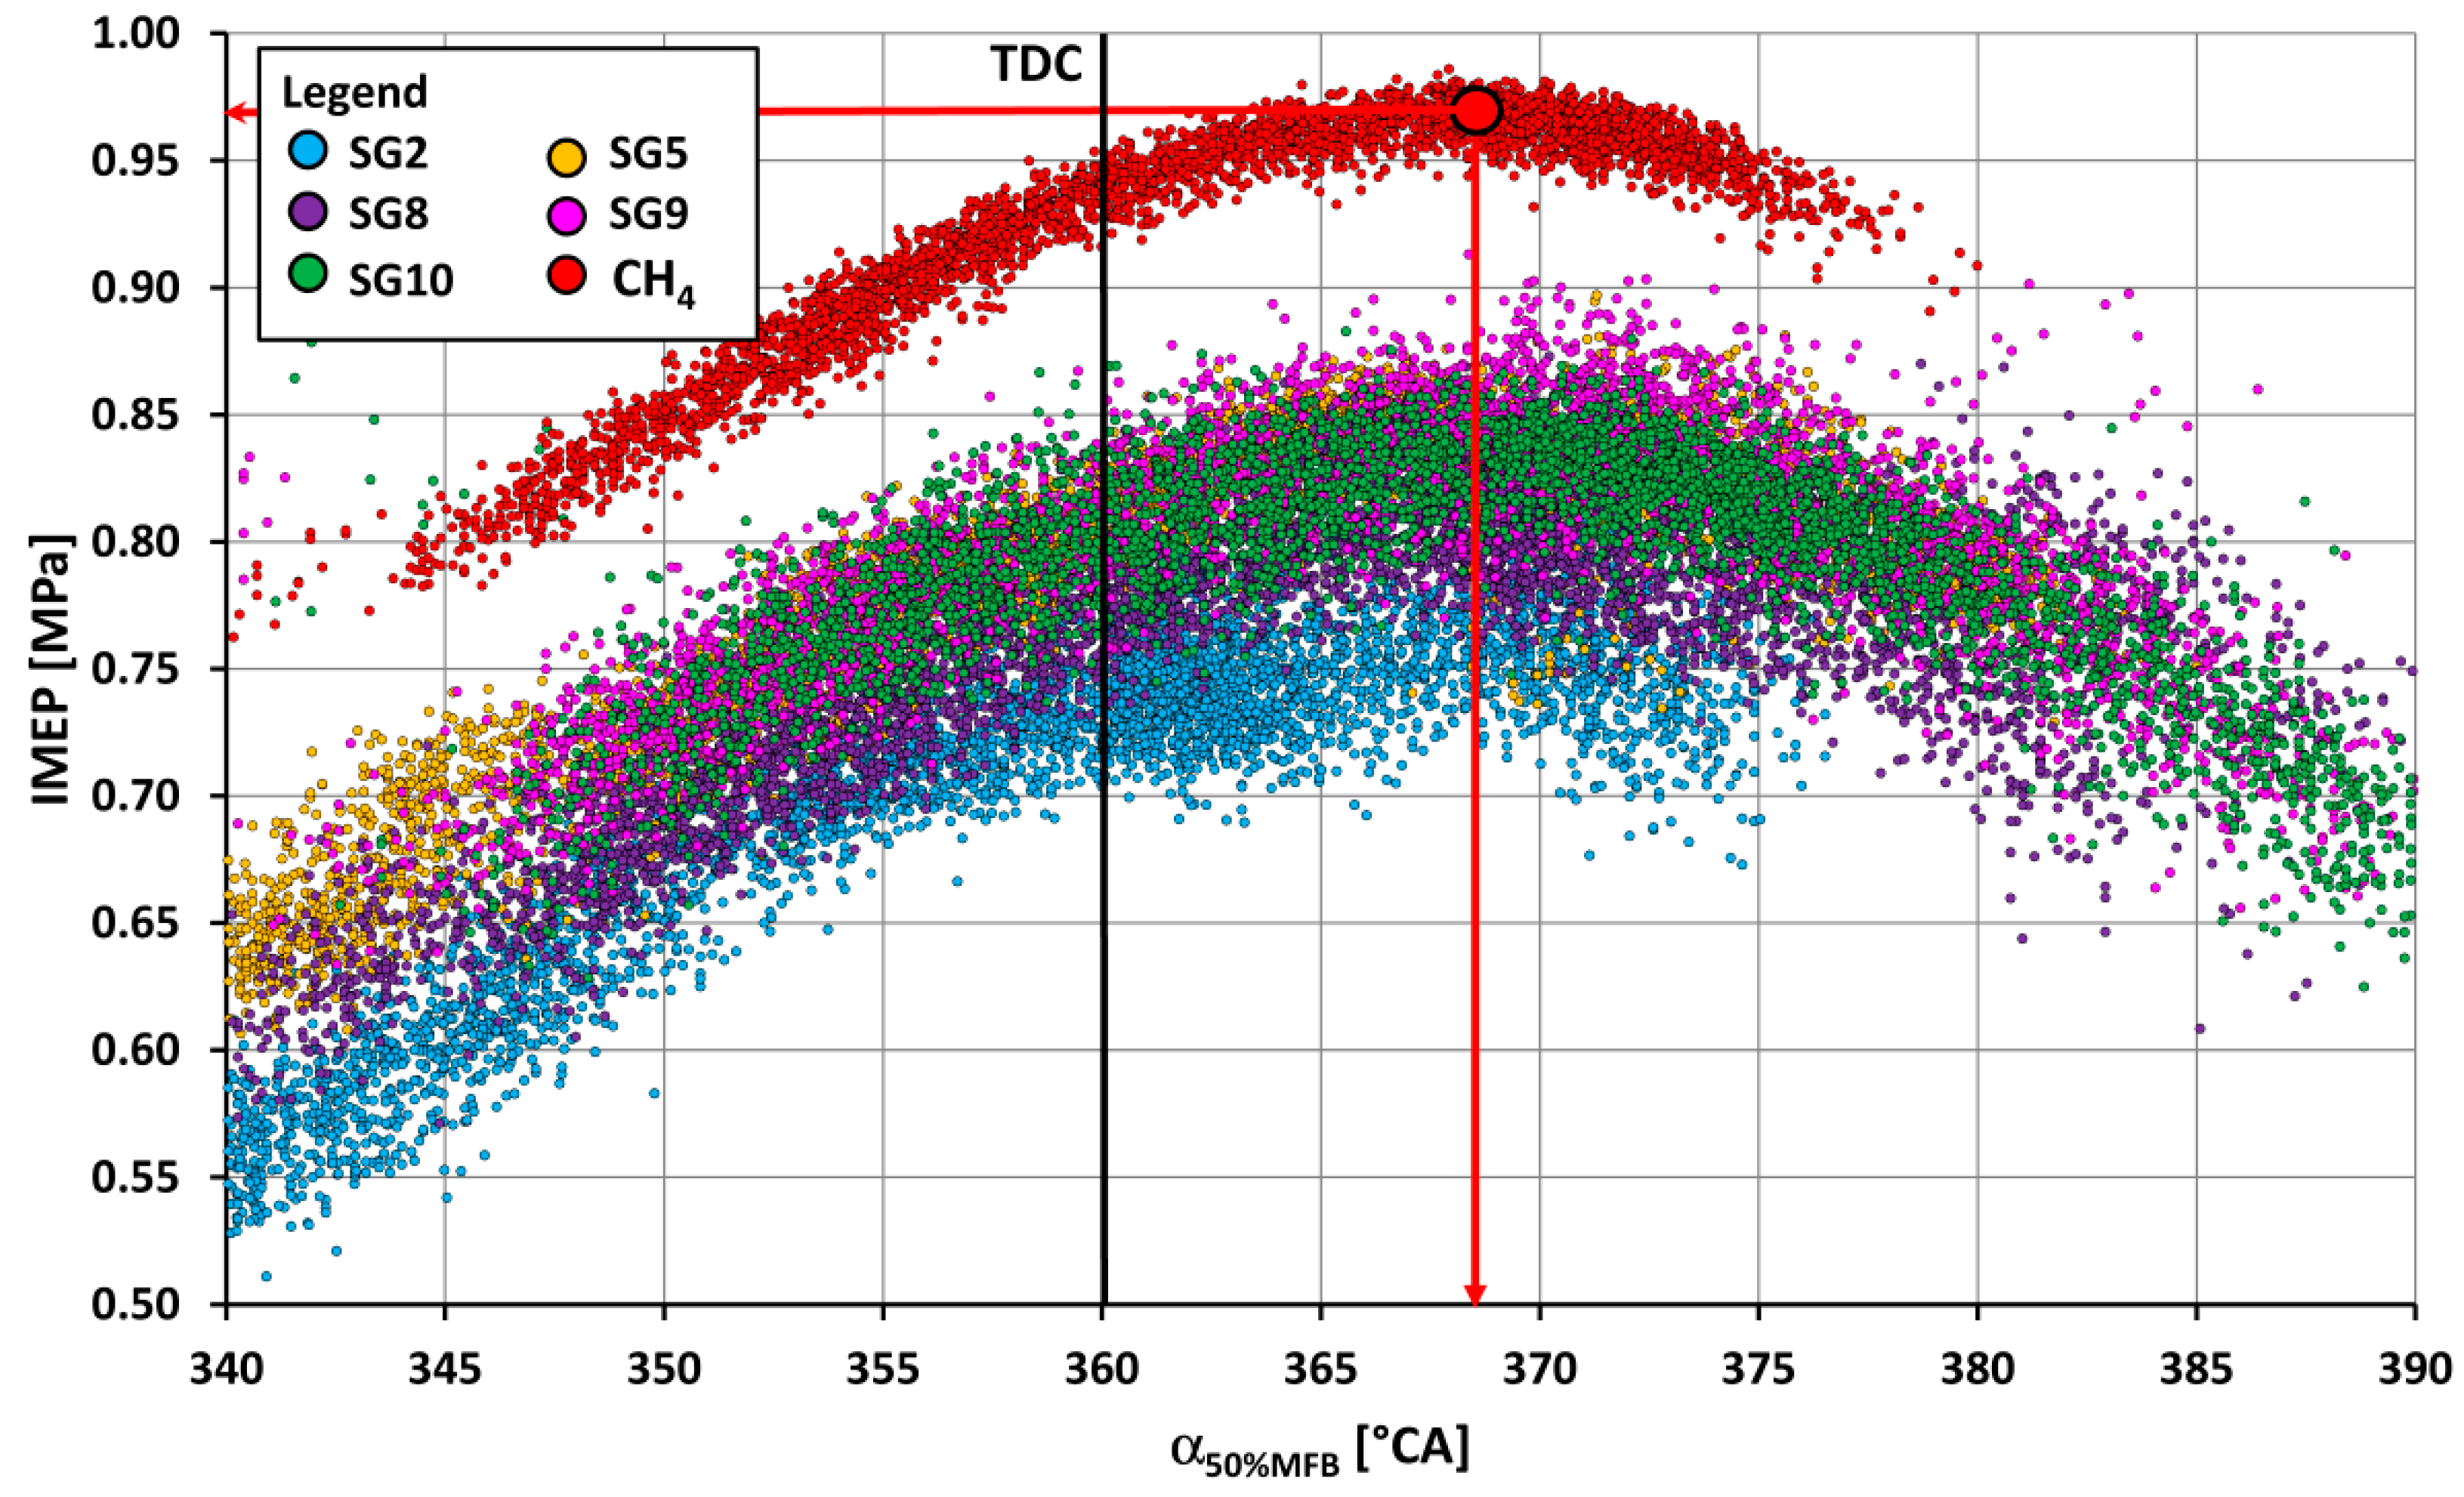
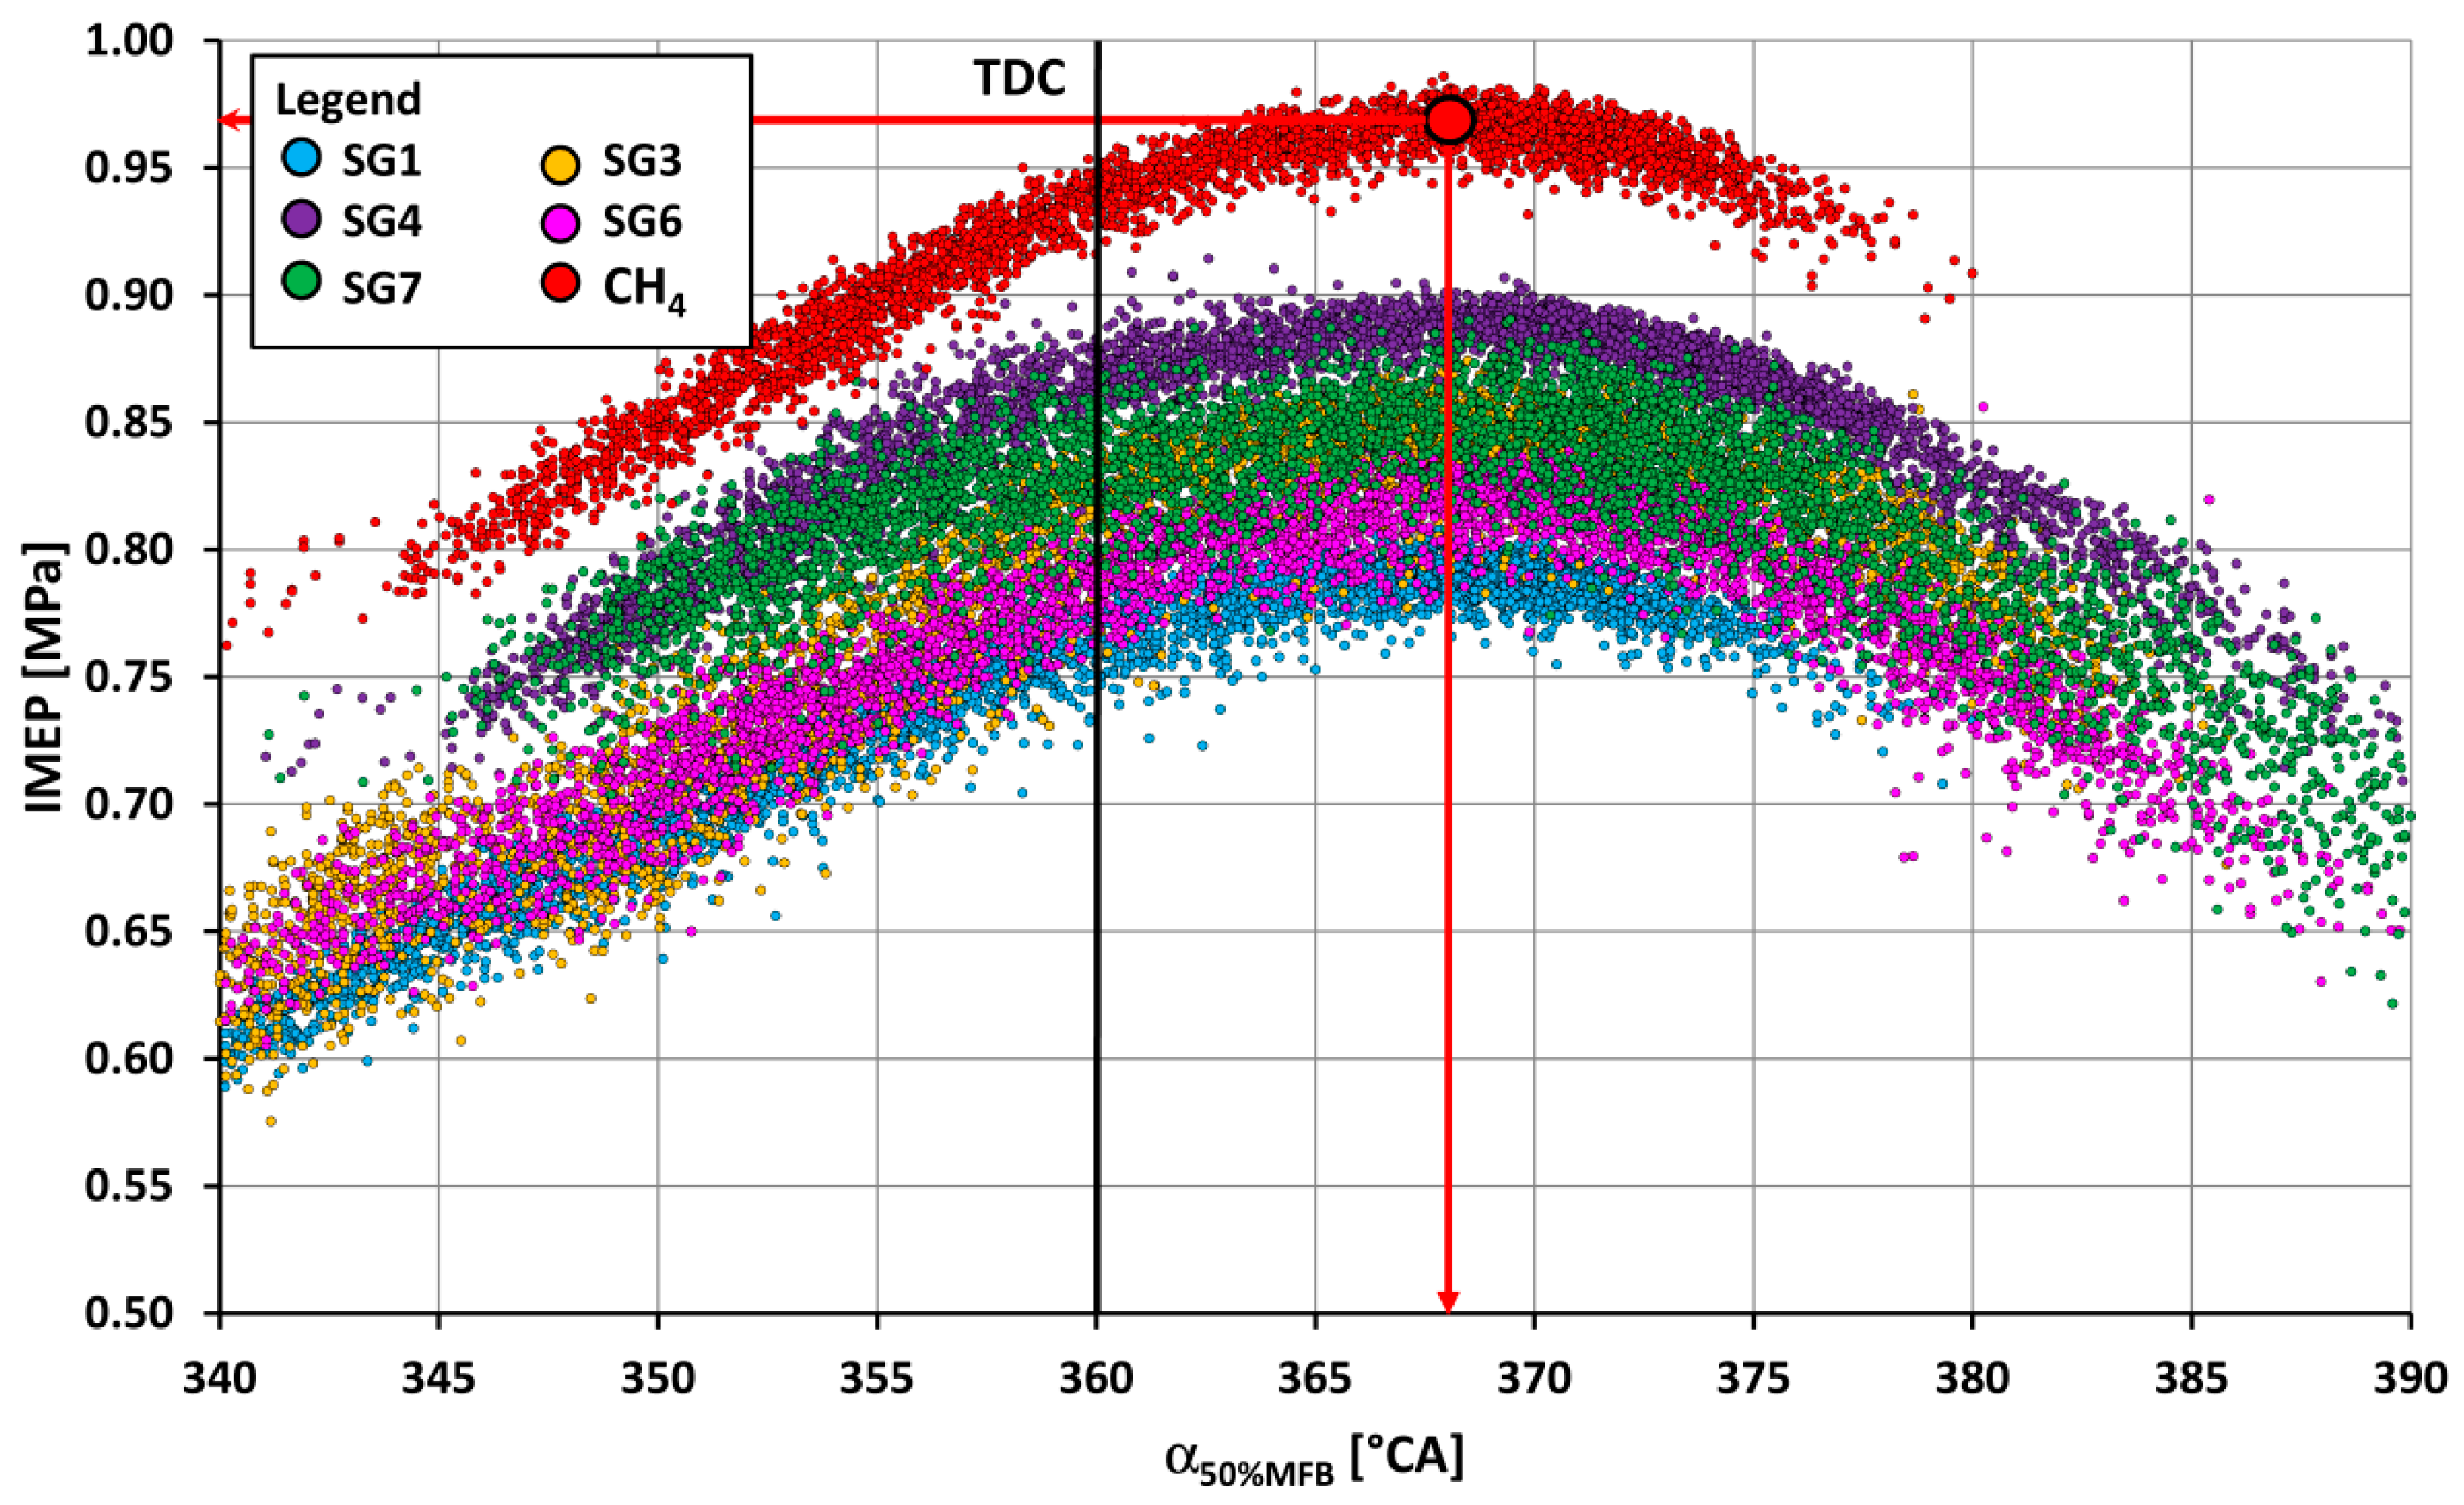
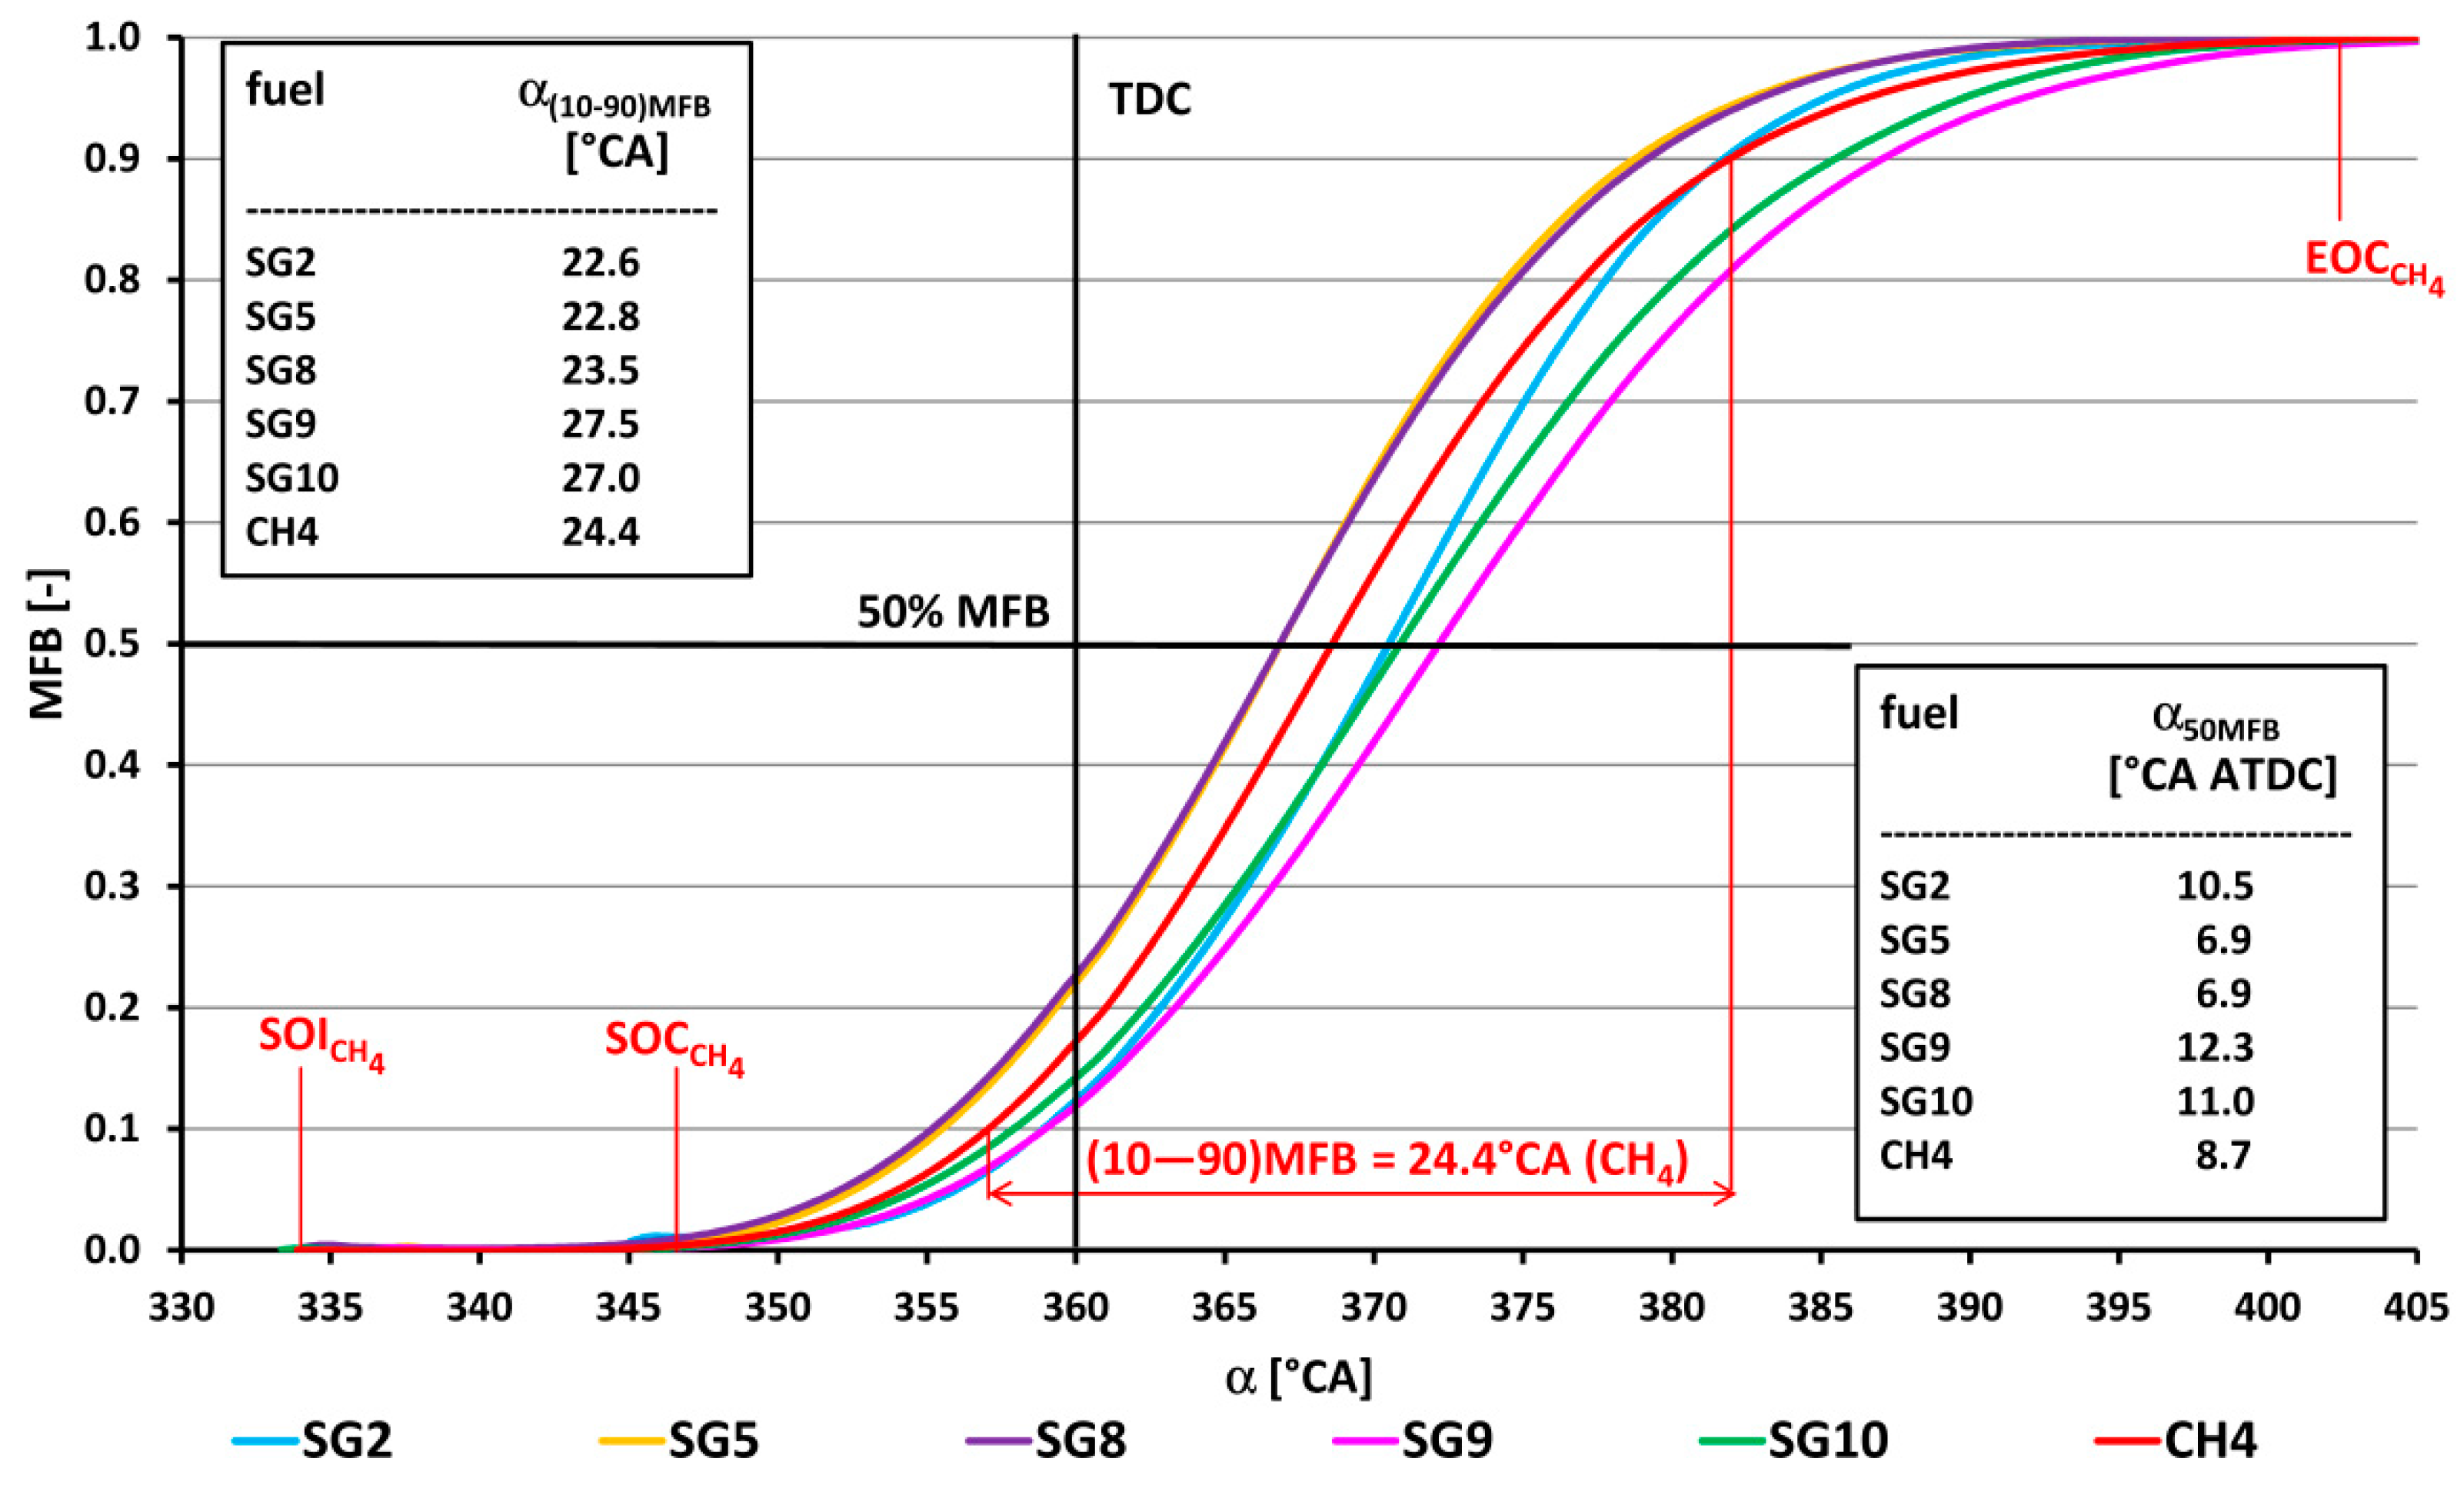
  • The course of fuel combustion (Figure 11 and Figure 12) presents the longest main phase of combustion (10–90% MFB) for the synthesis gas SG9 with a value of 27.5 °CA. The SG2 gas with the highest proportion of hydrogen (50% by volume) has the shortest main burning phase (22.6 °CA). The angle with half of the fuel burned varied from 6.9 °CA ATDC for the SG5 or the SG8 to 12.3 °CA ATDC for the SG9. The phase of the start of ignition (SOI—5% MFB) was the shortest (11.6 °CA) for the synthesis gas SG2 with high hydrogen content and, conversely, the longest (21.6 °CA) for the synthesis gas SG10 with the highest methane content.
  • The analysis of the effect of hydrogen in synthesis gases on the combustion process in internal combustion engines has shown that the hydrogen content in SGs is one of the main causes of their different behaviour during their combustion in the engine. Increasing the hydrogen content in synthesis gases brings about an increase in the values of the pressure increase rate during the combustion, a decrease in the COV values during the gradual burning-out of fuel, and a shortening of the total combustion period. In other words, synthesis gases with a higher hydrogen content lead to a slight increase in pressure rise rate, but also to a more stable combustion process. The role of hydrogen in synthesis gases, as long as there is no abnormal combustion, is positive. Combustion with a higher H2 content resembles isochoric combustion, which contributes to higher thermal and effective engine efficiency and also to lower fuel consumption. At the same time, it is necessary to consider an important property of hydrogen in a combusted gas mixture [49], namely that a higher proportion of hydrogen in the mixture reduces the emissions of harmful hydrocarbons. A higher hydrogen content in SGs reduces environmentally neutral CO2. On the contrary, when burning SGs, the present hydrogen increases the content of nitrogen oxides and water vapour in the exhaust gases of combustion engines.
  • The results for high-energy synthesis gases provide an idea of the integral parameters of the engine (torque and hourly consumption, Figure 3 and Figure 4), as well as its internal parameters, which are related to the combustion processes of these gases (Figure 5, Figure 6, Figure 7, Figure 8, Figure 9, Figure 10, Figure 11 and Figure 12), to which we paid the most attention in this article. The authors have grouped and summarized the results of the measurements into the following groups. They are similar to the conclusions reached for low- and medium-energy synthesis gases [1,2].
    (a)
    For the use of high-energy synthesis gases in cogeneration units, the most important criterion for obtaining energy from them must be the criterion of low consumption and, at the same time, high efficiency of the use. The results show that for the measured gases at 1500 rpm, the two required conditions are simultaneously fulfilled for gases SG8 (effective efficiency 32%), SG7 (32%) and SG4 (31%) (Figure 14). At the same time, the SG4 gas has achieved the highest performance parameters and also has one of the highest volumetric lower heating values of mixture LHVmixture of all gases (Table 1). The examined gases contain a high proportion of methane (from 30 to 40%) and hydrogen (10% and 30%). Therefore, the general conclusion that we can recommend for the production of high-energy gases is to manage the gasification technology in such a manner that the resulting gases contain as much methane and hydrogen as possible.
    (b)
    In order to avoid abnormal combustion in the form of engine knocking or back-firing of the mixture in the intake manifold, it is necessary to take into account the fact that in the case of gases with a low methane content (e.g., SG2, Table 1), if the hydrogen content in the fuel exceeds 25% vol., then the volume of inert gases must not fall below 25% of the volume [1,2]. During the experiments with SGs, this restriction was observed and we did not measure any signs of abnormal combustion during the experiments.
    (c)
    Regarding the inert gases present in the synthesis gases, if the gasification technology allows it, for the maximum optimization of performance parameters [1,49], we recommend a higher proportion of nitrogen in the synthesis gases than the proportion of carbon dioxide.
    (d)
    When changing the composition of synthesis gases, the same as with the low and medium-energy synthesis gases [1,2], it is necessary to optimize the engine for the compression ratio, the start of ignition angle (SOI) for individual gases, the ignition system (energy value sparks, thermal value of the spark plug), the geometry of the pipeline system in terms of achieving the maximum filling of the cylinders (valve timing, use of the wave effect), the shape of the combustion chamber or the shape of the channels and valves (flow coefficients), the optimum turbulence of the filling, the use of supercharging, etc. The results of SGs analyses carried out by the authors of this article are directly applicable in practice. The analyses provide several suggestions on how to set up waste gasification technologies to achieve optimal performance and the best economic (hourly fuel consumption, effective efficiency) parameter of the engine or cogeneration units.

Author Contributions

Conceptualization, A.C. and M.P.; methodology, A.C.; software, A.C.; validation, M.P. and A.M.; formal analysis, M.P.; resources, A.M.; writing—original draft preparation, A.C.; writing—review and editing, L.G.; visualization, A.C.; supervision, L.É. All authors have read and agreed to the published version of the manuscript.

Funding

This work was supported by the Slovak Research and Development Agency under Contract No. APVV-17-0006, APVV-18-0023, APVV-20-0046 and was also supported by the Slovak Cultural and Educational Grant Agency under the Contracts No. KEGA 026STU-4/2018 and KEGA 050STU-4/2021.

Institutional Review Board Statement

Not applicable.

Informed Consent Statement

Not applicable.

Data Availability Statement

Publicly available datasets were analysed in this study. The data presented in this study are available on request from the corresponding author.

Acknowledgments

The authors would like to thank Veronika Polóniová, Slovak University of Technology in Bratislava, Slovakia, for her translation service.

Conflicts of Interest

The authors declare no conflict of interest.

References

  1. Polóni, M.; Chríbik, A. Low-Energy Synthesis Gases from Waste as Energy Source for Internal Combustion Engine. SAE Int. J. Engines 2020, 13, 633–648. [Google Scholar] [CrossRef]
  2. Chríbik, A.; Polóni, M.; Magdolen, Ľ.; Minárik, M. Medium-Energy Synthesis Gases from Waste as an Energy Source for an Internal Combustion Engine. Appl. Sci. 2022, 12, 98. [Google Scholar] [CrossRef]
  3. Minister of the Environment and Climate Change. Environment and Climate Change Canada Health Canada 2020; Minister of the Environment and Climate Change: New Delhi, India, 2020; ISBN 978-0-660-35897-0.
  4. Barnes, D.K.A.; Galgani, F.; Thompson, R.C.; Barlaz, M. Accumulation and fragmentation of plastic debris in global environments. Philos. Trans. R. Soc. Lond. B Biol. Sci. 2009, 364, 1985–1998. [Google Scholar] [CrossRef] [PubMed]
  5. World Economic Forum. The New Plastics Economy. 2016. Available online: https://www3.weforum.org/docs/WEF_The_New_Plastics_Economy.pdf (accessed on 25 April 2023).
  6. Center for International Environmental Law. Plastic & Health. 2019. Available online: https://www.ciel.org/wp-content/uploads/2019/02/Plastic-and-Health-The-Hidden-Costs-of-a-Plastic-Planet-February-2019.pdf (accessed on 25 April 2023).
  7. Law, K.L.; Narayan, R. Reducing environmental plastic pollution by designing polymer materials for managed end-of-life. Nat. Rev. Mater. 2022, 7, 104–116. [Google Scholar] [CrossRef]
  8. Kunwar, B.; Cheng, H.N.; Chandrashekaran, S.R.; Sharma, B.K. Plastics to fuel: A review. Renew. Sustain. Energy Rev. 2016, 54, 421–428. [Google Scholar] [CrossRef]
  9. Karbalaei, S.; Hanachi, P.; Walker, T.R.; Cole, M. Occurrence, sources, human health impacts and mitigation of microplastic pollution. Environ. Sci. Pollut. Res. 2018, 25, 36046–36063. [Google Scholar] [CrossRef]
  10. Geyer, R.; Jambeck, J.R.; Law, K.L. Production, use, and fate of all plastics ever made. Sci. Adv. 2017, 3, e1700782. [Google Scholar] [CrossRef]
  11. Verma, R.; Vinoda, K.S.; Papireddy, M.; Gowda, A.N.S. Toxic Pollutants from Plastic Waste–A Review. Procedia Environ. Sci. 2016, 35, 701–708. [Google Scholar] [CrossRef]
  12. Utekar, S.; K, S.V.; More, N.; Rao, A. Comprehensive study of recycling of thermosetting polymer composites—Driving force, challenges and methods. Compos. Part B Eng. 2021, 207, 108596. [Google Scholar] [CrossRef]
  13. What Plastics Can and Cannot Be Recycled? Available online: https://www.slrecyclingltd.co.uk/what-plastics-can-and-cannot-be-recycled/ (accessed on 11 February 2022).
  14. Pickering, S. Recycling technologies for thermoset composite materials—Current status. Compos. Part A Appl. Sci. Manuf. 2006, 37, 1206–1215. [Google Scholar] [CrossRef]
  15. Thiounn, T.; Smith, R.C. Advances and approaches for chemical recycling of plastic waste. J. Polym. Sci. 2020, 58, 1347–1364. [Google Scholar] [CrossRef]
  16. Zhang, L.; Yao, D.; Tsui, T.-H.; Loh, K.-C.; Wang, C.-H.; Dai, Y.; Tong, Y.W. Plastic-containing food waste conversion to biomethane, syngas, and biochar via anaerobic digestion and gasification: Focusing on reactor performance, microbial community analysis, and energy balance assessment. J. Environ. Manag. 2022, 306, 114471. [Google Scholar] [CrossRef]
  17. Lea, W. Plastic incineration versus recycling: A comparison of energy and landfill cost savings. J. Hazard. Mater. 1996, 47, 295–302. [Google Scholar] [CrossRef]
  18. Ragaert, K.; Delva, L.; Van Geem, K. Mechanical and chemical recycling of solid plastic waste. Waste Manag. 2017, 69, 24–58. [Google Scholar] [CrossRef]
  19. Martín, M.M. Chapter 5—Syngas. In Industrial Chemical Process Analysis and Design; Elsevier: Amsterdam, The Netherland, 2016; ISBN 978-0-08-101093-8. [Google Scholar]
  20. Adrados, A.; de Marco, I.; Caballero, B.; López, A.; Laresgoiti, M.; Torres, A. Pyrolysis of plastic packaging waste: A comparison of plastic residuals from material recovery facilities with simulated plastic waste. Waste Manag. 2012, 32, 826–832. [Google Scholar] [CrossRef] [PubMed]
  21. Lopez-Urionabarrenechea, A.; de Marco, I.; Caballero, B.; Laresgoiti, M.; Adrados, A. Catalytic stepwise pyrolysis of packaging plastic waste. J. Anal. Appl. Pyrolysis 2012, 96, 54–62. [Google Scholar] [CrossRef]
  22. Namioka, T.; Saito, A.; Inoue, Y.; Park, Y.; Min, T.-J.; Roh, S.-A.; Yoshikawa, K. Hydrogen-rich gas production from waste plastics by pyrolysis and low-temperature steam reforming over a ruthenium catalyst. Appl. Energy 2011, 88, 2019–2026. [Google Scholar] [CrossRef]
  23. Saad, J.M.; Williams, P.T. Pyrolysis-catalytic dry (CO2) reforming of waste plastics for syngas production: Influence of process parameters. Fuel 2017, 193, 7–14. [Google Scholar] [CrossRef]
  24. van de Loosdrecht, J.; Niemantsverdriet, J.W. Synthesis Gas to Hydrogen, Methanol, and Synthetic Fuels. In Chemical Energy Storage; Robert Schlogl, X., Ed.; Walter de Gruyter GmbH: Berlin, Germany, 2012; pp. 443–458. ISBN 978-3-11-026407-4. [Google Scholar] [CrossRef]
  25. Kim, J.-W.; Mun, T.-Y.; Kim, J.-S. Air gasification of mixed plastic wastes using a two-stage gasifier for the production of producer gas with low tar and a high caloric value. Fuel 2011, 90, 2266–2272. [Google Scholar] [CrossRef]
  26. Ludlow-Palafox, C.; Chase, H.A. Microwave-Induced Pyrolysis of Plastic Wastes. Ind. Eng. Chem. Res. 2001, 40, 4749–4756. [Google Scholar] [CrossRef]
  27. Lopez, G.; Artetxe, M.; Amutio, M.; Alvarez, J.; Bilbao, J.; Olazar, M. Recent advances in the gasification of waste plastics. A critical overview. Renew. Sustain. Energy Rev. 2018, 82, 576–596. [Google Scholar] [CrossRef]
  28. Jie, X.; Li, W.; Slocombe, D.; Gao, Y.; Banerjee, I.; Gonzalez-Cortes, S.; Yao, B.; AlMegren, H.; Alshihri, S.; Dilworth, J.; et al. Microwave-initiated catalytic deconstruction of plastic waste into hydrogen and high-value carbons. Nat. Catal. 2020, 3, 902–912. [Google Scholar] [CrossRef]
  29. Vargas-Salgado, C.; Águila-León, J.; Alfonso-Solar, D.; Malmquist, A. Simulations and experimental study to compare the behavior of a genset running on gasoline or syngas for small scale power generation. Energy 2021, 244, 122633. [Google Scholar] [CrossRef]
  30. Wender, I. Synthesis Gas as a Source of Fuels and Chemicals: C-1 Chemistry. Annu. Rev. Energy 1986, 11, 295–314. [Google Scholar] [CrossRef]
  31. El-Nagar, R.A.; Ghanem, A.A. Syngas Production, Properties, and Its Importance. In Sustainable Alternative Syngas Fuel; IntechOpen: London, UK, 2019; ISBN 978-1-78984-581-5. [Google Scholar]
  32. Tucki, K.; Orynycz, O.; Wasiak, A.; Świć, A.; Mruk, R.; Botwińska, K. Estimation of Carbon Dioxide Emissions from a Diesel Engine Powered by Lignocellulose Derived Fuel for Better Management of Fuel Production. Energies 2020, 13, 561. [Google Scholar] [CrossRef]
  33. Puškár, M.; Živčák, J.; Kočišová, M.; Šoltésová, M.; Kopas, M. Impact of bio-renewable energy sources on reduction of emission footprint from vehicles. Biofuels Bioprod. Biorefining 2021, 15, 1385–1394. [Google Scholar] [CrossRef]
  34. Statistical Review of World Energy. Available online: https://www.bp.com/en/global/corporate/energy-economics/statistical-review-of-world-energy.html (accessed on 11 February 2022).
  35. U.S. Energy Information Administration. International Energy Outlook 2021; U.S. Department of Energy: Washington, DC, USA, 2021.
  36. Nakyai, T.; Saebea, D. Exergoeconomic comparison of syngas production from biomass, coal, and natural gas for dimethyl ether synthesis in single-step and two-step processes. J. Clean. Prod. 2019, 241, 118334. [Google Scholar] [CrossRef]
  37. Tucki, K.; Krzywonos, M.; Orynycz, O.; Kupczyk, A.; Bączyk, A.; Wielewska, I. Analysis of the Possibility of Fulfilling the Paris Agreement by the Visegrad Group Countries. Sustainability 2021, 13, 8826. [Google Scholar] [CrossRef]
  38. Puškár, M.; Kopas, M.; Sabadka, D.; Kliment, M.; Šoltésová, M. Reduction of the Gaseous Emissions in the Marine Diesel Engine Using Biodiesel Mixtures. J. Mar. Sci. Eng. 2020, 8, 330. [Google Scholar] [CrossRef]
  39. Hagos, F.Y.; Aziz, A.R.A.; Sulaima, S.A. Study of Syngas Combustion Parameters Effect on Internal Combustion Engine. Asian J. Sci. Res. 2013, 6, 187–196. [Google Scholar] [CrossRef]
  40. Wang, W.; Bai, B.; Wei, W.; Cao, C.; Jin, H. Hydrogen-rich syngas production by gasification of Urea-formaldehyde plastics in supercritical water. Int. J. Hydrogen Energy 2021, 46, 35121–35129. [Google Scholar] [CrossRef]
  41. WuWu, S.-L.; Kuo, J.-H.; Wey, M.-Y. Highly abrasion and coking-resistance core-shell catalyst for hydrogen-rich syngas production from waste plastics in a two-staged fluidized bed reactor. Appl. Catal. A Gen. 2021, 612, 117989. [Google Scholar] [CrossRef]
  42. Al-Asadi, M.; Miskolczi, N.; Eller, Z. Pyrolysis-gasification of wastes plastics for syngas production using metal modified zeolite catalysts under different ratio of nitrogen/oxygen. J. Clean. Prod. 2020, 271, 122186. [Google Scholar] [CrossRef]
  43. Fiore, M.; Magi, V.; Viggiano, A. Internal combustion engines powered by syngas: A review. Appl. Energy 2020, 276, 115415. [Google Scholar] [CrossRef]
  44. Jamsran, N.; Park, H.; Lee, J.; Oh, S.; Kim, C.; Lee, Y.; Kang, K. Influence of syngas composition on combustion and emissions in a homogeneous charge compression ignition engine. Fuel 2021, 306, 121774. [Google Scholar] [CrossRef]
  45. Hagos, F.Y.; Aziz, A.R.A.; Sulaiman, S.A. Syngas (H2/CO) in a spark-ignition direct-injection engine. Part 1: Combustion, performance and emissions comparison with CNG. Int. J. Hydrogen Energy 2014, 39, 17884–17895. [Google Scholar] [CrossRef]
  46. Papagiannakis, R.; Rakopoulos, C.; Hountalas, D.; Giakoumis, E. Study of the performance and exhaust emissions of a spark-ignited engine operating on syngas fuel. Int. J. Altern. Propuls. 2007, 1, 190. [Google Scholar] [CrossRef]
  47. Merker, G.P.; Schwarz, C.; Teichmann, R. Combustion Engines Development: Mixture Formation, Combustion, Emissions and Simulation; Springer: Berlin/Heidelberg, Germany, 2012; ISBN 978-3-642-02951-6. [Google Scholar] [CrossRef]
  48. Tazerout, M.; Le Corre, O.; Ramesh, A. A New Method to Determine the Start and End of Combustion in an Internal Combustion Engine Using Entropy Changes. Int. J. Thermodyn. 2000, 3, 49–55. [Google Scholar] [CrossRef]
  49. Chríbik, A.; Polóni, M.; Lach, J.; Ragan, B. The effect of adding hydrogen on the performance and the cyclic variability of a spark ignition engine powered by natural gas. Acta Polytech. 2014, 54, 10–14. [Google Scholar] [CrossRef]
  50. Chríbik, A.; Polóni, M.; Minárik, M.; Mitrovič, R.; Miškovič, Z. The Effect of Inert Gas in the Mixture with Natural Gas on the Parameters of the Combustion Engine. In Computational and Experimental Approaches in Materials Science and Engineering; Springer: Cham, Switzerland, 2020; pp. 410–426. ISBN 978-3-030-30852-0. [Google Scholar] [CrossRef]
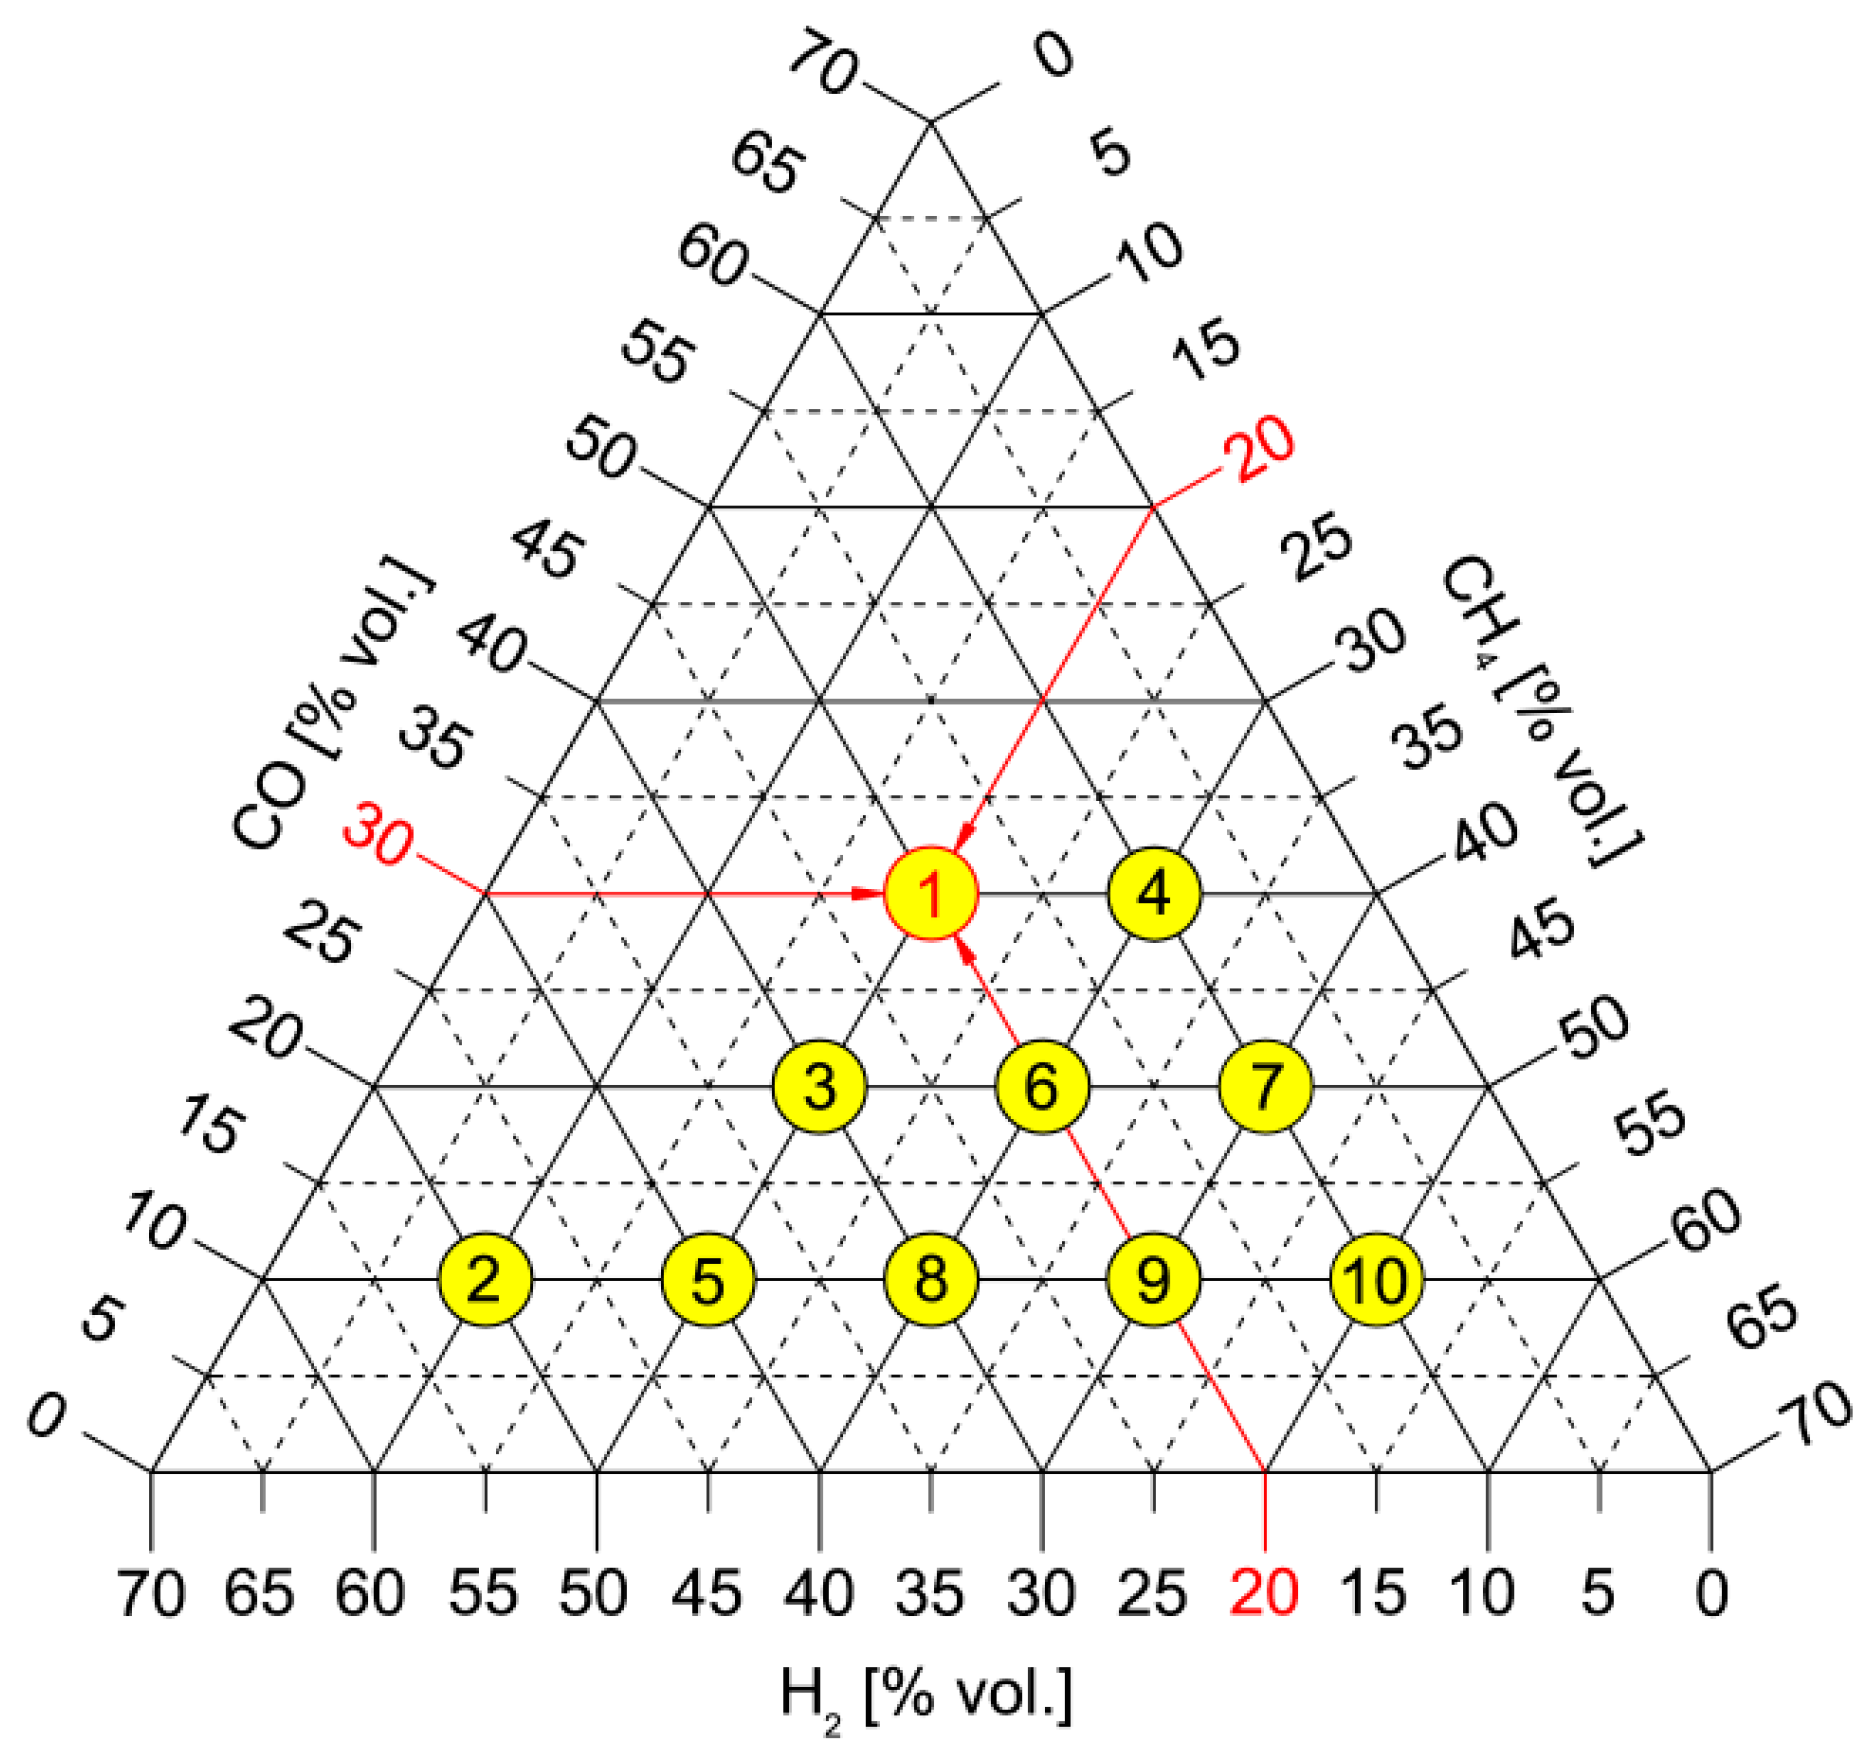
Figure 1. Ternary diagram of the composition of synthesis gases with a constant representation of inert gases of 30% vol. (25% vol. CO2, 5% vol. N2) with indicated composition of the selected synthesis gas SG1 (20% vol. CH4, 20% vol. H2, 30% vol. CO).
Sustainability 15 07806 g001
Figure 2. The basic scheme of the internal combustion engine Lombardini LGW 702: 1—intake manifold, 2—position sensor of the crankshaft, 3—water radiator, 4—exhaust system, 5—silencer, 6—catalyst, 7—exhaust temperature and pressure sensor, 8—spark plug with integrated pressure sensor, 9—dynamometer, 10—pressure bottle of methane, 11—pressure bottle of syngas, 12,19—mass flowmeter of gas, 13—mixer with diffuser, 14—engine control unit, 15—ignition coil, 16—broadband lambda probe, 17—stepper motor, 18—mixture richness regulation.
Sustainability 15 07806 g002
Figure 3. Course of the brake torque Mt and the hourly fuel consumption Mfuel in the engine speed characteristics for the methane and synthesis gases at full load, stoichiometric mixture and optimum start of ignition (SOI) angle.
Sustainability 15 07806 g003
Figure 4. Course of the brake torque Mt and the hourly fuel consumption Mfuel in the engine speed characteristics for the methane and synthesis gases at full load, stoichiometric mixture and optimum start of ignition (SOI) angle.
Sustainability 15 07806 g004
Figure 5. Course of the mean indicated effective pressure (IMEP) depending on the angle (α50%MFB) of the crankshaft rotation, when 50% of the mass of the fuel is burned when operating on methane and synthesis gases SG2, SG5, SG8, SG9 and SG10. Conditions: 1500 rpm, full load, stoichiometric mixture.
Sustainability 15 07806 g005
Figure 6. Course of the mean indicated effective pressure (IMEP) depending on the angle (α50%MFB) of the crankshaft rotation, when 50% of the mass of the fuel is burned when operating on methane and synthesis gases SG1, SG3, SG4, SG6 and SG7. Conditions: 1500 rpm, full load, stoichiometric mixture.
Sustainability 15 07806 g006
Figure 7. Pressure profile p in the cylinder of an internal combustion engine during operation on methane and synthesis gases SG2, SG5, SG8, SG9 and SG10. Conditions: 1500 rpm, full load, stoichiometric mixture, optimum start of ignition angle (SOI) for each fuel, compression curve is for air.
Sustainability 15 07806 g007
Figure 8. Pressure profile p in the cylinder of an internal combustion engine during operation on methane and synthesis gases SG1, SG3, SG4, SG6 and SG7. Conditions: 1500 rpm, full load, stoichiometric mixture, optimum start of ignition angle (SOI) for each fuel, compression curve is for air.
Sustainability 15 07806 g008
Figure 9. The course of the maximum pressure depending on the angle at which 50% of the fuel for methane and synthesis gases (SG2, SG5, SG8, SG9 and SG10) is burned. Conditions: 1500 rpm, full load, stoichiometric mixture.
Sustainability 15 07806 g009
Figure 10. The course of the maximum pressure depending on the angle at which 50% of the fuel for methane and synthesis gases (SG1, SG3, SG4, SG6 and SG7) is burned. Conditions: 1500 rpm, full load, stoichiometric mixture.
Sustainability 15 07806 g010
Figure 11. Course of burning-out of the fuel (CH4, SG2, SG5, SG8, SG9 and SG10) as dependent on the crankshaft angle for methane and synthesis gases (MFB—Mass Fraction Burned, α—Crankshaft Rotation Angle, TDC—Top Dead Centre, SOI—Start of Ignition, SOC—Start of Combustion, EOC—End of Combustion). Conditions: 1500 rpm, full load, stoichiometric mixture, optimum SOI angle for each fuel.
Sustainability 15 07806 g011
Figure 12. Course of burning-out of the fuel (CH4, SG1, SG3, SG4, SG6 and SG7)) as dependent on the crankshaft angle for methane and synthesis gases (MFB—Mass Fraction Burned, α—Crankshaft Rotation Angle, TDC—Top Dead Centre, SOI—Start of Ignition, SOC—Start of Combustion, EOC—End of Combustion). Conditions: 1500 rpm, full load, stoichiometric mixture, optimum SOI angle for each fuel.
Sustainability 15 07806 g012
Figure 13. Values of the brake torque Mt 1500 as a function of LHVmixture at the engine speed of 1500 rpm and full load for measured SGs.
Sustainability 15 07806 g013
Figure 14. Values of the hourly fuel consumption Mfuel1500 as a function of mass percentage syngas in the stoichiometric mixture.
Sustainability 15 07806 g014
Table 1. Selected basic physical–chemical properties of high-energy synthesis gases (LHV 12–20 MJ/kg) compared to the methane (CH4—methane, H2—hydrogen, CO—carbon monoxide, CO2—carbon dioxide, N2—nitrogen, LHV—lower heating value of fuel, A/F—air to fuel ratio, M—molar mass, ρNTP fuel—density of fuel (CH4, syngas) at NTP, ρNTP mixture—density of stoichiometric mixture (fuel + air) at NTP, Fuel in mix.—fuel in stoichiometric mixture, LHVmixture—lower volumetric heating value of stoichiometric mixture, SG1—SG10 are the measured synthesis gases (syngas) as sorted upwards by mass LHV, NTP = 20 °C, 101,325 Pa).
NameUnitCH4SG1SG2SG3SG4SG5
CH4[% vol.]1002010203020
H2[% vol.]02050301040
CO[% vol.]03010203010
CO2[% vol.]02525252525
N2[% vol.]055555
LHV[MJ·kg−1]50.01212.02712.87913.27413.54514.857
LHV[MJ·m−3]33.35812.2099.54012.04114.54011.871
A/F ratio[kg·kg−1]17.123.653.864.094.264.64
M[kg·kmol−1]16.0424.4217.8221.8225.8219.22
ρNTP fuel[kg·m−3]0.6671.0150.7410.9071.0730.799
ρNTP mixture[kg·m−3]1.1531.1581.0671.2051.1771.105
Fuel in mix.[% vol.]9.5124.4629.5624.4420.7924.45
LHVmixture[MJ·m−3]3.1722.9862.8202.9433.0232.902
NameUnitCH4SG6SG7SG8SG9SG10
CH4[% vol.]1003040304050
H2[% vol.]02010302010
CO[% vol.]02020101010
CO2[% vol.]02525252525
N2[% vol.]055555
LHV[MJ·kg−1]50.01214.89216.31516.56018.05419.364
LHV[MJ·m−3]33.35814.37616.70214.19716.53018.859
A/F ratio[kg·kg−1]17.124.735.305.335.936.45
M[kg·kmol−1]16.0423.2224.6220.6222.0223.43
ρNTP fuel[kg·m−3]0.6670.9651.0240.8570.9160.974
ρNTP mixture[kg·m−3]1.1531.1551.1721.1321.1521.168
Fuel in mix.[% vol.]9.5120.8118.1120.8018.1016.04
LHVmixture[MJ·m−3]3.1722.9913.0252.9532.9923.025
Table 2. Parameters of the Lombardini LGW 702 spark ignition combustion engine together with a photo of the modified piston bowls.
Sustainability 15 07806 i001Principle of the WorkSpark Ignition
Number of cylinders and arrangement2 in a row
Crankshaft angle (°)360
Bore/Stroke (mm)75/77.6
Sweep volume (cm3)686
Compression ratio (-)12.5:1
Valve timing, driveOHC, timing belt
Preparation of mixtureExternal, in a mixer with electronic control of mixture richness to stoichiometric mixture
CoolingBy liquid, with forced circulation, two-circuit thermostatically controlled, radiator blown by a fan, driven by an electric motor
RegulationElectronically controlled throttle Brisk10DS- the highest thermal value
Ignition systemIgnition coil Bosch, energy 65 mJ
Disclaimer/Publisher’s Note: The statements, opinions and data contained in all publications are solely those of the individual author(s) and contributor(s) and not of MDPI and/or the editor(s). MDPI and/or the editor(s) disclaim responsibility for any injury to people or property resulting from any ideas, methods, instructions or products referred to in the content.

