Article

The Effect of Consumer Sentiment on Manufacturers’ Green Technology Innovation: A RDEU Evolutionary Game Model

1
College of Economics and Management, Shandong University of Science and Technology, Qingdao 266000, China
2
School of Economics, Ocean University of China, Qingdao 266100, China
*
Author to whom correspondence should be addressed.
Sustainability 2023, 15(1), 706; https://doi.org/10.3390/su15010706
Submission received: 17 November 2022 / Revised: 19 December 2022 / Accepted: 28 December 2022 / Published: 30 December 2022
(This article belongs to the Special Issue Green Logistics and Intelligent Transportation)

Abstract

:
In the information era, the fluctuation of consumer sentiments plays a key role in the green technology innovation of manufacturers. This paper introduces RDEU theory to the evolutionary game model to analyze the existence of equilibrium under different sentiment states. Then, the model is numerically simulated to study the influence of sentiments on the participants’ strategies. The results indicate that under different sentiment states green technology innovation and green purchasing behavior present different evolutionary trajectories. The main conclusions are as follows: (1) When both parties have no sentiments, there is a stable equilibrium point, suggesting customers are willing to purchase green products and manufacturers choose green technology innovation strategies. (2) When both parties have sentiments, the rising consumer boycott sentiment will hinder optimistic manufacturers from choosing green technology innovation strategies. Furthermore, the rising support sentiment of the consumer promotes optimistic manufacturers’ green technology innovations, and the more manufacturers deviate from the rational state, the more likely they are to maintain the current production mode. (3) When only one party has a sentiment, the manufacturer’s rationality plays a more important role in promoting green technology innovation than the consumer’s rationality. Based on the above conclusions, this paper proposes some sentiment guidance strategies that are conducive to green production and consumption. This study provides a new perspective and theoretical guidance for studying the behavior of green supply chain members to promote the development of green economy circulation.

1. Introduction

In the context of high global carbon emissions, it is the responsibility of major countries to achieve the goals of “carbon peak” and “carbon neutrality” [1]. To achieve the goal of “Made in China 2025”, China has been making efforts to build an efficient, clean, low-carbon, and circular green manufacturing system, and the transformation of manufacturers to green factories is the key point [2]. At the manufacturer level, many manufacturers select environmentally friendly materials and invest in green technology innovation [3]. Consumer, government, and media pressure also push manufacturers to raise their environmental awareness and improve their green technology innovations [4]. With the rapid spread of information in the Internet era, the small changes in the behavior of manufacturers’ green production methods have been magnified exponentially. As we all know, the online public opinion field shows irrational characteristics. The consumer’s purchasing behaviors will be influenced greatly due to irrational sentiments and then have a huge influence on the manufacturer’s green technology innovation.
From the consumers’ perspective, as the demand side of green products, they have boycott sentiments regarding manufacturers’ pollution and support sentiments regarding manufacturers’ green technology innovation activities. Furthermore, consumers will have differential risk perceptions, ultimately leading to different purchasing decisions, and their sentiments indirectly affect the green technology innovation of manufacturers [5]. For example, the news that “BYD factory pollution causes children to have nosebleeds” spread rapidly through microblogs and the public paid great attention to it in May 2022. The new-energy automobile giant was caught in the vortex of public opinion, and nearby residents made banners to protest. In addition, other previously concealed pollution events caused by BYD were exposed, and consumers’ boycott sentiments spread continuously. Consumers had a pessimistic perception of the overall environment. Subsequently, BYD’s factory in Yuhua District, Changsha, suspended production and upgraded its pollution discharge technology. Conversely, the Chinese sports brand “Tebu” has been committed to green technology research and innovation in recent years. In June 2022, a 100% polylactic acid windbreaker that can naturally degrade was released. With the green consumption boom superimposed over media publicity, consumers’ support sentiments deepened. The number of orders for environmental protection clothing in the first three quarters of 2022 was up to five times that of 2021. At this point, consumers had an optimistic perception. However, as the supply side of green products, manufacturers face great risk in the process of green technology innovation due to high input costs, uncertain market demand, and other factors. To maximize profits, they have to comprehensively weigh the input and output of green technology innovation and make scientific and reasonable green decisions [6]. Faced with many obstacles to the green upgrading of the economy, the government implements environmental regulations and subsidy policies to improve the green awareness of customers and manufacturers [7,8]. To overcome the difficulties of green technology innovation and further stimulate the market vitality of green products, the demand side, the supply side, and the government need to cooperate efficiently [9]. In this process, sentiments play an essential role. Therefore, how sentiments influence equilibrium strategies between the customer and the manufacturer is an interesting and practical question.
Most of the existing studies have investigated manufacturers’ green technology innovation under a rational environment, ignoring the sentiments of the supply and demand sides in the supply chain. However, the different sentimental states will have an important impact on green consumption and production behavior. In addition, these studies have been mainly based on a static perspective. It is of great practical significance to analyze the evolution process and influencing factors of the green technology innovation behavior of manufacturers from dynamic and quantitative perspectives. Due to these gaps in the literature, the main contributions of our research are twofold. First, this study introduces RDEU theory to the evolutionary game model from the dual perspectives of supply and demand regarding green products. This study innovatively explores the internal evolutionary logic and micro-mechanisms of consumers’ sentiments affecting manufacturers’ green technology innovation. Secondly, the model’s numerical simulations intuitively show the evolution track of the behavior strategies of each subject under different sentimental situations. This paper contributes to laying a theoretical foundation for sentiment management in the process of the green innovation of manufacturers. At the end of this study, some suggestions are proposed for the high-quality development of a green economy.
The remainder of this paper is organized as follows. Section 2 outlines a literature review. This section includes a problem description, basic assumptions, and the construction of a payoff matrix. Section 3 constructs an RDEU evolutionary game model and analyzes the stability of the strategy of two game subjects under three sentiment scenarios. Section 4 simulates our proposed evolutionary game model and analyzes the sentimental factors. Section 5 presents the conclusions and proposes practical implications for the government regarding sentiment management.

2. Literature Review

The literature related to this study can be divided into two streams, including the influential factors of consumers on manufacturers’ green technology innovation and the application of rank-dependent expected utility (RDEU) theory to the game model.

2.1. Influence Factors of Consumers on Manufacturers’ Green Technology Innovation

From the perspective of the consumer, many scholars believe that consumers have different utility perceptions and a willingness to pay for green products. They hold the view that consumers’ green product purchase decisions will ultimately affect manufacturers’ green production and management decisions, such as green product pricing, green degree investment, and, especially, green technology innovation investment [10,11]. Zhang et al. [12] constructed a petroleum supply chain model and found that the green improvement degree is influenced by additional demand from customers’ green preferences. Wang et al. [13] thought manufacturer green technology innovation is affected by customer decision-making. Lv et al. [14] considered the significant impact of heterogeneous green consumers on green innovation and found that manufacturers should invest in green innovation when there are green consumers.
Customers’ green product purchasing behavior is caused by various factors, such as their income, previous purchase experiences, environmental awareness, attitudes toward green products, and so on. In general, income is the influential factor in consumers’ willingness to pay more for green products [15]. There is also a large number of studies to discuss other consumers’ internal factors. For example, based on the Theory of Planned Behavior, Costa et al. [16] focused on how consumers’ previous purchasing experiences, environmental consciousnesses, and attitudes toward green products influence purchasing intentions. Chen et al. [17] constructed a decision-making model to explore consumer behaviors relating to the intention to purchase green products. They found that consumers’ environmental awareness significantly and positively affected green product purchasing. Ji et al. [18] examined the impact of consumers’ low-carbon preferences on manufacturers’ decision-making in the O2O retail supply chain. Dou et al. [19] found a mutual influence between the emission abatement cost, the emission tax, and consumers’ environmental awareness that impacted pricing strategies. Demand acceleration driven by consumers’ environmental awareness plays a key role. Yao et al. [20] discussed the impact of consumers’ environmental concerns on the strategies and outcomes of a supply chain. Liu et al. [21] investigated the dynamic impact of competition and consumers’ environmental awareness on key supply chain players using two-stage Stackelberg game models. They found that, as consumers’ environmental awareness increases, retailers and manufacturers with superior ecofriendly operations will benefit. He et al. [22] built a Stackelberg game model considering the consumer’s sensitivities to carbon emissions and delivery times. This study found that there are distinct cross-effects due to consumers’ dual sensitivities.
Consumers’ attitudes toward and environmental awareness of green products are heterogeneous, and this difference is comprehensively affected by consumer education, green preference, and other factors [23,24]. For example, Zhou et al. [25] developed a game model to study how consumer education affects the decision-making of game players in a closed-loop supply chain. They proposed a “consumer education paradox”; that is, more consumers are willing to pay for the remanufactured product, and the manufacturer switches the choice from remanufacturing to no remanufacturing. Aagerup and Nilsson [26] hold the view that individuals with more environmental knowledge generally have a more positive perception of green products. These ecological consumers tend to purchase green products. Similar to this study, Zhang et al. [27] also found that these individuals are more likely to have a positive perception of companies producing ecofriendly products. Consumers will not only consider the additional utility brought by green products but also weigh and compare the costs generated when purchasing green products, thus changing their green product purchasing decisions [28]. Jin et al. [29] found that managers might overestimate the premium that average consumers are willing to pay for the environment.

2.2. Application of RDEU Theory to Game Model

Due to the frequent occurrence of external uncertainty, the influence of sentiments on behavior has attracted attention recently. To the best of our knowledge, sentiments play a key role in individuals’ decision-making behaviors [30]. The rank-dependent expected utility (RDEU) theory can be used to describe utility under different sentiments. RDEU theory was proposed by Quiggin in 1982, overcoming some drawbacks of the expected utility (EU) theory. From the perspective of the application of RDEU theory, this theory has been widely used in social events, such as nuclear security conflicts [31], urban demolition conflicts [32], and land expropriation conflicts [33] in emergencies. Combined with the game model, RDEU theory can be used to analyze the influence of sentiments on final equilibrium strategies and evolution paths. According to RDEU theory, different sentiments and intensities have different effects on the evolution of equilibrium solutions. At the same time, driven by sentiments, game participants will also be affected by the judgment of the other party to adopt a certain strategy. Liu et al. [34] introduced RDEU theory to the game model to analyze how emotional factors influence the equilibrium strategies of wastewater discharge. Xin et al. [35] constructed an RDEU evolutionary game model between the Japanese government and fishermen. They concluded that the sentiments of the players would affect the strategic choices of all players in the system. Xu et al. [36] analyzed the equilibrium of the evolutionary game between pollution enterprises and surrounding people with emotion and the influence of emotion parameters on event evolution.
Furthermore, some scholars have begun to pay attention to the impact of the sentiment fluctuations of micro-subjects on individual economic behaviors. Some studies have introduced RDEU theory to the discussion of economic issues. Li et al. [37] constructed an RDEU hawk–dove game model to study the trade conflict between Chinese steel companies and Australian iron ore companies, and in [37], they illustrated the impact of different emotions on the equilibrium solution. Zhang et al. [38] established an RDEU evolutionary game model to discuss the influences of heterogeneous emotions on quality decision-making. In particular, in a study of the influence of sentiments on green economic behaviors such as emission reduction, Wang et al. [39] quantified emotions as an irrational factor and combined them with an evolutionary game between the government and energy consumers using RDEU theory. In [39], they analyzed how the low-carbon emotions of game subjects affect their decision-making.

2.3. Research Gaps

According to the above literature, although the research on the driving factors of enterprises’ green technology innovation has achieved rich achievements, the discussion from the perspective of consumers still focuses on the impact of consumer green purchasing behavior on manufacturers’ green innovation. Several studies deeply discuss the two internal motivations of consumers, green preference and environmental awareness, but ignore consumers’ sentiments. However, in the information explosion of the digital era, the rapid spread of consumers’ sentiments has a significant impact on the green technology innovations of manufacturers. RDEU theory has also begun to be linked with economic activities, but it is still widely used in the analysis and research of social events. Studies about manufacturers’ green technology innovations under different sentimental situations are relatively scarce. In reality, the participants are irrational in the process of green technology innovation. Thus, sentiments cannot be ignored. It is meaningful to study the role of sentiments in manufacturers’ green technology innovation.
To bridge these gaps, considering the effect of sentiment fluctuations on green product circulation, this paper builds an RDEU evolutionary game model between the manufacturer and the consumer from a micro-perspective. From a dynamic perspective, the model is used to describe the dynamic evolution law of the manufacturer choosing green innovation and the consumer choosing green purchasing. Then, combined with numerical simulation, the influence of sentiments on manufacturers’ green technology innovations is discussed. Based on related conclusions, some practical strategies are put forward.

3. RDEU Evolutionary Game Model of Green Technology Innovation

To resolve the green technology innovation conflicts between consumers and manufacturers under different sentiments, this section introduces RDEU theory. Based on the relationship between the demand and supply side of green products, an RDEU evolutionary game model in three sentiment scenarios is constructed.

3.1. Rank-Dependent Expected Utility (RDEU) Theory

Based on Quiggin’s hierarchy-dependent utility theory [40] and referring to the relevant literature, the steps of combining RDEU theory with the game model are summarized.
Step 1: Suppose that the return of game participants under different strategy combinations is X = { x i , i = 1 , 2 , ... , n } , and the corresponding probability of different strategy combinations is P ( X = x i ) = p i . The payoffs are ranked, from large to small, x 1 > x 2 > ... > x n . Then, define the rank position of xi as Equation (1):
R P i = P X x i = j i n p j , i = 1 , 2 ... , n
The RPi is the probability distribution function of the benefits. The greater the benefits of a certain strategy, the greater its weight in decision-making.
Step 2: Calculate the decision weight, π(xi), as Equation (2):
π x i = ω p i + 1 R P i ω 1 R P i
where w(.) is the emotion function, the monotonic increasing function of the utility level, and satisfies w (0) = 0 and w (1) = 1. It is assumed that w(pi) = pir and 0 < pi < 1. Therefore, when r = 1, the players are rational, without sentiment or deviation from probability estimation. When r > 1, the consumer has a boycott sentiment, and the manufacturer is pessimistic. They underestimate the selection probability and increase the weight of the final decision. When r < 1, the consumer has a support sentiment, and the manufacturer is optimistic, overestimating the selection probability, and the weight of the final decision is reduced.
Step 3: The expected effect function of the RDEU of game party i can be expressed as Equation (3):
V i = i = 1 n π x i u x i , i = 1 , 2 ... , n
where u(xi) is the utility function under different strategy combinations. Substitute (2) into (3) to derive the following:
V i = i = 1 n ω p i + 1 R P i ω 1 R P i u x i , i = 1 , 2 , ... , n

3.2. Problem Description

In the process of promoting the green technology innovation of manufacturers, there are three participants, namely, manufacturers, consumers, and the government. Under consumer and regulation pressure, traditional manufacturers may choose to upgrade their green technology innovation to achieve clean production, waste recycling, low-carbon energy, and green products. On the one hand, on the demand side, consumers may choose to purchase green products or ordinary products due to their different sentiments toward the environment and attitudes toward green products. Consumer purchasing decisions affect manufacturers’ production and green technology innovation decisions. On the other hand, the government is seen as an external participant aiming to build a green manufacturing system. To improve the development of a green economy, the government may provide appropriate subsidies to manufacturers engaged in green technology innovation to make up for high innovation costs. Meanwhile, the government also provides some subsidies to green product purchases to stimulate green product consumption.
In this game model, consumers and manufacturers are taken as the research objects. Consumers have two strategies, purchasing green products and purchasing ordinary products, which are recorded as {G, NG}. Specifically, G means that consumers attach importance to the environmental benefits of products and are willing to pay extra money to buy upgraded green products, and NG means that consumers are unwilling to pay more money to obtain green products and maintain the original decision to purchase ordinary products. Manufacturers also have two strategies, promoting green technology innovation and not promoting green technology, which are recorded as {T, NT}. T means that manufacturers carry out green technology innovations to provide green products with a high green degree. In the process of innovation, manufacturers may obtain government subsidies and achieve corporate social responsibility. It is beneficial to improve manufacturers’ corporate reputation and environmental benefits. Meanwhile, NT means that traditional manufacturers still use high energy consumption and highly polluting technology to produce ordinary products. It is detrimental to the long-term development of manufacturing enterprises.

3.3. Basic Assumptions and Payoff Matrix

Assumption 1:
Assume that the probability of a consumer purchasing green products is x, and the probability of purchasing ordinary products is 1 − x; the probability of a manufacturer choosing a green technology innovation strategy is y, and the probability of choosing a nongreen innovation strategy is 1 − y. Both participants aim to maximize their utilities.
Assumption 2:
For the manufacturer, when, and only when, the manufacturer produces green products, and the consumer buys green products, the manufacturer will obtain the highest return: RM1. In other cases, the supply and demand of green products cannot be matched smoothly, so the manufacturer’s income is reduced to RM2. In addition, if the manufacturer chooses the green technology innovation strategy, the transformation into a green factory will signal that the company is fulfilling its corporate social responsibility to the public, generating additional reputation gains: F.
Assumption 3:
The manufacturer’s initial cost is C, but the innovation of green technologies, such as resource-intensive utilization and waste disposal emissions, requires a lot of capital investment, which leads to an increase, ΔC, in the manufacturer’s costs [2].
Assumption 4:
For the consumer, the benefits of purchasing green products and original products are R1 and R2, and the corresponding purchasing costs are C1 and C2, respectively. In the absence of green product value, the manufacturer will reflect a certain cost of green technology innovation in the proportion of product sales markup, that is, R1 > R2 and C1 > C2 [13].
Assumption 5:
When the consumer is willing to buy green products but cannot be satisfied, there will be a psychological loss of income and health loss; the sum of the loss is f. When the consumer chooses to buy ordinary products, and the manufacturer chooses a green technology innovation strategy, the consumer needs to find other alternatives, resulting in opportunity costs: ρ1. When the consumer and the manufacturer are not willing to pay extra costs for green products, it will cause environmental pollution and bring additional health losses, ρ2, satisfying ρ1 < ρ2 < f to consumers.
Assumption 6:
To improve the operational efficiency of the green supply chain, the government will subsidize the buyers and producers of green products: t1C1 and t2ΔC [41].
Assumption 7:
Assume that the value of reputation improvement is not enough to make up for the increase in cost, namely, F < (1 − t2) ΔC. If the manufacturer chooses to maintain the status quo while consumers prefer green products, the manufacturer will lose a large number of customers, leading to a decline in revenue: g. At this point, revenue will decline more than in other cases, that is, (1 − t2) ΔC − F < g. In general, the final benefit of green technology innovation is relatively high, such that RM1 − (1 − t2) ΔC + F > RM2.
Assumption 8:
The consumer has three sentimental states: boycott sentiment, support sentiment, and rationality. The manufacturer also has three sentimental states, respective to these consumer states: optimism, pessimism, and rationality.
To sum up, the strategic space of the consumer is {G, NG}, and the strategic space of the manufacturer is {T, NT}. The payoff matrix of both parties is shown in Table 1.

3.4. RDEU Evolutionary Game Model between the Manufacturer and the Consumer

Based on the above assumptions, the payoff of the consumer and manufacturer can be ranked, respectively, as
R 1 1 t 1 c 1 > R 2 C 2 ρ 1 > R 2 C 2 ρ 2 > R 2 C 2 f
R M 1 C 1 t 2 Δ C + F > R M 2 C > R M 2 C 1 t 2 Δ C + F > R M 2 C g
According to the RDEU game model, combined with the green product conflict between consumers and manufacturers (Table 1), consumers and manufacturers obtain the utility, probability distribution, rank, and decision weight of the corresponding income, as shown in Table 2 and Table 3.
The expected utility of the consumer choosing to purchase the green product is assumed to be Ux, as shown in Equation (7):
U x = R 1 1 t 1 C 1 y r 2 + R 2 C 2 f 1 y r 2
From this, the expected utility function of RDEU corresponding to the consumer can be expressed as Equation (8):
E U x = i = 1 4 π x i u x i = x y r 1 R 1 R 2 1 t 1 C 1 + C 2 + ρ 1 + y r 1 ρ 2 ρ 1 + 1 x + x y r 1 f ρ 2 + R 2 C 2 f
The expected utility of the manufacturer choosing green technology innovation is assumed to be Uy, as shown in Equation (9):
U y = x r 1 R M 1 C 1 t 2 Δ C + F + R M 2 C 1 t 2 Δ C + F 1 x r 1
From this, the expected utility function of RDEU corresponding to consumers can be expressed as Equation (10):
E U y = i = 1 4 π y i u y i = x y r 2 R M 1 R M 2 1 t 2 Δ C + F + 1 x + x y r 2 F 1 t 2 Δ C + 1 + 2 x y x y r 2 1 t 2 Δ C F + R M 2 C g

3.5. Replicator Dynamics Equations

During the game process, the players will constantly judge the benefits under different strategies and adjust their own decisions to obtain a replicator dynamic equation. The equation can be used to further analyze the role of the players’ sentiments in the dynamic evolution of the whole game. According to Equations (7)–(10), the replicator dynamic equations of the consumer and manufacturer can be expressed as Equations (11) and (12):
F x = x t = x r 1 U x E U x = x r 1 R 1 1 t 1 C 1 y r 2 + R 2 C 2 f 1 y r 2 x y r 1 R 1 R 2 1 t 1 C 1 + C 2 + ρ 1 y r 1 ρ 2 ρ 1 1 x + x y r 1 f ρ 2 R 2 + C 2 + f
F y = y t = y r 2 U y E U y = y r 2 x r 1 R M 1 C 1 t 2 Δ C + F + R M 2 C 1 t 2 Δ C + F 1 x r 1 R M 2 + C + g 1 + 2 x y x y r 2 1 t 2 Δ C F x y r 2 R M 1 R M 2 1 t 2 Δ C + F 1 x + x y r 2 F 1 t 2 Δ C
Proposition 1.
Based on the dynamic equations (11) and (12), the evolutionary equilibrium (EE) of the system can be obtained as (0, 0), (0, 1), (1, 0), (1,1), and (x*, y*), where (x*, y*) satisfies the equations as follows:
x G R M 1 R M 2 2 C f ρ 2 R M 1 R M 2 = R M 1 R M 2 f + ρ 1 * R M 1 R M 2 y R 1 + R 2 1 t 1 C 1 C 2 f F 1 t 2 Δ C + g G G = R 1 R 2 1 t 1 C 1 + C 2 + ρ 1

3.6. Evolutionary Equilibrium Stability Analysis

According to the method proposed by Friedman [42], the Jacobian matrix can be applied to verify the local stable points of the system and obtain the evolutionarily stable strategy (ESS) of the system. When the determinant of the Jacobian matrix, J, of an equilibrium point is greater than zero and its trajectory is less than zero, the point is a locally stable point, which is called the ESS of the system. The Jacobian matrix of the system is as follows:
J = F x x F x y F y x F y y
where
F x x = r 1 x r 1 1 R 1 1 t 1 C 1 y r 2 + R 2 C 2 f 1 y r 2 x y r 1 R 1 R 2 1 t 1 C 1 + C 2 + ρ 1 y r 1 ρ 2 ρ 1 R 2 + C 2 + f 1 x + x y r 1 f ρ 2 + x r 1 r 1 x y r 1 1 R 1 R 2 1 t 1 C 1 + C 2 + ρ 1 r 1 1 x + x y r 1 f ρ 2 y 1
F x y = x r 1 r 2 R 1 1 t 1 C 1 y r 2 1 + r 2 y r 2 1 R 2 C 2 f r 1 x y r 1 1 x R 1 R 2 1 t 1 C 1 + C 2 + ρ 1 r 1 1 x + x y r 1 1 f ρ 2 x r 1 y r 1 1 ρ 2 ρ 1
F y x = y r 2 r 1 x r 1 1 R M 1 C 1 t 2 Δ C + F r 1 x r 1 1 R M 2 C 1 t 2 Δ C + F r 2 1 x + x y r 2 1 y 1 F 1 t 2 Δ C r 2 1 + 2 x y x y r 2 1 2 y 1 1 t 2 Δ C F r 2 x y r 2 1 y R M 1 R M 2 1 t 2 Δ C + F
F y y = r 2 y r 2 1 x r 1 R M 1 C 1 t 2 Δ C + F + R M 2 C 1 t 2 Δ C + F 1 x r 1 x y r 2 R M 1 R M 2 1 t 2 Δ C + F R M 2 1 + 2 x y x y r 2 1 t 2 Δ C F 1 x + x y r 2 F 1 t 2 Δ C + g + C r 2 y r 2 1 x + x y r 2 1 F 1 t 2 Δ C x + 1 + 2 x y x y r 2 1 2 x 1 1 t 2 Δ C F + x x y r 2 1 R M 1 R M 2 1 t 2 Δ C + F

3.6.1. Scenario 1: Both Parties Have No Sentiments

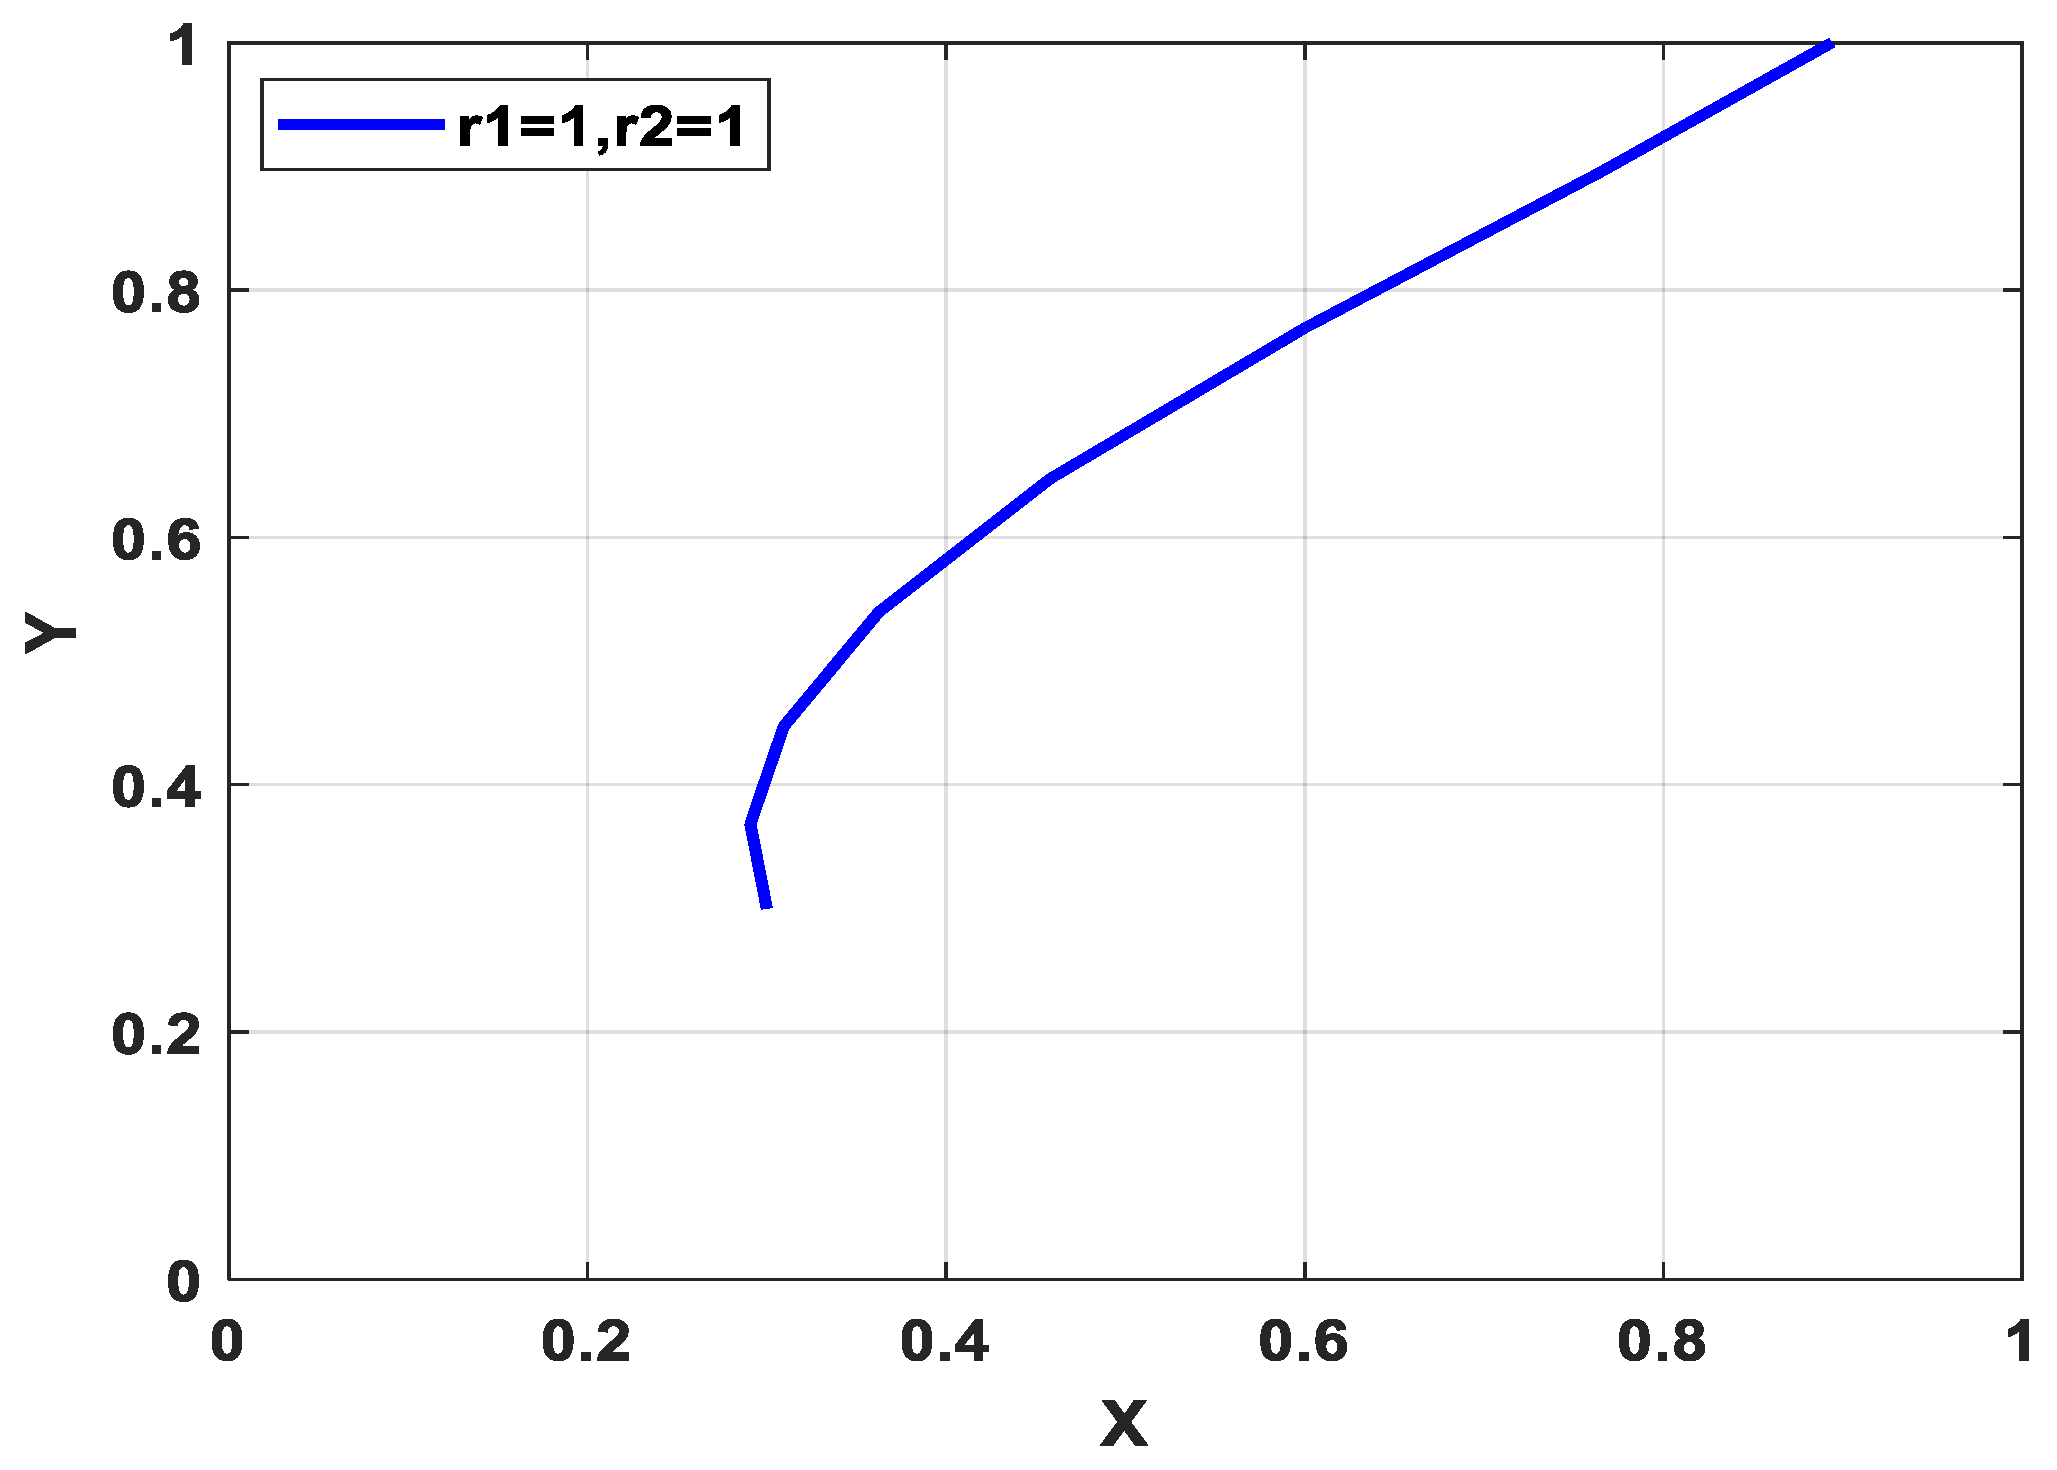
When both the consumer and manufacturer have no sentiments, it is assumed that r1 = r2 = 1. In this scenario, there is no difference between the RDEU evolutionary game and the traditional evolutionary game.
Proposition 2.
When the consumer and manufacturer both have no sentiments (r1 = r2 = 1), the stability of each equilibrium point is obtained as shown in Table 4.
According to Proposition 2, there exists a stable equilibrium point (1, 1), which implies the consumer will choose to buy green products, and the manufacturer will choose green technology innovation strategies eventually.

3.6.2. Scenario 2: Both Parties Have Sentiments

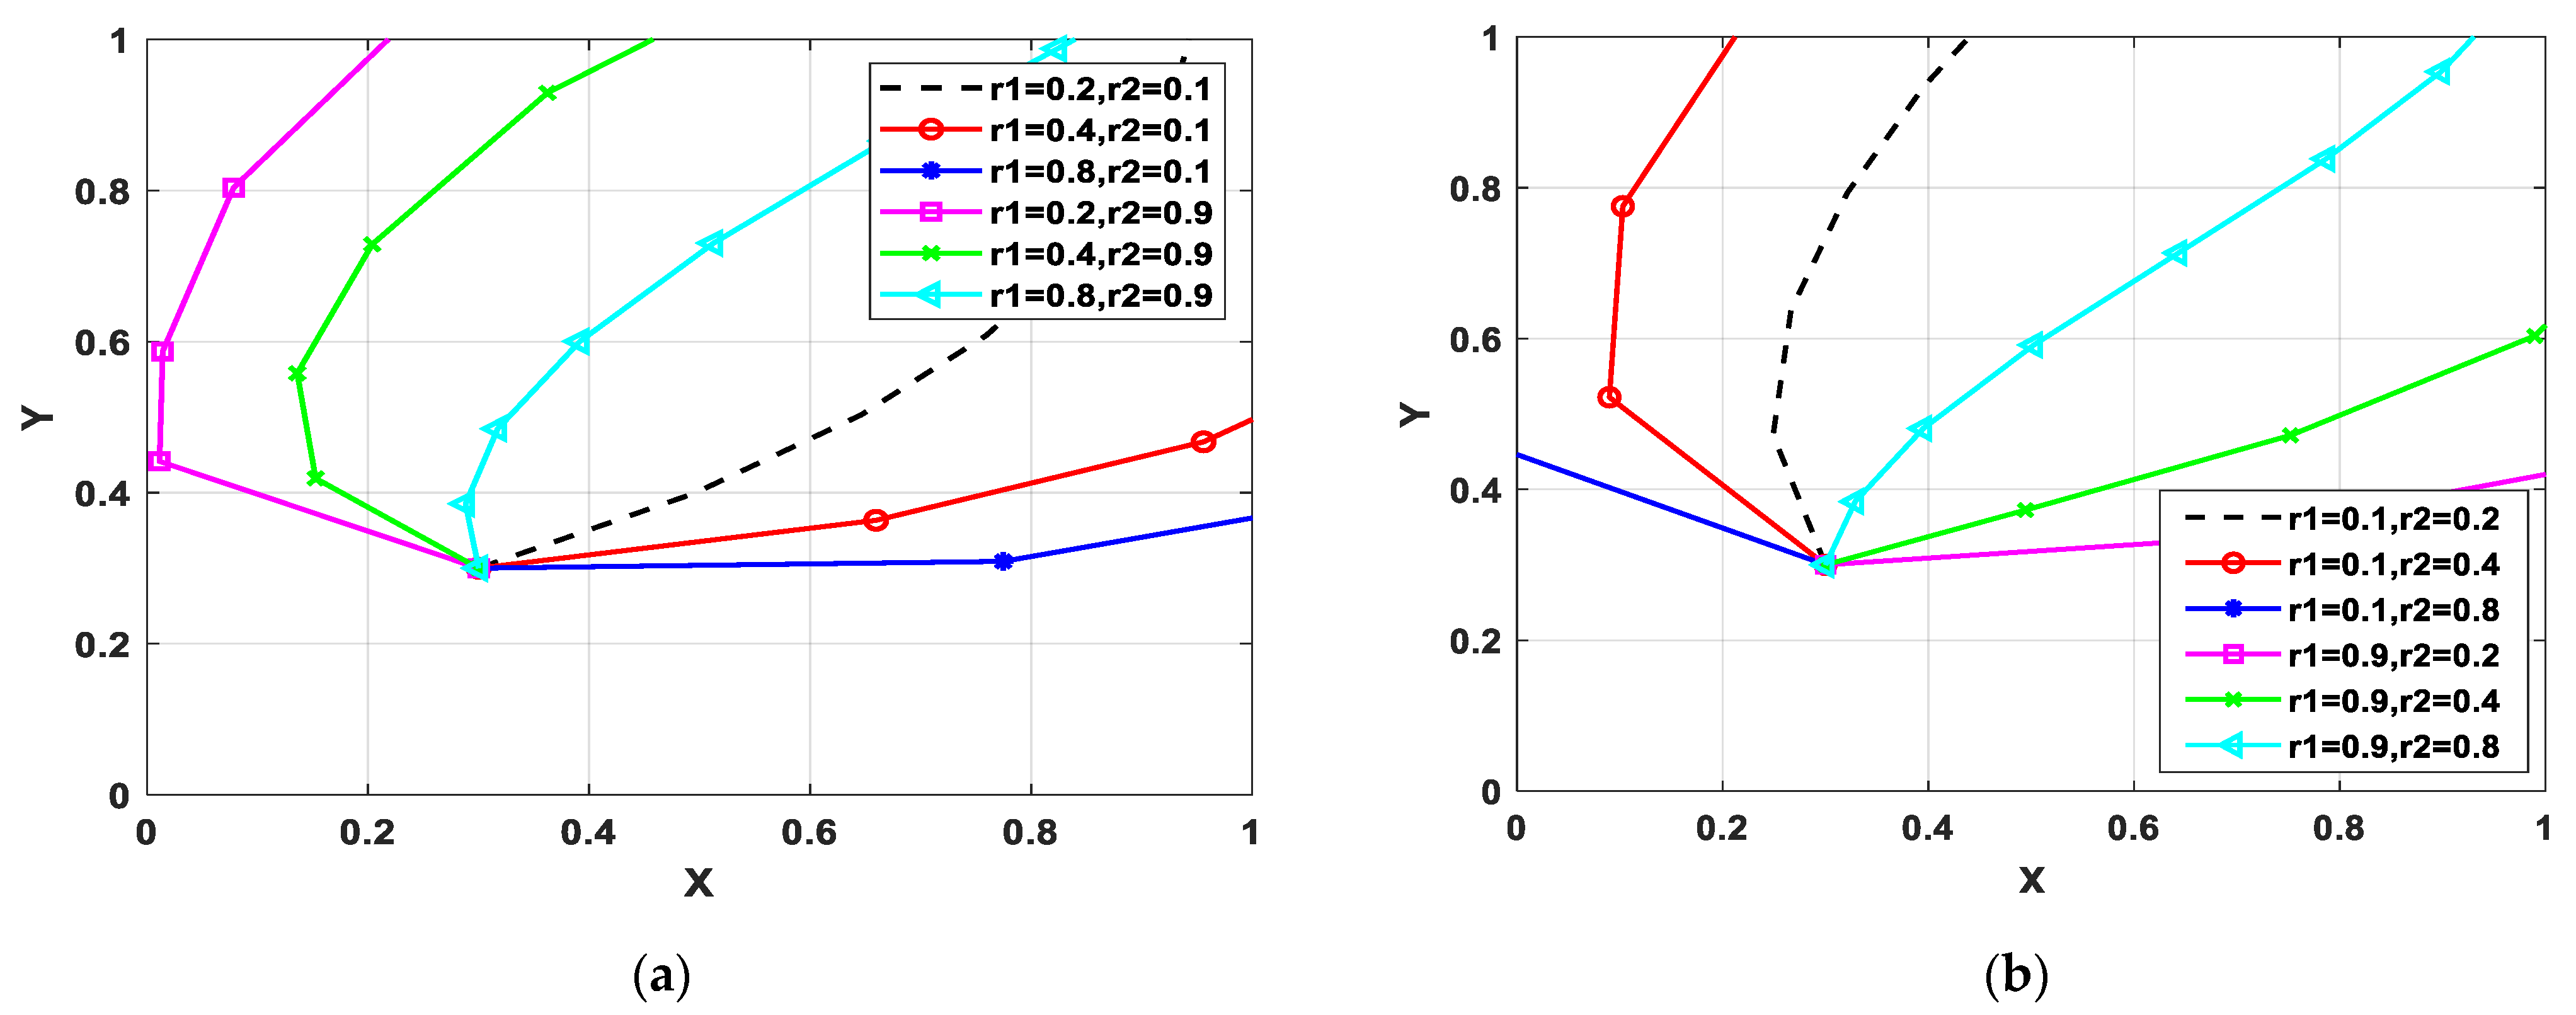
The consumer and the manufacturer may have sentiments at the same time, that is, r1 ≠ 1, r2 ≠ 1. In this section, we discuss the implications of sentiments on the stability of EE.
Proposition 3.
When the consumer and manufacturer both have sentiments (r1 ≠ 1, r2 ≠ 1), the stability of each equilibrium point is obtained as shown in Table 5. When and only when
r 1 r 2 R M 1 R M 2 r 2 R 1 + R 2 1 t 1 C 1 C 2 f r 1 R 1 R 2 1 t 1 C 1 + C 2 + f < r 1 r 2 G   R M 1 R M 2 + F 1 t 2 Δ C , the ESS is   ( 1 , 1 ) .
Because the function of E5(x*, y*) is too complex to explain the proposition briefly, this paper considers it in a numerical simulation. According to the solution of the replication dynamic equation and the Jacobian matrix, (1, 1) is the asymptotically stable point under certain restrictions, (0, 0) and (1, 0) are saddle points, and (0,1) is an unstable point.

3.6.3. Scenario 3: One Party Has a Sentiment

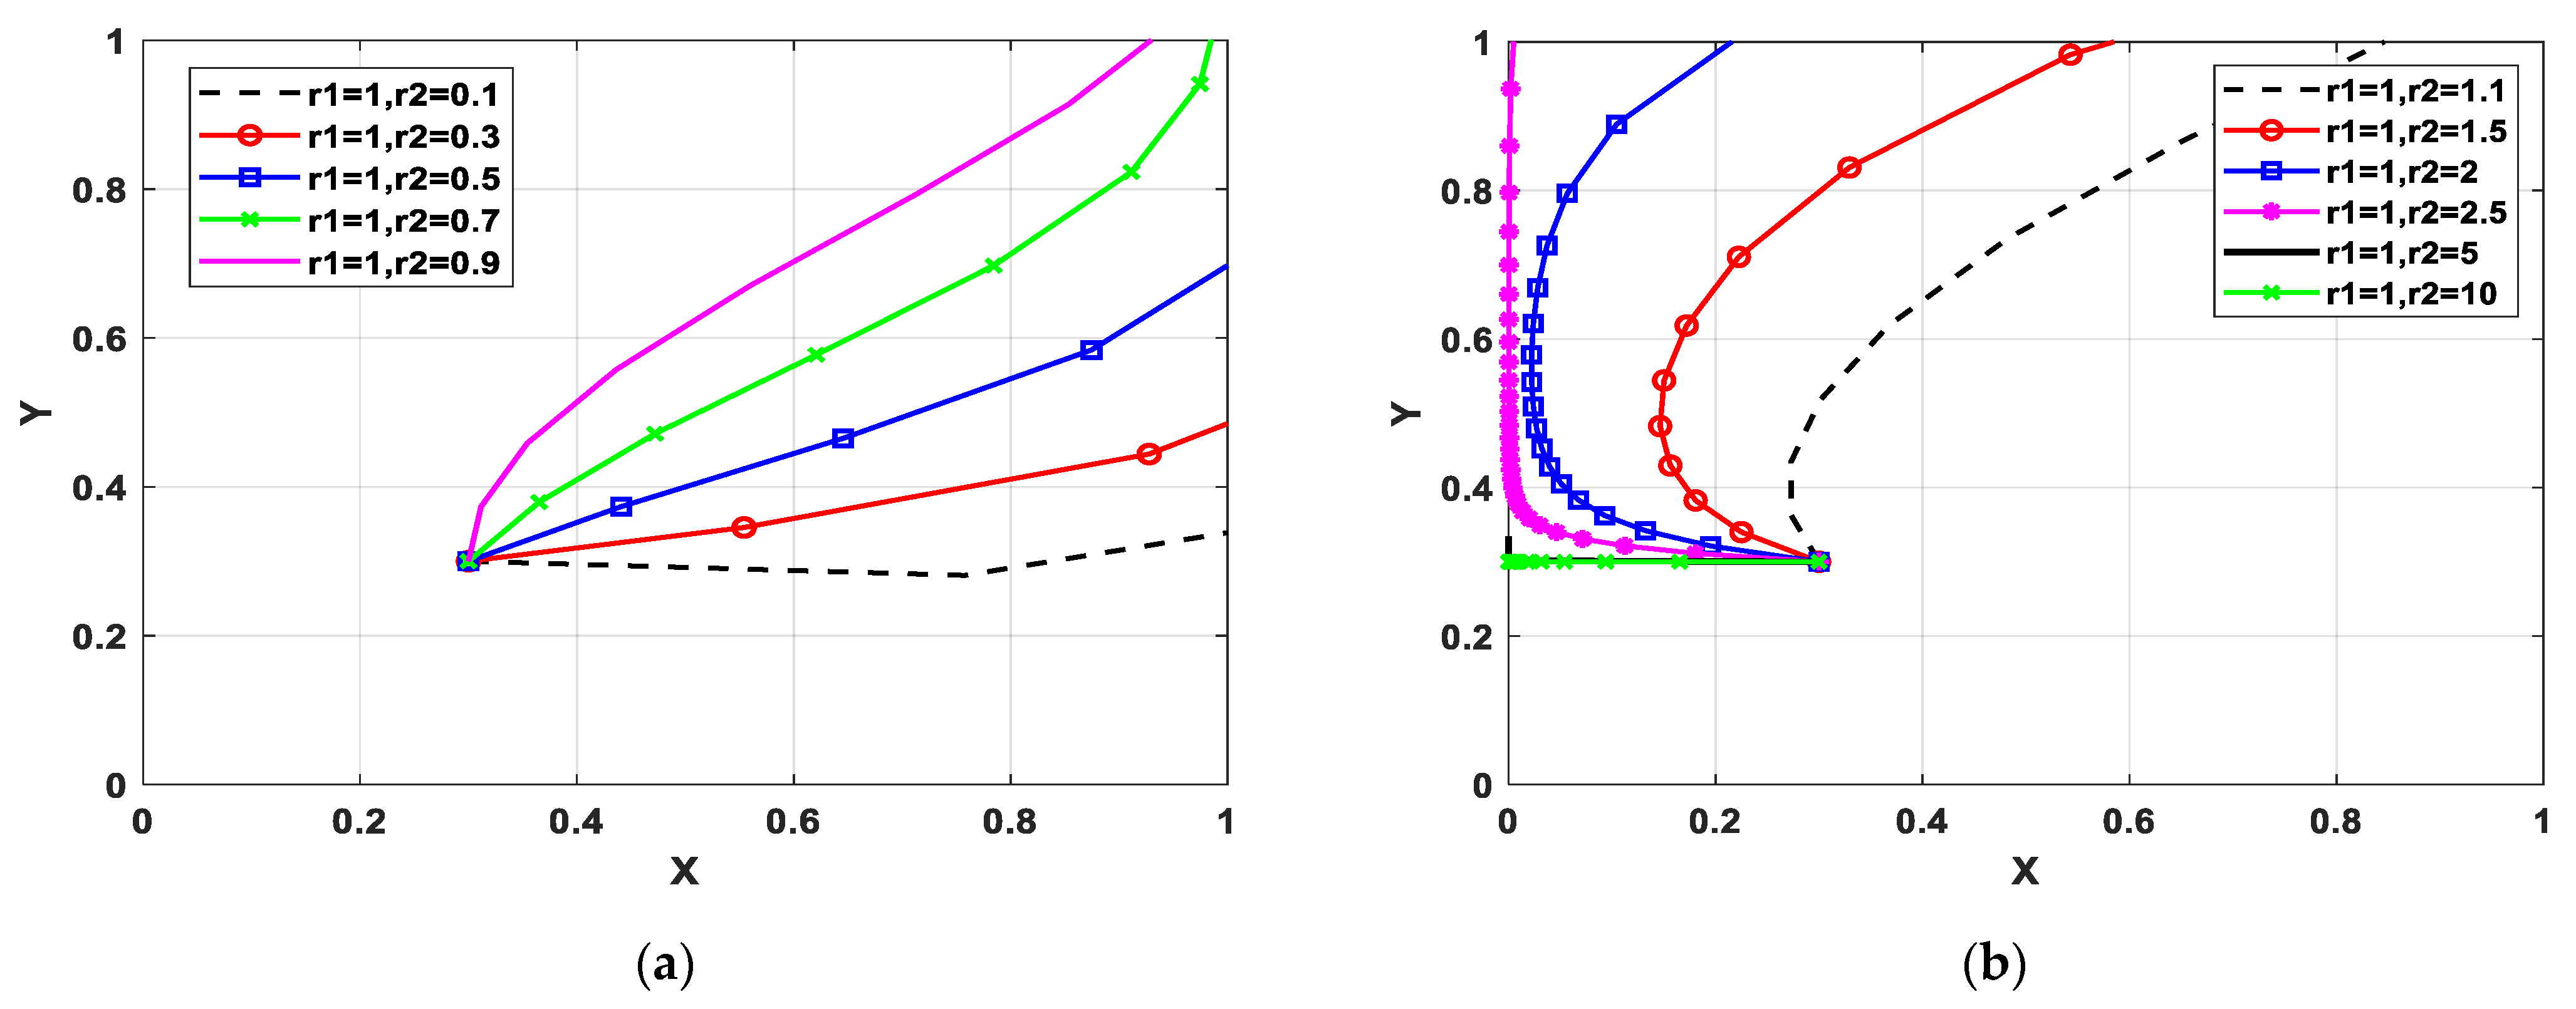
In this scenario, this paper analyzes two situations. One is that the consumer is rational and the manufacturer has a sentiment (r1 = 1, r2 ≠ 1), and the other one is that the consumer has a sentiment and the manufacturer is rational (r1 ≠ 1, r2 = 1).
Proposition 4.
When the consumer has no sentiment and the manufacturer has a sentiment (r1 = 1, r2 ≠ 1), the stability of each equilibrium point is obtained as shown in Table 6. There is no ESS.
When the consumer is rational, and the manufacturer is optimistic or pessimistic, according to the positive and negative determinants and the trace of the Jacobian matrix, there is no stable point in this situation. The game is in trouble, and the final decisions of both sides of the game are traceless and random.
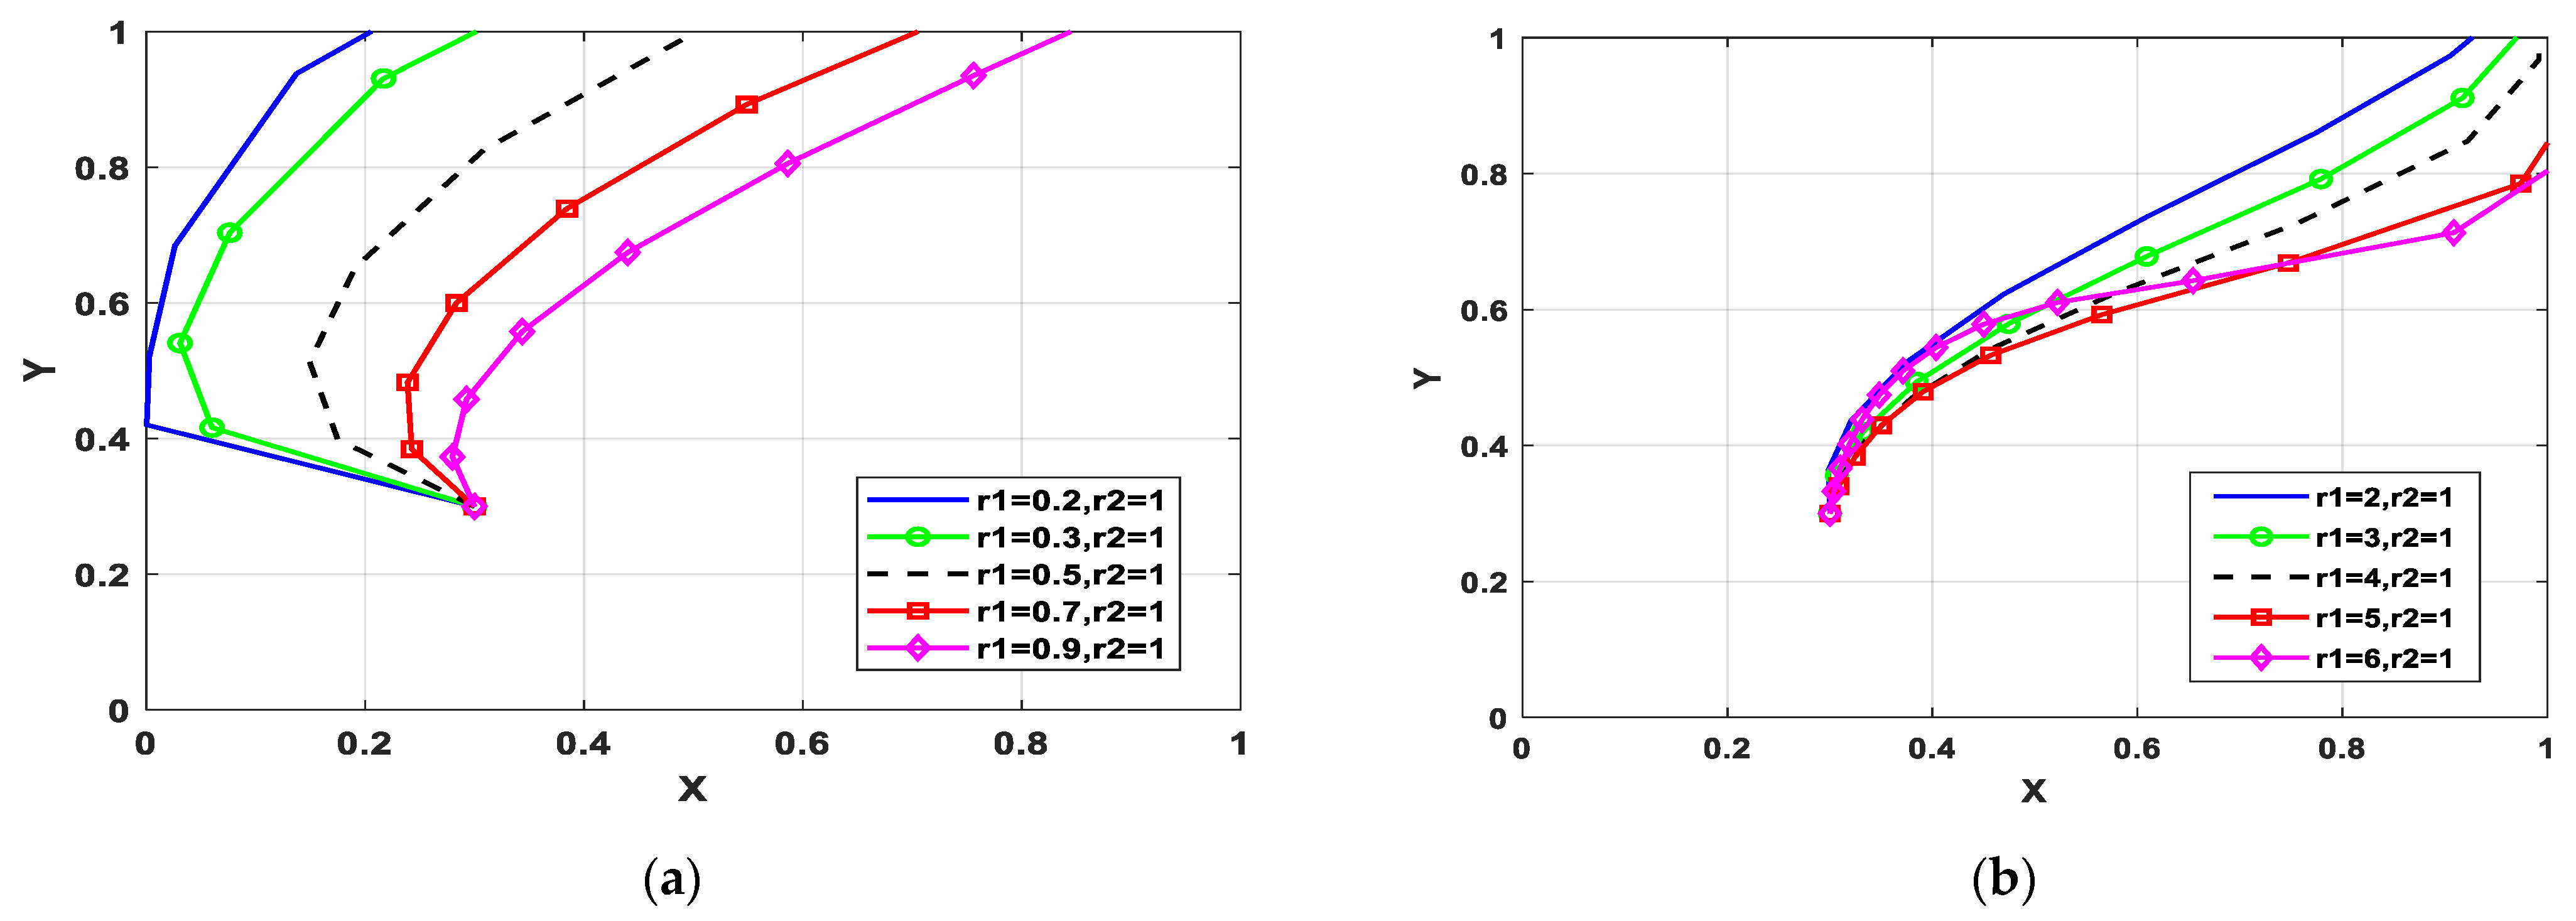
Proposition 5.
When the consumer has a sentiment and the manufacturer has no sentiment (r1 ≠ 1, r2 = 1), the stability of each equilibrium point is obtained as shown in Table 7.
According to the solution of the replicated dynamic equation and the Jacobian matrix, (1,1) is an ESS. It implies that no matter what the consumer’s sentiment is, the consumer and the manufacturer will eventually choose the ESS of (G, T).

4. Numerical Simulation

The calculations presented so far are completely derived. To visually verify the evolutionary stability of this system, MATLAB R2019 is used to simulate the dynamic evolutionary process by assigning a value to each parameter. Different from previous studies, this paper mainly discusses the impact of sentiments on the evolutionary result. Then, this paper explains how sentiments affect the evolution path of the decision-making of the customer and the manufacturer. The relevant parameters are set in Table 8.

4.1. The Consumers and the Manufacturer Both Have No Sentiments

Under the conditions of the above initial setting, Figure 1 shows the evolution of the game when the consumer and manufacturer both have no sentiments. As shown in Figure 1, the final equilibrium point tended to be (1,1). This indicates that the rational consumer will choose the G strategy, and the rational manufacturer will tend to choose the T strategy. However, this result is contrary to the reality that many manufacturers may give up green technology innovation due to the high risk of failure and expensive costs.

4.2. The Consumer and the Manufacturer Both Have Sentiments

4.2.1. The Influence of the Consumer’s Boycott Sentiment on Evolutionary Equilibrium

Figure 2 shows how sentiment affects the participants’ decision-making when the consumer has a boycott sentiment. Figure 2a,b show the evolutionary trace when the consumer has boycott sentiments and the manufacturer has optimism sentiments. It can be seen from Figure 2a that when r2 transforms from 0.9 to 0.1, the probability of green technology innovation decreases. The reason is that the more optimistic the manufacturer is, the more likely they underestimate the risks of green product shortage. Thus, the optimistic manufacturer may not choose a green technology innovation strategy. Figure 2b shows that when r2 = 0.1, and r1 transforms from 2 to 5, the probability of the manufacturer adopting a green technology innovation strategy first increases and then decreases. When the manufacturer has a slightly optimistic sentiment (r2 = 0.6), the deepening of the consumer’s sentiment will create a barrier to green technology innovation because, as the boycott sentiment increases, it is hard to achieve the consumer’s demands. The economic benefits of upgrading technology hardly make up for the increased costs at this point, but the high-optimism manufacturer is willing to make efforts to improve its business reputation through green technology innovation at first. However, when boycott sentiments are high, manufacturers tend to eventually maintain the status quo due to expensive costs.
Figure 2c,d show the evolutionary process when the consumer has a boycott sentiment and the manufacturer is pessimistic. As shown in Figure 2c, there is a threshold—r2* satisfying 2 < r2* < 3—when the manufacturer is in a pessimistic state. When r2 > r2*, with the deepening of the boycott sentiment, the consumer is willing to pay more for green products to improve their utility. The reason is that manufacturers tend to overestimate risk in the whole environment when they have higher pessimism sentiments. They may make green technology innovations. At the same time, the demand for green products may be satisfied so that the consumers will choose to purchase green products. As shown in Figure 2d, when r1 = 2 and the pessimistic intensity of the manufacturer increases, the evolutionary stability strategy changes from (0.39, 1) to (0.02, 0.3). This indicates that the more pessimistic the manufacturer is, the more detrimental it is to the formation of a better result. This means that the highly pessimistic manufacturer is more likely to maintain the status quo, and the consumer will choose to buy ordinary products, which is not conducive to green transformation. Because the manufacturer will overestimate the loss and risk of innovation, they may not be willing to make a green technology innovation.

4.2.2. The Influence of the Consumer’s Support Sentiment on Evolutionary Equilibrium

Figure 3 depicts the impact of sentiment fluctuations on the manufacturer’s green technology innovation decisions when the consumer has a support sentiment. As shown in Figure 3a, when the intensity of the consumer’s support sentiment decreases—that is, r1 transforms from 0.2 to 0.8—the probability of choosing green products increases. At this point, the probability of choosing green technology decreases, and this change becomes greater as the manufacturer’s optimistic sentiment deepens. As the consumer’s support sentiment decreases, they may pay more attention to additional value, especially the green characters of green products. Thus, they are willing to pay more for green products. However, when the manufacturer’s optimism is high, it holds a view that the losses due to maintaining the status quo are smaller than the costs of innovation. Therefore, the manufacturer does not choose the T strategy. Figure 3b illustrates that, as the r2 changes from 0.2 to 0.9, the probability of choosing the G strategy decreases. Meanwhile, the probability of choosing the T strategy decreases when the consumer has a high support sentiment, but it increases under a low sentiment. This may be because the benefits of green innovation cannot make up for losses due to sales decreasing. However, the manufacturer may choose the innovation strategy to improve the unit benefit of the product and total benefits when the demand does not hugely decline.
As shown in Figure 3c, when the consumer’s support deepens, the pessimistic manufacturer will finally choose a green technology innovation strategy. However, at this point, the probability of the consumer purchasing green products decreases significantly. The reason is due to the reality that pessimistic manufacturers overestimate the risk of demand shortage in green production. Thus, as the support sentiment deepens, consumers tend to purchase green products when manufacturers are willing to make green technology innovations. In Figure 3d, if r1 = 0.9, as the degree of the manufacturer’s pessimism increases, the evolutionary stability strategy changes from (0.72,1) to (0,0.59); that is, the probability of the manufacturer choosing the green technology innovation strategy and the probability of the consumer choosing to buy green products both decrease. For the manufacturer, the reason may be that the perception of pleasure brought on by green technology innovation has difficulty offsetting the pain of cost and risk increases.

4.3. The Consumer or the Manufacturer Has a Sentiment

4.3.1. The Influence of the Manufacture’s Sentiment on Evolutionary Equilibrium

Figure 4 illustrates the game evolution path when the consumer is rational and the manufacturer has an optimistic or pessimistic sentiment. As the optimism of the manufacturer increases, the probability of the manufacturer choosing to adopt green technology innovation strategies decreases, but the consumer does not significantly change their green product purchasing strategy because the consumer may rationally assess the values and losses relating to green products and then make a rational decision. The value may include an external environment value, economic value, physical or mental health value, and so on. When the government makes certain appropriate subsidy policies, the perceived value of the green product purchased by rational consumers is higher than the cost. Therefore, the consumer will purchase green products. From the manufacturer’s perspective, it may underestimate the risks caused by the deterioration of market reputation due to the lack of green technology innovation when it has high optimism Additionally, it is obvious that when the manufacturer’s pessimism increases, the probability of the manufacturer making green technology innovations and the consumer buying green products both decrease. This is not beneficial to achieve a good equilibrium state. Because of the manufacturer’s pessimistic strength, it overestimates the risks of innovation failure, sales failure, and so on. Thus, it may choose the NT strategy, and rational consumers may choose the NG strategy to satisfy their basic demands due to insufficient green products. In summary, optimistic or pessimistic manufacturers may have poor risk perception due to sentiment and may make some irrational decisions when the consumer is rational.

4.3.2. The Influence of the Consumer’s Sentiment on Evolutionary Equilibrium

Figure 5 shows the evolution path of the game when the manufacturer is rational and the consumer has a sentiment. In Figure 5a,b, it can be seen whether the consumer has a support or boycott sentiment, the probability of manufacturers choosing green technology innovation increases as consumers tend to be rational. In this scenario, the evolutionary stability strategy of the system is (1, 1). This simulation verifies the rationality of proposition 5; that is, the rational state of the manufacturer is conducive to achieving the manufacturer’s green technology innovation and the consumer’s demand for green products. This may be because the rational manufacturer will accurately evaluate the benefits and costs of green technology innovation. Although the cost of the manufacturer’s green technology innovation is high, it may be beneficial to the improvement of its corporate reputation and realizing corporate social responsibility, which is conducive to the strategic upgrading of manufacturers. Meanwhile, the government may subsidize the manufacturers’ green innovation processes. This leads to the advantages of the manufacturer’s green technology innovation outweighing the disadvantages.

5. Conclusions and Implications

5.1. Conclusions

This paper constructs an RDEU evolutionary game model between the consumer and the manufacturer. Considering the participation of the consumer, the literature [9] finds that consumer supervision will affect manufacturers’ green technology innovation behaviors. However, they neglect the irrational sentiments of participants in this process. Different from relative references, this paper focuses on the influence of different sentiments on manufacturers’ green technology innovations. Combined with a numerical simulation, this study has the following conclusions:
(1)
When both sides of the game do not have sentiments, they are rational in evaluating the costs and value of their behaviors. There will be a stable equilibrium point that implies the manufacturer will choose green technology innovation, and the consumer will choose green products. It is conducive to realizing the goal of the green economy. In reality, the cost for manufacturers to upgrade green technology is too high to make green innovation, which runs counter to rational decision-making.
(2)
When both parties have sentiments, the impact of the sentimental fluctuations of the players on the final behavior strategies is more complex. In the real world, many kinds of environmental regulations, green subsidies, and media channels exist, and manufacturers and consumers will have different sentiments due to these factors. Only when the sentiment state of both parties meets certain limits will there be a satisfying equilibrium strategy combination for the green economy. In particular, when the consumer has a boycott sentiment—since this sentiment strengthens—high-optimism manufacturers may make green technology innovations. Furthermore, as manufacturers’ sentiments deepen, they become irrational and prefer to maintain the status quo. In another scenario, when the consumer has a support sentiment, and this sentiment deepens, the optimistic manufacturer is more likely to create green technology innovation strategies. When the consumer’s support sentiment is high, the escalation of the manufacturers’ optimism will promote their green technology innovation activities and attract more consumers. At this point, the more pessimistic manufacturers are, the more attention is paid to the increase in their costs. Thus, the probability of green technology innovation may decrease.
(3)
When only one party has a sentiment, the rationality of the manufacturer has a greater impact on green technology innovation. Once the manufacturer is rational, no matter what the consumer’s sentiment is, the manufacturer will make green technology innovations and eventually realize the improvement of the green economy.

5.2. Implications

Based on the above conclusions, there are several suggestions for the government to manage the sentiment states of consumers and manufacturers.
(1)
To guide manufacturer sentiments, the government can create an appropriate institutional environment and rationally use its public power because the government can send strict or moderate regulatory signals to manufacturers, mainly by issuing incentive or punishment regulations. Thus, the government can guide manufacturers to change their sentiments, such as “anxiety”, “panic”, “relaxation”, “hope”, and other sentiments, by adjusting regulatory strength. For example, the government can take some measures to improve manufacturer optimism. These measures include building a sound carbon trading market; unblocking the integration mechanism of industries, universities, and research; promoting the construction of industrial clusters; and so on. Moreover, a good manufacturing enterprise green evaluation system and green information disclosure system can also improve the efficiency and transparency of government affairs for the relevant ministries and commissions. Thus, manufacturers can rationally evaluate the gains and losses of green technology innovation.
(2)
The credibility of the government should be fully displayed through all media channels to achieve the guidance of consumer sentiments. Due to the spontaneity of consumer behaviors, it is difficult to directly restrict consumers’ green consumption behaviors through policy regulations. However, many information channels can be used by the regulator to issue different kinds of information. The government can release authoritative data, policies, and regulations through official media channels. It can also release informal news such as certain manufacturers’ green transformations or pollution discharge rates through microblogs, TikTok, and other online social platforms. The news can also send a signal affecting consumers’ boycott or support sentiments. For example, the government can promote consumer boycott sentiments by releasing environmental degradation news. Furthermore, environmental protection education is also essential to improving the rational decision-making ability of the public.
(3)
To reduce the risk of a mismatch between demand and supply, it is essential to dredge communication channels between the buyer and the producer. This mismatch can strengthen the intensity of sentiments and distort the green economy circulation. Thus, the government can build a comprehensive information disclosure platform and interaction forum among the public, enterprises, and itself based on big data, cloud computing, and other new technologies. This is conducive to truly and objectively showing the demand for green products, the green production of manufacturers, and other information. Eventually, a virtuous circle of green product purchasing and production can be built.
Combining the RDEU theory and the evolutionary game model, this paper enriches the research on the green technology innovation strategies of manufacturers and explores the effects of sentiments on the decision-making of manufacturers and consumers. However, there are also some limitations. As market competition intensifies, green behavior—especially the green technology innovation of manufacturing enterprises—is not only affected by consumers and the government but also affected by the sentimental fluctuations and green activities of other competitors. Therefore, there is still a problem worthy of in-depth discussion, that is, how sentiments have a dynamic impact on the strategic interactions of multiple agents in the process of green technology innovation. In future research, a more complex evolutionary game considering different sentimental states should be explored to make the research conclusions more accurate.

Author Contributions

Conceptualization, H.G. and L.D.; methodology, M.L.; software, M.L.; validation, M.L.; formal analysis, investigation, and resources, M.L.; data curation, H.G.; writing—original draft preparation, L.D. and M.L.; writing—review and editing, M.L. and L.D.; visualization, M.L.; supervision, H.G. and L.D. All authors have read and agreed to the published version of the manuscript.

Funding

This research was financially supported by the National Natural Science Foundation of China (grant No. 71973132).

Institutional Review Board Statement

Not applicable.

Informed Consent Statement

Not applicable.

Data Availability Statement

Not applicable.

Acknowledgments

The authors sincerely thank the editors and reviewers for their valuable comments and suggestions to help improve and enhance the quality of our manuscript.

Conflicts of Interest

The authors declare no conflict of interest.

References

  1. Yang, P.; Peng, S.; Benani, N.; Dong, L.; Li, X.; Liu, R.; Mao, G. An integrated evaluation on China’s provincial carbon peak and carbon neutrality. J. Clean. Prod. 2022, 134497. [Google Scholar] [CrossRef]
  2. Liu, L.; Peng, Q. Evolutionary game analysis of enterprise green innovation and green financing in platform supply chain. Sustainability 2022, 14, 7807. [Google Scholar] [CrossRef]
  3. Xia, J.; Niu, W. Carbon-reducing contract design for a supply chain with environmental responsibility under asymmetric information. Omega 2021, 102, 102390. [Google Scholar] [CrossRef]
  4. Saberi, S.; Cruz, J.M.; Sarkis, J.; Nagurney, A. A competitive multiperiod supply chain network model with freight carriers and green technology investment option. Eur. J. Oper. Res. 2018, 266, 934–949. [Google Scholar] [CrossRef]
  5. Brosch, T. Affect and emotions as drivers of climate change perception and action: A review. Curr. Opin. Behav. Sci. 2021, 42, 15–21. [Google Scholar] [CrossRef]
  6. Bai, S.; Wang, Y. Green investment decision and coordination in a retailer-dominated supply chain considering risk aversion. Sustainability 2022, 14, 13606. [Google Scholar] [CrossRef]
  7. Guo, Y.; Xia, X.; Zhang, S.; Zhang, D. Environmental regulation, government R&D funding and green technology innovation: Evidence from China provincial data. Sustainability 2018, 10, 940. [Google Scholar]
  8. Zhao, X.; Bai, X. How to motivate the producers’ green innovation in WEEE recycling in China?—An analysis based on evolutionary game theory. Waste Manag. 2021, 122, 26–35. [Google Scholar] [CrossRef]
  9. Zhou, X.; Jia, M.; Wang, L.; Sharma, G.D.; Zhao, X.; Ma, X. Modelling and simulation of a four-group evolutionary game model for green innovation stakeholders: Contextual evidence in lens of sustainable development. Renew. Energy 2022, 197, 500–517. [Google Scholar] [CrossRef]
  10. Sim, J.; Kim, B. Regulatory versus consumer pressure and retailer responsibility for upstream pollution in a supply chain. Omega 2021, 101, 102250. [Google Scholar] [CrossRef]
  11. Hong, Z.; Guo, X. Green product supply chain contracts considering environmental responsibilities. Omega 2019, 83, 155–166. [Google Scholar] [CrossRef]
  12. Zhang, X.; Yousaf, H.M.A.U. Green supply chain coordination considering government intervention, green investment, and customer green preferences in the petroleum industry. J. Clean. Prod. 2019, 246, 118984. [Google Scholar] [CrossRef]
  13. Wang, M.; Li, Y.; Cheng, Z.; Zhong, C.; Ma, W. Evolution and equilibrium of a green technological innovation system: Simulation of a tripartite game model. J. Clean. Prod. 2021, 278, 123944. [Google Scholar] [CrossRef]
  14. Lv, H.; Li, D. Impacts of heterogeneous green consumers on green innovation in electric vehicle and charging pile firms. Sustain. Prod. Consump. 2021, 28, 1216–1231. [Google Scholar] [CrossRef]
  15. Akhtar, R.; Sultana, S.; Masud, M.M.; Nusrat, J.; Abdullah, A. Consumers’ environmental ethics, willingness, and green consumerism between lower and higher income groups. Resour. Conserv. Recycl. 2021, 168, 105274. [Google Scholar] [CrossRef]
  16. Costa, C.S.R.; da Costa, M.F.; Maciel, R.G.; Aguiar, E.C.; Wanderley, L.O. Consumer antecedents towards green product purchase intentions. J. Clean. Prod. 2021, 313, 127964. [Google Scholar] [CrossRef]
  17. Chen, C.C.; Chen, C.W.; Tung, Y.C. Exploring the consumer behavior of intention to purchase green products in belt and road countries: An empirical analysis. Sustainability 2018, 10, 854. [Google Scholar] [CrossRef] [Green Version]
  18. Ji, J.; Zhang, Z.; Yang, L. Comparisons of initial carbon allowance allocation rules in an O2O retail supply chain with the cap-and-trade regulation. Int. J. Prod. Econ. 2017, 187, 68–84. [Google Scholar] [CrossRef]
  19. Dou, G.; Choi, T.M. Does implementing trade-in and green technology together benefit the environment? Eur. J. Oper. Res. 2021, 295, 517–533. [Google Scholar] [CrossRef]
  20. Yao, F.; Parilina, E.; Zaccour, G.; Gao, H. Accounting for consumers’ environmental concern in supply chain contracts. Eur. J. Oper. Res. 2022, 301, 987–1006. [Google Scholar] [CrossRef]
  21. Liu, Z.L.; Anderson, T.D.; Cruz, J.M. Consumer environmental awareness and competition in two-stage supply chains. Eur. J. Oper. Res. 2012, 218, 602–613. [Google Scholar] [CrossRef]
  22. He, P.; Wang, Z.; Shi, V.; Liao, Y. The direct and cross effects in a supply chain with consumers sensitive to both carbon emissions and delivery time. Eur. J. Oper. Res. 2021, 292, 172–183. [Google Scholar] [CrossRef]
  23. Zhao, H.H.; Gao, Q.; Wu, Y.P.; Wang, Y.; Zhu, X.D. What affects green consumer behavior in China? A case study from Qingdao. J. Clean. Prod. 2014, 63, 143–151. [Google Scholar] [CrossRef]
  24. Zaremohzzabieh, Z.; Ismail, N.; Ahrari, S.; Samah, A.A. The effects of consumer attitude on green purchase intention: A meta-analytic path analysis. J. Bus. Res. 2021, 132, 732–743. [Google Scholar] [CrossRef]
  25. Zhou, Y.; Xiong, Y.; Jin, M. Less is more: Consumer education in a closed-loop supply chain with remanufacturing. Omega 2021, 101, 102259. [Google Scholar] [CrossRef]
  26. Aagerup, U.; Nilsson, J. Green consumer behavior: Being good or seeming good? J. Prod. Brand Manag. 2016, 25, 274–284. [Google Scholar] [CrossRef]
  27. Zhang, W.; He, Y. Optimal policies for new and green remanufactured short-life-cycle products considering consumer behavior. J. Clean. Prod. 2019, 214, 483–505. [Google Scholar] [CrossRef]
  28. Shao, J.; Ünal, E. What do consumers value more in green purchasing? Assessing the sustainability practices from demand side of business. J. Clean. Prod. 2019, 209, 1473–1483. [Google Scholar] [CrossRef]
  29. Jin, M.; Zhang, X.; Xiong, Y.; Zhou, Y. Implications of green optimism upon sustainable supply chain management. Eur. J. Oper. Res. 2021, 295, 131–139. [Google Scholar] [CrossRef]
  30. Chen, W.; Wang, J.W.; Yu, F.Y.; He, J.L.; Xu, W.S.; Wang, R. Effects of emotion on the evolution of cooperation in a spatial prisoner’s dilemma game. Appl. Math. Comput. 2021, 411, 126497. [Google Scholar] [CrossRef]
  31. Ni, S.; Zou, S.; Chen, J. Evolutionary game model of Internal threats to nuclear security in spent fuel reprocessing plants based on RDEU Theory. Sustainability 2022, 14, 2163. [Google Scholar] [CrossRef]
  32. Xiong, G.Q.; Zhang, Y. Influence of psychological and emotional factors on the RDEU game model of urban demolition and system’s brittleness analysis. Oper. Res. Manage. Sci. 2019, 28, 99. [Google Scholar]
  33. Hong, K.; Zou, Y.; Zhang, Y.; Duan, K. The weapon of the weak: An analysis of RDEU game in the conflict of farmland expropriation under the influence of emotion. Sustainability 2020, 12, 3367. [Google Scholar] [CrossRef] [Green Version]
  34. Liu, J.; Lyu, Y.; Zhao, H.; Chen, J. Game analysis of nuclear wastewater discharge under different attitudes: Seeking a potential equilibrium solution. Sci. Total. Environ. 2021, 801, 149762. [Google Scholar] [CrossRef] [PubMed]
  35. Xin, X.; Liu, M.; Wang, X.; Zhang, T.; Gao, L.; Chen, K. Evolutionary analysis of Japan’s nuclear wastewater discharge events considering the impact of participants’ emotions. Ocean. Coast. Manag. 2022, 225, 106231. [Google Scholar] [CrossRef]
  36. Xu, H.; Zhang, Y.; Tan, D.Q. Evolutionary equilibrium analysis of the influence of participants’ emotions on environmental NIMBY conflict. Soft Sci. 2019, 3, 121–126. [Google Scholar]
  37. Li, W.; Huang, S.; Qi, Y.; An, H. RDEU hawk-dove game analysis of the China-Australia iron ore trade conflict. Resources Policy 2022, 77, 102643. [Google Scholar] [CrossRef]
  38. Zhang, Z.; Wang, X.; Su, C.; Sun, L. Evolutionary game analysis of shared manufacturing quality innovation synergetic behavior considering a subject’s heterogeneous emotions. Processes 2022, 10, 1233. [Google Scholar] [CrossRef]
  39. Wang, X.; Guo, Z.; Zhang, Z.; Li, B.; Su, C.; Sun, L.; Wang, S. Game analysis of the evolution of energy structure transition considering low-carbon sentiment of the decision-makers in the context of carbon neutrality. Processes 2022, 10, 1650. [Google Scholar] [CrossRef]
  40. Quiggin, J. A theory of anticipated utility. J. Econ. Behav. Organ. 1982, 3, 323–343. [Google Scholar] [CrossRef]
  41. Fan, R.; Wang, Y.; Chen, F.; Du, K.; Wang, Y. How do government policies affect the diffusion of green innovation among peer enterprises? -An evolutionary-game model in complex networks. J. Clean. Prod. 2022, 364, 132711. [Google Scholar] [CrossRef]
  42. Friedman, D. Evolutionary games in economics. Econometrica 1991, 59, 637–666. [Google Scholar] [CrossRef]
Figure 1. The evolution track of the game when both parties have no sentiments.
Sustainability 15 00706 g001
Figure 2. The evolution path of the system when the consumer has a boycott sentiment: (a) The consumer’s boycott deepens and the manufacturer’s optimism stabilizes. (b) The consumer’s boycott stabilizes and the manufacturer’s optimism deepens. (c) The consumer’s boycott deepens and the manufacturer’s pessimism stabilizes. (d) The consumer’s boycott stabilizes and the manufacturer’s optimism deepens.
Sustainability 15 00706 g002
Figure 3. The evolution path of the system when the consumer has a support sentiment: (a) The consumer’s support deepens and the manufacturer’s optimism stabilizes. (b) The consumer’s support stabilizes and the manufacturer’s optimism deepens. (c) The consumer’s support deepens and the manufacturer’s pessimism stabilizes. (d) The consumer’s support stabilizes and the manufacturer’s optimism deepens.
Sustainability 15 00706 g003aSustainability 15 00706 g003b
Figure 4. Evolutionary game path when the consumer has no sentiment and the manufacturer has the (a) optimistic sentiment or (b) pessimistic sentiment.
Sustainability 15 00706 g004
Figure 5. Evolutionary game path when the manufacturer has no sentiment and the consumer has the (a) support sentiment or (b) boycott sentiment.
Sustainability 15 00706 g005
Table 1. Payoff matrix for the consumer and manufacturer.
Manufacturer
TNT
ConsumerGR1 (1 − t1) C1, RM1 − C-(1 − t2) ΔC+FR2− C2− f, RM2− C − g
NGR2− C2− ρ1, RM2− C-(1 − t2) ΔC+FR2− C2− ρ2, RM2− C
Table 2. The utility, probability distribution, rank, and decision weight of the consumer.
UtilityProbabilityRankDecision Weight
R1 (1 − t1) C1xy1w1(xy)
R2− C2ρ1(1 − x)y1 − xyw1(y) − w1(xy)
R2− C2ρ2(1 − x)(1 − y)1 − yw1(1 − x + xy) − w1(y)
R2− C2− fx(1 − y)x − xy1 − w1(1 − x + xy)
Table 3. The utility, probability distribution, rank, and decision weight of the manufacturer.
UtilityProbabilityRankDecision Weight
RM1− C − (1 − t2C + Fxy1w2(xy)
RM2− C(1 − x)(1 − y)1 − xyw2(1 − xy + 2xy) − w2(xy)
RM2− C − (1 − t2C + F(1 − x)yX + y − 2xyw2(1 − x + xy) − w2(1 − xy + 2xy)
RM2− C − gx(1 − y)x − xy1 − w2(1 − x + xy)
Table 4. The stability of evolutionary equilibrium points when r1 = r2 = 1.
EEDet(J)tr(J)Stability
E1(1,1)+ESS
E2(1,0)NNUnsteady
E3(0,1)++Unsteady
E4(0,0)NUnsteady
E5(x*, y*)NNUnsteady
Note: “−” denotes negative; “+” denotes positive; “N” denotes uncertainty.
Table 5. The stability of evolutionary equilibrium points when r1 ≠ 1, r2 ≠ 1.
EEDet(J)tr(J)Stability
E1(1,1)NUnsteady /ESS
E2(1,0)00Saddle point
E3(0,1)0+Unsteady
E4(0,0)00Saddle point
Note: “−” denotes negative; “+” denotes positive; “N” denotes uncertainty.
Table 6. The stability of evolutionary equilibrium points when r1 = 1, r2 ≠ 1.
EEDet(J)tr(J)Stability
E1(1,1)NNUnsteady
E2(1,0)0Unsteady
E3(0,1)++Unsteady
E4(0,0)0Unsteady
Note: “−” denotes negative; “+” denotes positive; “N” denotes uncertainty.
Table 7. The stability of evolutionary equilibrium points when r1 ≠ 1, r2 = 1.
EEDet(J)tr(J)Stability
E1(1,1)+ESS
E2(1,0)NUnsteady
E3(0,1)0+Unsteady
E4(0,0)0+Unsteady
Note: “−” denotes negative; “+” denotes positive; “N” denotes uncertainty.
Table 8. Parameter setting.
R1R2RM1/C1RM1/C1ρ1ρ1fgΔCFCt1/t2
20012010060203040104020200.6
Disclaimer/Publisher’s Note: The statements, opinions and data contained in all publications are solely those of the individual author(s) and contributor(s) and not of MDPI and/or the editor(s). MDPI and/or the editor(s) disclaim responsibility for any injury to people or property resulting from any ideas, methods, instructions or products referred to in the content.

