Article

Production of Syrups from Corinthian Currant Industrial Finishing Side-Stream: Quality Evaluation and Volatilome

1
Department of Chemistry, University of Patras, 26504 Patras, Greece
2
Department of Food Science and Human Nutrition, Agricultural University of Athens, 75 Iera Odos, 11855 Athens, Greece
3
Department of Agricultural Development, AgroFood, and Natural Resources Management, School of Agricultural Development, Nutrition & Sustainability, National and Kapodistrian University of Athens, 34400 Psachna, Greece
*
Author to whom correspondence should be addressed.
Sustainability 2023, 15(1), 495; https://doi.org/10.3390/su15010495
Submission received: 4 November 2022 / Revised: 21 December 2022 / Accepted: 23 December 2022 / Published: 28 December 2022
(This article belongs to the Special Issue A Sustainable Approach in Food Science and Technology Aspects)

Abstract

:
The industrial finishing side-stream (FSS) of premium-quality Corinthian currants was used to produce syrups with/without pigment- and tartrate-reduction treatments. The chemical composition, total titratable acidity (TTA; % w/w as tartaric acid), volatile acidity (VA; % w/w as acetic acid), total phenolic content (TPC; as gallic acid, GA), antioxidant capacity (AC; as ascorbic acid, AA), volatilome (SPME GC-MS), sensory properties, and microbial stability were compared. All syrups had similar average sugar content (65.4–69.4% w/w), and no sucrose. Those not treated for tartrate reduction were more acidic (pH ~4.5) than those treated (pH > 5.6), while all syrups had higher pH than similar commercial products (3.0–4.5). On the other hand, the FSS syrups had similar TTA (<1.2 ± 0.3%) despite the applied treatment, and had low VA (0.08–0.27%). The blonde syrups had a lower average TPC (134–143 mg GA/100 g) and AC (0.90–1.0 mg AA/100 g) than the brown syrups (185–213 and 0.3–0.6, respectively), due to the removal of phenolics in the clarification treatments. Totally 144 headspace aroma volatiles were identified, deriving either from the grapes or the raisin-drying process. HMF was not detected. The sensory, microbiological, and VA analyses indicated that FSS can be used to produce high-quality, preservable, and added-value syrups.

1. Introduction

Syrup refers to any viscous liquid consisting of a concentrated sugar solution with/without the addition of flavorings. The global syrup market (chocolate, maple, fruit, malt, corn, rice, tapioca, honey, flavored, and other types of syrups) records billion-dollar revenues with increased compound annual growth rates, despite the uncertainties caused by the COVID-19 outbreak [1,2]. The increasing demand for syrups is due to their numerous applications as sweeteners, taste enhancers, and flavoring agents in processed food production (beverages, bakery products, desserts, confectioneries, etc.), as well as due to increasing globalization rates, rising incomes, and adoption of urban lifestyles. However, increased consumer awareness and demands towards healthier processed foods has also increased scientific and industrial interest in the development of low-calorie, low-glycemic index, and additive-free syrups and sweeteners [2]. Other recent research trends related to the production of syrups include optimization of production conditions to minimize the energy requirements [3], use of enzyme immobilization techniques (glucose isomerase, β-galactosidase, etc.) for continuous syrup production, development of combined enzyme methods for single-step carbohydrate hydrolysis and isomerization [4,5], development of waste biomass pretreatment and hydrolysis methods [6], genetic engineering for the production of efficient low-cost enzymes related to syrup production [7], etc.
Grape syrups are an important category within the global syrup market. Grape syrup is produced either by concentration (boiling) of fresh grape must (grape juice concentrates, such as petimezi in Greece, pekmez in Turkey, etc.) or by concentration of raisin extracts (raisin syrups, such as stafidini in Greece). According to the Greek Food and Drinks Code (art. 66) [8], raisin syrup is the product obtained by concentrating an aqueous raisin extract after removing most of its acid (tartrate) content. Pigment removal and addition of flavorings is allowed as long as it is stated on the product label. The presence of sulfite, which is a common antioxidant and preservative, should not exceed 40 mg/kg in the final product [8]. Raisin syrup is a natural sweetener with a high energy value, and due to its high content of reducing sugars (70–71% w/w, half of which is fructose), trace elements (K, Na, P, Mg, Cu), and vitamins (C, B3, A), its addition to food meets the requirements of consumers for healthier foods. It can also be used as a natural brown food coloring, while providing a typical fruity aroma [9].
The available scientific literature on the production of raisin syrups is scarce. In Greece, raisin syrup is usually produced from the industrial finishing side-stream (FSS) of raisins (mainly Corinthian currants), which until recently was mainly supplied to the vinegar production sector [10,11,12]. In this study, the production and quality evaluation, including volatilome, total phenolic content (TPC), and antioxidant capacity (AC), of brown and blonde syrups made from the FSS generated from premium-quality Corinthian currants Vostitsa (Protected Designation of Origin, PDO), grown exclusively in the area of Aeghion in western Greece [11], is presented. These currants have been extensively studied for their nutritional value, and the published works have highlighted their rich composition in antioxidant phenolics, other bioactive components, and micronutrients [12], as well as their potential health benefits, including in Alzheimer’s disease [13], atherosclerosis [14], athlete endurance, performance, and blood redox status [15], cancer, diabetes [16], etc.
As recently reported [10,12], a currant processing company produces FSS that accounts for 5–6% of the raw material, additionally to that generated during harvesting in the field. FSS differs from the marketable currants in the size of the raisin berries and the presence of seeds and other plant material (e.g., stems), and has a high nutritional value, rich volatilome, and increased AC compared to the raw material. The exploitation of FSS for added-value products such as syrups is essential for the sustainability of Corinthian currant production, which is gradually being abandoned by farmers due to the expensive and laborious cultivation practices and the absence of governmental subsidies [10,12]. Other products from FSS that have been recently proposed (wines, distilled liqueurs, specialty vinegars, microbial metabolites, etc.) [10,12,17] can also create significant added value for the raisin-processing sector. Also, since raisins are typical components of the Mediterranean diet, this study also aims to contribute to the promotion of and adherence to such dietary patterns, which in combination with sustainable growth of commodities such as the Corinthian currants, will positively affect local biodiversity, agricultural communities, processing companies, and the national, regional, and local economies.
Therefore, in this study, methods for brown and blonde syrup production from FSS extracts of the premium-quality Vostitsa PDO currants, with and without tartrate reduction and depigmentation treatments, are for the first time proposed and compared. No extra sugars or additives were added, except sulfite in the extracts before condensation to avoid spoilage. The condensation was carried out at low temperature (45 °C) under vacuum to avoid nutritional and sensory degradation. The proximate composition, total titratable acidity (TTA), volatile acidity (VA), TPC, AC, volatilome, microbial stability during storage, and sensory properties of the syrups were evaluated and compared.

2. Materials and Methods

2.1. Chemicals

The chemicals used in this study for the treatment of syrups (tartrate reduction, clarification, depigmentation, sulfite addition, and subsequent oxidation) and the analytical methods used (acidity, sugars, protein, TPC, AC, volatiles, microbial counts), were: NaOH (Lach-Ner, Neratovice, Czech Repulic); Na2CO3 (Penta, Prague, Czech Republic); CaCO3 (Chemco, Athens, Greece); Ringer tablets, methyl orange, 2-propanol, NaHSO3, dioxane, acetonitrile, and ΚOH (Merck, Darmstadt, Germany); standard 0.1 M NaOH and HCl solutions, (NH4)2SO4, CuSO4·5H2O, phenolphthalein, and fructose (Chem-Lab, Zedelgem, Belgium); glucose, methanol, K4[Fe(CN)6]·3H2O, and ZnSO4·7H2O (Fisher Scientific, Loughborough, UK); saccharose (Chembiotin, Athens, Greece); 2,2-Diphenyl-1-picrylhydrazyl radical (DPPH) (Duchefa Biochemie, Haarlem, The Netherlands); K2SO4, H2SO4, and gallic acid (Sigma-Aldrich, St. Louis, MO, USA); H2O2 30% and iodine solution (Carlo-Erba, Val de Reuil, France); Folin–Ciocalteau reagent (Scharlab S.L., Barcelona, Spain); ascorbic acid, Plate Count Agar (PCA), Violet Red Bile Glucose Agar (VRBGA) (Fluka BioChemika, Buchs, Switzerland); Potato Dextrose Agar (PDA) (Condalab, Madrid, Spain); starch (Riedel-de Haën, Seelze, Germany); C8-C24 n-alkanes (Niles, IL, USA); K2S2O5, bentonite, and activated carbon (Syndesmos S.A., Athens, Greece).

2.2. FSS Extract Production

The FSS was obtained from the Agricultural Cooperatives’ Union of Aeghion S.A. (201 Korinthou Str., Aeghion, Greece). It was used for syrup production after extraction by maceration with hot water (70 °C), to which potassium metabisulfite (K2S2O5) was added at an amount suitable to yield 1.2 g SO2/L of extract, to prevent spontaneous fermentation and microbial spoilage, as is a common industrial practice. The extraction was followed by removal of the solid residues (grape skins, seeds, etc.) from the extract by cloth filtration and centrifugation at 5000 rpm for 10 min (Sigma 3K12, Βioblock Scientific, Sigma Larborzentrifugen GmbH, Osterode, Germany). The received FSS extract had a Baumé hydrometer density of about 15 °Be (255.5 ± 2.7 g/L total sugar content), and was used for the production of the various types of syrups, with and without activated carbon treatment to remove pigments (blonde and brown syrups, respectively), and with/without treatment to reduce tartrate (Figure 1). Before condensation, 30% H2O2 was added stoichiometrically in order to reduce the excess sulfite in the FSS extract to a residual concentration of less than 40 mg/L [8].

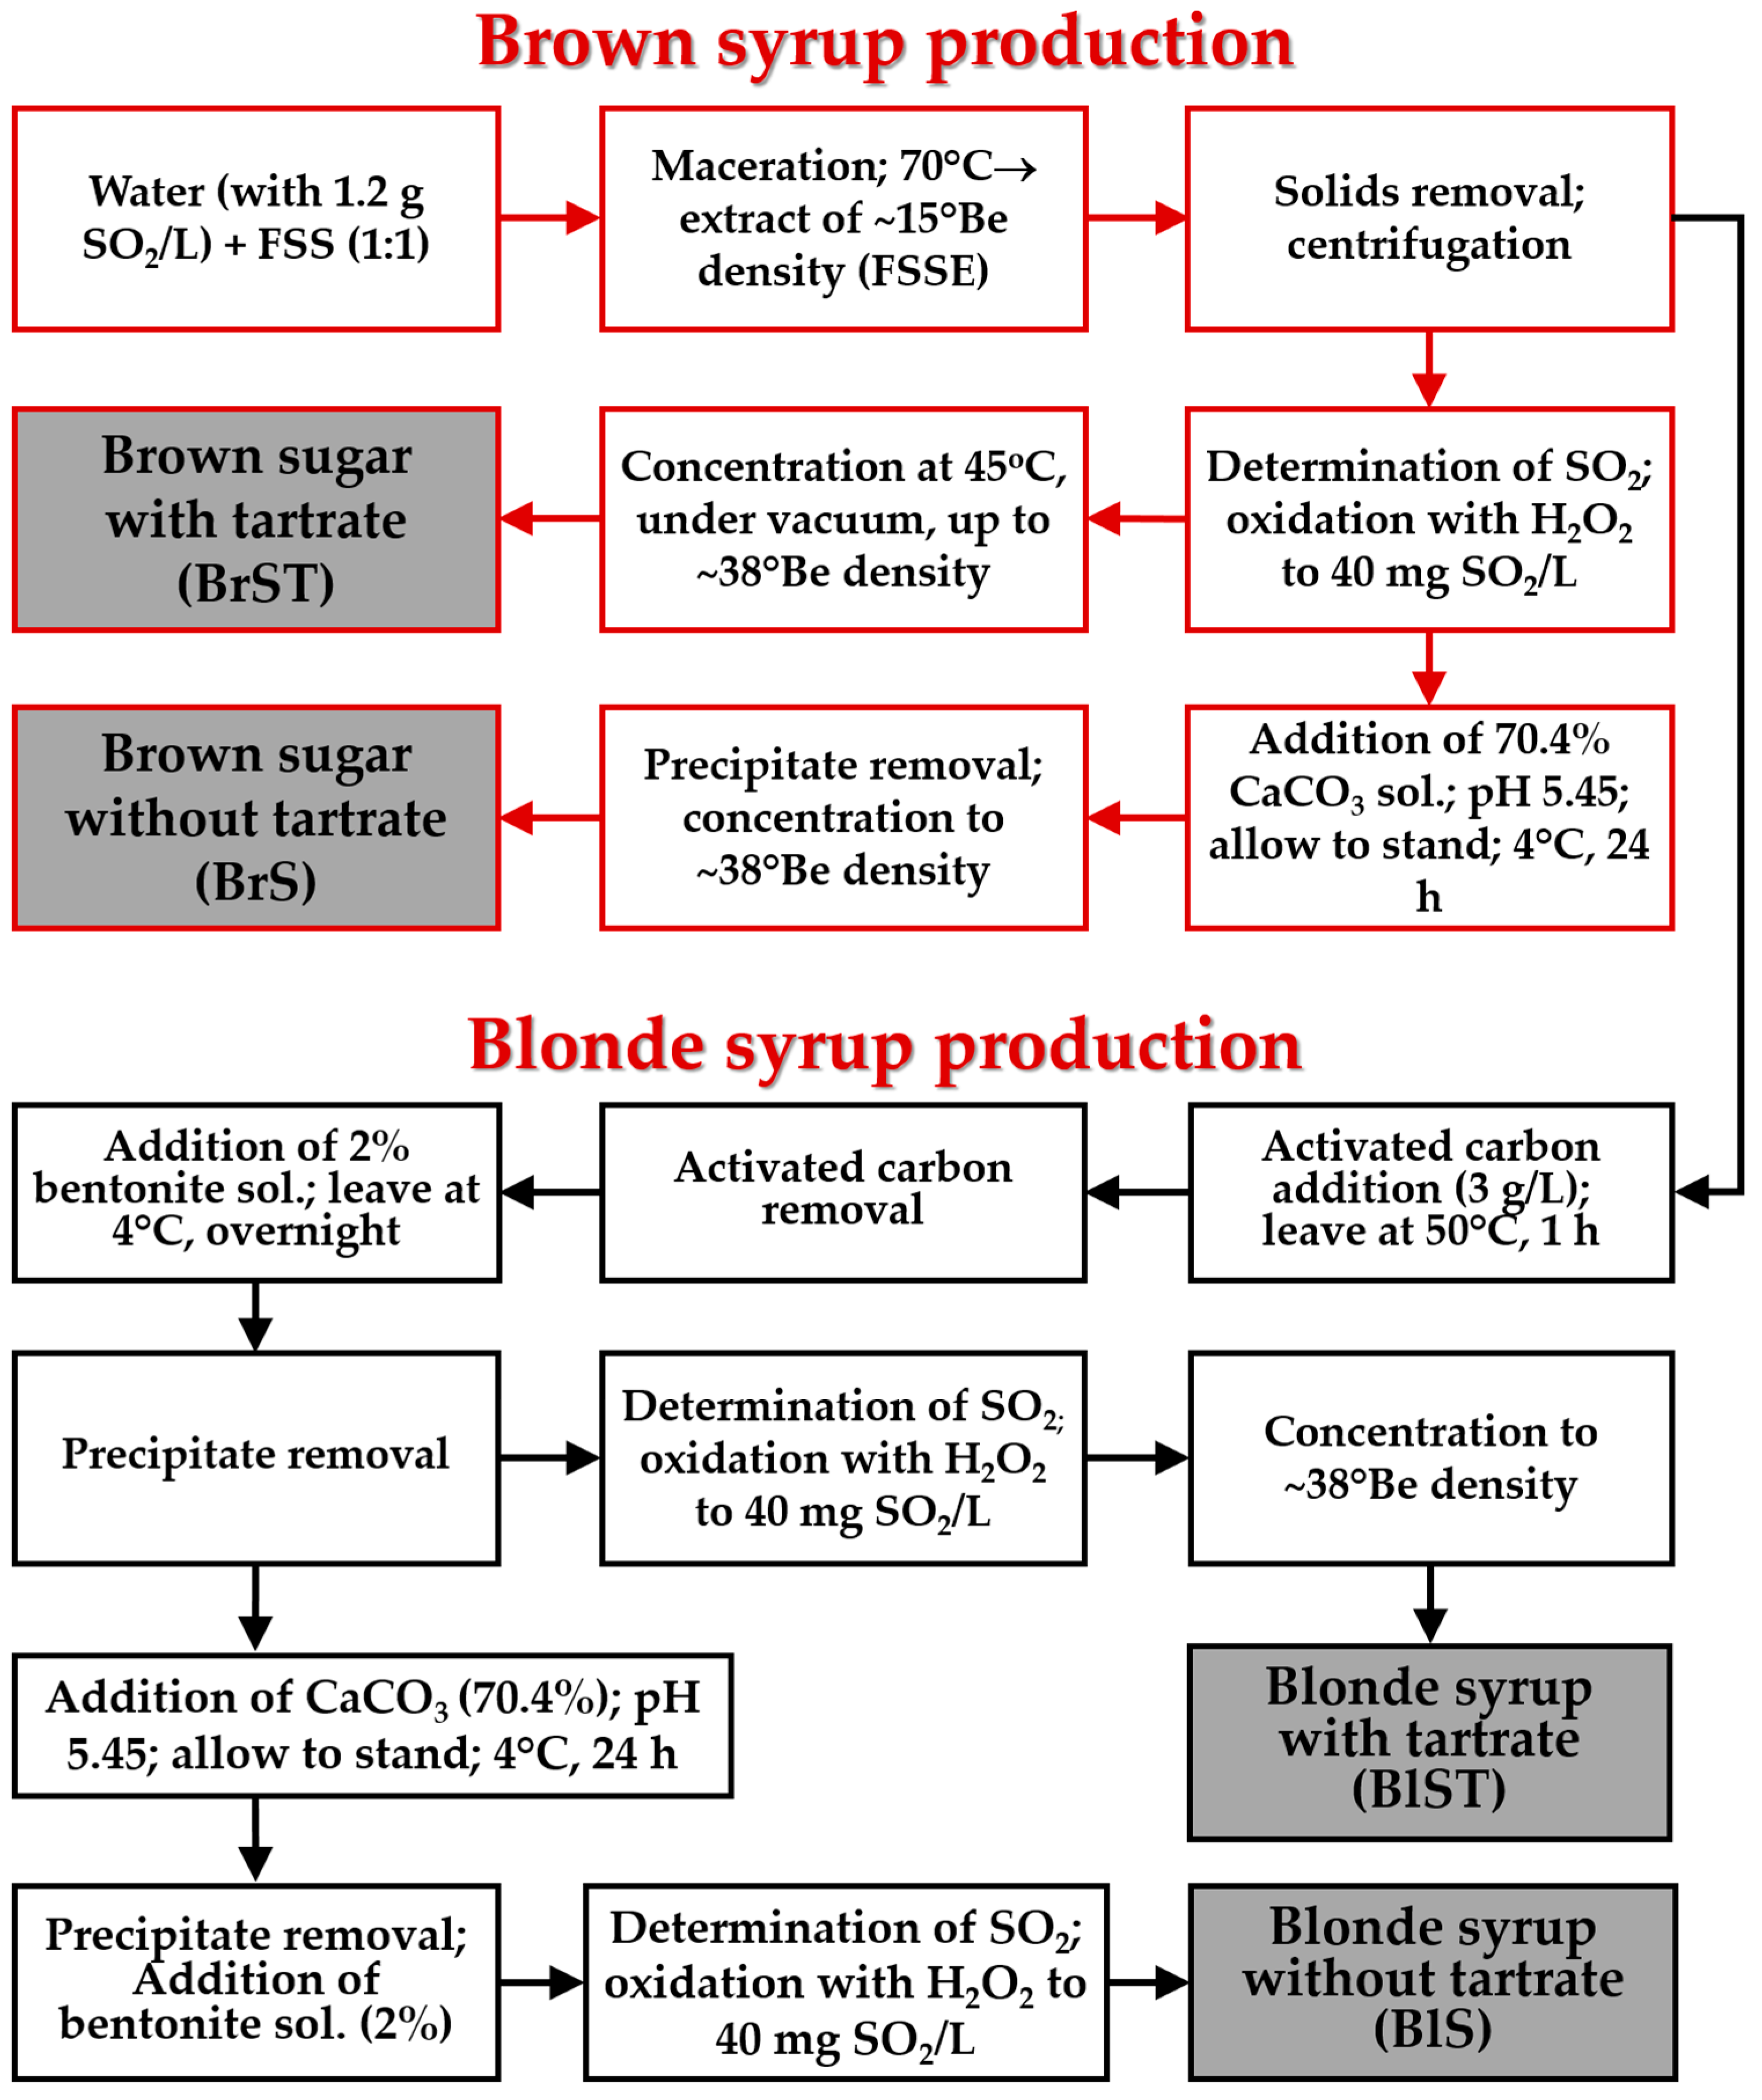
2.3. Syrup Production from FSS

2.3.1. Production of Brown Syrups

The FSS extract was concentrated on a rotary evaporator (Heidolph, WB2001) at low temperature (45 °C) to avoid thermal degradation of sugars (especially the heat-labile fructose) through caramelization reactions, which may degrade the syrup quality. The concentration took place until a syrup of 38–40 °Be density was obtained (~65–70% total sugar content). The produced brown syrups without treatment for tartrate reduction (BrST: Brown Syrup with Tartrate) were placed in sealed containers and stored in a dark place at room temperature until further analysis. For the reduction of tartrate in the FSS extract, 70.4% CaCO3 solution was added under continuous stirring until pH 5.45 was reached (Figure 1). The extract remained at 4 °C for 24 h. The precipitated tartrate was removed by centrifugation. Theoretically, 0.67 g/L CaCO3 is required to reduce tartaric acid by 1.0 g/L [18]. The reduction of sulfite in the FSS extract and the concentration to obtain the brown syrup with reduced tartrate (BrS) were carried out as described above for the BrST syrups.

2.3.2. Production of Blonde Syrups

The same process was followed for the production of blonde syrups, with an additional step for pigment removal (Figure 1). Specifically, 0.3% of activated carbon was added to the FSS extract, which was then heated at 50 °C for 1 h with constant stirring. When the extract was cooled down to room temperature, it was centrifuged and filtered under vacuum to completely remove the carbon and obtain a pale-yellow extract. Then 2% w/v of bentonite was added and the extract was left at 4 °C for 24 h for stabilization (protein haze and undesirable odor removal) [19]. The reduction of sulfite and the extract concentration were carried out as described above to obtain the blonde syrup with tartrate (BlST). The production of blonde syrup with reduced tartrate (BlS) was carried out as in the case of the brown (BrS) syrup (Figure 1).

2.4. Analytical Methods

2.4.1. Determination of pH, Acidity, and Total Nitrogen

The pH value (Cyberscan 10 pH-meter, Eutech Inst., Singapore) and TTA (expressed as g tartaric acid/100 g syrup) were determined after blending 20 g of syrup with 100 mL of water. For TTA, 10 mL of the solution was titrated with std 0.1 M NaOH solution [20].
The VA (expressed as g acetic acid/100 g syrup) was determined with steam distillation (UDK 129 Kjeldahl distillation unit, Velp Scientifica, Usmate Velate, Italy) of a 50 mL sample, followed by titration with std 0.1 M NaOH solution [20].
Protein as total nitrogen was analyzed using a modified Kjeldahl’s method. Specifically, 3 g of syrup was digested on an InKjel mM Kjeldahl digestion unit (behr Labor-Technik GmbH, Düsseldorf, Germany) with the following amounts of catalysts: 0.6 g CuSO4·5H2O, 6 g K2SO4, and 15 mL H2SO4. NH3 was released from the digested solution by the addition of 50 mL of 40% NaOH solution, steam distillation in the Kjeldahl distillation unit, trapping in 40 mL of std 0.1 M HCl solution, and back-titration with std 0.1 M NaOH [20].

2.4.2. Determination of Sugars

Sugars (fructose, glucose, sucrose) were determined on a Shimadzu LC-9A HPLC system equipped with a Nucleogel Ion 300 OA column, LC-9A pump, RID-6A refractive index detector, CTO-10A column oven (set at 33 °C), and DGU-2A degassing unit [10,12]. The mobile phase was aqueous 0.017 M H2SO4 solution at a flow rate of 0.55 mL/min, and 1% v/v 2-propanol solution was used as an internal standard (IS). The sample dilution was 2% v/v, and the injection volume was 40 μL.

2.4.3. Determination of TPC and AC

For the TPC analysis, 0.6 g syrup were diluted with 10 mL water. Then 0.1 mL of the solution, 5 mL of water, and 1 mL of Folin–Ciocalteau reagent were added to 10 mL flasks and left for 30 min in the dark. Then 1 mL of 7.5% w/v Na2CO3 solution was added, and the volume of the flask was fixed to 10 mL with water. The mixture was left again for 30 min in the dark. Likewise, calibration solutions of gallic acid and blank (not including the sample) were prepared. The absorbance was measured at 725 nm on a Jasco V-630 UV-vis spectrophotometer. The TPC was expressed as mg of gallic acid equivalents (GAE)/100 g of syrup [10,12].
AC was assessed using the radical scavenging method, based on the decrease in absorbance at 517 nm of a methanolic solution of DPPH against aqueous methanol solution as blank [10,12]. Specifically, 0.6 g syrup were diluted with 10 mL water. In 8 test tubes, 3 mL of 137.6 μM methanolic DPPH solution and various amounts of syrup solutions (in the range 0.05–1 mL) were added, and the volume was fixed with methanol to 4 mL. The samples were left for 30 min in the dark and the absorbance was measured at 517 nm. Calibration solutions of ascorbic acid were also prepared, and the results were expressed as mg ascorbic acid equivalents (AAE)/g syrup.

2.4.4. HMF Analysis

For the HMF analysis after White, 5 g of syrup was diluted with 25 mL of water and transferred to a 50 mL volumetric flask. Then 0.5 mL of Carrez I solution (15 g K4[Fe(CN)6]·3H2O in 100 mL water) and 0.5 mL of Carrez II solution (30 g ZnSO4 7H2O/100 mL water) were added. The volume of the flask was then fixed to 50 mL. The solution was paper-filtered and the first 10 mL of the filtrate was rejected. Aliquots of 5 mL were transferred into 2 test tubes, and 5 mL of water was added to the first (sample solution) and 5 mL of sodium bisulfite (NaHSO3) solution 0.2% was added to the second tube (reference solution). The absorbance of the sample solution at 284 nm (A284) was determined versus the reference solution to avoid interference of other components at that wavelength. The absorbance at 336 nm (A336) was measured to subtract the background absorbance. The HMF (mg/kg) was quantified using Formula (1) [21,22]:
HMF (mg/kg) = (A284 − A336) × 149.7 × 5 × D/W
where A284 and A336 are the absorbance at 284 nm and 336 nm, respectively, D is the dilution coefficient, and W is the sample weight. The constant 149.7 is calculated using Equation (2):
(126 × 1000 × 1000)/(16830 × 10 × 5)
where 126 is the MW of HMF, 16,830 (L·mol−1·cm−1) is the molar absorptivity coefficient (ε) of HMF at 284 nm, 1000 is the conversion of g into mg, 10 is the conversion of volume 5 into 50 mL, 1000 is the conversion of g sample to kg, and 5 is the theoretical nominal weight of the sample.

2.4.5. Titrimetric Determination of Sulfite

For the determination of sulfite in the syrups, a titrimetric method was applied. Specifically, 10–11 g (±0.01 g) of sample was diluted with water in a 50 mL volumetric flask, the solution was transferred into a 250 mL conical flask containing 25 mL of 1 M KOH solution, and the mixture was allowed to stand for 15 min. This process aims at releasing, as KHSO3, the sulfite that is bound with other compounds in the sample (e.g., carbonyls), according to reaction (3).
R-CH(OH)-SO3H + KOH → R-CHO + ΚHSO3 + H2O
Then, 10 mL of 25% v/v H2SO4 solution was added to convert HSO3−1 to SO4−2 (reaction 4) and the mixture was titrated with 0.02 N iodine solution with a starch indicator (reaction 5). The total sulfite was calculated as mg SO2/kg of syrup.
KHSO3 + H2SO4 → H2SO3 + KHSO4
H2SO3 + H2O + I2 → H2SO4 + 2 HI

2.4.6. Analysis of Volatile Compounds

The volatile profile of the syrups was determined with GC/MS with headspace solid-phase micro-extraction sampling (SPME; DVB/CAR/PDMS fiber, 2 cm; Sigma Aldrich, Germany), as described in [12]. In brief, a GCMS-QP2010 Ultra (Shimadzu Inc., Kyoto, Japan) instrument was used, with a DB-Wax capillary column (30 m, 0.25 mm i.d., 0.25 μm film thickness; Agilent, Santa Clara, CA, USA), and He as carrier gas (36 cm/s). For the sampling, 2 g of sample was transferred into a 20 mL glass vial containing 4 mL water, 2 g (NH4)2SO4, and 10 µL 1,4-dioxane solution (1000 mg/L; as IS). The vial was sealed and equilibrated for 5 min in a water bath at 40 °C. The SPME fiber was then exposed to the vial headspace for 30 min.
The volatiles were desorbed from the SPME fiber by exposing in the GC injection port (with liner; 0.7 mm i.d.; Sigma Aldrich; split ratio 1/10) at 240 °C for 5 min. The column oven temperature program was: 40 °C for 5 min; increase to 180 °C by 5 °C/min; increase to 240 °C by 30 °C/min; hold for 5 min. The MS was operated in the EI mode (70 eV) and 40–300 m/z mass scan range. The source and interface temperatures were 200 °C and 240 °C, respectively. Identification of compounds was achieved by comparing MS data and Retention Indices (RI) based on the homologous series of C8-C24 n-alkanes with those of authentic compounds and those of the NIST14 library (NIST, Gaithersburg, MD, USA) [12]. The software GCMS Solution (ver. 4.30; Shimadzu), AMDIS (ver. 2.72; NIST), and NIST MS Search (ver. 2.2; NIST) were used for the identification. The concentrations of the volatile compounds are expressed as normalized peak areas % (percentage of area corresponding to an Amdis component relative to the sum of areas of all components).

2.4.7. Microbiological Analysis

Amounts of 10 g of each syrup were received aseptically during the 1st and 3rd months of storage. The samples were homogenized with 90 mL sterile ¼ strength Ringer’s solution. Each suspension was then subjected to serial decimal dilutions in Ringer’s solution. Viable cell counts of total mesophilic bacteria (TMB), yeasts, molds, and enterobacteria were determined on selective media. Specifically, TMB were enumerated on Plate Count Agar (PCA) after incubation at 30 °C for 72 h. Yeasts and molds were enumerated on Potato Dextrose Agar (PDA) after incubation at 30 °C for 72 h. The presence of Enterobacteriaceae was determined on Violet Red Bile Glucose Agar (VRBGA) at 37 °C for 24 h. The results of the microbiological analysis were expressed as Colony-Forming Units (CFU) per g of sample, in plates containing from 30 to 300 colonies. All experiments were carried out in triplicate.

2.4.8. Sensory Evaluation

For the sensory evaluations, the syrup samples were stored at room temperature for 1 month after production and were evaluated by 10 untrained individuals who were asked to rate their sensory properties based on a 1–5 preference scale (1—Unacceptable, 2—Bad, 3—Good, 4—Very good, 5—Excellent) (consumer-oriented testing) [23]. The samples were coded randomly and were served to the testers at equal portions at room temperature (~22 °C). The testers were asked to taste each sample both plain and spread on bread (Figure 2). A sample of commercial grape syrup (petimezi) was also evaluated for comparison. The panel was specifically asked to evaluate each product in terms of aroma, taste, aftertaste, metallic aftertaste, and color. Specifically, aroma and taste were evaluated based on the 1–5 preference scale, while for aftertaste, the panelists were asked to comment based on the descriptions short, medium, and long, and the absence or presence of metallic taste. Finally, regarding color, the panelists were given the possibility of free description (description of shade, intensity, clarity, etc.).

2.4.9. Statistical Analysis

The significance of differences in the means of various data groups was checked with the One-Way Anova or t-Test (two populations), at the 0.05 level of significance, using the Microcal™ Origin® software, version 6.0 (Microcal Software, Inc., Northampton, MA, USA).

3. Results and Discussion

3.1. Composition of the Brown and Blonde Syrups Made from FSS

The results for the composition of the brown and blonde FSS syrups (sugars, acidity, protein, TPC, AC, sulfite, and HMF), are presented in Table 1.
The total average (av.) sugar content of all syrups after condensation was 65.4–69.4% w/w, and their Baumé hydrometer density was 38–40 °Be. According to the Greek legislation [8], commercial raisin syrups must have a density of 40–41 °Be, corresponding to 70–71% sugar content; however, at densities higher than 40 °Be, rapid crystallization of the sugars in the samples was observed. In the syrups prepared with the proposed methods, no sugar crystals were formed during the studied storage period and beyond. All syrups had similar contents of glucose (av. 31.3–35.4 % w/w) and fructose (av. 30.5–34.5% w/w) (p < 0.05), while no sucrose was found in the HPLC analysis (Table 1). Sugars determine both the taste and texture of syrups, and play an important role in their preservation by inhibiting the growth of microorganisms since they are present at high levels. The absence of sucrose was expected as it was not found in the raw material (FSS), as also reported previously [12], and is generally low (av. 0.4%) in the grapes of most vinifera cultivars [24]. The drying, storage, and extraction processes of FSS possibly led to the hydrolysis of any sucrose present in the grapes or currants. Similar commercial raisin syrup products (stafidini) found in the Greek market report reducing sugar levels of 68.0% for brown syrup (CBrS) and 71% for blonde syrup (CBlS). These data were either obtained from the product labelling or the product specifications available online [25,26].
The pH of syrups depends on the composition of the raw material and the method of production. The components of FSS that are responsible for the acidity of grape syrups are mainly tartaric acid, malic acid, and other organic acids that are present in lesser quantities (citric, succinic, etc.) [12,24]. The FSS syrups that were not treated for tartrate reduction were more acidic with pH values around 4.5 (Table 1), while the treated syrups had higher pH (av. 5.6–6.3). Comparing the pH values of the produced FSS syrups with those reported for two commercial brown and blonde syrups available in the local market (3.0–4.0 for CBrS, and 3.70–4.50 for CBlS), it can be observed that the commercial products have lower pH vales (Table 1). Also, the pH values of all blonde syrups made in this study, and the commercial ones, tend to be higher than those of brown syrups. These differences may be due to several factors including the different raw material and production process, the pH determination method, the different levels of tartrate reduction, the presence of sulfite, and the removal of other acidic components by the activated carbon treatment of the blonde syrups.
As in the case of pH, the TTA is mainly due to non-volatile organic acids (tartaric and malic acid, and other organic acids to a lesser extent), which are present in raisins and are transferred to the syrup. All syrups had similar TTA (av. 0.8–0.9% w/w, as tartaric acid), except BlST syrup, which had slightly higher TTA (av. 1.2%; p < 0.05) (Table 1). Despite the fact that half the syrups had undergone treatment to reduce tartrate, all products finally presented similar TTA values. The TTA of commercial brown syrup (CBrS) varies between 3.5 and 6.0% w/w, which is much higher than the FSS syrups prepared in this study. This difference may be due to different production processes and tartrate precipitation levels. From the above results it can be concluded that the pH and TTA values determined in this study cannot be considered reliable (as a measure of the absolute organic acid concentration), since the syrups had undergone many treatments (tartrate precipitation by CaCO3, sulfite addition and excess reduction by oxidation, etc.) that affect these values. An HPLC analysis of individual organic acids, especially tartrate, would provide more accurate results regarding their final concentration in the syrups; however, for technical reasons, it was not possible. The TTA (as tartrate) was previously found to be 2.19 ± 0.17% w/w in FSS, 2.60 ± 0.31 g/L in FSS extract (of 11.3 °Be density), and 3.99 ± 0.22 g/L or 4.32 ± 0.11 g/L in dry FSS wine made with free or immobilized yeast cells, respectively [12].
The Greek legislation for commercial raisin syrups requires reduction of tartrate [8], because tartaric and malic acids tend to precipitate at low temperatures, making the product unstable and visually unappealing to the consumer. Indeed, during the various stages of the proposed FSS syrup methodology, tartrate seems to be spontaneously destabilized and precipitate; therefore, the tartrate reduction step may be omitted, which may be advantageous in terms of both cost and process simplicity. On the other hand, it should be noted that tartrate and other organic acids are beneficial as they provide flavor and contribute to the microbial stability of the products [24].
VA is also important for the organoleptic quality, and indicative of the microbiological stability of a product. In the case of grape syrups, VA is developed mainly by the action of yeasts and acetic acid bacteria, which eventually leads to the conversion of sugars to ethanol and acetic acid during the stages of grape harvesting, raisin production, and industrial finishing, and the storage and handling of the generated FSS thereafter [12]. Other volatile acids also contribute to a lesser extent. The average VA (as acetic acid) of the FSS syrups made in this study was 0.09–0.27% w/w (Table 1), which is low, indicating that the syrups did not undergo significant microbial alterations during production that could reflect on their organoleptic quality. For example, the overnight stay of the FSS extract in the refrigerator for cold stabilization or any other delays and disturbances during the various stages of production could have affected the VA levels by increasing exposure to oxygen and facilitating spoilage by yeasts and acetic acid bacteria. Among the different samples, lower values (p < 0.05) were observed in the case of samples that were treated with CaCO3 for tartrate reduction. The VA was previously found to be 0.20 ± 0.04% w/w in FSS, 0.17 ± 0.01 g/L in FSS extract (of 11.3 °Be), and below 0.60 ± 0.17 g/L in dry FSS wines [12]. No data on the VA of raisin syrups have been reported in the literature.
During grape ripening, inorganic nitrogen is rapidly reduced due to conversion to organic compounds (amino acids, peptides, polypeptides, proteins), and at full ripening only a very small percentage is inorganic [24]. The syrups prepared in this study had similar protein contents (av. 1.5–1.7% w/w; as Kjeldahl total nitrogen), except the sample BlS, which presented slightly lower values (av. 1.40%; p < 0.05), indicating that the production process did not significantly affect this characteristic (Table 1). This small decrease observed in the blonde syrups is possibly due to the application of bentonite, a common clarifying agent that carries negatively charged particles and removes pigments and turbidity by flocculating unstable proteins [27,28].
The addition of sulfite to the FSS extracts before the production of the syrups is essential to avoid microbial spoilage and spontaneous fermentation, and is a common practice in the food industry, including syrups, jams, jellies, and other fruit-based preserves [29]. Sulfite also acts as an antioxidant, protecting from oxidative degradation of the product’s sensory properties, especially color [29]. The average residual sulfite in the FSS syrups after treatment with H2O2 was 22–41 mg SO2/kg (Table 1). The maximum permitted level according to Greek legislation is 40 mg/kg for raisin syrups [8], and according to EU legislation, in jams, jellies and marmalades made with sulfited fruit, it should be less than 100 mg/kg or mg/L [30]. With regard to the sulfite addition and excess oxidation applied in this study, based on the multiple laboratory tests that were carried out in order to regulate its final level in the products within the regulatory limits (<40 ppm), it was concluded that these processes are laborious and have small reproducibility. Taking into account that sulfites are associated with undesirable health effects (such as allergies) [29], the application of other techniques for microbial load reduction should be considered in syrup production (e.g., warm extraction of FSS, pasteurization of the extracts, etc.). Moreover, the final products are stable due to their high sugar content.
HMF was not detected in any of the produced syrups. This makes sense as the syrups were prepared by concentration at low temperature (45 °C). HMF in food is one of the many compounds resulting from heating due to the acid-catalyzed dehydration of sugars such as hexoses, and as an intermediate of the Maillard reaction. HMF can produce other compounds with potential carcinogenicity, such as 5-sulfoxymethyl-2-furfural; however, for HMF this has not been documented in vivo [31]. Another process that could lead to the presence of HMF is the drying of raisins under the sun, and in the case of FSS, this natural drying process does not seem to produce HMF.
Regarding the TPC (GAE equivalent) of the syrups, variation can be observed among the samples (p < 0.05). The blonde syrups had lower contents (av. 134–143 mg/100 g) than brown syrups (av. 185–213 mg/100 g) (Table 1). This is possibly due to the removal of pigments from the blonde syrups, including antioxidant phenolics, by the activated carbon treatment [12,32]. Data on the TPC of similar commercial syrups were not found. For grape juice concentrate, TPC values (GAE; dry mass) of 252 ± 33 mg/100 g (from grapes with initial TPC 1619 ± 167 mg/100 g) [33], and 245.6 ± 4.3 mg/100 g [34], have been reported. In traditional Turkish pekmez, a TPC of 335.9 ± 7.2 mg/100 g has been reported [35]. Finally, in grape molasses produced using traditional and industrial methods, the TPC (GAE; dry mass) varied from 1.70 ± 0.13 to 8.31 ± 0.11 mg/g, according to [36].
In [12], the TPC of FSS (same origin and batch as the FSS used in this study) was found to be 476 ± 0.3 mg GAE/100 g, while that of aqueous FSS extract (11.3 °Be) was 107.0 ± 0.02 mg GAE/L. The significant reduction in TPC in the syrups compared to the raw material (FSS) is due to the production process, and specifically to the removal of the solid FSS residues (skins, seeds, and stems) and the clarification and depigmentation steps [12,33], as well as to possible chemical effects of these processes on the FSS phenolics.
For the same possible reasons, the brown FSS syrups presented higher AC (av. 0.90–1.0 mg AAE/g) compared to the blonde syrups (av. 0.3–0.6 mg AAE/g) (Table 1). The same was observed by [33], who determined an 83–92% decrease in AC (as μmol TEAC/100 g, dry mass) from the grape (6910 ± 421) to the concentrate (527 ± 28). According to [36], the AC of grape molasses varied from 68.2 ± 1.7 to 96.6 ± 2.2 mg AAE/ g of dry extract, while according to [34], the AC of grape juice concentrate, which was screened by the DPPH· radical scavenging assay, was 488.6 ± 19.6 μmol Trolox eq./100 g dry mass. In [12], the AC of the FSS was determined to be 2.4 ± 0.04 mg AAE/g and that of aqueous FSS extract (11.3 °Be) was 10.3 ± 0.1 mg AAE/L.

3.2. Volatilome

The volatile profile of the syrups was determined using GC/MS with headspace SPME sampling. In total, 144 compounds were detected, and their concentrations are presented in Table 2 as normalized peak areas %. Specifically, 15 esters (mainly fatty acid ethyl esters, acetate esters, and phenyl esters), 28 alcohols (including phenyl alcohols and a furanyl alcohol), 12 organic acids (straight-chain C2-C10 and 2/3-methylcarboxylic acids), 41 carbonyl compounds (aldehydes, ketones, and furanyl-, phenyl-, and pyrrolyl-aldehydes), 18 terpenes (mainly oxygenated monoterpenes, sesquiterpenes, norisoprenoids), seven lactones, eight hydrocarbons (alkanes and straight-chain alkenes, C6-C16), and 15 other compounds (mainly furans and pyrazines) were identified. Odor and taste descriptions for these compounds, as well as their prior identification in grapes, raisins, other parts of the vine plant, or other plant sources, were previously presented in detail in [10,12].
Among esters, ethyl acetate was found in significant amounts in the syrups’ volatilome (above 4%), as well as in the raw material (FSS). Other esters found at levels above 0.1% of total volatiles were isoamyl acetate (fruity, banana) and 2-phenylethyl acetate (floral, rose, honey) [12]. All identified esters were also found in the FSS, but in total, the BlST syrup presented a richer ester profile (Table 2).
The main alcohol found in the syrups (4.1% in BrST) was 2-ethyl-1-hexanol (citrus, fresh, flowery) (Table 2), which has been previously identified in raisins, grapes, and wines [12]. Furfuryl alcohol, 3-methyl-1-butanol, 1-pentanol, and 1-hexanol were found at levels of 0.3–1%. Of the 28 alcohols detected, 21 have been previously found in grapes or raisins [12]. The alcohols (Z)-2-penten-1-ol, 2-dodecanol, 5-methylfurfuryl alcohol, and methionol have only been previously reported in wine [12].
Of the 12 identified organic acids, nine were also previously reported in grapes or raisins [12]. Acetic acid was the major acid identified in the headspace of both the FSS (10.8%) and the FSS syrups (3.9–4.4%) (Table 2). All other acids, except 2-methylbutanoic acid and caprylic acid (below 0.01%), were found at levels 0.01–0.3%.
Carbonyl compounds (in total, 41) were found at higher levels in the syrups than in the FSS (Table 2). The main compounds in the syrups were 2-methylbutanal (3–9%) (rummy, malty, nutty, fermented), 3-methylbutanal (9–12%) (aldehydic, cocoa, fatty, fruity, nutty), acetoin (2–4%) (fatty, creamy, milky), furfural (24–38%) (woody, bready, nutty, caramellic, burnt), 5-methyl-2-furfural (6–11%) (spicy, caramellic, maple, grain), and ethyl-1H-pyrrole-2-carboxaldehyde (3%) (burnt, roasted, smoky) [12]. Isobutyraldehyde, coffee furanone, and benzaldehyde were found at higher levels in BrST, while diacetyl and hexanal were found at higher levels in BlST. Most of the identified compounds are either produced during the dehydration of the raisins as lipid oxidation products or as products of the Maillard reaction [12,37,38].
Terpenes are also important aroma compounds derived mainly from grapes and are key components of varietal aromas. The major terpenes found in the syrups (at levels above 0.1%) were D-limonene, cis- and trans-linalool oxide, α-terpineol, β-damascenone, l-menthol, and D-cymen-8-ol (Table 2). α-Terpineol (pine, woody, lemon, floral) [12] was the major terpene identified at levels 0.2–0.4%. In total, higher levels of terpenes were found in the BrST syrup.
A number of other heterocyclic and aromatic compounds (furan, alkyl furans, alkyl pyrazines, acetyl furans, guaiacol, benzothiazole), were identified in both FSS and in the syrups (Table 2). These compounds are associated with the Maillard and Strecker degradation reactions commonly found in raisins and providing typical aroma descriptions (roasted, nutty, green, floral, fruity, caramellic) [10,12,24,37,38]. The major furan found was 2-acetylfuran (3.5–1.8%). Dimethyl sulfide (asparagus, truffle, molasses) was also identified, which may be a result of microbial action or may be produced by heat [12]. In total, BrST contained higher amounts of these compounds compared to BlST, and much higher than those identified in the FSS, indicating a correlation with the syrup production process, which involves heating.
Finally, seven lactones (five γ-lactones, β-angelic lactone, and 2-hexene-1,4-lactone), and eight alkanes (C6-C16) were identified in the syrups (Table 2). γ-Butyrolactone (creamy, caramel, milky, fruity, peach) [12] was the major lactone found at levels of 1.1–1.8%. The C6, C8, C14, and C16 alkanes were found at levels above 0.01%, while of the eight identified alkanes, only five have been previously reported in grapes or raisins according to [12].

3.3. Microbial Stability

The microbial load of a food product is the result of the microflora present in the raw material and the microorganisms that are introduced during the stages of processing and storage until consumption. The produced FSS syrups were stored in sealed containers and kept in the dark at room temperature for 3 months. Microbial analysis for TMB, yeasts, molds, and enterobacteria was performed after the first and third months of storage, and the results are presented in Table 3.
A very low microbial load can be observed for all syrups, in some cases lower than that of similar commercial products. An exception was BlST syrup, which presented elevated levels of TMB and yeasts, possibly due to contamination at some stage of the production process or storage.
The lower microbial stability of a syrup may also be due to its different composition, i.e., the different levels of sugars, organic acids, antioxidants, and antimicrobial components that may have been removed by the applied clarification treatments.

3.4. Sensory Properties

For the sensory evaluation of the syrups, a consumer preference test was performed (Figure 2). The results for descriptions such as aroma, taste, aftertaste, metallic aftertaste, and color are presented in Table 4. A commercial grape syrup (CGS; petimezi) was also evaluated for comparison, and reported data for other commercial raisin syrups (CBrS, CBlS) are also presented in Table 4.
The taste of BrST, BrS, and BlST syrups was characterized as good, and even better for BlS, which received the highest score. On the other hand, the CGS received the lowest score. The taste was described as sweet and sour (BlST) or similar to honey (BrS and BrS), while only for BrST was a characteristic fruit taste pointed out. Regarding the aftertaste perception, it was described as long for all tested syrups except BrS, which was described as having a moderate aftertaste. A metallic aftertaste was not perceived in any of the samples. No data regarding the aftertaste of commercial syrups were found. In terms of aroma, the syrups BrST, BrS, and BlST were rated as good to excellent, while BlS and CGS received lower ratings. However, for all products the aroma was characterized as not particularly intense.
Finally, regarding the color and clarity of the syrups, for BrST and BrS it was described as brownish-red, similar to honey, with BrST being described as cloudy and BrS as clear. BlST was characterized as golden yellow and clear, while BlS was characterized as orange-yellow and cloudy. The colors of commercial syrups were described as dark brown for brown raisin syrups and golden brown for blonde raisin syrups. To conclude, the FSS syrups were generally described as products with a strong aftertaste, a good but not particularly strong smell, a good sweet-sour or honey-like taste, and no metallic aftertaste.

4. Conclusions

From the FSS of premium-quality Corinthian currants (Vostitsa PDO), methods for producing brown and blonde syrups are proposed and compared, including must extraction by maceration at 70 °C, tartrate reduction and depigmentation treatments, and condensation at low temperature (45 °C) under vacuum. All syrups had similar sugar contents and no sucrose. Those not treated for tartrate reduction were more acidic in terms of pH, but all had higher pH compared to similar commercial products. On the other hand, all syrups had similar TTA; therefore, the tartrate reduction step could be omitted, which may be advantageous in terms of both cost and process simplicity. The differences in protein, TPC, and AC levels among the FSS syrups and similar commercial products are possibly due to different raw materials and production processes. Sulfite addition and subsequent oxidation processes, applied to the FSS extracts to avoid spoilage, are laborious, and alternative methods to ensure the microbial stability of the syrups should be contemplated in the case of small-scale production. The syrups’ volatilome, compared to the raw material (FSS), presented increased levels of compounds that are associated with sugar- and lipid-decomposition reactions. Finally, from the VA, sensory, and microbiological analyses, it can be concluded that the FSS syrups are products of good quality, and during their preparation and storage no significant microbial or chemical alterations occur. They can be considered products of high sensory as well as nutritional quality, taking into account their antioxidant properties and lower glycemic index since half their sugar is fructose. Therefore, syrups from side-streams such as FSS can create an added-value significance for the sustainability of the raisin-processing sector. The production sustainability of local commodities such as the highly nutritious Corinthian currants will also contribute to the promotion and adherence of Mediterranean dietary patterns, positively affecting local biodiversity, agricultural communities, processing companies, and the national, regional, and local economies.

Author Contributions

Conceptualization, I.P., A.P. and A.B.; Methodology, I.P., A.P., A.M., A.T., I.T., V.A. and A.B.; Software, I.P., A.M., A.T. and A.B.; Validation, I.P. and A.M.; Investigation, I.P., A.P., A.M., A.T., I.T., V.A. and A.B.; Resources, A.M. and A.B.; Data curation, A.T.; Writing—original draft, I.P. and V.A.; Supervision, A.B. All authors have read and agreed to the published version of the manuscript.

Funding

This research was supported by the Agricultural Cooperatives’ Union of Aeghion S.A. (project “Exploitation of raisin finishing side-stream-MIS/E420”) and the “Food Innovation Research Infrastructure-MIS/5027222”, implemented under the Action “Reinforcement of the Research and Innovation Infrastructure” of the Operational Programme “Competitiveness, Entrepreneurship and Innovation-NSRF 2014-2020”, co-financed by Greece and ERDF.

Institutional Review Board Statement

Not applicable.

Informed Consent Statement

Not applicable.

Data Availability Statement

Not applicable.

Acknowledgments

The work was also supported by the Andreas Mentzelopoulos University of Patras Scholarships.

Conflicts of Interest

The authors declare no conflict of interest. The funders had no role in the design of the study; in the collection, analyses, or interpretation of data; in the writing of the manuscript; or in the decision to publish the results.

References

  1. 360 Research Reports. Global Syrups Market-Segmented by Type, Application, and Geography (2022–2030). Available online: https://www.360researchreports.com/global-syrups-market-13100587 (accessed on 31 October 2022).
  2. IMARC. Syrup Market: Global Industry Trends, Share, Size, Growth, Opportunity and Forecast 2022–2027. Available online: https://www.imarcgroup.com/syrup-market (accessed on 31 October 2022).
  3. Weaver, N.J.; Wilkin, G.S.; Morison, K.R.; Watson, M.J. Minimizing the energy requirements for the production of maple syrup. J. Food Eng. 2020, 273, 109823. [Google Scholar] [CrossRef]
  4. Djalal, M.; Bastian, F.; Putra, A.M.; Laga, A. Buffer determination for immobilized enzymes in a batch system for glucose syrup production. IOP Conf. Ser. Earth Environ. Sci. 2019, 343, 012071. [Google Scholar] [CrossRef]
  5. Neifar, S.; Cervantes, F.V.; Bouanane-Darenfed, A.; BenHlima, H.; Ballesteros, A.O.; Plou, F.J.; Bejar, S. Immobilization of the glucose isomerase from Caldicoprobacter algeriensis on Sepabeads EC-HA and its efficient application in continuous High Fructose Syrup production using packed bed reactor. Food Chem. 2020, 309, 125710. [Google Scholar] [CrossRef] [PubMed]
  6. Yulistiani, F.; Maulani, L.; Ramdhayani, W.S.; Wibisono, W.; Permanasari, A.R. Fructose syrup production from tapioca solid waste (Onggok) by using enzymatic hydrolysis in various pH and isomerization process. J. Phys. Conf. Ser. 2019, 1295, 012032. [Google Scholar] [CrossRef]
  7. Wang, Y.-C.; Zhao, N.; Ma, J.-W.; Liu, J.; Yan, Q.-J.; Jiang, Z.-Q. High-level expression of a novel α-amylase from Thermomyces dupontii in Pichia pastoris and its application in maltose syrup production. Int. J. Biol. Macromol. 2019, 127, 683–692. [Google Scholar] [CrossRef]
  8. Independent Authority for Public Revenue (IAPR) of the Hellenic Republic. Food and Drinks Code. Available online: https://www.aade.gr/sites/default/files/2020-03/66-iss2.pdf (accessed on 31 October 2022). (In Greek).
  9. Papadakis, E.; Gardeli, C.; Tzia, C. Spray drying of raisin juice concentrate. Drying Technol. 2006, 24, 173–180. [Google Scholar] [CrossRef]
  10. Plioni, I.; Bekatorou, A.; Terpou, A.; Mallouchos, A.; Plessas, S.; Koutinas, A.A.; Katechaki, E. Vinegar production from Corinthian currants finishing side-stream: Development and comparison of methods based on immobilized acetic acid bacteria. Foods 2021, 10, 3133. [Google Scholar] [CrossRef]
  11. European Currants. Agricultural Cooperatives Union-Aeghion, Greece. Available online: https://www.eu-currants.eu/index.php/en/agricultural-cooperatives-union-12 (accessed on 25 July 2022).
  12. Plioni, I.; Bekatorou, A.; Mallouchos, A.; Kandylis, P.; Chiou, A.; Panagopoulou, E.A.; Dede, V.; Styliara, P. Corinthian currants finishing side-stream: Chemical characterization, volatilome, and valorisation through wine and baker’s yeast production-technoeconomic evaluation. Food Chem. 2021, 342, 128161. [Google Scholar] [CrossRef] [PubMed]
  13. Mountaki, C.; Dafnis, I.; Panagopoulou, E.A.; Vasilakopoulou, P.B.; Karvelas, M.; Chiou, A.; Karathanos, V.T.; Chroni, A. Mechanistic insight into the capacity of natural polar phenolic compounds to abolish Alzheimer’s disease-associated pathogenic effects of apoE4 forms. Free Radic. Biol. Med. 2021, 171, 284–301. [Google Scholar] [CrossRef] [PubMed]
  14. Yanni, A.E.; Efthymiou, V.; Lelovas, P.; Agrogiannis, G.; Kostomitsopoulos, N.; Karathanos, V.T. Effects of dietary Corinthian currants (Vitis vinifera L., var. Apyrena) on atherosclerosis and plasma phenolic compounds during prolonged hypercholesterolemia in New Zealand White rabbits. Food Funct. 2015, 6, 963–971. [Google Scholar] [CrossRef]
  15. Deli, C.K.; Poulios, A.; Georgakouli, K.; Papanikolaou, K.; Papoutsis, A.; Selemekou, M.; Karathanos, V.T.; Draganidis, D.; Tsiokanos, A.; Koutedakis, Y.; et al. The effect of pre-exercise ingestion of Corinthian currant on endurance performance and blood redox status. J. Sports Sci. 2018, 36, 2172–2180. [Google Scholar] [CrossRef]
  16. Chiou, A.; Panagopoulou, E.A.; Karathanos, V.T. Anthocyanins and other flavonoids in dried fruits of the Mediterranean area. In Handbook of Anthocyanins: Food Sources, Chemical Applications and Health Benefits; Warner, L.M., Ed.; Nova Science Publishers: New York, NY, USA, 2014; pp. 395–419. [Google Scholar]
  17. Bekatorou, A.; Plioni, I.; Sparou, K.; Maroutsiou, R.; Tsafrakidou, P.; Petsi, T.; Kordouli, E. Bacterial cellulose production using the Corinthian currant finishing side-stream and cheese whey: Process optimization and textural characterization. Foods 2019, 8, 193. [Google Scholar] [CrossRef] [PubMed] [Green Version]
  18. The Australian Wine Research Institute. Available online: https://www.awri.com.au/industry_support/winemaking_resources/frequently_asked_questions/deacidification (accessed on 31 October 2022).
  19. The Australian Wine Research Institute. Available online: https://www.awri.com.au/wp-content/uploads/2018/08/Technical_Review_Issue_235_McRae.pdf (accessed on 31 October 2022).
  20. Association of Official Analytical Chemists (AOAC). Chapter 37. Methods 942.15, 925.34, 920.152. In Official Methods of Analysis of AOAC International, 16th ed.; AOAC International: Arlington, TX, USA, 1995; Volume II, pp. 10–11. [Google Scholar]
  21. Khalil, M.I.; Sulaiman, S.A.; Gan, S.H. High 5-hydroxymethylfurfural concentrations are found in Malaysian honey samples stored for more than one year. Food Chem. Toxicol. 2010, 48, 2388–2392. [Google Scholar] [CrossRef] [PubMed]
  22. International Honey Commission. Harmonised methods of the International honey commission. Available online: http://www.ihc-platform.net/ihcmethods2009.pdf (accessed on 31 October 2022).
  23. Murray, J.M.; Baxter, I.A. Sensory evaluation-Food acceptability and sensory evaluation. In Encyclopedia of Food Sciences and Nutrition, 2nd ed.; Caballero, B., Ed.; Academic Press: Cambridge, MA, USA, 2003; pp. 5130–5136. [Google Scholar]
  24. Jackson, R.S. Wine Science. Principles and Applications, 3rd ed.; Academic Press: San Diego, CA, USA, 2008; pp. 3, 82, 279, 297, 375, 426, 691. [Google Scholar]
  25. Tzanidis, Food Ingredients. Raw materials. Available online: https://www.tzanidis.gr/en/raw-materials/ (accessed on 31 October 2022).
  26. Tripodakis Wines & Gourmet. Natural Sweeteners. Available online: https://www.tripodakis.gr/en/concentrated-raisin-syrup/ (accessed on 1 November 2022).
  27. Muhlack, R.A.; Colby, C.B. Reduced product loss associated with inline bentonite treatment of white wine by simultaneous centrifugation with yeast lees. Food Bioprod. Process. 2018, 108, 51–57. [Google Scholar] [CrossRef]
  28. Vernhet, A. Chapter 16-Red Wine Clarification and Stabilization. In Red Wine Technology, 1st ed.; Morata, A., Ed.; Academic Press: Cambridge, MA, USA, 2019; pp. 237–251. [Google Scholar]
  29. Vally, H.; Misso, N.L. Adverse reactions to the sulphite additives. Gastroenterol. Hepatol. Bed. Bench. 2012, 5, 16–23. [Google Scholar] [PubMed]
  30. Regulation (EC) No 1333/2008 of the European Parliament and of the Council of 16 December 2008 on food additives (Text with EEA relevance). Available online: https://eur-lex.europa.eu/legal-content/EN/TXT/?uri=CELEX:32008R1333 (accessed on 1 November 2022).
  31. International Agency for Research on Cancer. Report of the Advisory Group to Recommend Priorities for the IARC Monographs during 2020–2024. Available online: https://monographs.iarc.who.int/wp-content/uploads/2019/10/IARCMonographs-AGReport-Priorities_2020-2024.pdf (accessed on 1 November 2022).
  32. Sing, K.S.W. Chapter 10-Adsorption by Active Carbons. In Adsorption by Powders and Porous Solids, 2nd ed.; Rouquerol, F., Rouquerol, J., Sing, K.S.W., Llewellyn, P., Maurin, G., Eds.; Academic Press: Cambridge, MA, USA, 2014; pp. 321–391. [Google Scholar]
  33. Capanoglu, E.; de Vos, R.C.H.; Hall, R.D.; Boyacioglu, D.; Beekwilder, J. Changes in polyphenol content during production of grape juice concentrate. Food Chem. 2013, 139, 521–526. [Google Scholar] [CrossRef] [PubMed]
  34. Guler, A.; Tokuşoğlu, Ö.; Artik, N. Alterations on phenolic compounds and antioxidant activity during sour grape juice concentrate processing. Cienc. Tec. 2018, 33, 136–144. [Google Scholar] [CrossRef]
  35. Aydinlik, Z.; Battaloglu, R. Determination of phenolic compound contents in traditionally produced grape Pekmez samples. Asian J. Chem. 2016, 28, 1399–1400. [Google Scholar] [CrossRef]
  36. Helvacıoğlu, S.; Charehsaz, M.; Güzelmeriç, E.; Türköz Acar, E.; Yeşilada, E.; Aydın, A. Comparatively investigation of grape molasses produced by conventional and industrial techniques. Marmara Pharm. J. 2018, 22, 44–51. [Google Scholar] [CrossRef] [Green Version]
  37. Hui, Y.H. Handbook of Fruit and Vegetable Flavors; John Wiley and Sons, Inc.: Hoboken, NJ, USA, 2010. [Google Scholar]
  38. Khiari, R.; Zemni, H.; Mihoubi, D. Raisin processing: Physicochemical, nutritional and microbiological quality characteristics as affected by drying process. Food Rev. Int. 2019, 35, 246–298. [Google Scholar] [CrossRef]
Figure 1. Processes for the production of syrups from the Corinthian currant finishing side-stream (FSS). FSSE: FSS extract. BrST: Brown syrup with tartrate. BrS: Brown syrup with reduced tartrate. BlST: Blonde syrup with tartrate. BlS: Blonde syrup with reduced tartrate.
Sustainability 15 00495 g001
Figure 2. (a) Sensory evaluation of the FSS syrups. (b) Brown FSS syrup. (c) Blonde FSS syrup.
Sustainability 15 00495 g002
Table 1. Composition of brown and blonde syrups made from the Corinthian currant finishing side-stream.
ParameterSyrup Type
BrSTBrSBlSTBlS
pH4.35 ± 0.04 a5.57 ± 0.52 b4.46 ± 0.15 a6.25 ± 0.18 c
TTA (% w/w tartaric acid)0.88 ± 0.08 a0.91 ± 0.08 a1.18 ± 0.30 b0.75 ± 0.16 a
VA (% w/w acetic acid)0.16 ± 0.13 a0.11 ± 0.04 b0.27 ± 0.03 a0.09 ± 0.00 b
Total sugar content (% w/w)65.4 ± 0.5 a69.4 ± 0.5 b66.5 ± 0.6 a66.3 ± 7.5 a
Glucose (% w/w)32.9 ± 0.7 a31.3 ± 1.5 a35.4 ± 0.6 a34.6 ± 4.1 a
Fructose (% w/w)32.5 ± 0.2 a34.5 ± 4.1 a33.4 ± 3.3 a30.5 ± 5.1 a
Sucrose (% w/w)ndndndnd
Total SO2 (mg/kg)40.7 ± 1.1 a33.0 ± 0.5 b22.1 ± 0.8 c 26.1 ± 0.1 d
Protein (% w/w)1.56 ± 0.05 a1.68 ± 0.16 a1.52 ± 0.18 a1.40 ± 0.18 b
TPC (mg GAE/100 g)213.3 ± 7.7 a184.9 ± 4.5 b134.0 ± 2.9 c143.3 ± 2.4 d
AC (mg AAΕ/g)0.90 ± 0.09 a 1.03 ± 0.03 b0.29 ± 0.02 c0.58 ± 0.04 d
HMF (mg/kg)ndndndnd
TTA: Total titratable acidity. VA: Volatile acidity. TPC: Total phenolic content. AC: Antioxidant capacity. HMF: Hydroxymethyl furfural. GAE: Gallic acid equivalent. AAE: Ascorbic acid equivalent. BrST: Brown syrup with tartrate. BrS: Brown syrup with reduced tartrate. BlST: Blonde syrup with tartrate. BlS: Blonde syrup with reduced tartrate. nd: not detected. Superscript letters in a row indicate statistical differences between treatments (p < 0.05). All assays were carried out at least in triplicate (n = 3–6).
Table 2. Volatiles identified by SPME GC/MS analysis (normalized peak areas %) in the brown (BRST) and blonde (BLST) syrups.
CompoundCASRIDRIrefRIFSSBrSTBlST
Esters
Methyl acetate79-20-9A8288200.200.19<0.01
Ethyl acetate141-78-6A8888825.294.389.68
Ethyl 2-methylpropanoate (ethyl isobutyrate)97-62-1A961958<0.01<0.01<0.01
2-Methylpropyl acetate (isobutyl acetate)110-19-0A10121012<0.010.030.10
Ethyl butanoate (ethyl butyrate)105-54-4A10351034<0.010.020.03
Ethyl 3-methylbutanoate (ethyl isovalerate)108-64-5B10681066<0.010.010.03
3-Methylbutyl acetate (isoamyl acetate)123-92-2A112211180.050.171.19
Ethyl hexanoate (ethyl caproate)123-66-0A123312290.070.020.02
Ethyl 2-hydroxypropanoate (ethyl lactate)97-64-3A134713440.02<0.01<0.01
Ethyl octanoate (ethyl caprylate)106-32-1A143514350.700.06<0.01
Ethyl decanoate (ethyl caprate)110-38-3A163816400.33<0.01<0.01
Ethyl 2-phenylacetate (ethyl benzeneacetate)101-97-3C17831781<0.010.01<0.01
2-Phenylethyl acetate103-45-7A181318100.380.440.29
2-Phenylethyl butanoate (phenethyl butyrate)103-52-6B195819650.02<0.01<0.01
Octyl octanoate2306-88-9B20092014<0.010.030.11
Total <7.12<5.40<11.52
Alcohols
Ethanol64-17-5A9329316.540.150.27
2-Methyl-1-propanol (isobutanol)78-83-1A109210980.23<0.010.02
1-Butanol71-36-3A114211510.120.070.05
1-Penten-3-ol (ethyl vinyl carbinol)616-25-1B115911660.24<0.010.01
3-Methyl-1-butanol (isoamyl alcohol)123-51-3A120912111.570.650.32
1-Pentanol71-41-0A125012560.590.430.52
(Z)-2-Penten-1-ol1576-95-0B131813240.08<0.01<0.01
3-Methyl-2-buten-1-ol (prenol)556-82-1C132013240.050.030.02
1-Hexanol111-27-3A135513571.310.750.28
(E)-3-Hexen-1-ol928-97-2B13671370<0.010.02<0.01
(Z)-3-Hexen-1-ol928-96-1B138213870.09<0.01<0.01
(E)-2-Hexen-1-ol928-95-0B140514090.090.13<0.01
1-Octen-3-ol3391-86-4A145014541.990.110.05
1-Heptanol111-70-6B145314600.140.11<0.01
2-Ethyl-1-hexanol104-76-7A149114930.614.080.34
(E)-2-Hepten-1-ol33467-76-4C151715140.050.01<0.01
2,3-Butanediol isomer 1513-85-9C154315440.490.300.49
1-Octanol111-87-5A155715621.070.450.28
2,3-Butanediol isomer 224347-58-8C155615810.530.260.51
(E)-2-Octen-1-ol18409-17-1C161416170.160.01<0.01
2-Furanmethanol (Furfuryl alcohol)98-00-0B166016610.111.280.33
1-Nonanol143-08-8B166016650.680.030.10
5-Methylfurfuryl alcohol3857-25-8C17141725<0.010.420.02
3-(Methylthio)-1-propanol (methionol)505-10-2B17191721<0.010.010.08
2-Dodecanol10203-28-8C181318220.140.020.04
Phenylmethanol (benzyl alcohol)100-51-6B187018750.530.240.07
2-Phenylethanol (phenylethyl alcohol)60-12-8A190619120.630.280.16
1-Tetradecanol (myristyl alcohol)112-72-1C216521810.410.060.15
Total <18.45<9.90<4.11
Organic acids
Acetic acid64-19-7A1449144510.753.904.35
Formic acid64-18-6B150315060.050.050.10
Propanoic acid79-09-4B153515380.080.110.12
Butanoic acid107-92-6B162516280.010.010.01
3-Methylbutanoic acid (isovaleric acid)503-74-2B166616700.140.120.03
2-Methylbutanoic acid116-53-0C166216710.05<0.01<0.01
Pentanoic acid (valeric acid)109-52-4B173317370.120.040.02
Hexanoic acid (caproic acid)142-62-1A184618441.140.260.14
3-Methylhexanoic acid3780-58-3C-19540.160.030.01
Octanoic acid (caprylic acid)124-07-2A206020638.48<0.01<0.01
Nonanoic acid112-05-0C217121740.230.140.04
n-Decanoic acid (capric acid)334-48-5Β227622510.890.110.11
Total 22.10<4.77<4.93
Carbonyl compounds
Acetaldehyde75-07-0A702701<0.010.290.53
2-Methylpropanal (isobutyraldehyde)78-84-2B819130.143.390.60
Butanal (butyraldehyde)123-72-8B8778670.030.020.03
2-Butanone (methyl ethyl ketone)78-93-3B9078990.040.230.35
2-Methylbutanal96-17-3B9149080.598.732.63
3-Methylbutanal (isovaleraldehyde)590-86-3B9189111.6412.098.66
2,3-Butanedione (Diacetyl)431-03-8A9799705.910.925.43
Hexanal66-25-1A108310763.320.782.05
2-Methyl-2-butenal1115-11-3B10951089<0.010.05<0.01
2-Heptanone110-43-0B118211780.050.070.02
Heptanal (oenanthic aldehyde)111-71-7B118411790.17<0.010.09
2-Methyltetrahydrofuran-3-one (coffee furanone)3188-00-9B12681262<0.011.470.46
3-Hydroxy-2-butanone (acetoin)513-86-0A1284128121.522.293.95
Octanal124-13-0B128912840.210.150.07
1-Hydroxy-2-propanone (hydroxyacetone)116-09-6B13031293<0.010.270.15
2-Heptenal18829-55-5B132313190.210.01<0.01
6-Methyl-5-hepten-2-one110-93-0C133813350.090.030.01
2-Acetoxy-3-butanone (acetoin acetate)4906-24-5C137813810.100.01<0.01
1-Hydroxybutan-2-one5077-67-8B138813760.020.050.08
2-Nonanone821-55-6C13901387<0.01<0.01<0.01
Nonanal124-19-6B139113910.400.360.18
5-Ethyl-1-formylcyclopentene (Phoracanthal)36431-60-4C141014110.40<0.01<0.01
3-Octen-2-one1669-44-9C141114050.310.01<0.01
(E)-2-Octenal2548-87-0C142914260.16<0.01<0.01
2-Furfuraldehyde (furfural)98-01-1A146114593.3624.2138.24
Phenylmethanal (benzaldehyde)100-52-7A152015170.961.09<0.01
(E)-2-Nonenal18829-56-6C153415330.07<0.01<0.01
1-(2-Furyl)-1-propanone3194-15-8B15631576<0.010.110.09
(3E,5E)-3,5-Octadien-2-one30086-02-3C157015690.12<0.01<0.01
5-Methyl-2-furfural620-02-0B157015720.2510.676.03
1-(Furan-2-yl)butan-2-one4208-63-3C15841598<0.010.070.05
6-Methyl-3,5-heptadiene-2-one1604-28-0B160215910.27<0.010.01
Ethyl-1H-pyrrole-2-carboxaldehyde2167-14-8C161016050.143.302.66
1-Methylpyrrole-2-carboxaldehyde1192-58-1C16261620<0.010.200.20
Phenylacetaldehyde122-78-1C164016360.270.190.16
Acetophenone 98-86-2B16471646<0.01<0.010.10
2,4-Nonadienal6750-03-4C170017000.07<0.01<0.01
2-Acetylpyrrole1072-83-9B197319710.030.730.19
2-Hydroxyacetylfuran17678-19-2C199520030.150.140.27
2,4-Decadienal2363-88-4B179718050.10<0.01<0.01
1H-Pyrrole-2-carboxaldehyde (pyrrole aldehyde)1003-29-8B203020230.010.110.11
Total <41.11<71.75<72.87
Terpenes
a-Pinene (2,6,6-Trimethylbicyclo [3.1.1]hept-2-ene)80-56-8C10281018<0.010.020.03
D-Limonene (1-methyl-4-prop-1-en-2-ylcyclohexene)5989-27-5A120011850.390.150.10
Eucalyptol (1,3,3-trimethyl-2-oxabicyclo[2.2.2]octane)470-82-6B12131200<0.01<0.01<0.01
p-Cymene (1-Isopropyl-4-methylbenzene) 99-87-6B12721265<0.010.010.02
cis-Linalool oxide5989-33-3B14441447<0.010.230.12
trans-Linalool oxide34995-77-2C14521477<0.010.24<0.01
Linalool (3,7-dimethyl-1,6-octadien-3-ol)78-70-6A154715510.080.060.02
Fenchol (1,3,3-trimethylbicyclo[2.2.1]heptan-2-ol)1632-73-1B15821588<0.010.030.03
L-4-Terpineol (4-methyl-1-propan-2-ylcyclohex-3-en-1-ol)20126-76-5B15931606<0.010.060.03
β-Cyclocitral (2,6,6-trimethylcyclohexene-1-carbaldehyde)432-25-7C161116180.08<0.01<0.01
(-)-Menthol (5-methyl-2-(1-methylethyl)-cyclohexanol)2216-51-5C16331647<0.010.080.17
4-Ketoisophorone (2,6,6-trimethyl-2-cyclohexene-1,4-dione)1125-21-9C167616900.040.090.05
α-Terpineol [2-(4-methyl-3-cyclohexen-1-yl)-2-propanol]98-55-5A169717000.070.440.19
L-Borneol (1,7,7-trimethyl-bicyclo[2.2.1]heptan-2-ol)507-70-0B17021706<0.010.030.03
β-Damascenone23726-93-4C182318180.060.110.14
p-Cymen-8-ol (2-(4-methylphenyl)propan-2-ol) 1197-01-9C18521851<0.010.140.05
trans-Geranylacetone [(E)-6,10-dimethylundeca-5,9-dien-2-one]3796-70-1C18591853,90.090.060.10
trans-β-Ionone [(E)-4-(2,6,6-trimethyl-1-cyclohexen-1-yl)-3-buten-2-one]79-77-6C194019410.080.010.01
Total <0.89<1.74<1.06
Lactones
γ-Butyrolactone (dihydrofuran-2(3H)-one)96-48-0B163216211.921.101.80
β-Angelica lactone (5-methyl-2(5H)-furanone)591-11-7C166916740.030.010.02
γ-Hexalactone (dihydro-5-ethyl-2(3H)-furanone)695-06-7C169416980.040.030.01
γ-Crotonolactone (2(5H)-Furanone)497-23-4B17421750<0.010.040.01
2-Hexen-1,4-lactone (5-ethyl-2(5H)-furanone)2407-43-4C174517530.060.01<0.01
γ-Octalactone (5-Butyldihydrofuran-2(3H)-one)104-50-7C191019150.010.020.01
γ-Nonalactone (dihydro-5-pentyl-2(3H)-furanone)104-61-0C202420280.060.030.01
Total <2.121.24<1.86
Other compounds
Dimethyl sulfide (DMS)75-18-3B7547390.010.600.78
Furan B799793<0.010.050.01
2-Μethylfuran534-22-5B869861<0.010.030.01
2-Ethylfuran3208-16-0B9509430.040.040.02
1,4-Dioxane (IS)123-91-1 1055.5
2-Pentylfuran3777-69-3B123112200.220.080.02
2,6-Dimethylpyrazine108-50-9B13281327<0.010.03<0.01
2-Ethyl-6-methylpyrazine13925-03-6B138613850.040.040.06
2,3,5-Trimethylpyrazine14667-55-1B14021404<0.010.030.03
2,6-Diethylpyrazine13067-27-1C14441437<0.010.02<0.01
2,3-Dimethyl-5-ethylpyrazine15707-34-3C146014630.080.030.05
2,3,5,6-Tetramethylpyrazine (Ligustrazine)1124-11-4B146914770.030.040.01
2-Acetylfuran (2-furyl methyl ketone)1192-62-7B149915000.163.441.75
2-Acetyl-5-methylfuran1193-79-9C16061611<0.010.03<0.01
Guaiacol (2-Methoxyphenol)90-05-1B18611856<0.010.03<0.01
Benzothiazole95-16-9C19581953<0.010.02<0.01
Total <0.573.91<1.96
Hydrocarbons (alkanes/alkenes)
Hexane110-54-3A6006005.910.050.14
Heptane142-82-5A7007000.35<0.01<0.01
Octane111-65-9A8008000.330.020.01
Nonane111-84-2A9009000.07<0.01<0.01
Decane124-18-5A10009990.10<0.01<0.01
Dodecane112-40-3A120012000.32<0.01<0.01
Tetradecane629-59-4A140014000.460.010.02
Hexadecane544-76-3A160016000.060.030.01
Total 7.6<0.11<0.18
CAS: Chemical Abstracts Service registry number. RI: Retention Index. RIref: The reference RIs were obtained from the NIST14 library, where they are displayed as the experimental RI median value taken from various sources in the literature. RID: Reliability of identification. RID levels: A, agreement of RI and MS spectra with those of an authentic compound analyzed under identical conditions. B, agreement of RI (ΔRI < 20) and MS (match > 900). C, at least ΔRI < 20 or MS similarity match > 800. FSS: Corinthian currant finishing side-stream. BrST: Brown syrup with tartrate. BlST: Blonde syrup with tartrate.
Table 3. Microbiological load (cfu/g) of the brown and blonde syrups made from the FSS, and comparison with similar commercial products.
Microbial GroupMonthSyrup Type
BrSTBrSBlSTBlS
TMB1<102<10212 × 103 ± 3 × 10³<102
3<102<1027 × 103 ± 3 × 10³<102
Yeasts1<102<1029 × 103 ± 2 × 10³<102
3<102<102104 ± 3 × 10³<102
Molds1<102<102<102<102
3<102<102<102<102
Enterobacteria1<102<102<102<102
3<102<102<102<102
TMB: Total mesophilic bacteria. BrST: Brown syrup with tartrate. BRS: Brown syrup with reduced tartrate. BlST: Blonde syrup with tartrate. BlS: Blonde syrup with reduced tartrate. EC: E. coli. C: Coliforms.
Table 4. Sensory evaluation of the FSS syrups and typical Greek commercial raisin/grape syrups.
SyrupTasteAftertasteMetallic AftertasteAromaColorClarity
BrST3.3 ± 0.8; raisin, typicalLongNo3.9 ± 0.8; RaisinBrown, honey-likeSlightly cloudy
BrS3.8 ± 0.8; honey-likeMediumNo3.8 ± 1.4; RaisinBrown-red, honey-likeClear
BlST3.2 ± 1.3; sweet-sourLongNo3.6 ± 0.4; RaisinGolden yellowClear
BlS4.3 ± 1.0; honey-likeLongNo2.9 ± 1.1; RaisinOrange-yellow, amberCloudy
CGS2.8 ± 0.9LongNo3.0 ± 1.0; RaisinDark brownCloudy
Preference scale 1–5: 1—Unacceptable, 2—Bad, 3—Good, 4—Very good, 5—Excellent. BrST: Brown syrup with tartrate. BrS: Brown syrup with reduced tartrate. BlST: Blonde syrup with tartrate. BlS: Blonde syrup with reduced tartrate. CGS: Commercial grape syrup (petimezi).
Disclaimer/Publisher’s Note: The statements, opinions and data contained in all publications are solely those of the individual author(s) and contributor(s) and not of MDPI and/or the editor(s). MDPI and/or the editor(s) disclaim responsibility for any injury to people or property resulting from any ideas, methods, instructions or products referred to in the content.

