Abstract
The potential effect of implementing environmental regulations on economic growth has been a controversial issue for a long time. Environmental regulations may impact on economic growth by reconstructing the economic structure. With the intention of exploring the nature of this mechanism, it is important to understand the internal inter-relation of the three parties, requiring data from a large economy experiencing the transition in economic structure. This paper selects panel data for 30 provinces in China from 2008–2019, constructs a PVAR model, and empirically examines the dynamic relationship among environmental regulation, economic structure reconstruction, and economic growth. The results demonstrate that there is a two-way effect between environmental regulation and economic growth. In other words, environmental regulation has a “U” shape effect on economic growth, which first inhibits and then promotes economic growth, while economic growth has a strong and then weak promotion effect on environmental regulation. Economic growth has a short-term negative impact on economic structure reconstruction, whereas economic restructuring has a long-term beneficial impact on environmental regulation. Therefore, the government should reasonably set the intensity of regulation and optimize the path of economic restructuring to deal with the relationship between environmental regulation, economic structure reconstruction, and economic growth.
1. Introduction
The conflict between environmental protection and economic development has been one of the primary topics for developing countries. Unlike in developed countries, the driven forces of the economy in developing countries are industries relying on the low cost of human and natural resources, which generates significant environmental problems. Policy makers are always cautious about imposing national-wide environmental regulations with concern about the potential negative effects on economics. Environmental governance is the inescapable step for developing countries on the path to the developed phase. Recalling the processes developed countries have gone through, the optimization of economic structure constitutes an important change in the improvement of the environment. There are broad implications for exploring the intrinsic mechanism between environmental regulations, economic development, and the evolution of economic structure. However, the transformation of economic structure in most developed countries occurred before the 21st century, when environmental issues are less important and presented in different forms compared to those nowadays. For the purpose of a broader reference for most developing countries, a recent case is better for study. A number of typical recent studies of related topics were reviewed for the scope of economies included (Table 1). Few of these studies consider the ongoing transition of the development stage as a critical factor in target selection. China is the ideal case, where the environment improves with an ongoing national-wide upgrading of industries. As one of largest developing countries, the analysis of the impact of environmental regulations on industrial modernization in China provides empirical lessons to other developing countries.

Table 1.
Related literature by targeted areas.
Previous research has examined the relations with any pair between the three factors, i.e., environmental regulations, economic structure, and economic growth. Evidences illustrate that the economic structure contribute both positive and negative impacts to the economic growth. The majority of research supports that environmental regulations promotes the economic development. As it is observed that environmental regulations significantly shape the economic structure, this suggests that environmental regulations can raise the level of the economy in developing countries by rebuilding industries. It is necessary to include the three factors in the research scope in order to understand how environmental regulations work on the economic structure and subsequent economic growth. Few previous studies did so. In addition, most previous studies merely investigated the unidirectional causality between the three factors, missing the potential two-way causality. In this paper, panel vector autoregression (PVAR) was employed to explore the dynamic mechanism of the above three factors with two-way causality tests, based on a data panel of 30 Chinese provinces for 2008–2019.
Previous research has examined the relations with any pair between the three factors, i.e., environmental regulations, economic structure, and economic growth. Evidences illustrate that the economic structure contributes both positive and negative impacts to the economic growth. The majority. of research supports that environmental regulations promote the economic development. As it is observed that environmental regulations significantly shape the economic structure, this suggests that environmental regulations can raise the level of the economy in developing countries by rebuilding industries. It is necessary to include the three factors in the research scope in order to understand how environmental regulations work on the economic structure and subsequent economic growth. Few previous studies did so. In addition, most previous studies merely investigated the unidirectional causality between the three factors, missing the potential two-way causality. In this paper, panel vector autoregression (PVAR) was employed to explore the dynamic mechanism of the above three factors with two-way causality tests, based on a data panel of 30 Chinese provinces for 2008–2019.
2. Background
2.1. Mechanism of Environmental Regulations on Economic Growth
Various previous studies discussed the relation between environmental regulations and economic development. Economic structure was believed as an intermediate factor, forcing the regional economy to react to environmental regulations. It was found that the consequence of environmental regulations to economic development relies on the economic structure. A positive consequence comes up with a robust economic structure [10,11,12]. Several explanations were provided to elaborate the mechanisms of how environmental regulations work on economic development by changing the economic structure [13,14]. The early explanation considered environmental regulations as a raising cost to production, which obviously limit the development of the economy [15,16]. Thereafter, led by “Porter Hypothesis” [17], some scholars proposed a positive mechanism by empirical studies, where environmental regulations were performed as an incentive to manufacturers in upgrading their current structure [18]. Pollution intensive firms had to either upgrade their technology to reduce pollution or shift to other areas with liberal regulations in accordance with the pollution haven hypothesis. With the implementation of more technological upgradation in the manufacturing sector, massive firms were going to turn to the tech-driven business from the resource-driven business, which indicated an upcoming reconstruction of the economic structure. During the reconstruction, most resource-firms with outdated technologies were going to diminish, as they failed to collect enough profits for upgradation or transformation after the implementation of environmental regulations [19]. This may not happen with the existence of strict environmental regulation, as only external compulsory measures could raise firms’ attentions to environmental cost [20]. Strict environmental regulations could be a firewall preventing the behaviors of sacrificing the long-run benefits for short-run incomes [1,2]. In reference to the past success of the industrial evolution, tech-firms always occupied the profitable positions in global industrial chain, bringing more income to the regional economy and accelerating the growth of the service business. In addition, tech-firms usually sustained higher environmental standards. These standards could not only satisfy the requirement of environmental regulations, but also make up shadow entry barriers of the market for contenders outside the economy. Most firms surviving the reconstruction would obtain more resilience power to counter the instability and risk from fluctuations in the future market [21]. This phenomenon was concluded to be “Innovation Compensation”, a fact appearing only under intensive regulation [22]. Another notable research finding is that an economy could obtain a long-term development by imposing regulations to the current environmental damages derived from international trading [3].
After major driven force changed from the manufacturing to service sector, the economy would rise significantly on the reconstruction of economic structure [23]. However, there was a disputed issue in this speculation, which was whether environmental regulations could stimulate the change from resource-firms to tech-firms. It was argued that this transformation under stimulation would occur only under certain conditions, where environmental regulations were appropriate and effective for the reality of the economic structure [24]. This means the effects of environmental regulations would present heterogeneity for different regions with various economic conditions, which was displayed by the results of Du et al. 2021 [20].
Others proposed the non-linear effect of economic reconstruction on the economic growth, since some empirical studies found that industrial upgradation would be harmful rather than beneficial to economic growth [25]. The above contradictory findings were suggested as the early stage of a “U” shape relation between industrial upgradation and economic growth [26,27]. The “U” shape speculation was supported by finding that economic growth would only take place after passing a certain threshold [28], which was suggested as a turning point of the regional income per capital at USD 8000 by the World Bank in 1992 [29]. The threshold was also noticed in a recent research [4], where the development of financial markets is found to improve the environmental quality only after their regions becoming high-income economies.
A number of empirical studies partially proved the above speculations. After sacrificing environmental quality for economic development for a long time, the emerging impairment to the Chinese economy was found. This finding supported the impose of sustainable environmental regulations, which would provide more benefits rather than losses in economic development [30]. A typical example was demonstrated with the impact of trading regulations on life expectancy in China [5]. Zhang et al. [12] illustrated the benefits of environmental regulations on the improvement of economic structure with time lags. Heavy manufacturing industries, such as the steel industry, would elevate productivity with the implementation of environmental regulations [31]. The cost of environmental regulations could be classified as one component of natural capital [32], which generates inclusive growth of the regional economy along with other potential determinants [33,34].
Most previous literature tried to approach the nature of the mechanism by figuring out the process of how environmental regulations worked on economic structure or how environmental regulations affected the economic growth. Few focused on building an integrated mechanism by including all three parties: environmental regulation, economic structure, and economic growth.
2.2. Environmental Regulations
Environmental regulations refer to laws and policies employed by the government to regulate the pollution from activities in society as well as measures adopted by local authorities [35]. After the “Earth Summit” on global environment and development in 1992, majority nations consider environment protection as one of the basic duties in administration. Environmental regulations are fundamental measures to treat pollution and other hazardous behaviors [36]. Since the pollution reduction may not spontaneously occur with the growth of the economy, additional measures are needed to be imposed to constrain the spreading pollution during the expansion of the industrial sector in the economic structure.
Environmental regulations are such policy and law measures widely designed for curbing the pollutant emissions and polluting behaviors. In accordance with the Kuznets Curve (EKC) proposed by Grossman and Kreuger [37], the implementation of environmental regulations could help the regional economy reached the peak of the Kuznets Curve earlier at a relative lower pollution level.
Environmental regulations could be categorized into three general groups by driven forces [38]. The first group are mandatory regulations published by authorities, e.g., policies laws, rules, standards, and other measures listed by authorities’ mandates, which are designed for controlling the pollution by imposing negative consequences and extra cost to polluting sources. U.S. Clean Air Act and Chinese Environmental Protection Law are typical mandatory regulations in this group. Regulations in this group are clear in targets, operational procedures, evaluation standards, and punishments after violations [39]. These distinct contents are straightforward for officers to execute and for society to understand.
The drawback of mandatory regulations is the expensive cost while implementation, and they are difficult to be quantified directly. Similar to taxation, a large number of people and a big investment for enforcement equipment are necessary to ensure the effect of mandatory regulations [40]. Further expenditure is continuously required to sustain an expanding systematic network of monitoring, reporting, and verification (MRV), since the entities in the economy increase with the economic development. The intensity of mandatory regulation may not be able to quantified by analyzing the descriptive text in the documents, but may indirectly to be measured by counting the enforcement cases or the amount of violation fines.
The second group are those with market instrument that are profit driven. In the opposite of mandatory regulation, market instrument provides a scheme to allow entities to gain extra income by cutting the potential emissions [41], a positive consequence for pollution reduction. The market instruments are designed following by the theory proposed by Pigou [42], in which polluters were hypothesized to prefer controlling the pollution with a minimum marginal cost of pollution reduction. These instruments are substantiated in many forms, e.g., emission trading and subsidies for pollution reduction [43], which are widely proved effective in market practice. Established in 2005, European Union Emission Trading Scheme (EU ETS) is one renowned example of successful market instruments efficiently reducing large quantities of greenhouse gas (GHG) emissions as well as other pollutants. Associated with EU ETS, Clean Development Mechanism (CDM) under the United Nations Framework Convention for Climate Change (UNFCCC) promoted the largest proactive GHG reduction in developing countries by providing incentive compensations from the carbon market. The advantage of market instruments is the low cost for society and environmental administrations with high enthusiasm in reduction actions for polluters.
The low cost of market instruments refers only to the direct expenditures for firms and government; however, the operation of such instruments always needs an extra big investment to sustain a network of MRV. The prominent drawback is the ambiguous reduction result, since the total expected reduction from the market may fluctuate, as individual entity’s decision is random and cannot be predicted accurately. This vague target may not meet the need of policy makers when a certain and explicit number of reductions are set by obligation.
The third group are those voluntary standards proposed by industries and their associations for the purpose of obtaining competitive advantages. Standards from mandatory regulations are the bottom lines in environmental governance, which have to be executed thoroughly by any entity in the economy. Large firms with advanced technologies reserved usually benefit from these standards due to the limited cost compared to income, while small firms may have to spend a large proportion of income on fulfilling the standards. Firms benefiting from the standards would like to enhance their competitive advantages by raising the standards higher. In this case, voluntary standards are designed by unions or associations of these firms. The validation of voluntary standards in the market competition is under various forms, such as the product label, production certification, and other propaganda movements. Voluntary standards cost little but contribute little correspondingly, generating limited impact on pollution reduction.
3. Current Status
3.1. Analysis of the Current Situation of Environmental Regulations
The most direct and effective way to regulate environmental issues is to combat environmental pollution, which requires adequate capital investment. At the national level, during the period of 2008–2019, the annual average value of the total investment in environmental pollution control as a share of GDP in China reached 1.4, indicating the importance and determination of the Chinese government to ensure capital investment to effectively curb the deterioration of environmental pollution (Figure 1). After 2014, with the gradual improvement of China’s environmental quality and the accelerated pace of economic structural upgrading, the share of total investment in environmental pollution control to GDP started to decline and stabilized at around 1.2%.
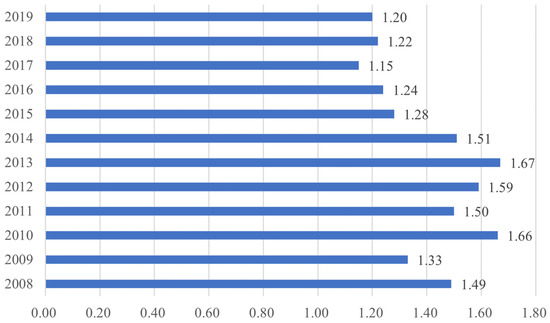
Figure 1.
Total national investment in environmental pollution control as a share of GDP. (Unit: %; data from China Environmental Statistics Yearbook).
Looking at the regional level, during the period 2008–2019, the investment amounts in industrial pollution and environmental treatment in the three major regions of China (east, west, and northeast) all basically demonstrated a trend of first increasing and then decreasing, with only four provinces in the central region (Shanxi, Anhui, Henan, and Jiangxi) showing fluctuating growth in investment (Figure 2). In eastern coastal areas, due to the transfer of polluting industries to the central region, the amount of industrial pollution control investment decreased. The western and northeastern regions are mainly due to the significant increase in government environmental regulations and environmental governance. This makes industrial environmental pollution reduction difficult. The amount of investment in governance has decreased. The four provinces of Shanxi, Anhui, Henan, and Jiangxi in the central region have taken over the transfer of some polluting industries, as well as their own industrial structures, relying excessively on heavy industries such as energy extraction, resulting in the difficulty of regional industrial pollution and environmental treatment, and the investment amount has demonstrated a fluctuating increase. This shows that China attaches great importance to the environmental pollution problems brought about by rapid economic development, and all regions have invested a lot of money in industrial pollution control; most provinces have achieved certain results in industrial pollution control.
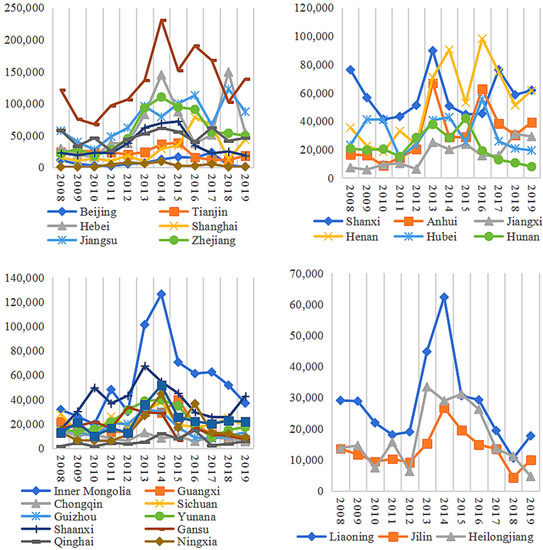
Figure 2.
Environmental treatment of industrial pollution in the four major economic regions. (Unit: dollars; data from China Environmental Statistics Yearbook).
In terms of specific provinces, the report of the 19th National Congress of the Communist Party of China clearly puts forward “accelerating the reform of the ecological civilization system and building a beautiful China”, which puts forward more stringent requirements for the environmental governance performance of each province. From the average value of the total investment in environmental pollution control as a percentage of GDP in each province from 2008 to 2019 (Figure 3), Xinjiang, Ningxia, and Inner Mongolia, three provinces have the largest share of total investment in environmental pollution control, Shanxi and Beijing have the second largest share of total investment in environmental pollution control, and Guangdong Province has the lowest share of total investment in environmental pollution control. This may be due to the fragile ecological environment of Xinjiang, Ningxia, and Inner Mongolia, the high cost of environmental pollution control, and the fact that the Chinese government has placed a high priority on ecological control in its western development strategy and has invested a lot of labor, material, and financial resources in environmental pollution control and ecological environmental protection; Shanxi Province originally developed a resource-based economy, and its industrial structure was severely tilted, and excessive resource exploitation led to ecological damage and serious environmental pollution. Shanxi Province has started to focus on ecological civilization construction and significantly increase the intensity of environmental regulation in the province. Beijing, due to its rapid economic development and the large proportion of high energy-consuming enterprises, has led to serious air pollution, and the government pays attention to ecological environment improvement and increases the management of related pollution. From the above analysis, it is clear that the intensity of environmental regulations in each province is highly related to the ecological and environmental conditions, economic growth, and structural characteristics of the province.
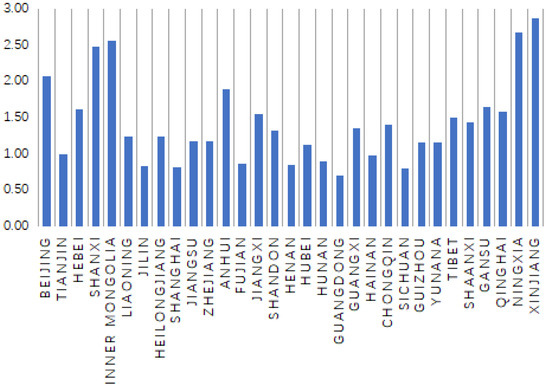
Figure 3.
Total investment in environmental pollution control as a share of GDP by province. (Unit: %; data from China Environmental Statistics Yearbook).
3.2. Analysis of the Current Situation of Economic Structure Reconstruction
With the continuous development of China’s economy, the process of economic re-structuring, transformation, and upgrading is also gradually advancing. The current status of China’s economic structure reconstruction can be comprehensively analyzed by using three indicators: the output value of the three major industries; the ratio of output values of the three major industries; and the ratio of employed persons in the three major industries.
According to Figure 4, it can be observed that the three major industries in China developed well and were in growth during 2008–2019. Among them, the tertiary industry developed particularly rapidly, from an output value of 196,9.31 billion dollars in 2008 to 776,2.71 billion dollars in 2019, which is a total increase of 3.9 times, higher than the growth rate of the primary and secondary industries; the secondary industry developed at the second fastest rate, from a fluctuating output value of 215,8.21 billion dollars in 2008 to 551,9.61 billion dollars in 2019, with a total increase of 2.5 times; the primary industry output value grew relatively slowly, with an increase of 2.2 times from 467.24 billion dollars in 2008 to 102,1.81 billion dollars in 2019. This indicates that in recent years, with the accelerated pace of economic restructuring and industrial upgrading, China has demonstrated a trend of high growth in the tertiary industry and steady progress in the primary and secondary industries in terms of economic structure.
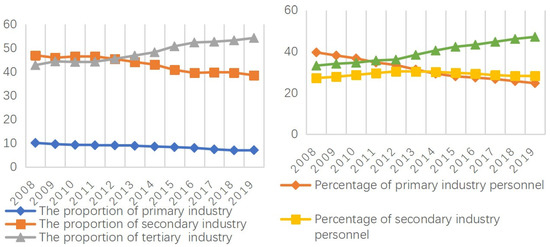
Figure 4.
National value added of the three major industries. (Unit: billion dollars; data from EPS database).
The tendency of China’s economic structure reconstruction is more prominent in terms of the share of three major industries in GDP. As can be observed from Figure 5, both the share of primary and secondary industries are in a declining trend, while the share of tertiary industries is on a rapid rise. Specifically, the proportion of output value of the secondary industry was the highest from 2008 to 2012, followed by the tertiary industry, and the primary industry accounted for a smaller proportion. From 2012 to 2019, the proportion of the tertiary industry exceeded that of the secondary industry and became the industry with the highest proportion. Moreover, after 2015, the proportions of the tertiary industry all exceeded 50%. It can be observed that China’s economic structure reconstruction has achieved remarkable results and gradually shifted from the original secondary industry as the leading industry to an economic structure supported by the tertiary industry.
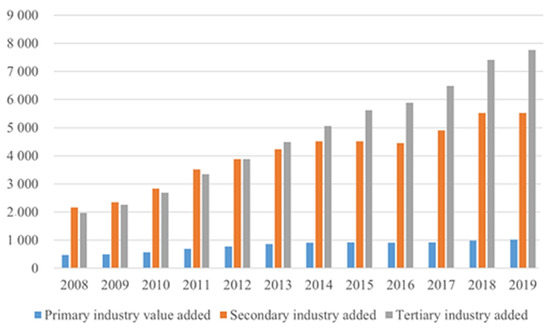
Figure 5.
The proportion of GDP and the proportion of employees in the three major industries. (Unit: %; data from EPS database).
From the perspective of the employment ratio of the three major industries, the employment ratio of the primary industry gradually decreased from the highest of 39.6% in 2008 to the lowest of 24.0% in 2019, and the labor force continuously flowed out of the primary industry. The employment ratio of the secondary industry demonstrated a trend of rising and then declining with the stage of industrial restructuring, remaining in the range of 25–30%, as the labor force flowed out of the primary industry and gradually shifted to the secondary industry, while the proportion of employed people in the tertiary industry showed rapid growth, from 33.2% in 2008 to 47.1% in 2019, gradually approaching 50%.
With the rapid development of the tertiary industry, the employment attractiveness of the tertiary industry has also risen rapidly, and has now become the main industry of employment in China.
4. Methodology
4.1. Data and Variables
4.1.1. Environmental Regulations
There are two major approaches to quantify the level of regional environmental regulations. First, use the emission intensity of pollutants as an alternative indicator. It implies that strict environmental regulations reduce the emissions intensity of pollutants. The more severe regulations are, the less emissions produced. Second, use the investment in pollution control as an alternative indicator. The investment refers to the money from both public and private sectors, partially implying the local’s aspiration against pollution and responding measures to local environmental regulations. In this paper, investment in pollution control is selected to measure the level of local environmental regulations.
4.1.2. Economic Structure Reconstruction
The reconstruction of the regional economic structure is a dynamic process of evolution, difficult to be measured by any single indicator. According to Gan et al. [44], we build an entropy to estimate the general level of reconstruction of economic structure under following steps:
Calculate the Theil Index for yield and labor in any industry. Prior to estimating the entropy of industrial reconstruction, the level of industrial development and the degree of coordination of each industry must be measured. Theil index is the indicator to measure the rational proportion of labor to the associated yield in each industry, illustrating how coordinated the current economic structure is. The Theil index is given by the Equation (1).
where is short for Theil Index, is the industrial yield in RMB (Chinese Currency), and stands for labor.
- Calculate the reconstruction potential of regional industries. In accordance with the process developed countries went through, economic grows with increased service sector’s proportion and decreased manufacturing sector’s proportion. The ratio of the industrial yield from the service sector to the yield from the manufacturing sector implies the potential of an adjustment in structure, given as below.
- 2.
- Calculate the entropy of the reconstruction of economic structure. Since the value from a specific industry may vary greatly in number and unit, it is required to standardize the value to avoid the disturbance. Weights for indicators are given by the extent of polarization to a specific indicator.
For positive values:
where refers to indicator’s value, refers to standardized value, stands for the evaluation index, and stands for region.
For negative values:
To avoid that the “0” value generated after standardization and cause calculating problems subsequently, let ,then calculate the proportion of the evaluation index j of region i.
where is the proportion value.
- 3.
- For the entropy of the reconstruction of economic structure and the associated redundancy:
- 4.
- For the weights by redundancy in a given sector:
- 5.
- For the coordinate indicator in a given region.
4.1.3. Economic Growth
Most previous studies used domestic gross production (GDP) or GDP per capital to measure the level of economic growth. Given the level difference of individual region, GDP per capital is used.
4.2. Data Source
Data were selected from annual provincial statistics, annual environmental statistics, and Express Professional Superior database, covering 30 major provinces in China from 2008 to 2019. Missing values are supplanted by averaging neighbor values. All values are treated to logarithmic form with price deduction. lnENR is the natural logarithmic form of environmental regulations; lnIND is the natural logarithmic form of economic structure reconstruction; lnPGDP is the natural logarithmic form of GDP per capital. Statistical results are shown in Table 2:
Table 2.
Descriptive statistics.
4.3. Quantitative Model
The PVAR model analyzes the interaction between endogenous variables of panel data, analyzing the vector autoregression of panel data. In this model, all variables are uniformly regarded as endogenous variables, and analyzed for the relationship between variables and their lagged substitutes, which not only avoids the endogeneity problem caused by omitted variables but also includes the individual and time effects with robust estimations of the mutual dynamic relationships among variables. Therefore, for this paper, the PVAR model is used to study the dynamic relationship between environmental regulation, economic structure reconstruction, and economic growth. The specific model is constructed as follows:
where is province, is year, stands for lag order, is a three dimensional vector consisted of lnENR, lnSTR, and lnPGDP, is constant, is coefficient matrix, stands for individual effect, stands for time effects, and is the residuals.
5. Empirical Analysis
5.1. Panel Stationary
To minimum the potential effects of spurious regression, both the Harris-Tzavalis test and Levin-Lin-Chu test were applied to examine the existence of unit root (Table 3). Given any unit root, all variables were tested for another round after first-order difference. The PVAR model was operated on the condition that test results of all variables significantly rejected the null hypothesis of unit root existence at 1% level.
Table 3.
Unitroot test.
5.2. Cointegration Test
After the unit root test, the cointegration test is conducted on the panel data after the first-order difference to examine whether there is a long-term cointegration relationship between the data. In this paper, both the Kao test and the Pedroni test are used, and the test results significantly reject the original hypothesis of “no cointegration” at a 99% confidence level, which indicates that there is a long-term cointegration relationship between the variables and the data can be used for model construction (Table 4).
Table 4.
Cointegration.
5.3. Granger Causality
The mutual relation between environmental regulations, economic structure, and economic growth is measured by Granger Causality. [id = A1] The results are demonstrated in Table 5 and Figure 6. The results are shown in Table 3.
Table 5.
Granger Causality test.
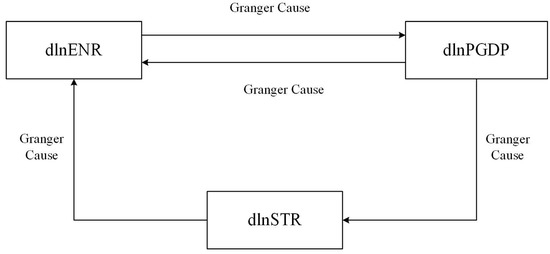
Figure 6.
Granger Causality test.
As can be observed from Table 5, both environmental regulation and economic growth reject the original hypothesis at the 1% significance level, i.e., there is a strong two-way Granger causality between them. The results indicate that the implementation of environmental regulation brings growth in economy by changing the production cost and production efficiency of firms. At the same time, patterns in economic growth result in the varying intensities of measures under different environmental regulations. There is only a one-way Granger causality between economic structure reconstruction and environmental regulation, i.e., economic structure reconstruction is the Granger cause of environmental regulation, and the continuous adjustment of economic structure reconstruction leads to a corresponding change in the mode and intensity of environmental regulation. The relationship between economic growth and economic structure reconstruction is also a one-way Granger causality, that is, economic growth is the Granger cause of the development of economic structure, and the difference in the driving modes of economic growth causes the continuous adjustment and optimization of the economic structure.
To further verify the dynamic causal relationships between the three factors, GMM estimation, impulse response analysis, and variance decomposition are required to analyze each pair of any two combinations.
To further verify the dynamic causal relationships between the three factors, GMM estimation, impulse response analysis, and variance decomposition are required to analyze each pair of any two combinations.
Generalized method of moments (GMM) is employed to explore the dynamic relation between environmental regulations, economic growth, and economic structure by impulse response and variance decomposition.
5.4. Lag Order
One important precondition is the optimization of lag order selection. There are three primary types of information criterion for GMM lag setting, i.e., Minimum Bayesian Information Criterion (MBIC), Minimum Akaike Information Criterion (MAIC), and Minimum Quasi Information Criterion (MQIC). After comparing results of all three types of criterion within 3 lag order, lag order sets to 2 for a better fit in most criterion, i.e., MAIC and MQIC (Table 6). In contrast, lag order 1 provides a good fit only in MBIC and lag order 3 has none.
Table 6.
Lag order selection.
5.5. Stationary Test
Since the stationary of the GMM model is required for executing detailed analysis by impulse response, a stationary test was applied to the eigenvalues of dynamic matrices in PVAR model. As shown in Figure 7, the magnitudes of all eigenroots are within the 1 unit radius circle, which indicates that the PVAR model is stationary with a good fit at lag order 2.
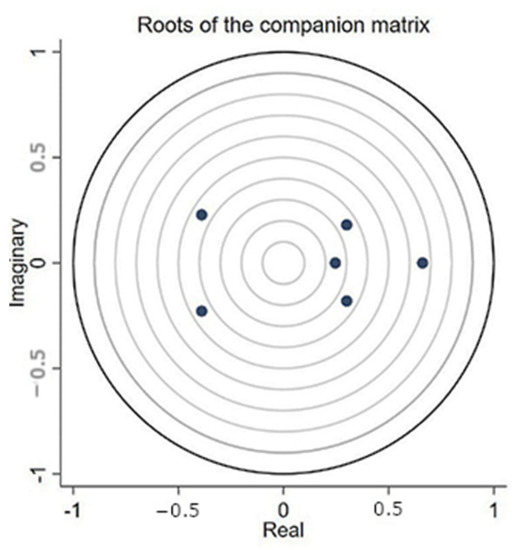
Figure 7.
Stationary test for impulse response.
5.6. GMM Estimation
The potential individual effect and fixed effect are excluded by Helmert procedure.
Table 7 describes the results from GMM estimations at lag order 2 with data of 30 provinces in China.
Table 7.
GMM Estimations.
From the results (Table 7), environmental regulations suppress itself with one period lag but exert minor suppression with two period lags. The two-period lag of economic growth imposes a significantly positive effect on environmental regulations. Significantly positive values are found in economic structure’s self-interference at one period lag while the negative is found at a two-period lag. Economic growth presents a significantly self-driven attribute with positive values at both one- and two-period lags. Given the all negative numbers in the value of environmental regulations to economic growth, it infers that environmental regulations hamper the growth of economics.
5.7. Impulse Response
The GMM estimation results only demonstrate the static relationship between the variables of the model. In order to further dynamically analyze the interaction between environmental regulation, economic structure reconstruction, and economic growth, this section performs 200 Monte Carlo simulations of the impulse responses of the main variables over a time span of 1–10 periods, and the results are shown in Figure 8.
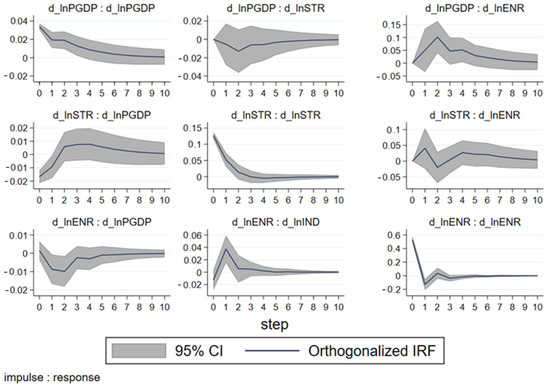
Figure 8.
Impulse response.
The first row of Figure 8 shows the impact of economic growth on itself, economic structure reconstruction, and environmental regulation when economic growth is used as a shock variable. The positive impact of economic growth on itself shows a decreasing trend in periods 1–10 and approaches zero in period 10, i.e., the impact on itself basically disappears, which indicates that economic development has the inertia characteristic of lagging. The impact of economic growth on economic structure reconstruction is negative and reaches its maximum in the second period, probably because although economic growth shows an increase in the output value of each industry, the unreasonable structure among industries has not been completely improved, and the economic structure still deviates from the equilibrium level. The negative impact gradually disappears in the seventh period. The positive effect of economic growth on environmental regulation as a whole has an inverted “U” shape, with the positive response rising rapidly to the maximum in periods 1–2, fluctuating down after period 2, and disappearing after period 9. It shows that the stage of economic development determines the intensity of environmental regulations, and the initial crude growth pattern characterized by high consumption determines that environmental regulations should have sufficient intensity, while as the economic growth reaches a certain level, environmental regulations are driven to shift from high intensity to high efficiency.
The second row of the Figure 8 depicts the impact of economic structure reconstruction as a shock variable on economic growth, self, and environmental regulation. The impact of economic restructuring on economic growth is negative in period 1 and positive in periods 2–10. For a developing country such as China, economic restructuring will certainly distort the existing resource allocation at the initial stage, leading to a phase of internal structural incoherence of the economy and reducing the efficiency of resource allocation, thus having a negative impact on economic growth. However, with the continuous adjustment and optimization of economic structure and the transformation of the driving mode of economic growth, the positive spillover effect of science and technology innovation drive and the synergistic effect of economic structure upgrading will effectively play a positive role in promoting economic growth. However, with the continuous adjustment and optimization of economic structure and the transformation of the economic growth driving mode, the positive spillover effect of the science and technology innovation drive and the synergistic effect of industrial structure upgrading can effectively play a positive role in economic growth. The self-promoting effect of the economic structure shows a rapid decline in periods 1–3, which have strong economic inertia, and the inertia disappears after period 3. The short-term impact of economic restructuring on environmental regulation is positive in period 1, turns negative in period 2, continues to be positive after period 3, and the intensity of the impact decreases slowly before showing a weak positive impact that tends to stabilize in period 10. This indicates that the impact of industrial restructuring on environmental regulation fluctuates in the short term, but from the perspective of long-term dynamics, economic restructuring has a facilitating effect on environmental regulation, which may be due to the fact that the policies that promote the adjustment, optimization, and transfer of pollution-intensive industries are more manifested as environmental regulation measures than industrial policies, and with the adjustment of pollution-intensive industries, the positive environmental structure effect gradually appears, and the effect of economic structure on the intensity of environmental regulation will gradually decrease.
The third row shows the impact of environmental regulation as a shock variable on economic growth, economic structure reconstruction, and itself. The impact of environmental regulation on economic growth shows a non-linear “U” shape, i.e., it has a negative effect until 5 periods, and after 5 periods, it turns to a weak positive effect and gradually disappears. This indicates that the environmental scale effect of China’s economic growth still occupies a large proportion of the total environmental effect, and environmental regulation suppresses the scale effect and also suppresses the scale growth of some industries. In the initial stage, the environmental regulation measures implemented force enterprises to pay for pollution control or production improvement, and the increase in production cost has a negative impact on the production efficiency of enterprises in the short term. With the improvement of enterprises’ pollution control ability and production improvement, the environmental technology effect of economic growth begins to appear gradually, and the negative effect of environmental regulation on economic growth gradually decreases and eventually turns positive. The positive impact of environmental regulation on economic restructuring reaches its maximum in period 1, then declines rapidly, and the impact basically disappears after period 7, which indicates that the implementation of environmental regulation restricts the development of highly polluting and energy-consuming industries and promotes the adjustment and optimization of the economic structure to a certain extent. The impact of environmental regulation on itself is negative in period 1, turns positive in period 2, declines to negative in period 3, and the impact gradually disappears. This indicates that the environmental regulation has some self-inhibition, and this inhibition effect will gradually weaken.
The first row of Figure 8 shows the impact of economic growth on itself, economic structure reconstruction, and environmental regulation when economic growth is used as a shock variable. The positive impact of economic growth on itself shows a decreasing trend in periods 1–10 and approaches zero in period 10, i.e., the impact on itself basically disappears, which indicates that economic development has the inertia characteristic of lagging. The impact of economic growth on economic structure reconstruction is negative and reaches its maximum in the second period, probably because although economic growth shows an increase in the output value of each industry, the unreasonable structure among industries has not been completely improved, and the economic structure still deviates from the equilibrium level. The negative impact gradually disappears in the seventh period. The positive effect of economic growth on environmental regulation as a whole has an inverted “U” shape, with the positive response rising rapidly to the maximum in periods 1–2, fluctuating down after period 2, and disappearing after period 9. It shows that the stage of economic development determines the intensity of environmental regulations, and the initial crude growth pattern characterized by high consumption determines that environmental regulations should have sufficient intensity, while as the economic growth reaches a certain level, environmental regulations are driven to shift from high intensity to high efficiency.
The second row of the Figure 8 depicts the impact of economic structure reconstruction as a shock variable on economic growth, self, and environmental regulation. The impact of economic restructuring on economic growth is negative in period 1 and positive in periods 2–10. For a developing country such as China, economic restructuring will certainly distort the existing resource allocation at the initial stage, leading to a phase of internal structural incoherence of the economy and reducing the efficiency of resource allocation, thus having a negative impact on economic growth. However, with the continuous adjustment and optimization of economic structure and the transformation of the driving mode of economic growth, the positive spillover effect of science and technology innovation drive and the synergistic effect of economic structure upgrading will effectively play a positive role in promoting economic growth. However, with the continuous adjustment and optimization of economic structure and the transformation of the economic growth driving mode, the positive spillover effect of science and technology innovation drive and the synergistic effect of industrial structure upgrading can effectively play a positive role in economic growth. The self-promoting effect of the economic structure shows a rapid decline in periods 1–3, which have strong economic inertia, and the inertia disappears after period 3. The short-term impact of economic restructuring on environmental regulation is positive in period 1, turns negative in period 2, continues to be positive after period 3, and the intensity of the impact decreases slowly before showing a weak positive impact that tends to stabilize in period 10. This indicates that the impact of industrial restructuring on environmental regulation fluctuates in the short term, but from the perspective of long-term dynamics, economic restructuring has a facilitating effect on environmental regulation, which may be due to the fact that the policies that promote the adjustment, optimization, and transfer of pollution-intensive industries are more manifest as environmental regulation measures than industrial policies, and with the adjustment of pollution-intensive industries, the positive environmental structure effect gradually appears, and the effect of economic structure on the intensity of environmental regulation will gradually decrease.
The third row shows the impact of environmental regulation as a shock variable on economic growth, economic structure reconstruction, and itself. The impact of environmental regulation on economic growth shows a non-linear “U” shape, i.e., it has a negative effect until 5 periods, and after 5 periods, it turns to a weak positive effect and gradually disappears. This indicates that the environmental scale effect of China’s economic growth still occupies a large proportion of the total environmental effect, and environmental regulation suppresses the scale effect and also suppresses the scale growth of some industries. In the initial stage, the environmental regulation measures implemented force enterprises to pay for pollution control or production improvement, and the increase in production cost has a negative impact on the production efficiency of enterprises in the short term. With the improvement of enterprises’ pollution control ability and production improvement, the environmental technology effect of economic growth begins to appear gradually, and the negative effect of environmental regulation on economic growth gradually decreases and eventually turns positive. The positive impact of environmental regulation on economic restructuring reaches its maximum in period 1, then declines rapidly, and the impact basically disappears after period 7, which indicates that the implementation of environmental regulation restricts the development of highly polluting and energy-consuming industries and promotes the adjustment and optimization of the economic structure to a certain extent. The impact of environmental regulation on itself is negative in period 1, turns positive in period 2, declines to negative in period 3, and the impact gradually disappears. This indicates that environmental regulation has some self-inhibition, and this inhibition effect will gradually weaken.
Impulse from economic growth: The initial self-impulse of economic growth reaches the maximum while shock decreases with time, indicating a lag economic development. Economic growth brings negative shock to economic structure with the max one at period 2. One possible explanation for this is that the structure of economics may not automatically adjust to the perfect balance with the growth of economics. The growth may be the result of aggregate productions from unbalanced industries. The inverted “U” positive impact of economic growth on environmental regulations was in line with the previous studies [36,37,38], showing that the stage of economic development determines the intensity of environmental regulations. Intensive pollution always comes up with the early stage of economic development as the primary driven force generated from heavy and resource reliable industries. To alleviate the deterioration of environment, the strength of regulations has to be increased corresponding to the pollution accumulation. After the economy grows over a certain threshold [19], USD 8000 per capital income by World Bank [29], the economic structure is reconstructed to service-oriented industries with less resource consumption and pollution, which can be treated well under relative loose regulations. The falling intensity of environmental regulations after the threshold implies less cost and potential precise measures with higher efficiency. A similar threshold point is found in the afterwards “U” shape performance by impulse from economic growth to economic structure. Considering the decreasing trends displayed in the result of economic growth’s self-impulse, it is inferred that market capital tends to invest to heavy and resource reliable industries until the marginal return falls to a certain level, proposed as the threshold point. In that case, economic structure may become progressively worse with economic development.
After passing over the threshold point, market capital would incline to invest industrial upgradation, which initiates the reconstruction of economic structure.
Impulse from economic structure: The max self-shock appears at the beginning of economic structure impulse, and the shock continuously shrinks to a stable level. The economic structure produces an “N” type impact on the intensity of environmental regulations. It shows a positive shock before period 1 as well as a negative one at period 2, and turns to a positive shock thereafter with a declining route. The economic structure concludes a long-time positive impact on environmental regulations with some fluctuations in the near future. The fluctuation may be the consequence of uncertainty in the early industry’s evolution. In accordance of the results shown in the impulse of economic growth, it is assumed that the satisfied return in the investment to heavy and resource reliable industries induces hesitations when firms are about to make decisions on whether to upgrade their equipment or invest to the current business. Different choices may correspondingly lead to divergent environmental regulations under various intensities. The randomly diversified decisions on this issue may be the origin of the early fluctuated response in environmental regulations. The response of the economic development to economic structure grows over time and finally weakens to a certain level. The response of economic growth indicates a potential rooftop exiting for effects from the reconstruction of the economic structure. Most economies may not be able to keep the developing rate after the finish of industrial upgrading.
Impulse from environmental regulations: The response of economic growth to environmental regulations is negative for the early three periods, in contrast to the positive ones after period 4. This may suggest a potential significant scale effect of environmental regulations on economic growth. After the implementation, firms are forced to pay an extra cost to meet the new and higher standards of environmental regulations during the early period. This additional expenditure to the environment results in a weaker competitiveness in the market and reduction in revenue, which restrains the growth of the economy. In line with the above description of the impulse from the economic growth, as time passes, the enforced regulations urge firms to provide services and products with higher environmental standards. These standards are going to become labels of products entering barriers for outside competitors, which award domestic firms extra competitiveness, resulting in economic growth. The response of the economic structure reaches the peak value at period 1, implies a potential rooftop existing, and matches the findings given in the above description of the impulse from the economic structure. The maximum negative self-shock of environmental regulations appears at period 1 and turns to positive at period 2 with weakening signals afterwards.
5.8. Variance Decomposition
Contribution of each variable to endogenous variable’s fluctuation can be measured by variance decomposition, which further discloses the mutual influences of variables (Table 8).
Table 8.
Variance decomposition.
By analyzing the variance decomposition of environmental regulations, it is found that environmental regulations have the largest contribution to its own variance decomposition results, with more than 50% in phase 5, 10 and 20, which are highly dependent on itself. In the stable state, the contribution rates of industrial restructuring and economic growth will reach 15.8% and 31.0%, respectively.
According to the variance decomposition results of economic structure adjustment, economic structure exerts the greatest impact on itself, reaching 81.0% in a stable state, while the contribution rate of economic growth has reached 11.4%, indicating that economic growth has a certain impact on the change of economic structure in the long run.
According to the variance decomposition results of economic growth, economic growth is most affected by itself, which once again verifies that economic growth has strong inertia characteristics. When it reaches a stable state, the contribution rate of economic growth to itself is 68.1%, while the contribution rate of environmental regulations is 8.8%, which shows that in addition to its own contribution, environmental regulations will promote economic growth to a certain extent.
5.9. Robustness Tests
Since the above impulse response and variance decomposition results are very dependent on the order of variables, the results of other variable orders need to be examined to ensure the robustness of the above results. In this paper, we refer to Hao Jin and Yuja Li [45] and swap the orders of the two variables with the highest residual correlation, i.e., the order of environmental regulation and economic growth. The results demonstrated that the GMM estimation results and impulse response plots do not change fundamentally, except for a slight change in the variance decomposition results; thus, the model passes the robustness test, and the results obtained from the analysis are reliable.
6. Conclusions
6.1. Summary and Policy Suggestion
There are few studies in the existing literature that combine environmental regulation, economic structure reconstruction, and economic growth for systematic analysis, and the unidirectional causality among variables is the main focus, while the bidirectional causality among variables is less examined. This paper selects the panel data for 30 provinces in China from 2008–2019, constructs a PVAR model, and empirically examines the dynamic relationship among environmental regulation, economic structure reconstruction, and economic growth. The results demonstrate that there is a two-way effect between environmental regulation and economic growth. In other words, environmental regulation has a “U” shape effect on economic growth, which first inhibits and then promotes economic growth, while economic growth has a strong and then weak promotion effect on environmental regulation. Economic growth has a short-term negative impact on economic structure reconstruction, whereas economic restructuring has a long-term beneficial impact on environmental regulation.
Granger causality test and variance decomposition results demonstrate that unlike the one way relationship between environmental regulation and economic growth explored in previous literature, the relationship between environmental regulation and economic growth is a mutual influence, and the influence of economic growth on environmental regulation is stronger. In contrast, economic restructuring has a unidirectional effect on environmental regulation, and the intensity of the effect is smaller than that of economic growth on environmental regulation. Economic growth also has a unidirectional effect on economic restructuring. The GMM estimation and impulse response analysis demonstrate that the effect of environmental regulation on economic growth is the same as that of Zhang et al. [46], which shows a nonlinear “U” shape, i.e., a negative effect in the short term and a positive effect in the long term. The impact of economic growth on environmental regulation is positive, and the intensity of the impact rises rapidly in the short run and decreases in the long run. In the short run, environmental regulations increase the cost of enterprises and inhibit economic growth, but in the long run, the technological effects of economic growth will gradually appear and turn into a facilitating effect. This two-way effect shows that in the long run, economic growth and ecological protection can go hand in hand, i.e., the “green mountain” is the “golden mountain.” In the long run, economic restructuring has a catalytic effect on environmental regulations. However, as the process of economic restructuring progresses, after the pollution-intensive industries have completed their restructuring, the positive environmental structure effect will gradually appear, and the role of industrial structure in promoting the intensity of environmental regulation will gradually decrease. The impact of economic growth on economic restructuring is short and negative, and the environmental scale effect of economic growth in China is still large.
The adjustment process of unreasonable structure adjustment among industries, especially pollution-intensive industries, has not yet been completed, and the economic structure still deviates from the equilibrium level.
Based on the above conclusions, this paper puts forward the following suggestions:
- Reasonably set the intensity of regulation and improve the institutional construction of environmental regulation. The intensity of environmental regulation should be determined by the stage of economic development in each region. When formulating environmental regulation measures, it is necessary to take into account the local situation and the time and to adopt flexible regulation tools according to each region’s own economic development level and industrial structure. Market regulation and market incentives should be introduced into the institutional structure of environmental regulation, and the development of a mechanism for a market trading price of emission rights should be encouraged in order to improve the green price and green taxation system and promote a high-quality economic development.
- Optimize the path of economic structure reconstruction and deal with the relationship between environmental regulation and industrial structure adjustment. According to the current situation of economic development and environmental protection, each region should play a role in environmental regulation to promote economic restructuring. To break the backward production capacity and guide the transformation of industrial structures to non-pollution, the central and western regions should make reasonable use of environmental regulation measures. The eastern coastal regions should accelerate the process of optimizing industrial structure and enhance the innovation capacity of green production through the development of technology-intensive and knowledge-intensive industries.
- Increase investment in science and technology innovation to bring the environmental technology effect of economic growth into play. While enhancing the efficiency of environmental regulation and optimizing industrial structure, regions should make full use of the capital accumulation brought by economic growth, increase investment in pollution control and scientific research and innovation, improve resource utilization efficiency, promote green production and green innovation in enterprises, and give full play to the environmental technology effect of economic growth.
6.2. Research Outlook
The relationship between economic development, economic structure reconstruction, and the ecological environment has been a hot issue in academic research. The subsequent research in this field may contribute more on the following two aspects:
- Improvement to theoretical models. Future research will be more dedicated to introducing new results of economic theory into the existing analytical framework, such as the improved industrial agglomeration model, the enterprise heterogeneity model, etc., and constructing empirical models under a better theoretical framework.
- In-depth research at the micro level. Combining with the enterprise heterogeneity model, we use micro-level data such as regions and enterprises to analyze the production and emission behavior of enterprises triggered by economic growth and industrial restructuring, which is also an important direction for our future follow-up research.
Author Contributions
Conceptualization, Y.T. (Ye Tian) and Q.W.; methodology, Y.T. (Ye Tian); software, Y.T. (Ye Tian); validation, Q.W.; data curation, Q.W.; writing—original draft preparation, Y.T. (Ye Tian) and Y.T. (Yao Tan); writing—review and editing, Y.T. (Yao Tan). All authors have read and agreed to the published version of the manuscript.
Funding
This research was funded by the national social science fund of China, grant number 19CJY019.
Institutional Review Board Statement
Not applicable for studies not involving humans or animals.
Informed Consent Statement
Not applicable for studies not involving humans.
Data Availability Statement
Data are collected from China Environmental Statistics Yearbook.
Conflicts of Interest
The authors declare no conflict of interest.
References
- Zeeshan, M.; Han, J.; Rehman, A.; Ullah, I.; Hussain, A.; Afridi, F.E.A. Exploring symmetric and asymmetric nexus between corruption, political instability, natural resources and economic growth in the context of Pakistan. Resour. Policy 2022, 78, 102785. [Google Scholar] [CrossRef]
- Zeeshan, M.; Han, J.; Rehman, A.; Bilal, H.; Farooq, N.; Waseem, M.; Hussain, A.; Khan, M.; Ahmad, I. Nexus between Foreign Direct Investment, Energy Consumption, Natural Resource, and Economic Growth in Latin American Countries. Int. J. Energy Econ. Policy 2021, 11, 407–416. [Google Scholar] [CrossRef]
- Zeeshan, M.; Han, J.; Rehman, A.; Ullah, I.; Afridi, F.E.A.; Fareed, Z. Comparative Analysis of Trade Liberalization, CO2 Emissions, Energy Consumption and Economic Growth in Southeast Asian and Latin American Regions: A Structural Equation Modeling Approach. Front. Environ. Sci. 2022, 10, 854590. [Google Scholar] [CrossRef]
- Zeeshan, M.; Han, J.; Rehman, A.; Ullah, I.; Afridi, F.E.A. Exploring determinants of financial system and environmental quality in high-income developed countries of the world: The demonstration of robust penal data estimation techniques. Environ. Sci. Pollut. Res. 2021, 28, 61665–61680. [Google Scholar] [CrossRef] [PubMed]
- Shah, M.I.; Ullah, I.; Xiao, X.; Huang, H.; Rehman, A.; Zeeshan, M.; Afridi, F.E.A. Modeling Trade Openness and Life Expectancy in China. Risk Manag. Healthc. Policy 2021, 14, 1689–1701. [Google Scholar] [CrossRef]
- Günes¸, N.; Bayar, Y.; Danilina, M.; Öztürk, O.F. Do Stringent Environmental Policies and Business Regulations Matter for Economic Growth? Evidence from G7 and BRICS Economies. Pol. J. Environ. Stud. 2014, 31, 3083–3094. [Google Scholar] [CrossRef]
- Baek, C.; Jung, E.; Lee, J. Effects of regulation and economic environment on the electricity industry’s competitiveness: A study based on OECD countries. Energy Policy 2014, 72, 120–128. [Google Scholar] [CrossRef]
- Adeel-Farooq, R.M.; Baker, N.A.A.; Rajia, J.O. Green Field Investment and Environmental Performance: A Case of Selected Nine Developing Countries of Asia. Environ. Prog. Sustain. Energy 2018, 37, 1085–1092. [Google Scholar] [CrossRef]
- Chen, P.; Chen, S.; Hsu, C.; Chen, C. Modeling the global relationships among economic growth, energy consumption and CO2 emissions. Renew. Sustain. Energy Rev. 2016, 65, 420–431. [Google Scholar] [CrossRef]
- Chen, L.; Ye, W.; Huo, C.; James, K. Environmental Regulations, the Industrial Structure, and High-Quality Regional Economic Development: Evidence from China. Land 2020, 9, 517. [Google Scholar] [CrossRef]
- Wang, L.; Wang, Z.; Ma, Y. Heterogeneous environmental regulation and industrial structure upgrading: Evidence from China. Environ. Sci. Pollut. Res. Int. 2020, 29, 13369–13385. [Google Scholar] [CrossRef]
- Zhang, G.; Zhang, P.; Zhang, Z.G.; Li, J. Impact of environmental regulations on industrial structure upgrading: An empirical study on Beijing-Tianjin-Hebei region in China. J. Clean. Prod. 2019, 238, 117848. [Google Scholar] [CrossRef]
- Burton, D.M.; Gomez, I.A.; Love, H.A. Environmental regulation cost and industry structure changes. Land Econ. 2011, 87, 545–557. [Google Scholar] [CrossRef]
- Chong, Z.; Qin, C.; Ye, X. Environmental regulation, economic network and sustainable growth of urban agglomerations in China. Sustainability 2016, 8, 467. [Google Scholar] [CrossRef]
- Kneller, R.; Manderson, E. Environmental regulations and innovation activity in UK manufacturing industries. Resour. Energy Econ. 2012, 34, 211–235. [Google Scholar] [CrossRef]
- Yang, S.; Chen, Z.; Umar, M.; Khursheed, A. Environmental regulation and high quality sustainable development of China’s economy–An empirical study based on a spatial Durbin model and threshold model. Econ. Res-Ekon. Istraz. 2022, 35, 5699–5718. [Google Scholar] [CrossRef]
- Porter, M.E. Towards a dynamic theory of strategy. Strateg. Manag. J. 1991, 12, 95–117. [Google Scholar] [CrossRef]
- Yang, C.H.; Tseng, Y.H.; Chen, C.P. Environmental regulations, induced RD, and productivity: Evidence from Taiwan’s manufacturing industries. Resour. Energy Econ. 2012, 34, 514–532. [Google Scholar] [CrossRef]
- Qiu, L.D.; Zhou, M.; Wei, X. Regulation, innovation, and firm selection: The porter hypothesis under monopolistic competition. J. Environ. Econ. Manag. 2018, 92, 638–658. [Google Scholar] [CrossRef]
- Du, K.; Cheng, Y.; Yao, X. Environmental regulation, green technology innovation, and industrial structure upgrading: The road to the green transformation of Chinese cities. Energy Econ. 2021, 98, 105247. [Google Scholar] [CrossRef]
- Xia, Q.; Quan, M.; Li, H.; Hao, X. Is environmental regulation works on improving industrial resilience of China? Learning from a provincial perspective. Energy Rep. 2022, 8, 4695–4705. [Google Scholar] [CrossRef]
- Ouyang, X.L.; Li, Q.; Du, K.R. How does environmental regulation promote technological innovations in the industrial sector? Evidence from Chinese provincial panel data. Energy Policy 2020, 139, 111310. [Google Scholar] [CrossRef]
- Hu, W.; Tian, J.; Chen, L. An industrial structure adjustment model to facilitate high-quality development of an eco-industrial park. Sci. Total Environ. 2021, 766, 142502. [Google Scholar] [CrossRef] [PubMed]
- Langpap, C.; Shimshack, J. Private citizen suits and public enforcement: Substitutes or complements. J. Environ. Econ. Manag. 2010, 59, 235–249. [Google Scholar] [CrossRef]
- Shi, L. Industrial structure changes, spatial spillover and economic growth in the Yangtze River Delta. J. Coast. Res. 2020, 107, 377–382. [Google Scholar] [CrossRef]
- Zhao, X.; Mahendru, M.; Ma, X.; Rao, A.; Shang, Y. Impacts of environmental regulations on green economic growth in China: New guidelines regarding renewable energy and energy efficiency. Renew. Energy 2022, 187, 728–742. [Google Scholar] [CrossRef]
- Lv, J.; Zhang, L. Research on environmental regulation and business performance from the perspective of technological innovation. Econ. Manag. 2021, 35, 40–46. (In Chinese) [Google Scholar]
- Shi, L. Changes of industrial structure and economic growth in coastal regions of China: A threshold panel model based study. J. Coast. Res. 2020, 107, 278–282. [Google Scholar] [CrossRef]
- World Bank. World Development Report 1992: Development and Environment; China Financial and Economic Press: Beijing, China, 1992. [Google Scholar]
- Shuai, S.; Fan, Z. Modeling the role of environmental regulations in regional green economy efficiency of China: Empirical evidence from super efficiency. J. Environ. Manag. 2020, 261, 110227. [Google Scholar] [CrossRef]
- Zhu, X.H.; Zeng, A.Q.; Zhong, M.R.; Huang, J.B.; Qu, H.P. Multiple impacts of environmental regulation on the steel industry in China: A recursive dynamic steel industry chain CGE analysis. J. Clean. Prod. 2019, 210, 490–504. [Google Scholar] [CrossRef]
- Ge, T.; Li, J.; Sha, R.; Hao, X. Environmental regulations, financial constraints and export green sophistication: Evidence from China’s enterprises. J. Clean. Prod. 2020, 251, 119671. [Google Scholar] [CrossRef]
- George, G.; McGahan, A.M.; Prabhu, J. Innovation for inclusive growth: Towards a theoretical framework and a research agenda. J. Manag. Stud. 2012, 49, 661–683. [Google Scholar] [CrossRef]
- Rajapaksa, D.; Islam, M.; Managi, S. Natural capital depletion: The impact of natural disasters on inclusive growth. Econ. Disasters Clim. Chang. 2017, 1, 233–244. [Google Scholar] [CrossRef]
- Eiadat, Y.; Kelly, A.; Roche, F.; Eyadat, H. Green and competitive? An empirical test of the mediating role of environmental innovation strategy. J. World Bus. 2018, 43, 131–145. [Google Scholar] [CrossRef]
- Gray, W.B.; Shadbegian, R.J. Plant vintage, technology, and environmental regulation. J. Environ. Econ. Manag. 2003, 46, 384–402. [Google Scholar] [CrossRef]
- Grossman, G.M.; Kreuger, A.B. Economic growth and the environment. Q. J. Econ. 1995, 110, 353–377. [Google Scholar] [CrossRef]
- Xie, R.; Yuan, Y.; Huang, J. Different types of environmental regulations and heterogeneous influence on “green” productivity: Evidence from China. Ecol. Econ. 2017, 132, 104–112. [Google Scholar] [CrossRef]
- Hahn, R.W. The political economy of environmental regulation: Towards a unifying framework. Public Choice 1984, 65, 21–47. [Google Scholar] [CrossRef]
- Tietenberg, T.H.; Lewis, L. The Economic Approach. In Environmental and Natural Resource Economics, 11th ed.; Routledge: New York, NY, USA, 2018; pp. 16–28. [Google Scholar]
- Hahn, R.W. Market power and transferable property rights. Q. J. Econ. 1984, 99, 753–763. [Google Scholar] [CrossRef]
- Pigou, A.C. The Economics of Welfare, 1st ed.; Routledge: New York, NY, USA, 2002. [Google Scholar]
- OECD. Guidelines for the Application of Environmental Economic Instruments; China Environmental Science Press: Beijing, China, 1994. [Google Scholar]
- Gan, C.; Zheng, R.; Yu, D. Influence of industrial structure’s change on economic growth and fluctuation. Econ. Res. J. 2011, 46, 14. (In Chinese) [Google Scholar]
- Jin, H.; Li, Y. The Influence of Population aging on Chinese residents’ consumption level and the regional difference. Econ. Manag. 2021, 35, 23–32. (In Chinese) [Google Scholar]
- Zhang, Y.; Wu, X.; Gong, C.; Liu, H.; Li, Y. The Impact of Environmental Regulations on the High Quality Economic Development of Shandong Province. Ecol. Econ. 2021, 37, 148–156. (In Chinese) [Google Scholar]
Disclaimer/Publisher’s Note: The statements, opinions and data contained in all publications are solely those of the individual author(s) and contributor(s) and not of MDPI and/or the editor(s). MDPI and/or the editor(s) disclaim responsibility for any injury to people or property resulting from any ideas, methods, instructions or products referred to in the content. |
© 2022 by the authors. Licensee MDPI, Basel, Switzerland. This article is an open access article distributed under the terms and conditions of the Creative Commons Attribution (CC BY) license (https://creativecommons.org/licenses/by/4.0/).