Abstract
Street lighting is usually designed to meet luminance (or illuminance) requirements of technical standards and recommendations with minimum possible lighting installation power consumption. However, with the expansion of street lighting in growing cities caused by increasing traffic intensity, the disturbing effects of street lighting on the surroundings are often neglected in the design of lighting systems. Light emitted outside the area to be lit (spill light) causes an increase in complaints from residents and an increase in lighting installation power consumption. Therefore, this paper proposes an analysis of the effect of spill light on the energy efficiency of the street lighting systems.
1. Introduction
The main photometric quantities used to determine street lighting requirements in various technical standards and recommendations are illuminance E and luminance L [1,2,3,4]. The minimum values (e.g., Em, Lm) of these quantities are set to achieve sufficient street illumination. Their maximum values (e.g., vertical illuminance of building windows Ev,w) are set to prevent the disturbing effects of lighting and the occurrence of light pollution, which is described by the upward light ratio RUL [5,6]. Consequently, individual parameters of street lighting mentioned above are often evaluated separately, without looking for interconnections and setting integrated multi-criteria assessment procedures [7]. Technical standards for reducing light pollution or obtrusive light are already in place [8] or in preparation in some countries [9]. Still, possibilities of preventing light pollution at the design stage of lighting installations without reducing the quality of street lighting have not been the focus of much research. From the above-limit values of upward light ratio RUL or illuminance of building windows Ev,w it is not very clear how the lighting designer or operator should improve the lighting installation and how to prevent mentioned excessive values in the lighting design.
Light pollution and spill light are in principle unusual light, which is considered as a loss from an energy perspective. It is caused by the luminous flux escaping directly to the upper hemisphere and the luminous flux reflected from all illuminated surfaces (including reflected spill light and reflected useful light, see Figure 1). While the proportion of reflected light in the total luminous flux escaping into the upper hemisphere has been evaluated in some studies [10,11], the influence of individual components (reflected useful light and reflected spill light), which depends on the spatial distribution of luminous flux in a street lighting installation, is not usually evaluated. The lack of a link between light pollution and the spatial distribution of luminous flux in street lighting is a frequent topic of professional discussions between lighting designers and light pollution experts [12].
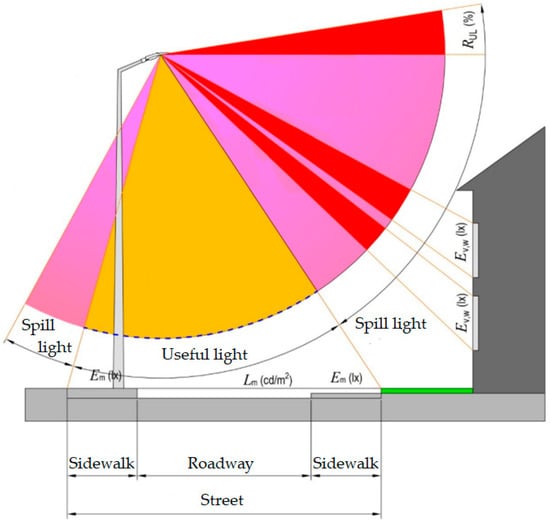
Figure 1.
Luminous flux distribution of the street lighting [9].
Effects of light pollution are often evaluated using methods described in numerous studies, some of which are mentioned below. Light pollution can be assessed by long-term measurements of night sky illuminance with the measurement device placed in the agglomeration, which is sensitive to the effect of different meteorological conditions during the year [13]. Such methods are used for physical modelling of global night sky properties (mainly luminance) from the observer’s perspective [14]. Night sky luminance is often the leading indicator used to optimise lighting installations and minimise light pollution [15]. The disadvantage of the methods described above is that the measured data usually represents the light pollution observed from the location of the photometer and thus cannot determine the causes of light pollution in a broader area. Some studies have tried to evaluate light pollution at least in a small section of the street lighting installation in the city [16]. Light pollution can also be assessed using data measured outside the illuminated environment by satellite imagery of the night sky [17,18], which mainly describes the light spread in the atmosphere and is not applicable for modelling physical properties of light pollution observed from the Earth. However, studies similar to the ones mentioned above only focus on light pollution and its effects, without any consequences of energy efficiency of lighting installations and without recommendations for lighting design improvements.
There are also numerous approaches to evaluating the energy efficiency of street lighting. Some of them use methods similar to those for the evaluation of light pollution, such as aerial imagery [19] and mobile measurement systems [20]. The energy efficiency of street lighting is often increased by the design of dynamic road lighting installations [21] or with the use of advanced methods in the design of road lighting systems, such as genetic algorithms [22], software applications for experimental validation [23] and, of course, by replacing traditional light sources with light-emitting diodes [24]. Evaluation of lighting system energy efficiency is usually based on the assessment of large areas, which is significantly different when compared to the measurement or simulation of light pollution [25]. However, studies similar to the ones mentioned above focus mainly on energy efficiency and economic aspects of lighting systems, without any consequences of spill light, light pollution and their influence on energy efficiency [26].
Luminous flux reduction as one of the instruments to improve the energy efficiency of street lighting is recommended in some research, mainly in terms of reducing the luminous flux into the upper hemisphere [27] or regulating the total luminous flux of luminaires by dimming, according to the time schedule [28], traffic intensity or light source maintenance status [29]. The influence of incorrect luminous flux spatial distribution on energy efficiency is mentioned, for example, in the case study of Comiso, Italy [29], but without a proposal for its evaluation. Software goniophotometer was developed [30] as a tool for luminous flux distribution analysis based on general luminous intensity distribution characteristics of the city simulation, which is a computationally intensive method.
Based on the research referenced in previous paragraphs and related studies, luminous flux distribution of installed luminaires and its spatial distribution analysis could be the connecting element in the evaluation of light pollution and energy efficiency. The main reason is that luminous flux is directly proportional to the particular luminaire power consumption. Spatial distribution of the luminous flux determines the direct illuminance E (or luminance L) of the area to be lit (useful light) [31]. Unnecessary luminous flux causes the obtrusive effects of street lighting (spill light, see Figure 1) and corresponding energy loss. That is why luminous flux distribution analysis in street lighting installations can easily clarify to the designer what can be improved in the lighting design and, at the same time, can alert the operator to the energy loss caused by unnecessary luminous flux.
Therefore, the research described in this paper is focused on the analysis of the distribution of luminous flux of street lighting in a large urban environment to find out the proportion of the useful and unnecessary luminous flux, which is equal to the proportion of the useful and unnecessary power consumption in the lighting installations. The aim is to assess the overall parameters of street lighting in a large area of a city with different types of lighting installations. The results of the current state of lighting installation analysis, based mainly on high-pressure sodium lamps, could be applied for preparing a street lighting concept for the next period, in which increased demand for reducing the disturbing effects of light and energy intensity is expected.
2. Materials and Methods
To make the research reliable, an area that includes the most common types of urban environments with the most common types of street lighting systems needs to be selected. The area meeting the above conditions is the territory of the Prague 6 district, which consists of areas of a compact city, modernist city, garden city and suburban landscapes with appropriate street lighting systems (see Figure 2).

Figure 2.
A part of Prague 6 district with the different urban environments highlighted [32].
The total area of the territory included in the research is approx. 20 km2, which corresponds to the area of the entire Prague 6 district except for the area of the Václav Havel Airport. All street lighting installations in the district are operated by the municipal company, whose street lighting passport [33] was a source of information about the quantity and power consumption of all types of luminaires used in all parts of the district for this research. The district was divided into four basic urban environment areas (see Figure 2) and each of them was divided into areas with the same or very similar lighting system types, luminaire types, luminaire power consumptions and street widths. The direct luminous flux of luminaires could be easily calculated from the luminous intensity distribution described in the photometric planes oriented lengthwise on the street, which corresponds to B-β photometric system (see Figure 3a) [34]. While luminaire data files usually contain luminous intensity distribution of the luminaire described in the C-γ photometric system (see Figure 3b), a data convertor for luminaire data from the C-γ photometric system to the B-β photometric system was developed. In the B-β photometric system, particular B-planes corresponding to the traffic area (useful light), outside the traffic area (spill light) and to the upper hemisphere (see Figure 1) can be separated and used for luminous flux integration.
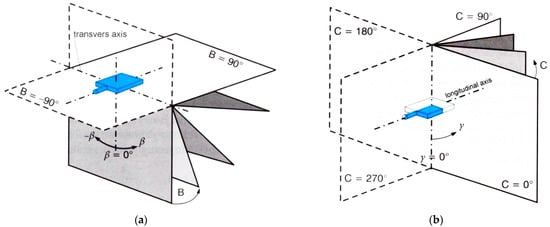
Figure 3.
Photometric systems of planes for luminous intensity distribution description: (a) B-β system; (b) C-γ system [34].
The width, total length of streets and distances between luminaires were determined for each district area type from the geoportal of the capital city of Prague [35]. Based on the total length of the streets and the length and number of the appropriate one-luminaire field with luminous flux integrated in separated B-planes, it is possible to calculate specific luminous flux Φspec (lm/m) related to the unit of length l of the given lighting system, luminaire and urban environment type (1).
The computational model of each type of lighting system, luminaire and the urban environment was also created (see examples in Figure 4, Figure 5 and Figure 6) for reflected luminous flux calculations and direct luminous flux (calculated from B-planes) confirmation. The reflectance of building façades was measured by an integral reflectometer [32] and set in the computational model parameters proportionally to the real building façade representation in the district (see, e.g., Figure 6).
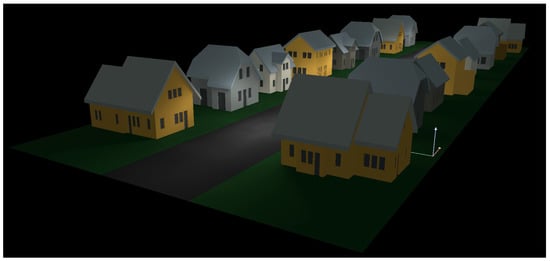
Figure 4.
The computational model of the garden city environment.
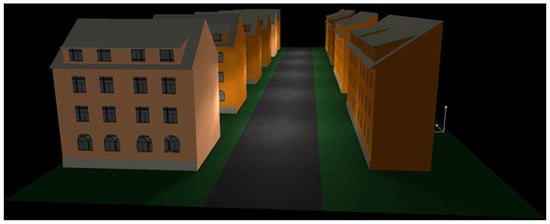
Figure 5.
The computational model of the modernist city environment.

Figure 6.
The computational model of the compact city environment.
Separate illuminance calculation planes were set in each computational model: calculation planes for useful light calculation (horizontal plane for street and pedestrians, see Figure 1), calculation planes for spill light calculation (horizontal plane for surroundings and vertical plane for façades) and calculation plane for upward light (reverse horizontal plane over the whole street). The illuminance distribution was then calculated for each calculation plane in each computational model. Based on the illuminance E definition (2), the total luminous flux Φ incident onto the given calculation plane (of the area A) can be integrated using Equation (3) [36].
All calculation planes (both horizontal and vertical) are set lengthwise of the street in each individual computational model. Therefore, it is possible to calculate specific luminous flux Φspec (lm/m) related to the unit of length l of the given calculation plane in the given computational model (1). For each particular street type represented by the appropriate computational model, it is then easy to sum up the total luminous flux incident onto all appropriate planes in the individual urban environment type by summing up Φspec over the total length of the proper traffic area.
3. Results
As outlined above, four basic computational models were created (i.e., one road segment model for each urban environment), each of which is further modified for the required road widths. All the created models contain five reference luminaire types with high-pressure sodium lamps (see Table 1). Some types of luminaires with identical light source parameters and similar luminous flux spatial distribution were combined into one group to simplify the models. The luminous intensity distribution of the two most represented luminaires in the models (see Table 1) is shown in Figure 7 in two basic photometric C-planes.

Table 1.
Total quantities of luminaire types used in computational models in the entire district [32].
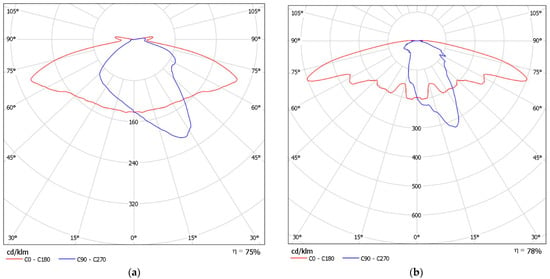
Figure 7.
The luminous intensity distribution of two types of luminaires most frequently represented in the models [32]: (a) Luminous intensity distribution of Z1 50 W luminaire; (b) Luminous intensity distribution of MC12 70W luminaire.
3.1. Quantity and Properties of Luminaires Used in Computational Models
The total numbers of the luminaire types used in computational models are shown in Table 1. The assignment of luminaire types to the four basic urban environments (see chapter 3) is shown in Table 2. The direct (initial) luminous flux distribution onto the traffic area, outside the traffic area and to the upper hemisphere was calculated for particular urban environments and luminaire types (according to Table 2) using the data converter for luminaire data from the C-γ photometric system to B-β photometric system (see chapter 2). Luminous flux distribution results from the luminaire data convertor were verified by the direct luminous flux calculation (without reflections) in the computational models for all urban environments and luminaire types (see results in Table 3).

Table 2.
Quantities of luminaire types used in computational models in urban environments [32].

Table 3.
Initial luminous flux distribution in the environment (without light reflections).
3.2. The Results of Computational Models
Results of each environment type calculation were divided into two primary groups: direct parameters and global parameters. The direct parameters describe the initial luminous flux distribution from the luminaire in the environment without light reflections (see Table 3), which is essential for energy efficiency evaluation.
The proportion of direct luminous flux out of the traffic area equals the ratio of unnecessary power consumption of the lighting installations (see Table 4). The global parameters describe the total luminous flux incident to the given area with multiple light reflections on all surfaces in the model (see Table 5). The upward light output ratio RULO as a part of the direct luminous flux out of the traffic area could also be calculated based on the spatial distribution of the luminous flux of the given luminaire (see Figure 7).

Table 4.
Total and unnecessary power consumption of lighting installations in the environment.

Table 5.
Global luminous flux distribution in the environment (with light reflections).
The global parameters are essential for light pollution evaluation. Upward light ratio RUL is calculated from the global luminous flux radiated into the upper hemisphere (see Table 5), which describes the sum of the luminous flux radiated directly from the luminaire to the upper hemisphere RULO (see Table 3, last row) and the luminous flux reflected from all of the surfaces in the environment. The global luminous flux onto the traffic area corresponds to the parameters required by the technical standards [1,2,3,4].
4. Conclusions
The proposed method of calculation of luminous flux distribution in large lighting installations showed that it is possible to use a single calculation method both for the energy efficiency of the entire lighting system and for the obtrusive effect on its surroundings (including light pollution). The results in Section 3.2 confirm the assumption that the useful direct luminous flux of street lighting in cities is only between 65 percent and 75 percent in built-up areas or even less in a suburban area (see Table 3), while the rest (direct luminous flux out of the traffic area ratio) is, in general, proportional to unnecessary power consumption causing a decrease in the energy efficiency of lighting installation. Therefore, efforts to reduce unnecessary luminous flux should be considered as a possible way of increasing the energy efficiency of street lighting systems and reducing the spill light (together with light pollution) in future street lighting conceptions. The district of Prague 6 is intended to replace current luminaires equipped with high-pressure sodium lamps with LED luminaires in the future, and the presented calculation methods will be used for spill light and direct upward light output ratio comparison with the newly installed lighting installations based on LED sources. LED luminaires often have a higher CCT [37], which may further increase the obtrusive effect of spill light on the residents [38] and increase the need for spill light analysis based on such a method, as proposed in this paper.
Based on these research results, the goal of the lighting designers should not be only to meet the requirements of technical standards but also to try not to illuminate places that should not be lit [39], and thus prevent complaints from residents of the surrounding dwellings and at the same time reduce lighting installation power consumption (increasing energy efficiency). This can be achieved by a more detailed selection of luminaires with a more suitable luminous flux distribution for a specific type of traffic area. However, it is quite clear that increasing the proportion of useful light is not easy to achieve. It is impossible to sharply delimit the light beam by the optical elements of the luminaires only to the area to be lit. Future research will look at ways to reduce the proportion of spill light in street lighting and thus increase its energy efficiency, together with the verification of the results by measurements in real conditions or other advanced verification methods [40].
An equally important result is the proportion between the direct upward light output ratio of the luminaires and the global upward light output ratio of the street lighting (with reflections from surrounding surfaces). It confirms the assumption that the reflected light component has a much higher effect on light pollution than the direct upward light from the luminaires [16]. The direct component of upward light used to be less than 20 percent of the total luminous flux emitted to the upper hemisphere, which could be valuable information for discussions between lighting designers and light pollution experts [26].
The direct component of the upward light ratio is higher in the environments without vertical barriers (suburban landscape, garden city; see Table 3). Illumination of large areas such as suburban landscapes or garden city is possible only with high luminous intensity values in directions close to the horizontal, increasing the direct upward luminous flux. Otherwise, the global upward light ratio is the highest in the compact city environment, where the street lighting is near the buildings. Thus, the spill light causes high façade illuminance with high upward light reflection. Even worse results can occur in lighting installations with modern LEDs, especially if no analysis of luminous flux distribution is performed.
A much wider range of LED luminaire characteristics is on the market than in previous periods [41], therefore the selection of suitable luminaires requires the use of luminous flux distribution analysis. Available tools, such as the luminaire classification system (LCS) [42], could also be applied more when selecting luminaires for specific street lighting installations. The luminaire classification system allows the categorisation of luminaires according to the distribution of luminous flux to specific areas based on their geometry and thus eliminates unsuitable luminaire selection. LCS application could decrease the unnecessary luminous flux (especially spill light) and improve the energy performance indicators, e.g., power density indicator PDI [43], which can be verified by methods described in this paper.
Author Contributions
Conceptualization, T.T. and M.B.; methodology, M.B.; software, T.T.; validation, M.B.; formal analysis, T.T.; investigation, T.T.; resources, T.T.; data curation, T.T.; writing—original draft preparation, T.T. and M.B.; writing—review and editing, T.T.; visualization, M.B.; supervision, M.B.; project administration, M.B.; funding acquisition, M.B. All authors have read and agreed to the published version of the manuscript.
Funding
This research was funded by Czech Technical University in Prague grant number SGS20/165/OHK3/3T/13.
Institutional Review Board Statement
Not applicable.
Informed Consent Statement
Not applicable.
Data Availability Statement
Restrictions apply to the availability of these data. Data was obtained from [33] and are available from the authors with the permission of Technologie hlavního města Prahy company.
Conflicts of Interest
The authors declare no conflict of interest.
References
- CEN EN 13201:2; Road Lighting. Part 2: Road Lighting Performance Requirements. European Committee for Standardization (CEN): Brussels, Belgium, 2015.
- CEN EN 13201:3; Road Lighting. Part 3: Road Lighting Calculation of Performance. European Committee for Standardization (CEN): Brussels, Belgium, 2015.
- International Commission on Illumination (CIE). Lighting of Roads for Motor and Pedestrian Traffic; CIE Publication 115; CIE: Vienna, Austria, 2010. [Google Scholar]
- International Commission on Illumination (CIE). Road Lighting Calculations; CIE Publication 140; CIE: Vienna, Austria, 2019. [Google Scholar]
- International Commission on Illumination (CIE). Guide on the Limitation of the Effects of Obtrusive Light; CIE Publication 150; CIE: Vienna, Austria, 2017. [Google Scholar]
- International Commission on Illumination (CIE). Guidelines for Minimizing Sky Glow; CIE Publication 126; CIE: Vienna, Austria, 1997. [Google Scholar]
- Pracki, P.; Skarżyński, K. A Multi-Criteria Assessment Procedure for Outdoor Lighting at the Design Stage. Sustainability 2020, 12, 1330. [Google Scholar] [CrossRef] [Green Version]
- ÖNORM O 1052; Light Pollution-Measurement and Evaluation. Austrian Standards Institute: Wien, Austria, 2016.
- ČSN 36 0459; Reducing the Undesirable Side Effects of Outdoor Lighting-Draft. Czech Standardization Agency: Prague, Czech Republic, 2022.
- Tabaka, P.; Fryc, I. Landscape lighting as a source of light pollution-the effect of the seasons on this phenomenon. In Proceedings of the 2016 IEEE Lighting Conference of the Visegrad Countries, Karpacz, Poland, 13–16 September 2016. [Google Scholar] [CrossRef]
- Krupiński, R. Simulation and Analysis of Floodlighting Based on 3D Computer Graphics. Sustainability 2021, 14, 1042. [Google Scholar] [CrossRef]
- Schulte-Römer, N.; Meier, J.; Dannemann, E.; Söding, M. Lighting Professionals vs. Light Pollution Experts? Investigating Views on an Emerging Environmental Concern. Sustainability 2019, 11, 1696. [Google Scholar] [CrossRef] [Green Version]
- Dostál, F.; Sokanský, K.; Novák, P. Long-term measurements of night sky illuminance. In Proceedings of the 2010 9th International Conference on Environment and Electrical Engineering, Prague, Czech Republic, 16–19 May 2010. [Google Scholar] [CrossRef]
- Gălăţanu, C.D. Luminance measurements for light pollution assessment. In Proceedings of the 2017 International Conference on Electromechanical and Power Systems (SIELMEN), Iasi, Romania, 11–13 October 2017. [Google Scholar] [CrossRef]
- Kolláth, Z.; Dömény, A.; Kolláth, K.; Nagy, B. Qualifying lighting remodelling in a Hungarian city based on light pollution effects. J. Quant. Spectrosc. Radiat. Transf. 2016, 181, 46–51. [Google Scholar] [CrossRef]
- Bečák, P.; Wlosoková, J.; Pícha, J.; Novák, T.; Sokanský, K. Modeling of Luminous Flux Radiation to the Upper Hemisphere from Real Model of Town. In Proceedings of the 2019 20th International Scientific Conference on Electric Power Engineering, Kouty nad Desnou, Czech Republic, 15–17 May 2019. [Google Scholar] [CrossRef]
- Olsen, R.N.; Gallaway, T.; Mitchel, D. Modelling US light pollution. J. Environ. Plan. Manag. 2013, 57, 883–903. [Google Scholar] [CrossRef]
- Ghosh, T.; Anderson, S.J.; Elvidge, C.D.; Sutton, P.C. Using Nighttime Satellite Imagery as a Proxy Measure of Human Well-Being. Sustainability 2013, 5, 4988–5019. [Google Scholar] [CrossRef] [Green Version]
- Rabaza, O.; Molero-Mesa, E.; Aznar-Dols, F.; Gómez-Lorente, D. Experimental Study of the Levels of Street Lighting Using Aerial Imagery and Energy Efficiency Calculation. Sustainability 2018, 10, 4365. [Google Scholar] [CrossRef] [Green Version]
- Tomczuk, P.; Chrzanowicz, M.; Jaskowski, P.; Budzynski, M. Evaluation of Street Lighting Efficiency Using a Mobile Measurement System. Energies 2021, 14, 3872. [Google Scholar] [CrossRef]
- Wojnicki, I.; Komnata, K.; Kotulski, L. Comparative Study of Road Lighting Efficiency in the Context of CEN/TR 13201 2004 and 2014 Lighting Standards and Dynamic Control. Energies 2019, 12, 1524. [Google Scholar] [CrossRef] [Green Version]
- Rabaza, O.; Gómez-Lorente, D.; Pozo, A.M.; Pérez-Ocón, F. Application of a Differential Evolution Algorithm in the Design of Public Lighting Installations Maximizing Energy Efficiency. Leukos 2019, 16, 217–227. [Google Scholar] [CrossRef]
- Lobão, J.A.; Devezas, T.; Catalão, J.P.S. Energy efficiency of lighting installations: Software application and experimental validation. Energy Rep. 2015, 1, 110–115. [Google Scholar] [CrossRef] [Green Version]
- Campisi, D.; Gitto, S.; Morea, D. Light Emitting Diodes Technology in Public Light System of the Municipality of Rome: An Economic and Financial Analysis. Int. J. Energy Econ. Policy 2017, 7, 200–208. [Google Scholar]
- Sánchez-Balvás, L.A.; Felipe, J.J.; Quintero, J.M.; Fuente, A. An energy efficiency-based classification approach for street lighting by considering operational factors: A case study of Barcelona. Energy Effic. 2021, 14, 15. [Google Scholar] [CrossRef]
- Campisi, D.; Gitto, S.; Morea, D. Economic feasibility of energy efficiency improvements in street lighting systems in Rome. J. Clean. Prod. 2018, 175, 190–198. [Google Scholar] [CrossRef]
- Carli, R.; Dotoli, M.; Pellegrino, R. A decision-making tool for energy efficiency optimization of street lighting. Comput. Oper. Res. 2018, 96, 222–234. [Google Scholar] [CrossRef]
- Ożadowicz, A.; Grela, J. Energy saving in the street lighting control system—A new approach based on the EN-15232 standard. Energy Effic. 2017, 10, 563–576. [Google Scholar] [CrossRef] [Green Version]
- Beccali, M.; Bonomolo, M.; Ciulla, G.; Galatioto, A.; Lo Brano, V. Improvement of energy efficiency and quality of street lighting in South Italy as an action of Sustainable Energy Action Plans. The case study of Comiso (RG). Energy 2015, 92, 394–408. [Google Scholar] [CrossRef] [Green Version]
- Novák, T.; Bečák, P.; Dubnička, R.; Raditschová, J.; Gašparovský, D.; Valíček, P.; Ullman, J. Modelling of Luminous Flux Directed to the Upper Hemisphere from Electrical Substation before and after the Refurbishment of Lighting Systems. Energies 2022, 15, 345. [Google Scholar] [CrossRef]
- Gašparovský, D.; Janiga, P.; Raditschová, J. Typical Values of Energy Performance Indicators in Road Lighting. Adv. Electr. Electron. Eng. 2021, 19, 134–144. [Google Scholar] [CrossRef]
- Vencovský, T. Smart City Public Lighting Quality Improvement; Czech Technical University in Prague: Prague, Czech Republic, 2021. [Google Scholar]
- THMP Portal. Available online: https://zjisti.si/zarizeni (accessed on 29 April 2021).
- International Commission on Illumination (CIE). The Photometry and Goniophotometry of Luminaires; CIE Publication 121; CIE: Vienna, Austria, 1996. [Google Scholar]
- The Digital Map of Prague. Available online: https://app.iprpraha.cz/apl/app/dtmp/index.html (accessed on 30 April 2021).
- Illuminating Engineering Society. Lighting Science: Concepts and Language of Lighting; IES LS-2-20; Illuminating Engineering Society: New York, NY, USA, 2020; ISBN 978-0-87995-011-8. [Google Scholar]
- Durmus, D. Correlated color temperature: Use and limitations. Lighting Res. Technol. 2021, 14771535211034330. [Google Scholar] [CrossRef]
- Kostic, M.; Djokic, L. Recommendations for energy efficient and visually acceptable street lighting. Energy 2009, 34, 1565–1572. [Google Scholar] [CrossRef]
- Kyba, C.C.M.; Hänel, A.; Hölker, F. Redefining efficiency for outdoor lighting. Energy Environ. Sci. 2014, 7, 1806–1809. [Google Scholar] [CrossRef]
- Drábek, T.; Petrík, V.; Holub, J. Statistical-Based Control Points Selection for Indoor Illuminance Measurement. IEEE Trans. Instrum. Meas. 2020, 69, 8362–8371. [Google Scholar] [CrossRef]
- Schulte-Römer, N.; Meier, J.; Söding, M.; Dannemann, E. The LED Paradox: How Light Pollution Challenges Experts to Reconsider Sustainable Lighting. Sustainability 2019, 11, 6160. [Google Scholar] [CrossRef] [Green Version]
- Illuminating Engineering Society. Luminaire Classification System for Outdoor Luminaires; ANSI/IES TM-15-20; Illuminating Engineering Society: New York, NY, USA, 2020; ISBN 978-0-87995-388-1. [Google Scholar]
- CEN EN 13201:5; Road Lighting. Part 5: Energy Performance Indicators. European Committee for Standardization (CEN): Brussels, Belgium, 2015.
Publisher’s Note: MDPI stays neutral with regard to jurisdictional claims in published maps and institutional affiliations. |
© 2022 by the authors. Licensee MDPI, Basel, Switzerland. This article is an open access article distributed under the terms and conditions of the Creative Commons Attribution (CC BY) license (https://creativecommons.org/licenses/by/4.0/).