
Influencing Factors and Path Analysis of Sustainable Agricultural Mechanization: Econometric Evidence from Hubei, China


Abstract
:1. Introduction
2. Literature Review and Conceptual Framework
2.1. Literature Review
2.2. Analysis of the Influencing Factors of SAM
3. Materials and Methods
3.1. Research Area and Data Sources
3.2. Basic Hypotheses
3.3. Statistical Modeling Methods
4. Results of the Case Study
4.1. Model Specification Tests
4.2. Results of the First-Order PLS-SEM Model
4.3. Results of Hypothesis Testing
4.4. Discussion
- (1)
- Sustainable Agricultural Mechanization (SAM) is directly affected by economic effects to a high degree. The development of SAM needs the necessary economic input and asset investment for its support. The cost of agricultural machinery and the efficiency of output have a direct impact on farmers’ use, making these important factors. The income level of farmers directly affects the farmers’ willingness and ability to purchase agricultural machinery, so agricultural mechanization and economics form feedback loops of mutual restriction and mutual promotion. This conclusion has also been confirmed in sub-Saharan Africa, South Asia, and Latin America [12,15,17].
- (2)
- Our results show that SAM requires policy investment support, and the indirect incentives of policy-guided market regulation can still bring great vitality to SAM, but the direct effect of the agricultural machinery policy subsidy on SAM has not been very significant. However, through policy guidance, market regulation of indirect incentives can still bring great vitality to SAM. Policy factors are still the leading factors promoting SAM, and our results corroborate several findings of prior studies [12,38,44]. However, as the degree of marketization deepens and government functions are gradually weakened, whether farmers’ willingness to purchase agricultural machinery can be maintained for future development are unclear.
- (3)
- However, our findings are also in contrast with other research results [45]. Our study confirms that the impact of agricultural mechanization on agricultural production is not significant, indicating that, on the one hand, many factors affecting agricultural output, such as climate, natural disasters, markets, and other factors, can strongly affect production results, and that therefore more complex agricultural mechanization is only one of the factors affecting production. On the other hand, one can also see that the current development of mechanization in Hubei is not particularly balanced. Because of the many lakes in large areas, mechanization is only found in a few areas, and only a few popular crops are grown. There is still a significant gap between Hubei and the provinces and regions with a high degree of SAM, such as Heilongjiang, Henan, and Jiangsu Provinces.
- (4)
- Environmental factors are influenced by several other factors comprehensively. The past period of high economic growth has been accompanied by high pollution and high consumption issues, which can be seen very clearly here. Adjusting the relative balance of agricultural development and the ecological environment, which must be a non-negotiable part of SAM, requires attention. At the same time, our results also show that through the improvement of agricultural machinery technology and agricultural science and technology input, accompanied by the effective improvement of agricultural output mode and processes, the environment can also play a significant role in achieving the sustainable green development of agriculture [11].
5. Conclusions
Author Contributions
Funding
Institutional Review Board Statement
Informed Consent Statement
Data Availability Statement
Acknowledgments
Conflicts of Interest
Appendix A

| Variable Codes | Variable | N | Minimum | Maximum | Mean | Std. Deviation |
|---|---|---|---|---|---|---|
| s1 | Gross Domestic Product of the region | 17 | 5633.24 | 45,828 | 23,168.34 | 13,167.26 |
| s2 | Agricultural investment in fixed assets | 17 | 46.24 | 650.49 | 293.2665 | 201.8406 |
| s3 | Number of employees in agriculture, forestry, animal husbandry, and fishery | 17 | 863 | 1105 | 939.2941 | 88.02457 |
| s4 | The proportion of rural labor force with junior high school education or above | 17 | 0.67 | 0.76 | 0.722941 | 0.024438 |
| s5 | The sown area of food crops | 17 | 3817 | 4852 | 4346.647 | 353.1728 |
| s6 | The sales output value of agricultural machinery industry | 17 | 887 | 4735 | 2745.824 | 1202.251 |
| s7 | The contribution rate of agricultural science and technology progress | 17 | 39.64 | 61 | 52.5288 | 6.2936 |
| s8 | Informationization level | 17 | 1.09 | 34.32 | 16.8453 | 12.3385 |
| s9 | Total investment in agricultural mechanization | 17 | 9.1 | 54.9 | 35.1059 | 14.5315 |
| s10 | Farm machinery purchase cost | 17 | 7.9 | 50.9 | 30.6 | 12.6586 |
| s11 | Fixed base price index of mechanized farm tools | 17 | 99.1 | 107.7 | 102.1765 | 2.3720 |
| s12 | Number of service organizations of agricultural mechanization | 17 | 3.4 | 219 | 45.3471 | 67.6336 |
| s13 | Number of trainees in agricultural mechanization | 17 | 98,832 | 560,816 | 381,649.5 | 181,420.3 |
| s14 | Machine sowing area | 17 | 233.66 | 3362.6 | 1565.45 | 1085.071 |
| s15 | Machine farming area | 17 | 2015.93 | 6127.6 | 4602.291 | 1526.089 |
| s16 | Machine collecting area | 17 | 1263.46 | 4633.2 | 3227.768 | 1161.949 |
| s17 | Total power of agricultural machinery | 17 | 1768.6 | 4626.1 | 3541.795 | 924.7491 |
| s18 | Comprehensive operation rate of main crops cultivation and harvesting | 17 | 42 | 71.3 | 58.2059 | 9.4999 |
| s19 | Number of farm machinery households | 17 | 94.6 | 237.3 | 211.5353 | 37.8286 |
| s20 | The original value of agricultural machinery | 17 | 98.57 | 550 | 319.9506 | 144.1551 |
| s21 | Total profit of agricultural machinery | 17 | 28.22 | 103.44 | 70.3544 | 23.7995 |
| s22 | Per capita net income of farmers | 17 | 2890.01 | 16,390.86 | 8791.248 | 4666.718 |
| s23 | Per capita food production | 17 | 349 | 500 | 426.7059 | 47.7417 |
| s24 | Agricultural output value | 17 | 921.59 | 3492.54 | 2198.772 | 853.4645 |
| s25 | Agricultural diesel consumption | 17 | 41.09 | 67.33 | 58.1059 | 9.3321 |
| s26 | Agricultural carbon emissions | 17 | 1833 | 4598 | 3226.294 | 836.1836 |
| s27 | Government Agricultural Machinery Policy Subsidies—National | 17 | 0.7 | 237.54 | 140.2788 | 86.7749 |
| s28 | Number of agricultural mechanization technology promotion agencies | 17 | 670 | 1016 | 832.1765 | 103.1482 |
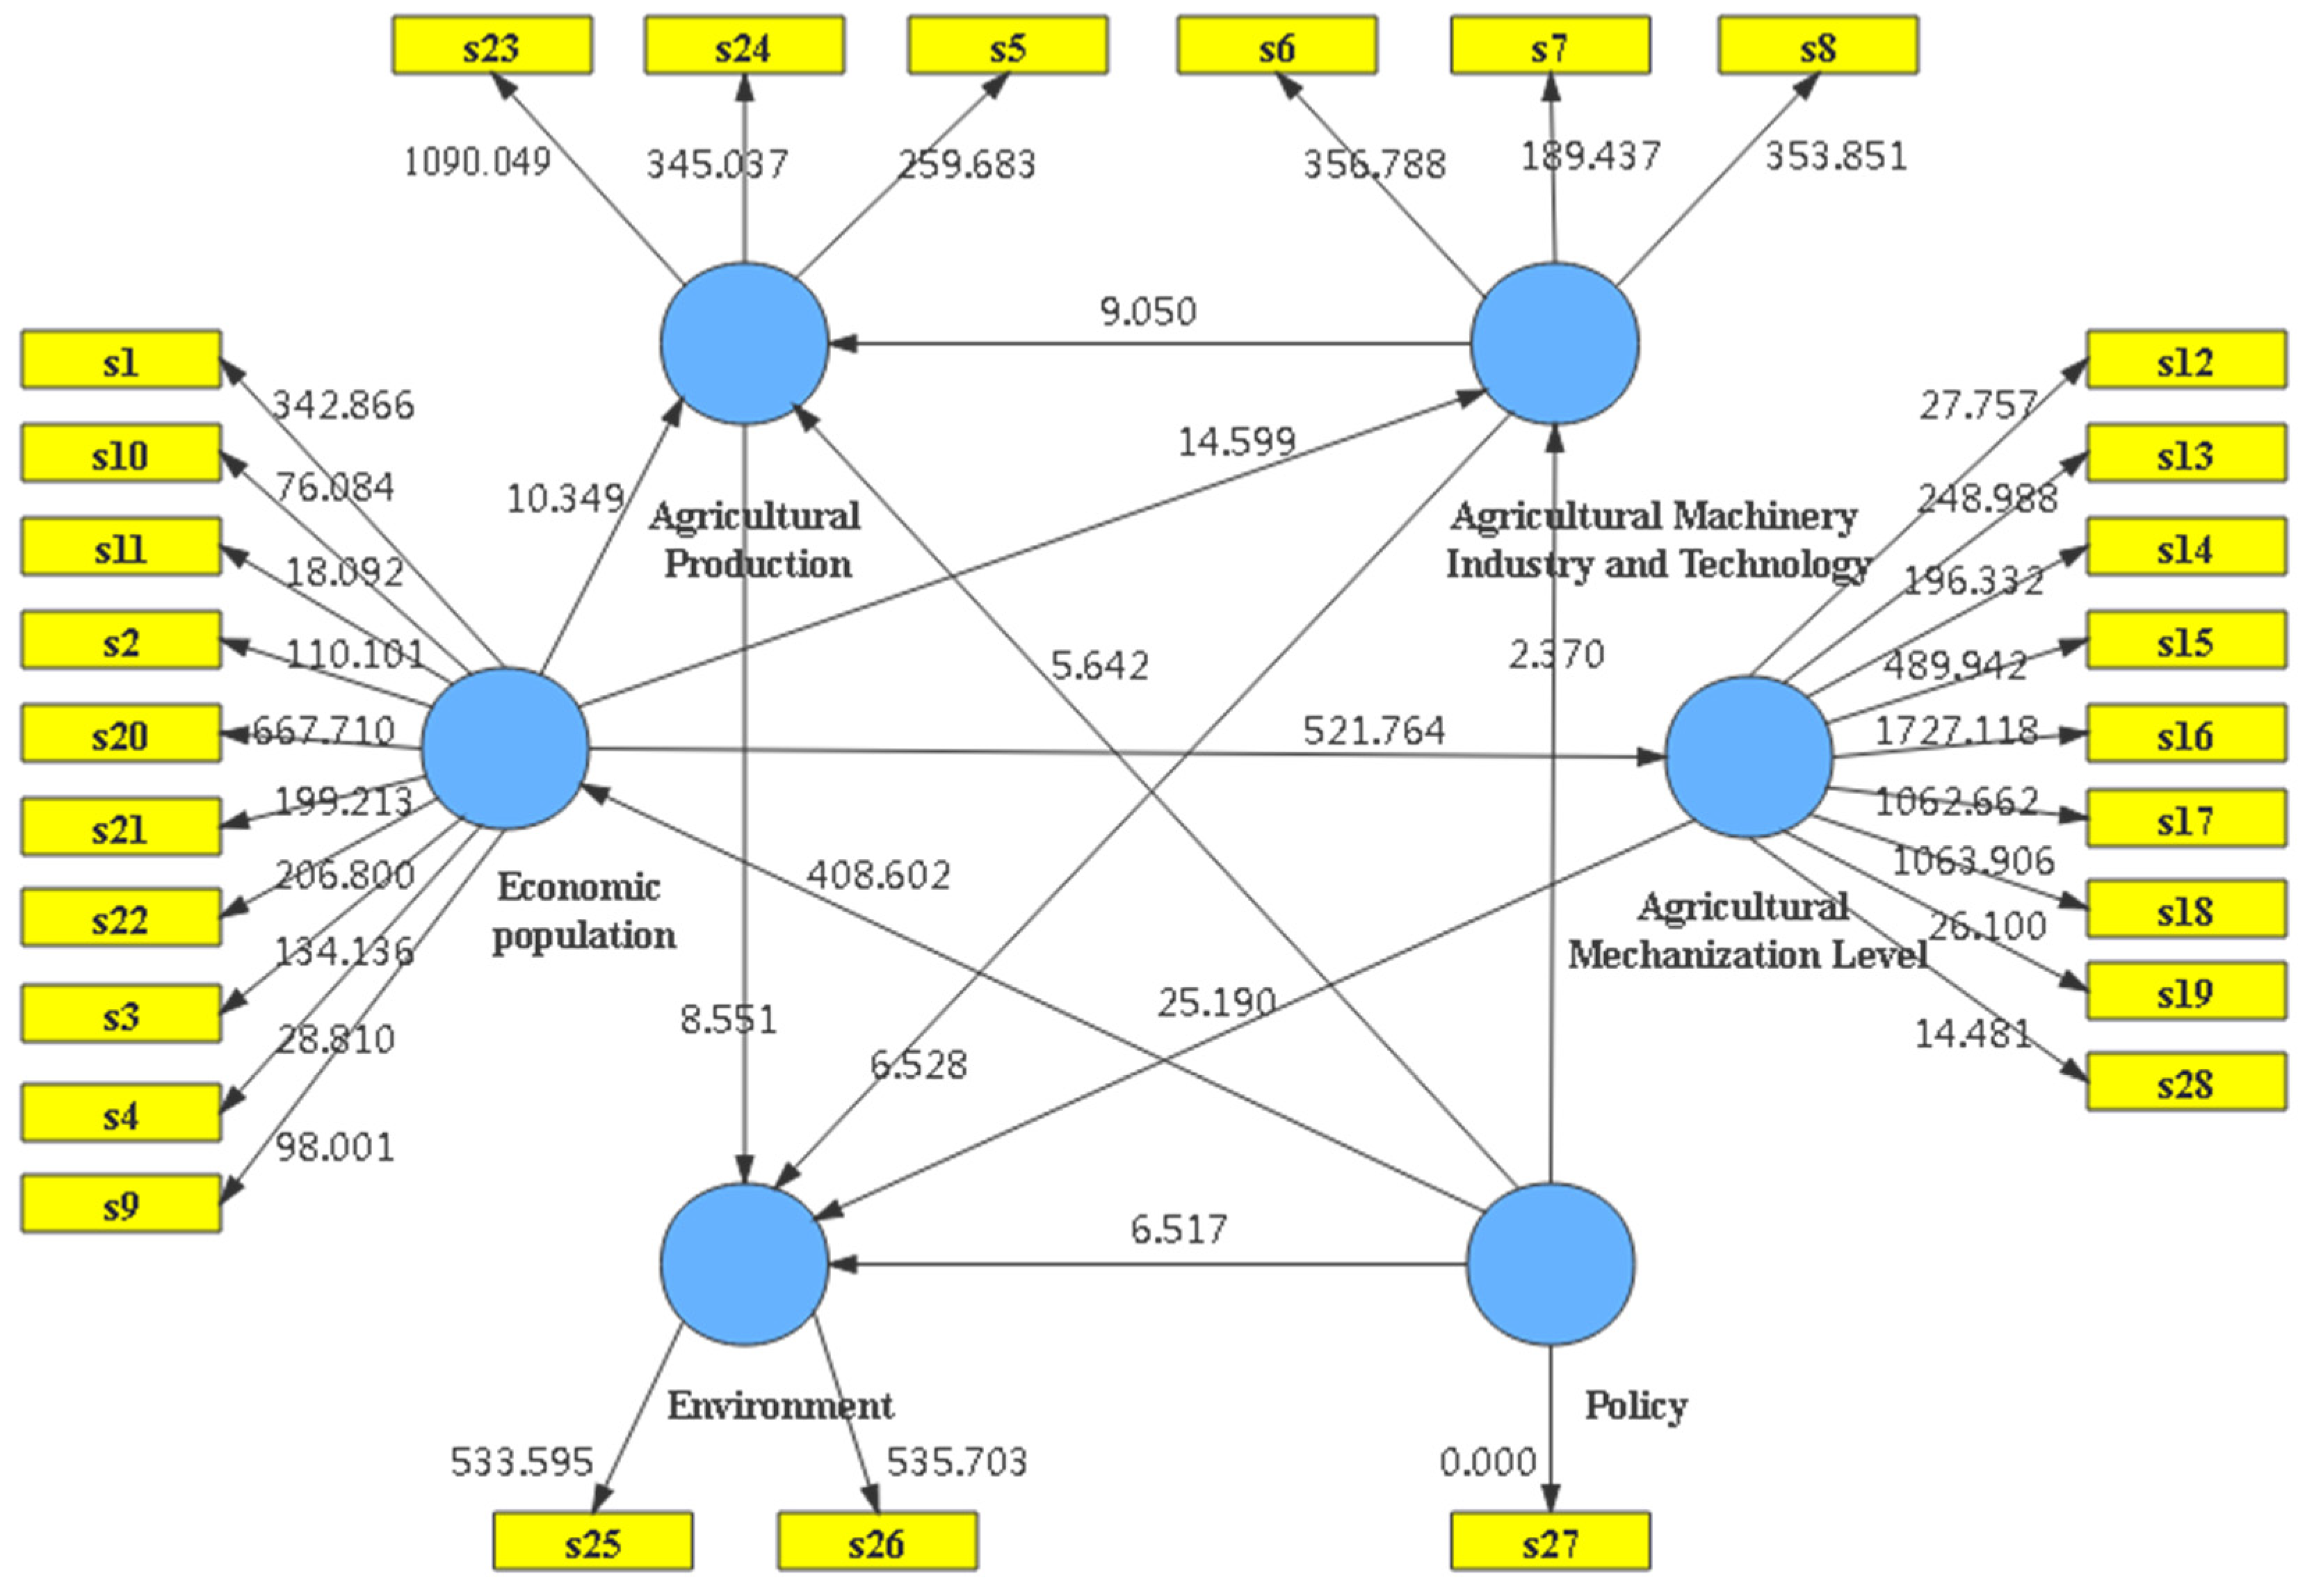
| Path | Original Sample Value (O) | T Statistic (|O/STERR|) | Significance | Path | Original Sample Value (O) | T Statistic (|O/STERR|) | Significance |
|---|---|---|---|---|---|---|---|
| s1 ← EP | 0.9810 | 345.5423 | *** | s2 ← EP | 0.9258 | 106.6113 | *** |
| s10 ← EP | 0.9215 | 880.8130 | *** | s20 ← EP | 0.9929 | 678.2270 | *** |
| s11 ← EP | −0.7261 | 17.9869 | ** | s21 ← EP | 0.9740 | 202.7099 | *** |
| s12 ← AMDL | −0.7505 | 26.1794 | ** | s22 ← EP | 0.9599 | 217.1062 | *** |
| s13 ← AMDL | 0.9712 | 255.6121 | *** | s23 ← AP | 0.9943 | 1125.4639 | *** |
| s14 ← AMDL | 0.9537 | 196.9908 | *** | s24 ← AP | 0.9733 | 329.7788 | *** |
| s15 ← AMDL | 0.9855 | 407.7759 | *** | s28 ← AMDL | −0.6921 | 14.8183 | ** |
| s16 ← AMDL | 0.9960 | 1594.6752 | *** | s3 ← EP | −0.9494 | 132.5960 | *** |
| s17 ← AMDL | 0.9891 | 1055.2473 | *** | s4 ← EP | 0.7831 | 35.1248 | ** |
| s18 ← AMDL | 0.9924 | 1028.9101 | *** | s5 ← AP | 0.9734 | 262.2697 | *** |
| s19 ← AMDL | 0.7595 | 24.3129 | ** | s6 ← AMIAT | 0.9834 | 372.2486 | *** |
| s25 ← E | 0.9885 | 511.9002 | *** | s7 ← AMIAT | 0.9625 | 181.3262 | *** |
| s26 ← E | 0.9885 | 512.6484 | *** | s8 ← AMIAT | 0.9821 | 359.1926 | *** |
| s27 ← P | 1.0000 | s9 ← EP | 0.9357 | 101.2481 | *** |
| Path | Original Sample Value (O) | T Statistic (|O/STERR|) | Significance |
|---|---|---|---|
| AP → Environment | −0.3624 | 5.3331 | * |
| AMDL → AP | −0.1030 | 0.9804 | -- |
| AMDL→ Environment | 0.8246 | 12.7605 | ** |
| AMIAT → AP | 0.4739 | 8.8222 | ** |
| AMIAT → AMDL | 0.0514 | 0.7795 | -- |
| AMIAT → Environment | 0.4446 | 7.7764 | ** |
| Policy → AP | −0.3525 | 6.0133 | ** |
| Policy → AMDL | −0.0507 | 0.6018 | -- |
| Policy → AMIAT | −0.2062 | 2.2246 | * |
| Policy → Environment | 0.2363 | 5.0714 | * |
| Policy → EP | 0.9819 | 450.3113 | *** |
| EP → AP | 0.9639 | 7.5819 | ** |
| EP → AMDL | 0.9900 | 7.9282 | ** |
| EP → AMIAT | 1.1889 | 13.3998 | ** |
| EP → Environment | −0.1449 | 1.1388 | -- |
| Latent Variable | Observation Variables | Factor Load |
|---|---|---|
| EP | s1 | 0.9811 |
| s2 | 0.9261 | |
| s9 | 0.9353 | |
| s10 | 0.9212 | |
| s11 | −0.7265 | |
| s20 | 0.9929 | |
| s21 | 0.9738 | |
| s22 | 0.9601 | |
| s3 | −0.9490 | |
| s4 | 0.7834 | |
| AP | s5 | 0.9734 |
| s23 | 0.9943 | |
| s24 | 0.9733 | |
| AMIAT | s7 | 0.9625 |
| s8 | 0.9821 | |
| s6 | 0.9834 | |
| s12 | −0.7543 | |
| s13 | 0.9705 | |
| s14 | 0.9516 | |
| AMDL | s15 | 0.9864 |
| s16 | 0.9957 | |
| s17 | 0.9895 | |
| s18 | 0.9923 | |
| s19 | 0.7627 | |
| s28 | −0.6874 | |
| Environment | s25 | 0.9884 |
| s26 | 0.9885 | |
| Policy | s27 | 1 |
References
- Sims, B.; Kienzle, J.; Hilmi, M. Agricultural Mechanization a Key Input for Sub-Saharan African Smallholders; FAO: Rome, Italy, 2016. [Google Scholar]
- FAO. Sustainable Agricultural Mechanization. Available online: http://www.fao.org/sustainableagricultural-mechanization (accessed on 13 February 2022).
- Sims, B.; Kienzle, J. Sustainable Agricultural Mechanization for Smallholders: What Is It and How Can We Implement It? Agriculture 2017, 7, 50. [Google Scholar] [CrossRef] [Green Version]
- Kobrich, C.; Rehman, T. Sustainable agriculture and the MCDM paradigm: The development of compromise programming models with special reference to small-scale farmers in Chile′s VIth region. In Proceedings of the First International Conference on Multiple Objective Decision Support Systems (MODSS) for Land, Water and Environmental Management: Concepts, Approaches and Applications, Honolulu, HI, USA, September 1996; pp. 557–569. [Google Scholar]
- FAO. Agri-Hire in Sub-Saharan Africa Business Models for Investing in Sustainable Mechanization; FAO: Rome, Italy, 2021. [Google Scholar]
- Ministry of Agriculture and Rural Affairs, P.R.C. National Agricultural Mechanization Development Plan in the 14th Five-Year Plan. Available online: http://www.moa.gov.cn/govpublic/NYJXHGLS/202201/t20220105_6386316.htm (accessed on 13 February 2022).
- Yang, M. Discussion on the development of Agricultural Mechanization in China under the new normal. Agric. Mach. Qual. Superv. 2015, 3, 4–9. [Google Scholar]
- Gowdy, J.; Baveye, P. Chapter 27-An Evolutionary Perspective on Industrial and Sustainable Agriculture. In Agroecosystem Diversity; Lemaire, G., Carvalho, P.C.D.F., Kronberg, S., Recous, S., Eds.; Elsevier: Amsterdam, The Netherlands, 2019; pp. 425–433. [Google Scholar]
- Mrema, G.; Kienzle, J.; Mpagalile, J. Current status and future prospects of agricultural mechanization in sub-saharan Africa (SSA). Agric. Mech. Asia Afr. Lat. Am. 2018, 49, 13–30. [Google Scholar]
- Yu, J.; Wu, J. The sustainability of agricultural development in China: The agriculture–environment nexus. Sustainability 2018, 10, 1776. [Google Scholar] [CrossRef] [Green Version]
- Jiang, M.; Hu, X.; Chunga, J.; Lin, Z.; Fei, R. Does the popularization of agricultural mechanization improve energy-environment performance in China’s agricultural sector? J. Clean. Prod. 2020, 276, 124210. [Google Scholar] [CrossRef]
- Kormawa, P.; Mrema, G.; Mhlanga, N.; Fynn, M.; Kienzle, J.; Mpagalile, J. Sustainable Agricultural Mechanization: A Framework for Africa; FAO: Addis Ababa, Ethiopia; AUC: Addis Ababa, Ethiopia, 2018. [Google Scholar]
- Daum, T.; Adegbola, Y.P.; Kamau, G.; Daudu, C.; Zossou, R.C.; Crinot, G.F.; Houssou, P.; MOSES, L.; Ndirpaya, Y.; Wahab, A. Impacts of agricultural mechanization: Evidence from four African countries. Hohenh. Work. Pap. Soc. Inst. Chang. Agric. Dev. 2020. [Google Scholar] [CrossRef]
- Li, W.; Wei, X.; Zhu, R.; Guo, K. Study on Factors Affecting the Agricultural Mechanization Level in China Based on Structural Equation Modeling. Sustainability 2019, 11, 51. [Google Scholar] [CrossRef] [Green Version]
- Van Loon, J.; Woltering, L.; Krupnik, T.J.; Baudron, F.; Boa, M.; Govaerts, B. Scaling agricultural mechanization services in smallholder farming systems: Case studies from sub-Saharan Africa, South Asia, and Latin America. Agric. Syst. 2020, 180, 102792. [Google Scholar] [CrossRef]
- Baudron, F.; Misiko, M.; Getnet, B.; Nazare, R.; Sariah, J.; Kaumbutho, P. A farm-level assessment of labor and mechanization in Eastern and Southern Africa. Agron. Sustain. Dev. 2019, 39, 17. [Google Scholar] [CrossRef] [Green Version]
- Devkota, R.; Pant, L.P.; Gartaula, H.N.; Patel, K.; Gauchan, D.; Hambly-Odame, H.; Thapa, B.; Raizada, M.N. Responsible Agricultural Mechanization Innovation for the Sustainable Development of Nepal’s Hillside Farming System. Sustainability 2020, 12, 374. [Google Scholar] [CrossRef] [Green Version]
- Chen, Y.E.; Chen, W. A Study on the Relationship among Agricultural Mechanization, Industrial Upgrading and Agricultural Carbon Emission—The Empirical Research Based on Dynamic Panel Data Model. J. Agrotech. Econ. 2018, 5, 122–133. [Google Scholar]
- Cui, H.; Zhao, T.; Shi, H. STIRPAT-Based Driving Factor Decomposition Analysis of Agricultural Carbon Emissions in Hebei, China. Pol. J. Environ. Stud. 2018, 27, 1449–1461. [Google Scholar] [CrossRef]
- Cui, Y.; Khan, S.U.; Deng, Y.; Zhao, M.; Hou, M. Environmental improvement value of agricultural carbon reduction and its spatiotemporal dynamic evolution: Evidence from China. Sci. Total Environ. 2021, 754, 142170. [Google Scholar] [CrossRef]
- Chi, Y.; Zhou, W.; Wang, Z.; Hu, Y.; Han, X. The Influence Paths of Agricultural Mechanization on Green Agricultural Development. Sustainability 2021, 13, 12984. [Google Scholar] [CrossRef]
- Guo, X.; Huang, S.; Wang, Y. Influence of Agricultural Mechanization Development on Agricultural Green Transformation in Western China, Based on the ML Index and Spatial Panel Model. Math. Probl. Eng. 2020, 2020, 6351802. [Google Scholar] [CrossRef]
- Liu, D.; Zhu, X.; Wang, Y. China’s agricultural green total factor productivity based on carbon emission: An analysis of evolution trend and influencing factors. J. Clean. Prod. 2021, 278, 123692. [Google Scholar] [CrossRef]
- Li, W.; Zhang, P. Relationship and integrated development of low-carbon economy, food safety, and agricultural mechanization. Environ. Sci. Pollut. Res. 2021, 28, 68679–68689. [Google Scholar] [CrossRef]
- Bai, R. Thinking on the development of agricultural mechanization during the ‘13th Five-year′ in China. J. Chin. Agric. Mech. 2014, 35, 1–5. [Google Scholar]
- Lu, B.; Zhang, Z.; Zhu, M.; Chen, Z.; Lv, X. Discrimination and analysis of key influencing factors for agricultural mechanization development. Trans. Chin. Soc. Agric. Eng. (Trans. CSAE) 2008, 24, 114–117. [Google Scholar]
- Yan, Z.; Qi, Y.; Liao, J. Comparative analysis of evaluation methods of agricultural mechanization level in China. J. Agric. Mech. Res. 2018, 10, 1–5. [Google Scholar]
- Daum, T.; Birner, R. Agricultural mechanization in Africa: Myths, realities and an emerging research agenda. Glob. Food Secur. 2020, 26, 100393. [Google Scholar] [CrossRef]
- Kirui, O.K. The Agricultural mechanization in Africa: Micro-level analysis of state drivers and effects. ZEF-Discuss. Pap. Dev. Policy 2019, 60. [Google Scholar] [CrossRef]
- Cossar, F. Boserupian Pressure and Agricultural Mechanization in Modern Ghana; Intl Food Policy Res Inst: Washington, DC, USA, 2016; Volume 1528, Available online: https://ssrn.com/abstract=2778742 (accessed on 20 January 2022).
- Berhane, G.; Dereje, M.; Minten, B.; Tamru, S. The Rapid–But from a Low Base–Uptake of Agricultural Mechanization in Ethiopia: Patterns, Implications and Challenges; Intl Food Policy Res Inst: Washington, DC, USA, 2017; Volume 105. [Google Scholar] [CrossRef]
- Saliou, I.O.; Zannou, A.; Aoudji, A.K.; Honlonkou, A.N. Drivers of Mechanization in Cotton Production in Benin, West Africa. Agriculture 2020, 10, 549. [Google Scholar] [CrossRef]
- Mottaleb, K.A.; Krupnik, T.J.; Erenstein, O. Factors associated with small-scale agricultural machinery adoption in Bangladesh: Census findings. J. Rural. Stud. 2016, 46, 155–168. [Google Scholar] [CrossRef] [PubMed] [Green Version]
- Ghosh, B.K. Determinants of Farm Mechanisation in Modern Agriculture: A Case Study of Burdwan Districts of West Bengal. Int. J. Agric. Res. 2010, 5, 1107–1115. [Google Scholar] [CrossRef]
- Aryal, J.P.; Sofina, M.; Olaf, E. Understanding factors associated with agricultural mechanization: A Bangladesh case. World Dev. Perspect. 2019, 13, 1–9. [Google Scholar] [CrossRef]
- Aryal, J.P.; Thapa, G.; Simtowe, F. Mechanisation of small-scale farms in South Asia: Empirical evidence derived from farm households survey. Technol. Soc. 2021, 65, 101591. [Google Scholar] [CrossRef]
- Belton, B.; Win, M.T.; Zhang, X.; Filipski, M. The rapid rise of agricultural mechanization in Myanmar. Food Policy 2021, 101, 102095. [Google Scholar] [CrossRef]
- Li, Z.; Zhu, M.; Huang, H. Evaluating the sustainable development of agricultural mechanization in Hubei Province based on fuzzy DEMATEL and ISM combined method. Trans. Chin. Soc. Agric. Eng. 2022, 38, 51–58. [Google Scholar]
- Mamat, T.; Ding, W.; Kasim, E.; Hassan, M. The sustainable development of agricultural mechanization based on combination weighting and ahp. Chin. J. Agric. Resour. Reg. Plan. 2018, 39, 67–73. [Google Scholar]
- WOLD, S. Modeling data tables by principal components and PLS: Class pattern and quantitative predictive relations. Cemomet. Intell. Lab. Syst. 1989, 7, 53–65. [Google Scholar] [CrossRef]
- Fornell, C.; Larcker, D.F. Evaluating structural equation models with unobservable variables and measurement error. J. Mark. Res. 1981, 18, 39–50. [Google Scholar] [CrossRef]
- Ringle, C.M.; Christian, M.; Wende, S.; Becker, J.M. SmartPLS 3; SmartPLS GmbH: Boenningstedt, Germany, 2015; Available online: http://www.smartpls.com (accessed on 13 February 2022).
- Hair, J.F. Multivariate Data Analysis; Prentice Hall: Englewood Cliffs, NJ, USA, 2011. [Google Scholar]
- Tian, X.; Li, W.; Li, R. The Environmental Effects of Agricultural Mechanization: Evidence from Agricultural Machinery Purchase Subsidy Policy. Chin. Rural. Econ. 2021, 9, 95–109. [Google Scholar]
- Zhou, Z.; Kong, X. Agricultural Machines Subsidy Policy and the Grain Output of China: DID Empirical Analysis Based on National County-Level Data. China Soft Sci. 2019, 4, 20–32. [Google Scholar]
| Country/Region/International Organization | Policy | Year | Literature Source |
|---|---|---|---|
| China | China’s Agricultural Mechanization Promotion Law | 2004 | [14] |
| Tanzania | Tanzania Agricultural Mechanization Strategy | 2006 | [16] |
| Mexico | MasAgro program of a government public policy framework | 2009 | [15] |
| Bangladesh | Cereal Systems Initiative for South Asia—Mechanization and Irrigation (CSISA-MI) project | 2013 | [15] |
| India | National Agricultural Extension and Technology Mission (NMAET), Sub Mission on Agricultural Mechanization (SMAM) | 2014 | [3] |
| Nepal | Agricultural Mechanization Promotion Policy (AMPP) | 2014 | [17] |
| Ethiopia | Ethiopia National Agricultural Mechanization Strategy | 2014 | [16] |
| Kenya | National Agricultural Mechanization Policy | 2016 | [16] |
| FAO and AUC | Sustainable Agricultural Mechanization for Africa | 2018 | [16] |
| Country/Area, Continent | Influencing Factors | Literature Source |
|---|---|---|
| Benin, Kenya, Nigeria, and Mali, Africa | Soil, terrain and rainfall, institutional environments Social objectives of societies, labor shortages, timeliness Land preparation, higher yields, soil fertility, deforestation | [13,28] |
| Eleven countries, Africa | Size of the household, gender of the household, participation in off-farm economic activities, farm size, land tenure, distance to the input and output markets, type of farming system, access to extension services, use of fertilizer and pesticides | [29] |
| Ghana, Africa | Population pressure, better market access | [30] |
| Ethiopia, Africa | Rising rural wages, working animal costs | [31] |
| Africa | Education level, area cropped, access to land, access to credit and agroecological zone | [32] |
| Asia | Household assets, credit availability, electrification, road density, substantial capital investment, purchases and rental services | [33] |
| Nepal, Asia | Land consolidation, business mergers, more intensive cropping, labor displacement | [17] |
| India, Asia | Irrigation, access to institutional credit, size of land holdings, age-old customs | [34] |
| Bangladesh/South Asia, Asia | Male headship, access to credit and extension services, economic status, training positively, rental services, educational level | [35,36] |
| Myanmar, Asia | Structural transformation, timeliness, speed, drudgery, risk, yields, financing and machinery prices, policies and interventions | [37] |
| China, Asia | Scale of farmland management, agricultural labor transfer, farmers’ income level, the development level of the agricultural machinery industry, the cost of using agricultural machinery products Agricultural equipment level, regional economic development, land resources, policy, environment Economic development, scale of farmland, agricultural planting structure | [7,14,21,25,26,27] |
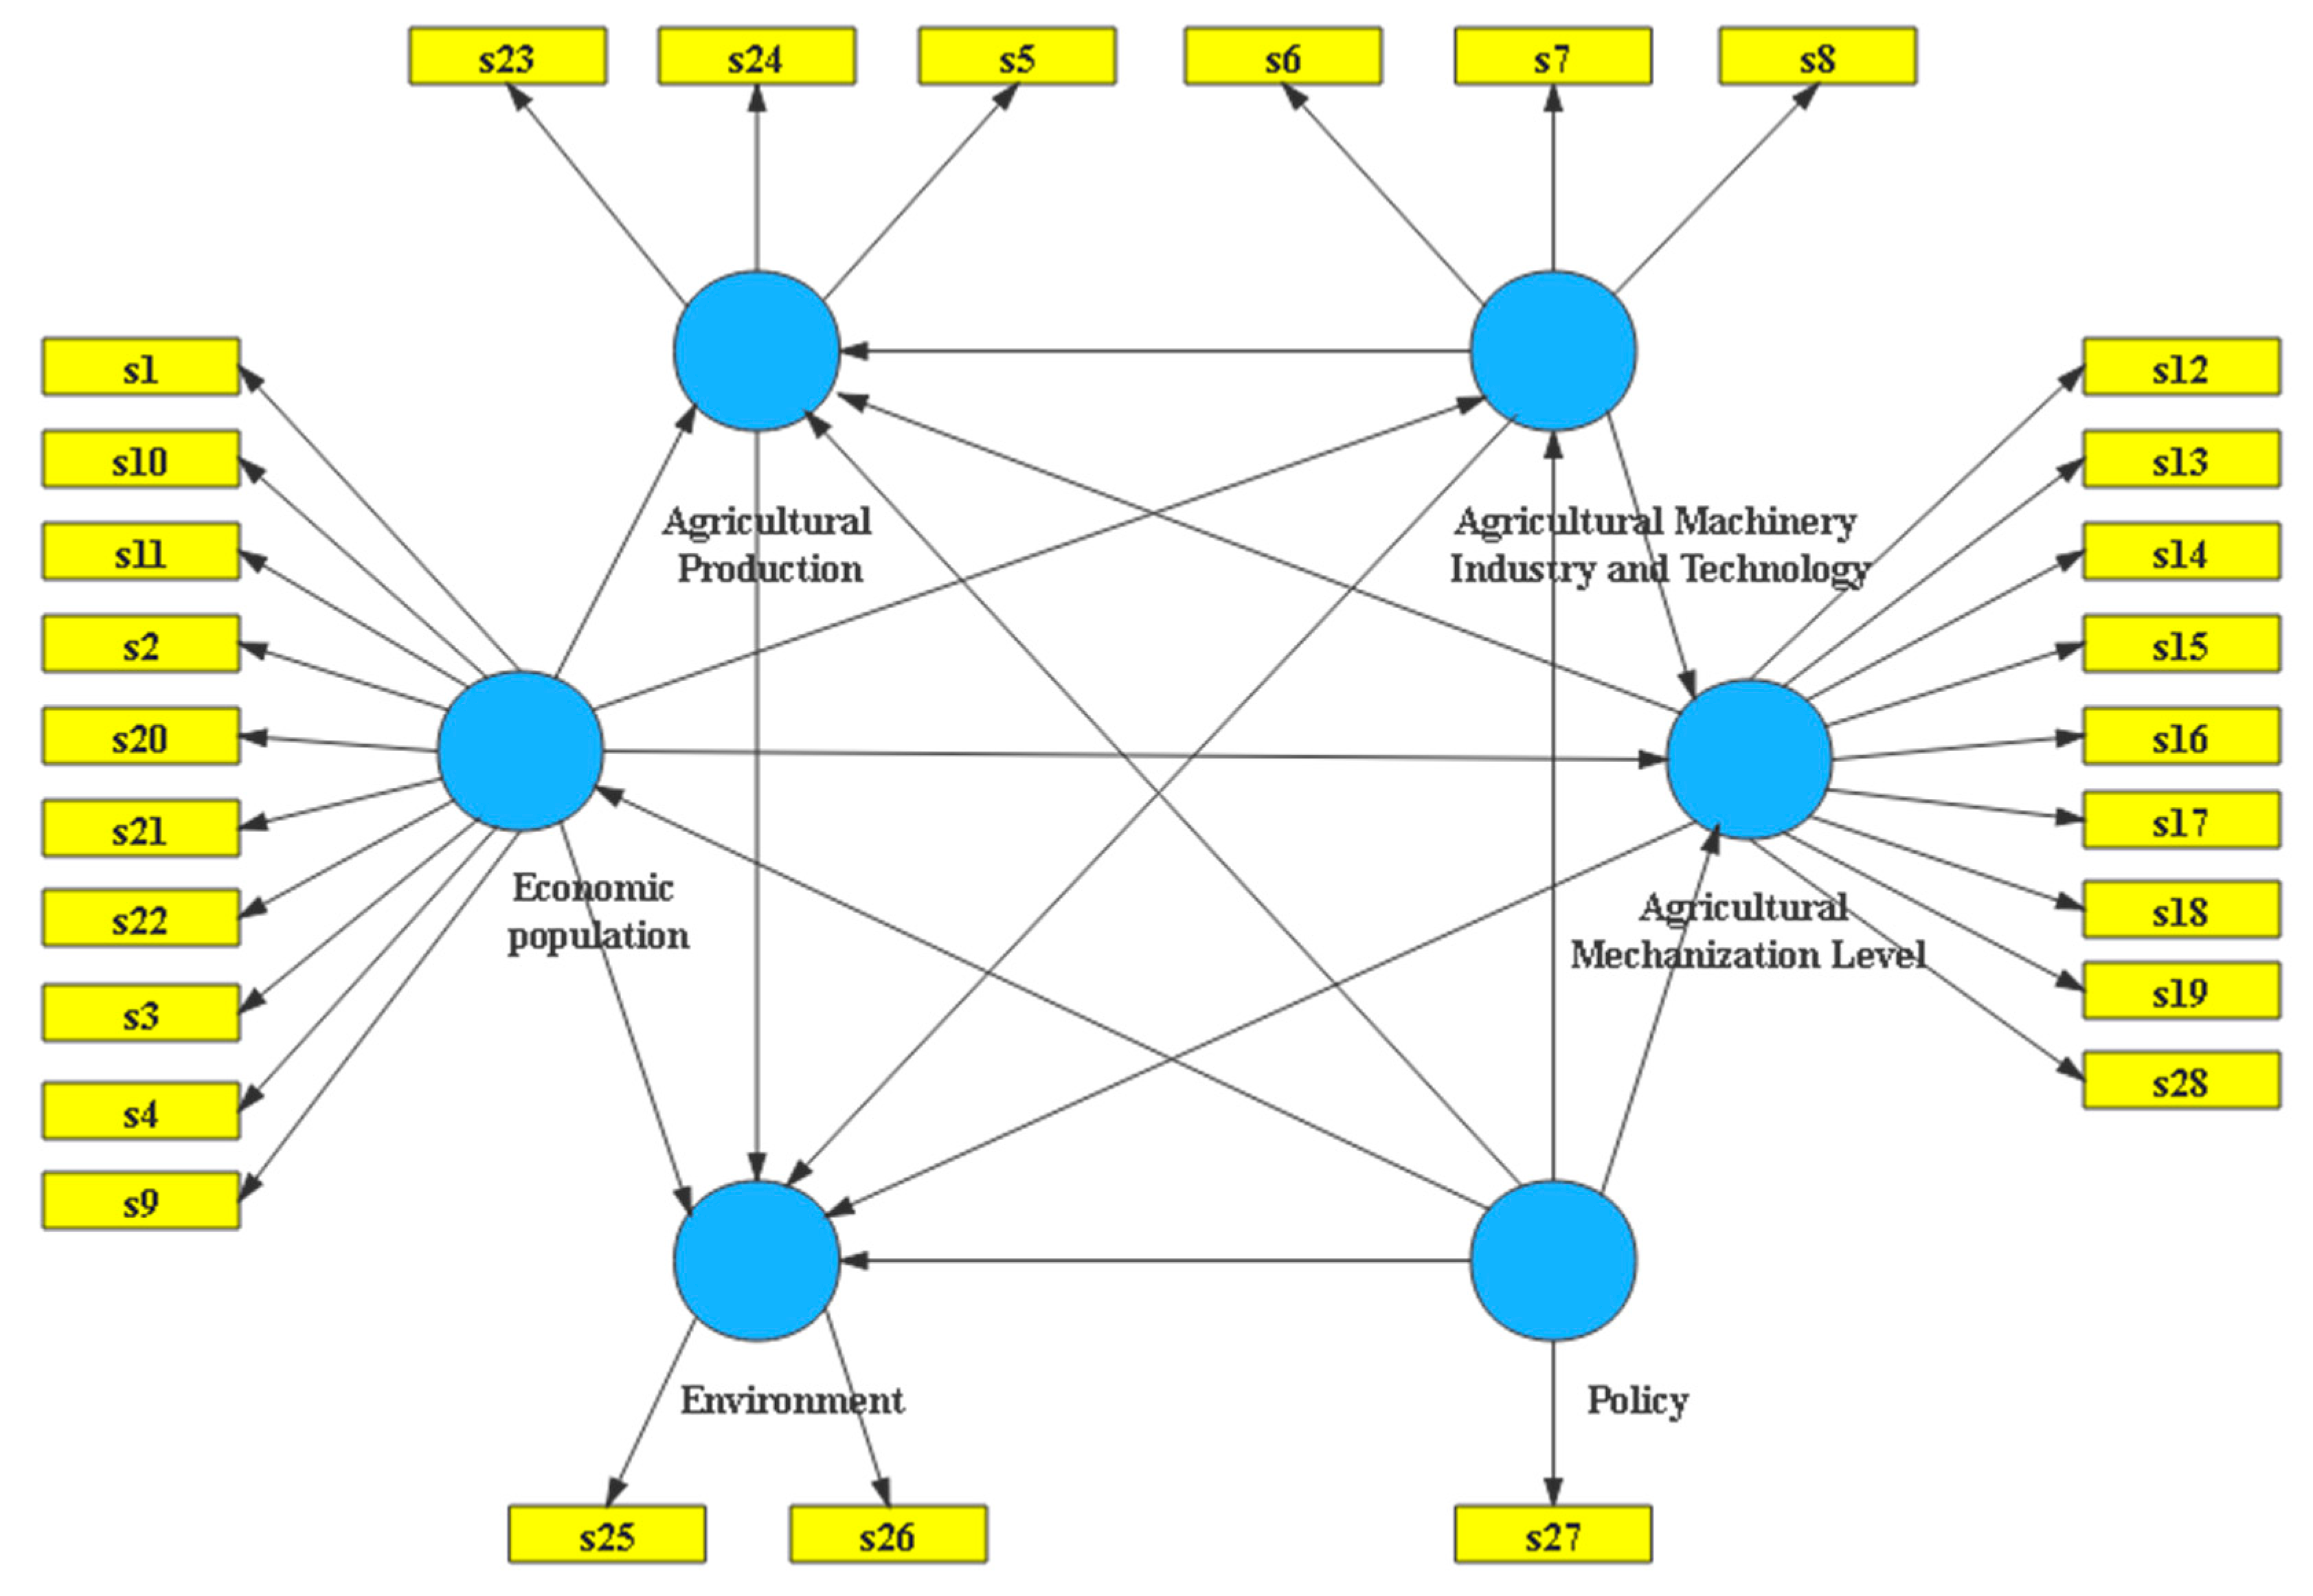
| Latent Variable | Manifest Variable | Variable Codes | Latent Variable | Manifest Variable | Variable Codes |
|---|---|---|---|---|---|
| EP | Gross Domestic Product of the region | s1 | AMDL | Machine farming area | s15 |
| EP | Agricultural investment in fixed assets | s2 | AMDL | Machine collecting area | s16 |
| EP | Number of employees in agriculture, forestry, animal husbandry, and fishery | s3 | AMDL | Total power of agricultural machinery | s17 |
| EP | The proportion of rural labor force with junior high school education or above | s4 | AMDL | Comprehensive operation rate of main crops cultivation and harvesting | s18 |
| AP | The sown area of food crops | s5 | AMDL | Number of farm machinery households | s19 |
| AMIAT | The sales output value of agricultural machinery industry | s6 | EP | The original value of agricultural machinery | s20 |
| AMIAT | The contribution rate of agricultural science and technology progress | s7 | EP | Total profit of agricultural machinery | s21 |
| AMIAT | Informationization level | s8 | EP | Per capita net income of farmers | s22 |
| EP | Total investment in agricultural mechanization | s9 | AP | Per capita food production | s23 |
| EP | Farm machinery purchase cost | s10 | AP | Agricultural output value | s24 |
| EP | Fixed base price index of mechanized farm tools | s11 | E | Agricultural diesel consumption | s25 |
| AMDL | Number of service organizations of agricultural mechanization | s12 | E | Agricultural carbon emissions | s26 |
| AMDL | Number of trainees in agricultural mechanization | s13 | P | Government Agricultural Machinery Policy Subsidies—National | s27 |
| AMDL | Machine sowing area | s14 | AMDL | Number of agricultural mechanization technology promotion agencies | s28 |
| Latent Variables | Average Variance Extracted | Composite Reliability | R Square | Cronbach’s Alpha |
|---|---|---|---|---|
| AP | 0.9611 | 0.9867 | 0.9796 | 0.9797 |
| AMDL | 0.8220 | 0.9442 | 0.9821 | 0.7682 |
| AMIAT | 0.9527 | 0.9837 | 0.9745 | 0.9751 |
| P | 1.0000 | 1.0000 | 1. 0000 | |
| E | 0.9771 | 0.9884 | 0.9941 | 0.9766 |
| EP | 0.8442 | 0.9557 | 0.9642 | 0.7932 |
| Path | Path Factor | t-Value |
|---|---|---|
| AP → Environment | −0.3868 | 8.5509 |
| AMDL → Environment | 0.7745 | 25.1899 |
| AMIAT → AP | 0.4656 | 9.0505 |
| AMIAT → Environment | 0.4313 | 6.5283 |
| Policy → AP | −0.3460 | 5.6425 |
| Policy → AMIAT | −0.2000 | 2.3704 |
| Policy → Environment | 0.1782 | 6.5167 |
| Policy → EP | 0.9818 | 468.6016 |
| EP → AP | 0.8638 | 10.3488 |
| EP → AMDL | 0.9905 | 521.7642 |
| EP → AMIAT | 1.1834 | 14.5986 |
| Path | Total Path Coefficient | t-Value |
|---|---|---|
| EP → AP | 1.4147 | 19.1034 |
| EP → Environment | 0.7304 | 21.1399 |
| AMIAT → Environment | 0.2512 | 5.1996 |
| Policy → AP | 0.9496 | 162.2230 |
| Policy → AMIAT | 0.9612 | 146.2765 |
| Policy → AMDL | 0.9725 | 343.0872 |
| Policy → Environment | 0.9787 | 378.2150 |
Publisher’s Note: MDPI stays neutral with regard to jurisdictional claims in published maps and institutional affiliations. |
© 2022 by the authors. Licensee MDPI, Basel, Switzerland. This article is an open access article distributed under the terms and conditions of the Creative Commons Attribution (CC BY) license (https://creativecommons.org/licenses/by/4.0/).
Share and Cite
Li, Z.; Zhu, M.; Huang, H.; Yi, Y.; Fu, J. Influencing Factors and Path Analysis of Sustainable Agricultural Mechanization: Econometric Evidence from Hubei, China. Sustainability 2022, 14, 4518. https://doi.org/10.3390/su14084518
Li Z, Zhu M, Huang H, Yi Y, Fu J. Influencing Factors and Path Analysis of Sustainable Agricultural Mechanization: Econometric Evidence from Hubei, China. Sustainability. 2022; 14(8):4518. https://doi.org/10.3390/su14084518
Chicago/Turabian StyleLi, Zhi, Ming Zhu, Huang Huang, Yu Yi, and Jingyi Fu. 2022. "Influencing Factors and Path Analysis of Sustainable Agricultural Mechanization: Econometric Evidence from Hubei, China" Sustainability 14, no. 8: 4518. https://doi.org/10.3390/su14084518
APA StyleLi, Z., Zhu, M., Huang, H., Yi, Y., & Fu, J. (2022). Influencing Factors and Path Analysis of Sustainable Agricultural Mechanization: Econometric Evidence from Hubei, China. Sustainability, 14(8), 4518. https://doi.org/10.3390/su14084518