
Potential Evolution of the Cooling Market in the EU27+UK: An Outlook until 2030

 ,
,  ,
,  , , and
Abstract
:1. Introduction
2. Materials and Methods
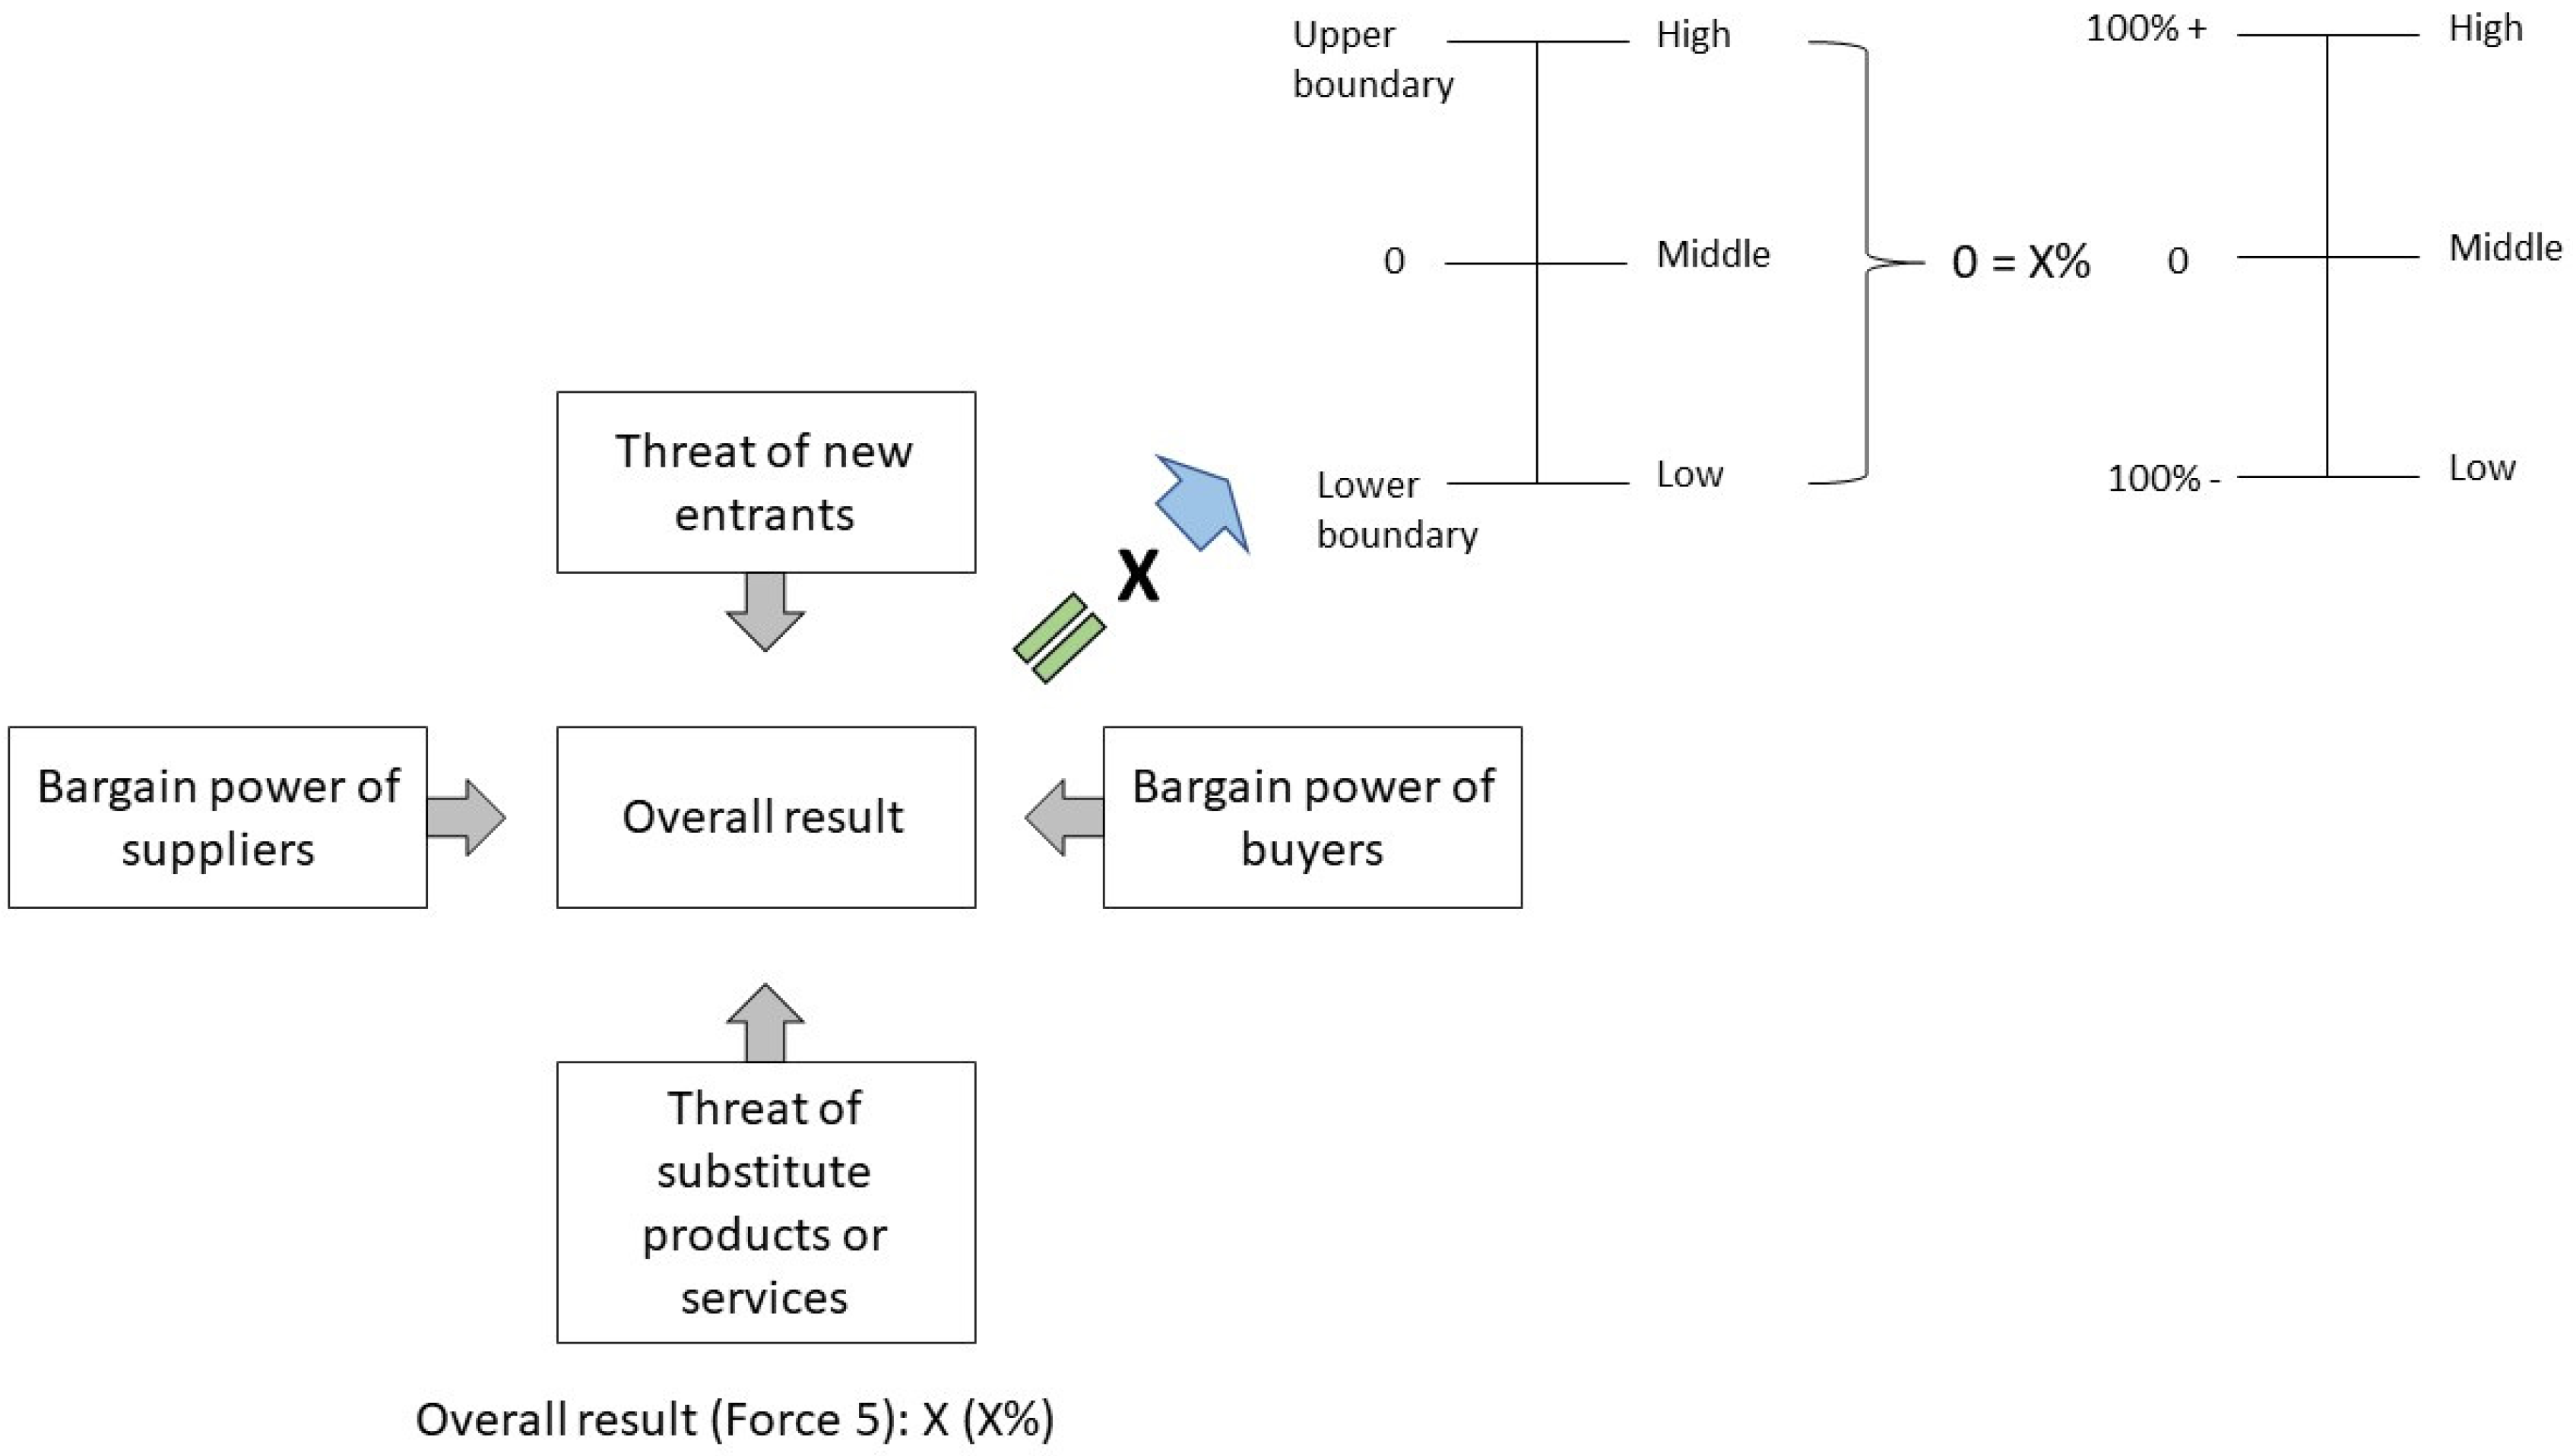
2.1. Porter’s Five Forces Analysis (PFFA)
- Force 1—market new entrant threat;
- Force 2—the service or product substitute threat;
- Force 3—the bargaining ability of suppliers;
- Force 4—the bargaining capacity of buyers;
- Force 5—the rivalry of the market’s existing competitors.
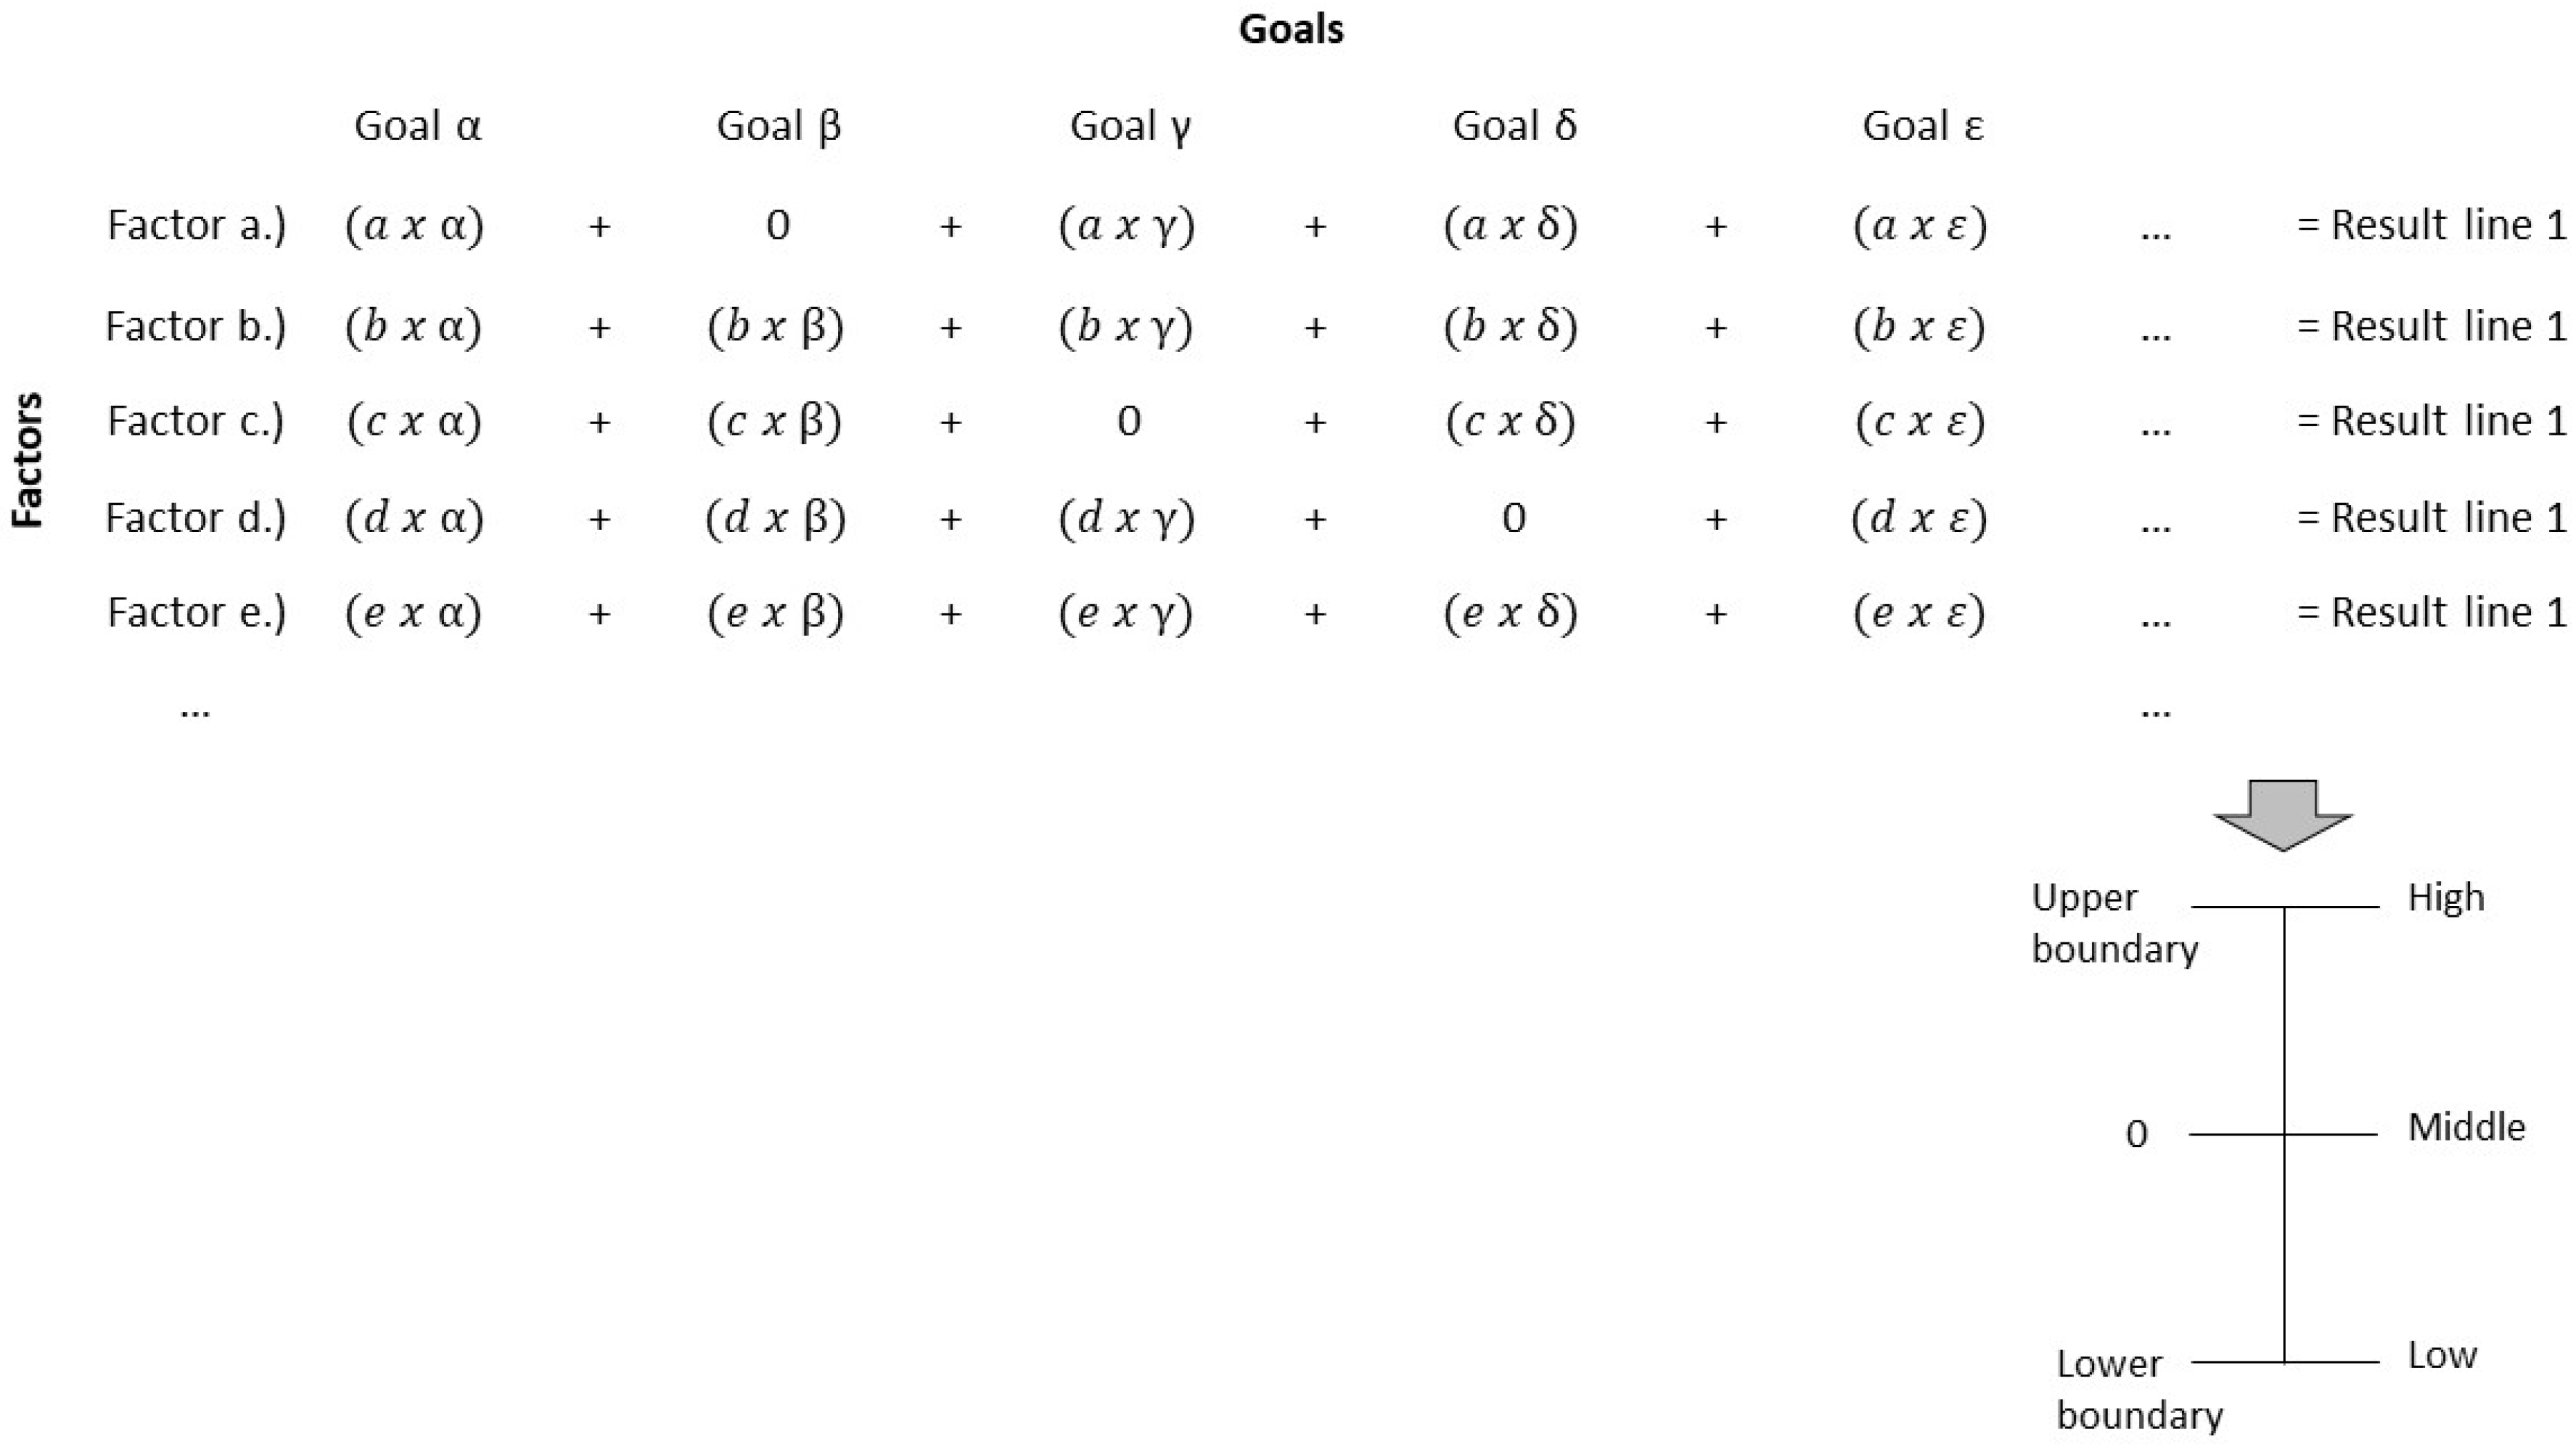
2.2. Multi-Criteria Decision Analysis (MCDA)
3. Results
3.1. Porter’s Five Forces Analysis
3.2. Multiple Criteria Decision Analysis
- EU27+UK: Currently, the cooling sector is regulated by European legislation, which involves great attention to the environmental impact, energy efficiency specifications, and RES energy generation. Particularly, relevant EU directives, regulations, and standards mark the cooling sector and its sub-sectors indirectly;
- Cooling equipment promoters: The potential development of the cooling sector is deeply influenced by the desire of equipment manufacturers to optimize their revenue. The ability of a company to create a profit that exceeds costs and other expenditures incurred in a certain time is defined as profitability [21,25];
- Cooling equipment clients: The future EU27+UK cooling market is controlled by the interest of potential customers to buy equipment with the leading cost–benefit ratio. The cost–benefit proportion defines the relationship between the current profit of a transaction and its opening price. Moreover, it defines parameters such as the quality and lifetime of a good [21,25,26].
4. Discussion
5. Conclusions
Author Contributions
Funding
Institutional Review Board Statement
Informed Consent Statement
Acknowledgments
Conflicts of Interest
Appendix A

| Force 1 | Force 2 | ||||||||||||||||
|---|---|---|---|---|---|---|---|---|---|---|---|---|---|---|---|---|---|
| Treat of New Entrants | Threat of Substitute Products and Services | ||||||||||||||||
| Economics of Scale | Costs of Market Entrance | Legislations | Technology Protection | Market Saturation | Market Image | Market Importance | Substitution of Services | Transportation Costs | Export Duties | Ventilators | Thermally Driven Heat Pumps | Natural Ventilation | Renouncement | District Cooling | Other Technologies | Energy Efficiency of Buildings | |
| 1 | 8+ | 8+ | 6+ | 5+ | 6− | 7.5− | 5− | 9+ | 3+ | 3+ | 1− | 3− | 1− | 3+ | 3+ | 3+ | 2− |
| 2 | 8+ | 9+ | 7+ | 6+ | 6− | 5− | 4− | 6+ | 3+ | 4.5+ | 1− | 2− | 4+ | 3+ | 1+ | 2− | |
| 3 | 7+ | 9+ | 8+ | 6+ | 7− | 5− | 2− | 7+ | 4+ | 4+ | 2− | 1− | 0 | 5+ | 2+ | 4+ | 1− |
| 4 | 2+ | 7+ | 8− | 6− | 2+ | 1+ | 4+ | 3− | 1− | 0 | 3+ | 1+ | 3+ | 1− | |||
| 5 | 9+ | 8+ | 5+ | 7+ | 4− | 3.5− | 6− | 8+ | 2+ | 3+ | 1− | 2.5− | 1− | 2+ | 4+ | 2− | |
| 6 | 7+ | 7+ | 3+ | 5+ | 5− | 4− | 5− | 9+ | 5+ | 5+ | 2− | 5− | 2.5− | 4+ | 0 | 2+ | |
| 7 | 4+ | 9+ | 7+ | 6− | 7− | 3− | 6+ | 6+ | 7+ | 0 | 1− | 6+ | 0 | 2+ | 0 | ||
| 8 | 8+ | 8+ | 4+ | 8− | 2− | 5− | 7+ | 4+ | 4+ | 4− | 1− | 5+ | 4.5+ | 1+ | 1− | ||
| 9 | 8+ | 6+ | 4− | 4− | 8+ | 1.5+ | 5.5+ | 0 | 3+ | 1.5+ | 2− | ||||||
| 10 | 9+ | 7+ | 4+ | 7+ | 4.5− | 2− | 9+ | 3+ | 5+ | 0 | 4− | 2− | 4+ | 0 | 0 | 1− | |
| 11 | 8+ | 7+ | 8+ | 4− | 5− | 4+ | 4.5+ | 2− | 3− | 0 | 7+ | 6+ | 3.5+ | ||||
| 12 | 9+ | 9+ | 9+ | 3− | 6− | 8+ | 9+ | 6+ | 3− | 4− | 3− | 6+ | 2+ | 0 | |||
| 13 | 7+ | 9+ | 7+ | 6− | 7.5− | 4− | 6+ | 5+ | 4+ | 1− | 3− | 2− | 4+ | 3+ | 5+ | 0 | |
| 14 | 4+ | 6− | 5− | 3− | 5+ | 2+ | 5+ | 0 | 0 | 5+ | 1.5+ | 1+ | 1.5− | ||||
| 15 | 8+ | 9+ | 7+ | 5− | 7− | 2− | 7+ | 3+ | 5.5+ | 2− | 3− | 0 | 3+ | 1+ | 3− | ||
| 16 | 8+ | 8+ | 8+ | 7− | 9+ | 5+ | 1− | 2− | o | 5+ | 0 | 2− | |||||
| 17 | 9+ | 9+ | 7+ | 5+ | 6− | 4− | 2− | 9+ | o | 3+ | 0− | 2− | 3− | 4+ | 0 | 0 | 3− |
| 18 | 7+ | 5+ | 9+ | 7− | 4− | 6+ | 4+ | 5+ | 0− | 3− | 2− | 5+ | 2+ | 3+ | 1.5− | ||
| 19 | 5+ | 7+ | 6+ | 5− | 3− | 8+ | 6.5+ | 9+ | 0− | o | 2.5− | 4+ | 1.5+ | 2.5+ | 0 | ||
| 20 | 9+ | 9+ | 8+ | 4− | 5+ | 0 | 4+ | 5− | 2− | 3+ | o | 3+ | 1− | ||||
| 21 | 10+ | 10+ | 8+ | 7− | 6− | 5− | 3+ | 3+ | 0− | 3.5− | 1− | 4+ | 6+ | 0 | |||
| 22 | 6+ | 9+ | 5− | 3− | 4− | 1+ | 1+ | 4+ | 2− | 4+ | 2+ | ||||||
| 23 | 7+ | 9+ | 6+ | 4.5− | 3− | 7+ | 3+ | 1− | 2− | o | 1+ | 4+ | o | ||||
| 24 | 8+ | 9+ | 7+ | 8+ | 7− | 5− | 4+ | 1+ | 3− | 2− | 4− | 4+ | 5+ | 5+ | 1− | ||
| 25 | 9+ | 8+ | 8+ | 7+ | 4− | 6− | 8+ | 5.5+ | 4+ | 1.5− | 3− | o | 5+ | 0 | 5+ | 1− | |
| 26 | 6+ | 8+ | 7+ | 5− | 6− | 3− | 9+ | 7+ | 1− | 2− | 3+ | 1.5+ | 1.5+ | ||||
| 27 | 6+ | 7+ | 8+ | 4− | 7.5− | 5− | 1+ | 6+ | o | 1.5− | 1.5− | 1+ | 2+ | 1.5− | |||
| 28 | 7+ | 4+ | 8+ | 2+ | 2− | 2− | 2.5− | 2.5+ | 2.5+ | 5+ | 2− | 2− | 2− | 2.5+ | 1+ | 1+ | 4− |
| Number of answers | 27 | 22 | 23 | 17 | 22 | 23 | 25 | 24 | 27 | 26 | 26 | 23 | 25 | 26 | 24 | 25 | 24 |
| Force 1 | Force 2 | ||||||||||||||||
| Treat of new entrants | Threat of substitute products and services | ||||||||||||||||
| Evaluated forces | Economics of scale | Costs of market entrance | Legislations | Technology protection | Market saturation | Market Image | Market importance | Substitution of services | Transportation costs | Export duties | Ventilators | Thermally driven heat pumps | Natural ventilation | Renouncement | District cooling | Other technologies | Energy efficiency of buildings |
| First Quartile | 7 | 7 | 7 | 5 | 5 | 4 | 3 | 6 | 2 | 4 | 0 | 2 | 0 | 3 | 1 | 1 | 1 |
| Third Quartile | 9 | 9 | 8 | 7 | 7 | 6 | 5 | 8 | 4.5 | 5 | 2 | 3 | 2 | 5 | 2 | 4 | 2 |
| Interquartile Range | 2 | 2 | 1 | 2 | 2 | 2 | 2 | 2 | 2.5 | 1 | 2 | 1 | 2 | 2 | 1.5 | 3 | 1 |
| Final result | 7+ | 8+ | 7+ | 6+ | 6− | 5− | 4− | 7+ | 3+ | 5+ | 1− | 2− | 1− | 4+ | 2+ | 3+ | 1− |
| Force 3 | Force 4 | ||||||||||||||||
| Bargain power of suppliers | Bargain power of buyers | ||||||||||||||||
| Competitiveness | Size and concentration relative to the industry partecipants | Possibility to forward integration of suppliers | Fragmentation of customers | Market support | Investor’s interest | Climate change | Multifunctionalities | Customer loyalty measures | Comfort | Sale price reduction | Concentration of customers | Differentiation of technologies | Risk of failure | ||||
| 1 | 3− | 7+ | 7+ | 1+ | 6+ | 6+ | 8.5+ | 4+ | 3+ | 7+ | 6− | 3− | 3− | 4+ | |||
| 2 | 0 | 9+ | 5+ | 1+ | 5+ | 7+ | 7.5 | 2+ | 2+ | 4+ | 4− | 7+ | |||||
| 3 | 1− | 9.5+ | 6+ | 2+ | 6+ | 8+ | 4+ | 3+ | 9+ | 6− | 2− | 2− | 4.5+ | ||||
| 4 | 2− | 9+ | 7+ | 1+ | 4+ | 10+ | 3+ | 5+ | 7+ | 9− | 1− | 5+ | |||||
| 5 | 2− | 6.5+ | 5+ | 3+ | 3+ | 3.5+ | 5+ | 10+ | 1+ | 4+ | 6+ | 2− | 5−2− | 2.5+ | |||
| 6 | 3− | 6+ | 2+ | 2.5+ | 1.5+ | 9+ | 4+ | 1+ | 10+ | 4− | 4− | 3− | |||||
| 7 | 1− | 8+ | 4+ | 6+ | 6+ | 9+ | 5+ | 3+ | 9+ | 5− | 6− | 7+ | |||||
| 8 | 0 | 7+ | 5+ | 0 | 7.5+ | 8.5+ | 6.5+ | 2+ | 6− | 0 | 6.5+ | ||||||
| 9 | 0 | 10+ | 8+ | 5+ | 3+ | 10+ | 4+ | 8.5+ | 8− | 0 | 8− | 2+ | |||||
| 10 | 2− | 7.5+ | 7+ | 2+ | 4+ | 5+ | 9+ | 3+ | 5+ | 9+ | 7− | 2− | 3− | 3+ | |||
| 11 | 1− | 9+ | 9+ | 3+ | 4+ | 9+ | 3+ | 10+ | 9− | 4− | 4− | 7+ | |||||
| 12 | 1− | 3+ | + | 1+ | 9+ | 4+ | 2+ | 9.5+ | 1− | 2− | 4+ | ||||||
| 13 | 7+ | 7+ | 6+ | 8+ | 1.5+ | 5+ | 4− | 2− | 5− | 8+ | |||||||
| 14 | 1− | 8+ | 2.5+ | 1+ | 5.5+ | 9+ | 3+ | 3+ | 10+ | 5− | 1− | 5+ | |||||
| 15 | 2− | 9+ | 6+ | 1+ | 6+ | 2.5+ | 10+ | 4+ | 5+ | 9+ | 5− | 2+ | |||||
| 16 | 0 | 4.5+ | 5+ | 1+ | 0+ | 5+ | 10+ | 2+ | 3+ | 8+ | 7− | 0 | |||||
| 17 | 2− | 7+ | 6+ | 0 | 3+ | 7+ | 8+ | 0 | 2+ | 8.5+ | 8− | 6− | 6− | 5+ | |||
| 18 | 1− | 6+ | 7+ | 4.5+ | 8.5+ | 3+ | 10+ | 7− | 3− | 3+ | |||||||
| 19 | 8+ | 8+ | 1+ | 5+ | 9+ | 5+ | 4+ | 10+ | 7− | 4− | |||||||
| 20 | 7+ | 3+ | 7+ | 5.5+ | 7+ | 5− | 2− | 0 | 6+ | ||||||||
| 21 | 1− | 8+ | 1.5+ | 0+ | 0+ | 5+ | 9+ | 4+ | 3+ | 9+ | 2− | 2− | 3.5+ | ||||
| 22 | 0 | 10+ | 5+ | 0+ | 2+ | 7.5+ | 9+ | 8+ | 4− | 2− | |||||||
| 23 | 0 | 3.5+ | 3+ | 5+ | 4+ | 2+ | 9+ | 1− | 2− | 6+ | |||||||
| 24 | 0 | 5+ | 2+ | + | 10+ | 4+ | 9+ | 3+ | |||||||||
| 25 | 6− | 9+ | 7+ | 3+ | 5+ | 5+ | 9+ | 1.5+ | 3+ | 7− | 3− | 5− | + | ||||
| 26 | 1− | 7+ | 8+ | 1+ | 4.5+ | 9+ | 2+ | 4+ | 9+ | 4− | 5− | 5− | 6+ | ||||
| 27 | 2− | 8.5+ | 9+ | 2+ | 6+ | 4+ | 9.5+ | 5+ | 5+ | 10+ | 6− | 6+ | |||||
| 28 | 2+ | 6+ | 8+ | 2+ | +6 | 7− | 3− | 3+ | |||||||||
| Number of answers | 24 | 23 | 25 | 23 | 21 | 22 | 25 | 24 | 24 | 25 | 23 | 19 | 24 | 22 | |||
| Force 3 | Force 4 | ||||||||||||||||
| Bargain power of suppliers | Bargain power of buyers | ||||||||||||||||
| Evaluated forces | Competitiveness | Size and concentration relative to the industry participants | Possibility to forward integration of suppliers | Fragmentation of customers | Market support | Investor’s interest | Climate change | Multifunctionalities | Customer loyalty measures | Comfort | Sale price reduction | Concentration of customers | Differentiation of technologies | Risk of failure | |||
| First Quartile | 0 | 7 | 5 | 1 | 3 | 5 | 8.5 | 2 | 2 | 8 | 4 | 2 | 2 | 3 | |||
| Third Quartile | 2 | 9 | 7 | 2 | 6 | 6 | 9.5 | 4 | 4 | 10 | 7 | 5 | 5 | 6 | |||
| Interquartile Range | 2 | 2 | 2 | 1 | 3 | 1 | 1 | 2 | 2 | 2 | 3 | 3 | 3 | 3 | |||
| Final result | 1− | 8+ | 6+ | 1+ | 4+ | 5+ | 9+ | 3+ | 3+ | 9+ | 6− | 3− | 3− | 5+ | |||
| Goals | ||||||||||||||
|---|---|---|---|---|---|---|---|---|---|---|---|---|---|---|
| EU Directives | EU Regulations | EU Standards | Income Max. | Benefit to Cost Max. | ||||||||||
| N° | 2010/31 EU: EPBD | 2018/2001EU: REDII | 2009/125 Ecodesign Dir. | EU—EED 2018/2002 | 66/2010: EU Ecolabel | EU Reg. N° 517/2014 | Test Requirements | Earnings Generation | Expenses Reduction | Gain Max. | Cost Min. | |||
| 1 | 3+ | 7+ | 2.5+ | 5.5+ | 7+ | 4+ | 6+ | 9+ | 8+ | 7+ | 7+ | |||
| 2 | 3+ | 6+ | 1+ | 7+ | 6+ | 2.5+ | 7+ | 7+ | 7.5+ | 8+ | 8+ | |||
| 3 | 4+ | 6+ | 7+ | 9+ | 8+ | 8+ | 10+ | 8+ | 10+ | |||||
| 4 | 8+ | 1+ | 2+ | 5+ | 6+ | 0 | 9+ | 9.5+ | 8+ | |||||
| 5 | 7+ | 5+ | 3+ | 3+ | 5+ | 4+ | 8+ | 9+ | 6+ | 7+ | ||||
| 6 | 6+ | 4+ | 6+ | 2.5+ | 9+ | 8+ | 7+ | 9+ | ||||||
| 7 | 2+ | 3+ | 2+ | 2+ | 7+ | 6+ | 7+ | 8+ | 7.5+ | 8+ | 7+ | |||
| 8 | 6+ | 4+ | 4+ | 6+ | 3+ | 7+ | 7+ | 8+ | 7+ | 9+ | 6.5+ | |||
| 9 | 5+ | 4+ | 5.5+ | 3.5+ | 4+ | 4+ | 3.5+ | 7+ | 9.5+ | 8+ | 8+ | |||
| 10 | 8+ | 6+ | 1.5+ | 1+ | 5+ | 5+ | 7+ | 7+ | 10+ | 7+ | 7+ | |||
| 11 | 8+ | 3+ | 5+ | 2.5+ | 5+ | 5.5+ | 8+ | 8+ | 9+ | |||||
| 12 | 9+ | 6+ | 4+ | 6+ | 5.5+ | 5+ | 7+ | 9+ | 9.5+ | 4+ | ||||
| 13 | 6+ | 2+ | 5+ | 3.5+ | 7.5+ | 3.5+ | 3+ | 8+ | ||||||
| 14 | 4.5+ | 3+ | 6+ | 6+ | 6+ | 6+ | 8+ | 8+ | 7+ | 6+ | ||||
| 15 | 5+ | 7+ | 6+ | 4+ | 7+ | 4+ | 9+ | 9+ | 6+ | 8+ | 7+ | |||
| 16 | 5+ | 5.5+ | 2.5+ | 3.5+ | 7+ | 8+ | 9.5+ | 7+ | 7+ | 9.5+ | ||||
| 17 | 4+ | 7+ | 6+ | 7.5+ | 7.5+ | 3+ | 8+ | 8+ | 8+ | 7+ | ||||
| 18 | 2.5+ | 6+ | 5+ | 2.5+ | 3+ | 2.5+ | 7+ | 8+ | + | 9+ | 9+ | |||
| 19 | 5+ | 3+ | 1+ | 9+ | 4+ | 7+ | 6.5+ | 9+ | 8+ | 7+ | ||||
| 20 | 6+ | 5+ | 5+ | 4+ | 5+ | 7.5+ | 8+ | 0+ | 9.5+ | |||||
| 21 | 5+ | 6+ | 4+ | 6+ | 6+ | 0 | 10+ | 3+ | ||||||
| 22 | 8+ | 8+ | 0+ | 4.5+ | 3.5+ | 7+ | 7+ | 9+ | 9+ | 9+ | 7+ | |||
| 23 | 7.5+ | 6+ | 6+ | 7+ | 8+ | 8+ | 9+ | |||||||
| 24 | 9+ | 6+ | 3+ | 1.5+ | 5+ | 3+ | 7+ | 2.5+ | 7+ | 7+ | 6.5+ | |||
| 25 | 4.5+ | 7+ | 4+ | 2+ | 8+ | 4+ | 8+ | 9+ | 5.5+ | 9+ | ||||
| 26 | 6+ | 5+ | 1+ | 4+ | 3+ | 5+ | 4+ | 5+ | 9.5+ | 7+ | 7+ | |||
| 27 | 4+ | 6+ | 6+ | 7+ | 9+ | 8+ | 8+ | 8+ | ||||||
| 28 | 7+ | 7+ | 3+ | 5+ | 6+ | 4+ | 7+ | 7+ | 6.5+ | 6.5+ | ||||
| Number of answers | 23 | 25 | 26 | 25 | 25 | 25 | 23 | 27 | 25 | 25 | 26 | |||
| Evaluated goals & factors | EU Directives | EU Regulations | EU Standards | Income Max. | Benefit to Cost Max. | |||||||||
| 2010/31 EU: EPBD | 2018/2001EU: REDII | 2009/125 Ecodesign Dir. | EU—EED 2018/2002 | 66/2010: EU Ecolabel | EU Reg. N° 517/2014 | Test requirements | Earnings generation | Expenses reduction | Gain Max. | Cost Min. | ||||
| First Quartile | 5 | 4 | 2 | 4 | 5 | 3.5 | 6 | 7 | 7 | 7 | 7 | |||
| Third Quartile | 7 | 6 | 5 | 6 | 7 | 6 | 7 | 9 | 9 | 8 | 9 | |||
| Interquartile Range | 3 | 2 | 3 | 3 | 2 | 3 | 1 | 2 | 2 | 1 | 2 | |||
| Final result | 6+ | 5+ | 3+ | 4+ | 6+ | 4+ | 6+ | 8+ | 8+ | 8+ | 8+ | |||
| Factors | ||||||||||||||
| Market potential | R&D | Habits | Weather | Costs | Replacement | Comfort | Competition | Building | ||||||
| N° | Number of installed units | Energy Efficiency | R&D funding | Energy consumption for cooling purposes | Climate change | Costumer’s investemt costs | Running costs | Disposal costs | Transportation costs | Life span of cooling equipment | Comfort requests | Size and concentration of the cooling market | Costumer loyality measures | Buildings efficiency increase |
| 1 | 6+ | 7+ | 7+ | 4+ | 8.5+ | 3− | 4− | 1.5− | 1− | 2+ | 8+ | 4+ | 1+ | 2− |
| 2 | 7+ | 6+ | 6+ | 5+ | 7.5+ | 2− | 2− | 3+ | 7+ | 3+ | 1+ | 4− | ||
| 3 | 5+ | 7+ | 7+ | 8+ | 5− | 4− | 5− | 2− | 4+ | 6+ | 2+ | 0 | 3− | |
| 4 | 4+ | 8+ | 8+ | 3+ | 10+ | 4− | 5− | 1.5− | 5− | 1+ | 4+ | 4+ | 0 | 5− |
| 5 | 8+ | 8+ | 6+ | 10+ | 4.5− | 6− | 4− | 1− | 2+ | 8+ | 5+ | 1− | ||
| 6 | 6+ | 7+ | 5+ | 6+ | 1− | 4− | 4− | 1− | 3+ | 9+ | 3+ | 3+ | o | |
| 7 | 6+ | 6+ | 8+ | 4+ | 9+ | 8− | 5− | 2− | 2− | 4+ | 9+ | 4+ | 2+ | |
| 8 | 5+ | 7+ | 9+ | 7+ | 8.5+ | 7− | 1− | 3− | 3− | 2+ | 9+ | 6+ | 1+ | o |
| 9 | 7+ | 8+ | 10+ | 5+ | 10+ | 8.5− | 0 | 2− | 4− | 9+ | 5+ | 3+ | ||
| 10 | 7+ | 6+ | 8+ | 6+ | 9+ | 5− | 7− | 2− | 2− | 2+ | 6+ | 3+ | 3+ | 2.5− |
| 11 | 7+ | 7+ | 8+ | 3+ | 9+ | 4.5− | 6− | 7− | 3− | 3+ | 7+ | 4+ | 0 | 3− |
| 12 | 5+ | 6+ | 7+ | 4+ | 4− | 7− | 2− | 1− | 4+ | 8+ | 2+ | 0 | 1.5− | |
| 13 | 7+ | 7+ | 7+ | 6+ | 9+ | 2− | 4− | 4− | 0 | 4+ | 6+ | 2+ | 1− | |
| 14 | 8+ | 6+ | 3+ | 7.5+ | 7.5− | 5− | 3− | 0 | 5+ | 1+ | 0+ | |||
| 15 | 8+ | 7+ | 3+ | 7+ | 3− | 3+ | 8+ | 1− | ||||||
| 16 | 6+ | 8+ | 9+ | 8+ | 4+ | 6+ | 4+ | 1+ | 3− | |||||
| 17 | 7+ | 8+ | 9+ | 7.5− | 3− | 3− | 0 | 7+ | 2+ | 0 | ||||
| 18 | 7+ | 8+ | 7.5+ | 7+ | 4− | 4− | 2− | 2− | 2+ | 9+ | 5+ | 1+ | ||
| 19 | 6+ | 8+ | 6+ | 8+ | 8.5+ | 3− | 5− | 3.5− | 1− | 4+ | 9+ | 4+ | 3+ | o |
| 20 | 8+ | 7+ | 7+ | 8+ | 8+ | 6.5− | 4− | 5− | 3− | 2+ | 8+ | 3+ | 2+ | 1− |
| 21 | 7+ | 6+ | 9+ | 5+ | 9+ | 1− | 3− | 6− | 2− | 3+ | 7+ | 4+ | 1+ | 2.5− |
| 22 | 6+ | 7+ | 9.5+ | 3+ | 10+ | 5+ | 8+ | 5+ | 1+ | |||||
| 23 | 6+ | 6+ | 6+ | 7− | 2− | 3− | 1− | 3+ | 9+ | 4+ | 5− | |||
| 24 | 7+ | 7+ | 6+ | 7.5+ | 6.5− | 3− | 2− | 0 | 5+ | 9+ | 3+ | 0 | 3− | |
| 25 | 6+ | 7+ | 4.5+ | 5+ | 9+ | 7− | 2− | 7− | 0 | 6+ | 5+ | 0 | 2− | |
| 26 | 6+ | 7+ | 7+ | 6+ | 9+ | 4.5− | 5− | 2− | 0 | 1+ | 3+ | 0 | 2− | |
| 27 | 7+ | 8+ | 10+ | 6+ | 3− | 4− | 3− | 1− | 3+ | 7+ | 5+ | 2+ | ||
| 28 | 8+ | 7− | 7− | 3− | 2− | 1+ | 7.5+ | 4+ | 1+ | 3− | ||||
| Number of answers | 23 | 26 | 25 | 26 | 22 | 26 | 25 | 24 | 24 | 25 | 26 | 26 | 24 | 22 |
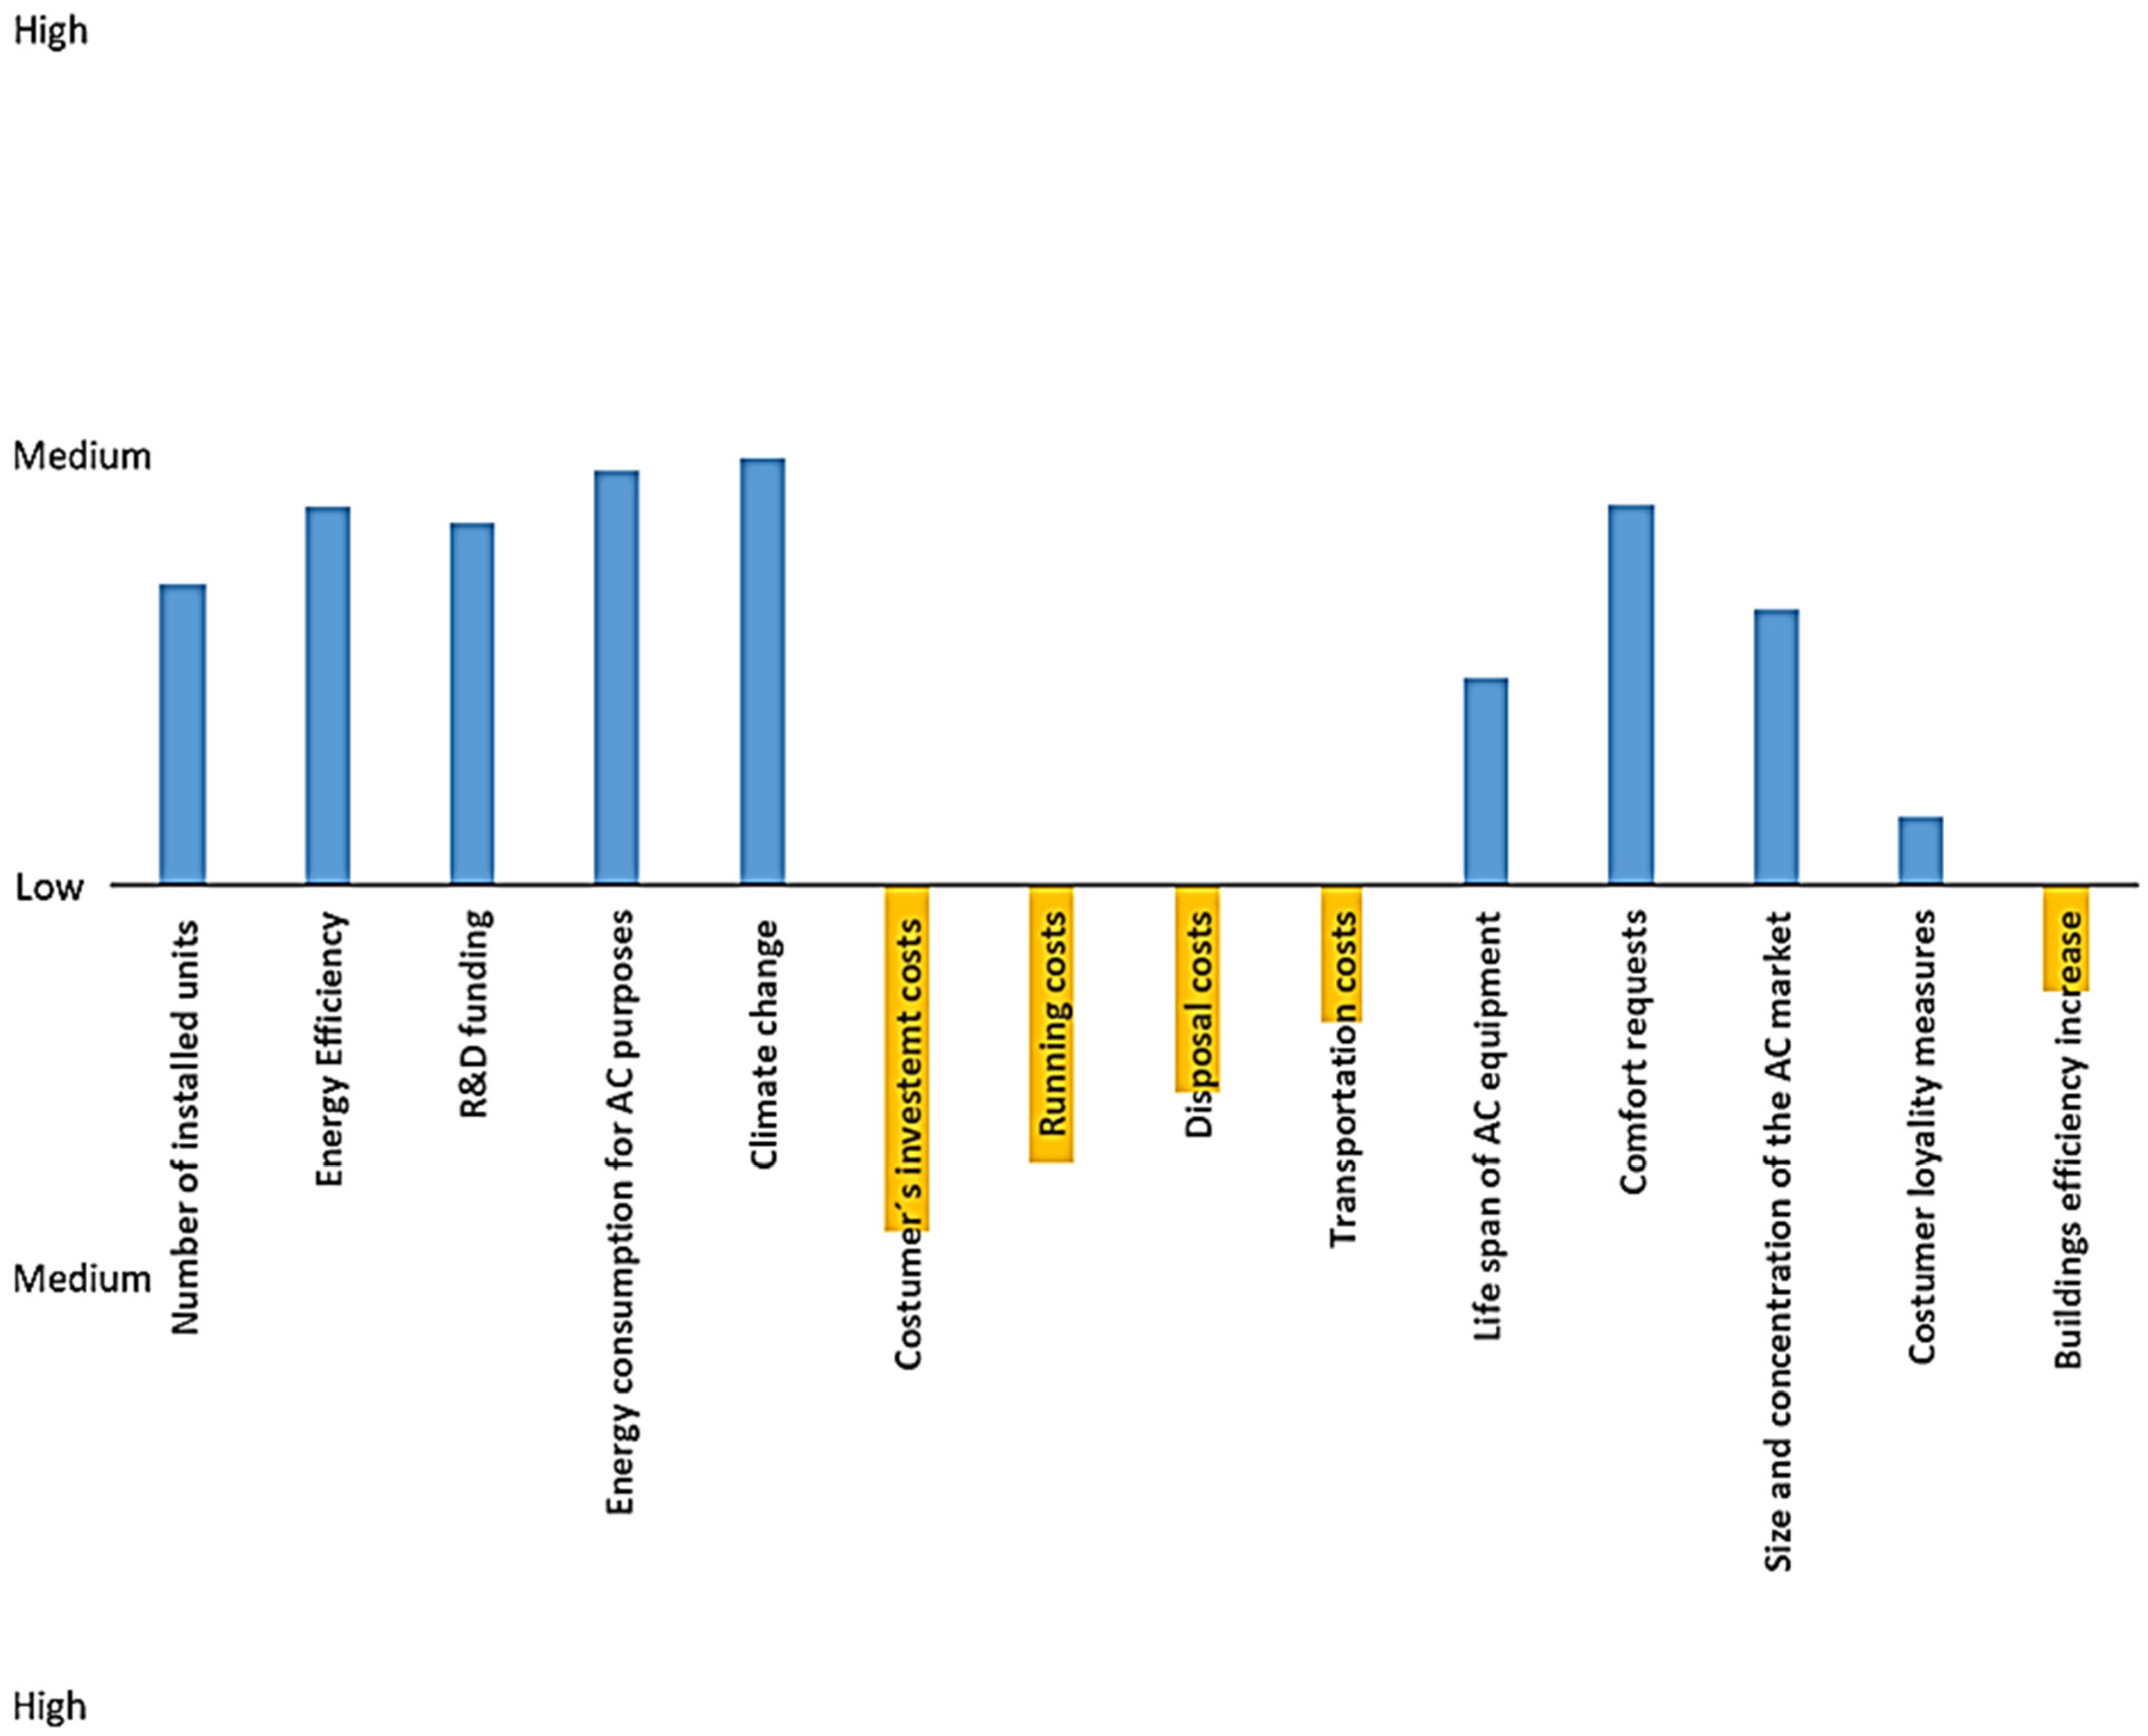
| Market potential | R&D | Habits | Weather | Costs | Replacement | Comfort | Competition | Building | ||||||
| Evaluated goals & factors | Number of installed units | Energy Efficiency | R&D funding | Energy consumption for cooling purposes | Climate change | Costumer’s investemt costs | Running costs | Disposal costs | Transportation costs | Life span of cooling equipment | Comfort requests | Size and concentration of the cooling market | Costumer loyality measures | Buildings efficiency increase |
| First Quartile | 6 | 6 | 6 | 4 | 8 | 3 | 3 | 2 | 1 | 2 | 7 | 3 | 0 | 1 |
| Third Quartile | 7 | 8 | 8 | 7 | 9 | 7 | 5 | 4 | 2 | 4 | 9 | 5 | 2 | 3 |
| Interquartile Range | 1 | 1.5 | 2 | 2.5 | 1 | 4 | 2 | 2 | 1 | 2 | 2 | 2 | 2 | 2 |
| Final result | 6+ | 7+ | 7+ | 6+ | 9+ | 5− | 4− | 3− | 2− | 3+ | 8+ | 4+ | 1+ | 2− |
References
- European Commission. 2020 Climate & Energy Package. Available online: https://ec.europa.eu/clima/policies/strategies/2020_en (accessed on 8 February 2022).
- European Commission. Impact Assessment, Accompanying Communication ’Stepping up Europe’s 2030 Climate Ambition—Investing in a Climate-Neutral Future for the Benefit of Our People; SWD—STAFF Working Document European Commission, No. 176 Final; European Commission: Brussels, Belgium, 2020.
- European Commission. Proposal for a Regulation of the European Parliament and of the Council Establishing the Framework for Achieving Climate Neutrality and Amending REGULATION (EU) 2018/1999 (European Climate Law); EN 2020, 2020/0036; European Commission: Brussels, Belgium, 2020.
- Energy Savings Statistics. Available online: https://ec.europa.eu/eurostat/statistics-explained/index.php/Energy_saving_statistics#Final_energy_consumption_and_distance_to_2020_and_2030_targets (accessed on 13 October 2020).
- Eurostat. Table on EU Policy-Europe 2020 Indicators-Headline Indicators-Climate Change and Energy-Primary Energy Consumption. Available online: https://ec.europa.eu/eurostat/databrowser/view/t2020_33/default/table?lang=en (accessed on 8 February 2022).
- Pezzutto, S.; Croce, S.; ZambottI, S.; Kranzl, L.; Novelli, A.; Zambelli, P. Assessment of the Space Heating and Domestic Hot Water Market in Europe—Open Data and Results. Energies 2019, 12, 1760. [Google Scholar] [CrossRef] [Green Version]
- Pezzutto, S.; De Felice, M.; Fazeli, R.; Kranzl, L.; ZambottI, S. Status Quo of the Air-Conditioning Market in Europe: Assessment of the Building Stock. Energies 2017, 10, 1253. [Google Scholar] [CrossRef] [Green Version]
- Rehfeldt, M.; Fleiter, T.; Toro, F. A bottom-up estimation of the heating and cooling demand in European industry. Energy Effic. 2018, 11, 1057–1082. [Google Scholar] [CrossRef]
- European Commission. JRC-IDEES 2015. Available online: https://data.jrc.ec.europa.eu/dataset/jrc-10110-10001 (accessed on 7 February 2022).
- EU. Directive (EU) 2018/2001 of the European Parliament and of the Council on the Promotion of the Use of Energy from Renewable Sources. Off. J. Eur. Union 2018, 2018, 82–209. [Google Scholar]
- Gang, W.; Wang, S.; Xiao, F.; Gao, D.-C. District cooling systems: Technology integration, system optimization, challenges and opportunities for applications. Renew. Sustain. Energy Rev. 2016, 53, 253–264. [Google Scholar] [CrossRef]
- Possibilities with more district cooling in Europe. Available online: https://ec.europa.eu/energy/intelligent/projects/sites/iee-projects/files/projects/documents/ecoheatcool_more_district_cooling_in_europe.pdf (accessed on 26 February 2021).
- Eveloy, V.; Ayou, D.S. Sustainable District Cooling Systems: Status, Challenges, and Future Opportunities, with Emphasis on Cooling-Dominated Regions. Energies 2019, 12, 235. [Google Scholar] [CrossRef] [Green Version]
- International Energy Agency (IEA). The Future of Cooling: Opportunities for Energy-Efficient Air Conditioning; Future Cooling; International Energy Agency: Paris, France, 2018. [Google Scholar] [CrossRef]
- Pezzutto, S.; Fazeli, R.; De Felice, M.; Sparber, W. Future development of the air-conditioning market in Europe: An outlook until 2020. WIREs Energy Environ. 2016, 5, 649–669. [Google Scholar] [CrossRef]
- Porter, M.E. How Competitive Forces Shape Strategy. Readings in Strategic Management 1989, 133–143. [Google Scholar] [CrossRef]
- Pezzutto, S.; Grilli, G.; ZambottI, S.; Dunjic, S. Forecasting Electricity Market Price for End Users in EU28 until 2020—Main Factors of Influence. Energies 2018, 11, 1460. [Google Scholar] [CrossRef] [Green Version]
- Deng, J.; Wang, R.; Han, G. A review of thermally activated cooling technologies for combined cooling, heating and power systems. Prog. Energy Combust. Sci. 2011, 37, 172–203. [Google Scholar] [CrossRef]
- Wan, X.; Wang, W.; Liu, J.; Tong, T. Estimating the sample mean and standard deviation from the sample size, median, range and/or interquartile range. BMC Med. Res. Methodol. 2014, 14, 135. [Google Scholar] [CrossRef] [PubMed] [Green Version]
- Li, Y.; Wang, J.; Zhao, D.; Li, G.; Chen, C. A two-stage approach for combined heat and power economic emission dispatch: Combining multi-objective optimization with integrated decision making. Energy 2018, 162, 237–254. [Google Scholar] [CrossRef] [Green Version]
- Li, Y.; Li, Y.; Li, G.; Zhao, D.; Chen, C. Two-stage multi-objective OPF for AC/DC grids with VSC-HVDC: Incorporating decisions analysis into optimization process. Energy 2018, 147, 286–296. [Google Scholar] [CrossRef] [Green Version]
- Pezzutto, S.; Sparber, W.; Fedrizzi, R. Analysis of the space heating and cooling market in Europe. In Proceedings of the 3rd International PhD-Day of the AAEE Student Chapter, Linz, Austria, 12–14 February 2014. [Google Scholar] [CrossRef]
- Lechner, N. Heating, Cooling, Lighting: Sustainable Design Methods for Architects; John Wiley & Sons: Hoboken, NJ, USA, 2014; p. 720. [Google Scholar]
- Song, Y.; Cui, C.; Li, M.; Cao, F. Investigation on the effects of the optimal medium-temperature on the system performance in a transcritical CO2 system with a dedicated transcritical CO2 subcooler. Appl. Therm. Eng. 2020, 168, 114846. [Google Scholar] [CrossRef]
- Liu, Z.; Zhang, L.; Gong, G.; Li, H.; Tang, G. Review of solar thermoelectric cooling technologies for use in zero energy buildings. Energy Build. 2015, 102, 207–216. [Google Scholar] [CrossRef]
- Goetzler, W.; Shandross, R.; Young, J.; Petritchenko, O.; Ringo, D.; McClive, S. Energy Savings Potential and RD&D Opportunities for Commercial Building HVAC Systems; United States Department of Energy: Washington, DC, USA, 2017. [Google Scholar] [CrossRef] [Green Version]
- Bill, G.; Matt, G.; Theo, K.; Jim, Y.; Tim, S.; Antonio, B.; Monica, N.; Sawyer, K. Grid-Interactive Efficient Buildings Technical Report Series: Lighting and Electronics; United States Department of Energy: Washington, DC, USA, 2019. [Google Scholar] [CrossRef]
- De Negri, J.F.; Pezzutto, S.; Gantioler, S.; Moser, D.; Sparber, W. A Comprehensive Analysis of Public and Private Funding for Photovoltaics Research and Development in the European Union, Norway, and Turkey. Energies 2020, 13, 2743. [Google Scholar] [CrossRef]
- Moreno, B.; López, A.J.; García-Álvarez, M.T. The electricity prices in the European Union. The role of renewable energies and regulatory electric market reforms. Energy 2012, 48, 307–313. [Google Scholar] [CrossRef]
- Murthy, P.S.; Naidu, M.M. Sustainable management of coffee industry by-products and value addition—A review. Resour. Conserv. Recycl. 2012, 66, 45–58. [Google Scholar] [CrossRef]
- Fleiter, T.; Steinbach, J.; Ragwitz, M.; Arens, M.; Aydemir, A.; Elsland, R.; Frassine, C.; Herbst, A.; Hirzel, S. Mapping and Analyses of the Current and Future (2020–2030) Heating/Cooling Fuel Deployment (Fossil/Renewables) Work Package 1: Final Energy Consumption for the Year 2012 Final Report; European Commission: Brussels, Belgium, 2016. [Google Scholar] [CrossRef]
- Brown, J.S.; Domanski, P. Review of alternative cooling technologies. Appl. Therm. Eng. 2014, 64, 252–262. [Google Scholar] [CrossRef]
| Force 4—Bargaining Power of Buyers | Force 3—Bargaining Power of Suppliers | Force 2—Threat of Substitute Products or Services | Force 1—Threat of New Entrants | ||||
|---|---|---|---|---|---|---|---|
| 6− | Sale price reduction | 1− | Competitiveness | 1− | Ventilators | 7+ | Economics of scale |
| 3− | Concentration of customers | 8+ | Size and concentration of suppliers relative to the industry participants | 2− | Thermally driven heat pumps | 8+ | Costs of market entrance |
| 3− | Differentiation of technologies | 6+ | Possibility to forward integration of suppliers | 1− | Natural ventilation | 7+ | Legislations |
| 5+ | Risk of failure | 1+ | Fragmentation of customers | 4+ | Renouncement | 6+ | Technology protection |
| 4+ | Market support | 2+ | District cooling | 6− | Market saturation | ||
| 5+ | Investors’ interest | 3+ | Other technologies * | 5− | Market Image | ||
| 9+ | Climate change | 1− | Energy efficiency of buildings | 4− | Market importance | ||
| 3+ | Multifunctionalities | 7+ | Substitution of services | ||||
| 3+ | Customer loyalty measures | 3+ | Transportation costs | ||||
| 9+ | Comfort | 5+ | Export duties | ||||
| 7− | Result Force 4 | 48+ | Result Force 3 | 4+ | Result Force 2 | 28+ | Result Force 1 |
| Results | Evaluation’s Scale Range (+/−) | |||||||||||
|---|---|---|---|---|---|---|---|---|---|---|---|---|
| Force 1—Threat of new entrants | 7+ | 8+ | 7+ | 6+ | 6− | 5− | 4− | 7+ | 3+ | 5+ | 28+ | |
| Force 2—Threat of substitute products or services | 1− | 2− | 1− | 4+ | 2+ | 3+ | 1− | 4+ | ||||
| Force 3—Bargaining power of suppliers | 1− | 8+ | 7+ | 1+ | 4+ | 5+ | 9+ | 3+ | 3+ | 9+ | 48+ | |
| Force 4—Bargaining power of buyers | 6− | 3− | 3− | 5+ | 7− | |||||||
| Force 5—Rivarly among existing competitors | 73+ | 310 | ||||||||||
| Force 5—Rivarly among existing competitors (%) | 24%+ | 100% +/− | ||||||||||
| Weights | |||
|---|---|---|---|
| Goals | EU Directives | 2010/31 EU: EPBD | 6+ |
| 2018/2001EU: REDII | 5+ | ||
| 2009/125 Ecodesign Dir. | 3+ | ||
| EU—EED 2018/2002 | 4+ | ||
| EU Regulations | 66/2010: EU Ecolabel | 6+ | |
| EU Reg. N° 517/2014 | 4+ | ||
| EU Standards | Test requirements | 6+ | |
| Income Max. | Earnings generation | 8+ | |
| Expenses reduction | 8+ | ||
| Benefit to Cost Max. | Gain Max. | 8+ | |
| Cost Min. | 8+ |
| Weights | |||
|---|---|---|---|
| Factors | Market potential | Number of installed units | 6+ |
| Energy Efficiency | 7+ | ||
| R&D | R&D funding | 7+ | |
| Habits | Energy consumption for cooling purposes | 6+ | |
| Weather | Climate change | 9+ | |
| Costs | Costumer’s investemt costs | 5− | |
| Running costs | 4− | ||
| Disposal costs | 3− | ||
| Transportation costs | 2− | ||
| Replacement | Life span of cooling equipment | 3+ | |
| Comfort | Comfort requests | 8+ | |
| Competition | Size and concentration of the cooling market | 4+ | |
| Costumer loyality measures | 1+ | ||
| Building | Buildings efficiency increase | 2− |
| Goals | |||||||||||||
|---|---|---|---|---|---|---|---|---|---|---|---|---|---|
| EU Directives | EU Regulations | EU Standards | Income Max. | Benefit to Cost Max. | |||||||||
| 2010/31 EU: EPBD | 2018/2001EU: REDII | 2009/125 Ecodesign Dir. | EU—EED 2018/2002 | 66/2010: EU Ecolabel | EU Reg. N° 517/2014 | Test Requirements | Earnings Generation | Expenses Reduction | Gain Max. | Cost Min. | |||
| Factors | Market potential | Number of installed units | x | x | x | x | x | ||||||
| Energy Efficiency | x | x | x | x | x | x | x | x | |||||
| R&D | R&D funding | x | x | x | x | x | x | x | x | x | x | x | |
| Habits | Energy consumption for cooling purposes | x | x | x | |||||||||
| Weather | Climate change | x | x | x | x | x | x | x | x | ||||
| Costs | Costumer’s investemt costs | x | x | x | x | ||||||||
| Running costs | x | x | x | x | |||||||||
| Disposal costs | x | x | x | x | |||||||||
| Transportation costs | x | x | x | x | |||||||||
| Replacement | Life span of cooling equipment | x | x | x | x | ||||||||
| Comfort | Comfort requests | x | x | x | x | x | x | x | x | ||||
| Competition | Size and concentration of the cooling market | x | |||||||||||
| Costumer loyality measures | x | x | x | ||||||||||
| Building | Buildings efficiency increase | x | x | x | x | x | x | x | |||||
| Goals | ||||||||||||||||
|---|---|---|---|---|---|---|---|---|---|---|---|---|---|---|---|---|
| EU Directives | EU Regulations | EU Standards | Income Max. | Benefit to Cost Max. | ||||||||||||
| 2010/31 EU: EPBD | 2018/2001EU: REDII | 2009/125 Ecodesign Dir. | EU—EED 2018/2002 | 66/2010: EU Ecolabel | EU Reg. N° 517/2014 | Test Requirements | Earnings Generation | Expenses Reduction | Gain Max. | Cost Min. | Results | |||||
| Weights | 6+ | 5+ | 3+ | 4+ | 6+ | 4+ | 6+ | 8+ | 8+ | 8+ | 8+ | Sum | % | |||
| Factors | Market potential | Number of installed units | 6+ | 18+ | 24+ | 36+ | 48+ | 48+ | 174+ | 35+ | ||||||
| Energy Efficiency | 7+ | 35+ | 21+ | 28+ | 42+ | 56+ | 56+ | 56+ | 56+ | 350+ | 44+ | |||||
| R&D | R&D funding | 7+ | 42+ | 35+ | 21+ | 28+ | 42+ | 28+ | 42+ | 56+ | 56+ | 56+ | 56+ | 462+ | 42+ | |
| Habits | Energy consumption for cooling purposes | 6+ | 48+ | 48+ | 48+ | 144+ | 48+ | |||||||||
| Weather | Climate change | 9+ | 54+ | 45+ | 28+ | 36+ | 54+ | 36+ | 72+ | 72+ | 396+ | 50+ | ||||
| Costs | Costumer’s investemt costs | 5− | 40− | 40− | 40− | 40− | 160− | 40− | ||||||||
| Running costs | 4− | 32− | 32− | 32− | 32− | 128− | 32− | |||||||||
| Disposal costs | 3− | 24− | 24− | 24− | 24− | 96− | 24− | |||||||||
| Transportation costs | 2− | 16− | 16− | 16− | 16− | 64− | 16− | |||||||||
| Replacement | Life span of cooling equipment | 3+ | 24+ | 24+ | 24+ | 24+ | 96+ | 24+ | ||||||||
| Comfort | Comfort requests | 8+ | 48+ | 40+ | 24+ | 32+ | 48+ | 32+ | 64+ | 64+ | 352+ | 44+ | ||||
| Competition | Size and concentration of the cooling market | 4+ | 32+ | 32+ | 32+ | |||||||||||
| Costumer loyality measures | 1+ | 8+ | 8+ | 8+ | 24+ | 8+ | ||||||||||
| Building | Buildings efficiency increase | 2− | 12− | 10− | 8− | 8− | 16− | 16− | 16− | 86− | 12− | |||||
Publisher’s Note: MDPI stays neutral with regard to jurisdictional claims in published maps and institutional affiliations. |
© 2022 by the authors. Licensee MDPI, Basel, Switzerland. This article is an open access article distributed under the terms and conditions of the Creative Commons Attribution (CC BY) license (https://creativecommons.org/licenses/by/4.0/).
Share and Cite
Pezzutto, S.; Quaglini, G.; Zambito, A.; Novelli, A.; Riviere, P.; Kranzl, L.; Wilczynski, E. Potential Evolution of the Cooling Market in the EU27+UK: An Outlook until 2030. Sustainability 2022, 14, 4461. https://doi.org/10.3390/su14084461
Pezzutto S, Quaglini G, Zambito A, Novelli A, Riviere P, Kranzl L, Wilczynski E. Potential Evolution of the Cooling Market in the EU27+UK: An Outlook until 2030. Sustainability. 2022; 14(8):4461. https://doi.org/10.3390/su14084461
Chicago/Turabian StylePezzutto, Simon, Giulio Quaglini, Andrea Zambito, Antonio Novelli, Philippe Riviere, Lukas Kranzl, and Eric Wilczynski. 2022. "Potential Evolution of the Cooling Market in the EU27+UK: An Outlook until 2030" Sustainability 14, no. 8: 4461. https://doi.org/10.3390/su14084461
APA StylePezzutto, S., Quaglini, G., Zambito, A., Novelli, A., Riviere, P., Kranzl, L., & Wilczynski, E. (2022). Potential Evolution of the Cooling Market in the EU27+UK: An Outlook until 2030. Sustainability, 14(8), 4461. https://doi.org/10.3390/su14084461