Abstract
Rational land use can enhance soil nutrient sequestration and control erosion, but the mechanisms of the ecological restoration of soil-aggregate-associated carbon and nitrogen are still not well understood. A large-scale ecological restoration program was launched in the Loess Plateau during the 1990s. The ecological restoration programs involved converting slope farmland to woodland, grassland, shrub land, and terrace. We studied their effects in relation to cultivated land as control on soil aggregate structure and stability and their associated organic carbon and total nitrogen contents to 60 cm soil depth in the Loess Plateau. Our results indicate that the restoration practices reduced soil aggregate fragmentation, increased soil structure stability, and transformed micro-aggregates into small and large aggregates. Comparing with the soil aggregate >0.25 mm in cultivated land, the amount in woodland, grassland, shrub land and terrace increased by 71%, 66%, 46%, and 35%, respectively, which improved soil health overall. The mean weight diameter of aggregate indicates that soil aggregate stability (SAS) increased and soil hydraulic erosion resistance improved. In conclusion, ecological restoration directly or indirectly affected SAS through the influence of soil organic carbon and total nitrogen in different soil layers. Results of this study provide a scientific reference for understanding stabilization of soil aggregate and regional restoration.
1. Introduction
Soil aggregate stability (SAS) is vital for soil fertility, soil erosion resistance, soil aeration, and water infiltration and retention [1], while soil aggregate is the crucial indicator of soil structure [2]. Furthermore, soil aggregates protect organic matter from mineralization by reducing erosion [3]. The particle size distribution and SAS are affected by internal and external factors such as soil aggregate size, land use, and various physicochemical processes in different soil layers [4,5]. Based on the hierarchical theory of aggregate formation, these factors may lead to an uneven distribution of different size fractions of soil aggregates, which may lead to weakness in SAS [6].
Both the biological and chemical components of soil impact SAS in each soil layer [7], including carbon and nitrogen content. It has even been said that soil structure (e.g., aggregation) is a key element in the stabilization of soil organic carbon (SOC) and total nitrogen (TN) [8]. Their distributions have been shown to vary with soil aggregate size [9], and they are closely related to SAS [10,11]. Vegetation restoration has proven effective in improving SOC and TN content of soils while also improving SAS [12,13]. Zhang et al. found that while SAS was quite low in bare fallow land, revegetation could augment SOC and TN, thus also playing a positive role in enhancing SAS [14]. Jin et al. [15] have suggested that when soil nutrient inputs decrease, SAS also decreases. Although the direct effects on SAS have been studied all over the world [16,17], the quantitative analysis of the interactive effects of various factors (ecological restoration measures, soil depth, organic carbon, total nitrogen) on SAS is relatively less common.
The ecological environment of the Loess Plateau is fragile because long-term disturbance has accelerated local soil and water loss, resulting in one of China’s most damaged landscapes [18,19]. In 1998, a series of ecological restoration measures successfully restored former farmland back to natural landscapes or ecological land, such as the conversion of farmland to forest, grassland, or terrace fields; hill/land enclosure; and afforestation, which had crucial effects on soil aggregate. Since then, the vegetation coverage of the Loess Plateau has improved sharply. It was found that the forest area increased by 16.5%, the grassland area increased by 7.6%, and the bare land and desert-like area decreased by 29.0% [20]. After restoration, the SOC and TN of different aggregate sizes in different land use types are important indicators for gauging how susceptible soil is to erosion and nutrient loss, because smaller aggregates are easier to lose than larger ones.
Previous studies on the Loess Plateau have focused on the SAS, the response of SOC and TN cycles to nutrient amendment, and the SAS and soil quality under various land uses [21,22]. However, there have been few quantitative analyses on the effects of ecological restoration, SOC, TN, and soil depth on SAS. In this work, we studied the change of soil aggregates after landscape restoration in the Wangmaogou Basin, a basin on the Loess Plateau. Given the above limitations, the main objectives of this paper were as follows: (1) To study the changes in soil aggregate structure under different restoration conditions and the differences in organic carbon and total nitrogen content of the aggregates with varying grain size. (2) To clarify the influencing factors of SAS and the contribution of ecological restorations, soil depth, SOC, and TN to the stability of soil aggregates. Investigating the quantitative effects on SAS during the ecological restoration process may offer a theoretical foundation for improved soil management and environmental protection.
2. Materials and Methods
2.1. Overview of the Study Area
The study area (Figure 1) was located in the Wangmaogou Watershed, Suide County, Yulin City, Shaanxi Province. The basin has an area of 5.97 km2 in the middle reaches of the Yellow River (37°34′13″–37°36′03″ N, 110°20′26″–110°22′46″ E). In this hilly and gully loess region, the basin is characterized by a continental monsoon climate, with an mean annual temperature of 10.2 °C. The yearly average rainfall is 513.1 mm, where rainy season precipitation accounts for 73.1% of annual rainfall. This concentration of seasonal rainfall also contributes to serious runoff and flooding. In the 1950s, the Wangmaogou River Basin was used as a small experimental control watershed at the Suide Scientific Experimental Station for Soil and Water Conservation of the Huanghe Committee. Based on field survey record, the sample plots were all bare land before the restoration. In the 1990s, the sloping farmland in the basin was transformed into a series of swathes of woodland, grassland, shrubs, and terraces. The soil types in the study area and the undisturbed adjoining areas are all loessial soils developed from loess parent material.
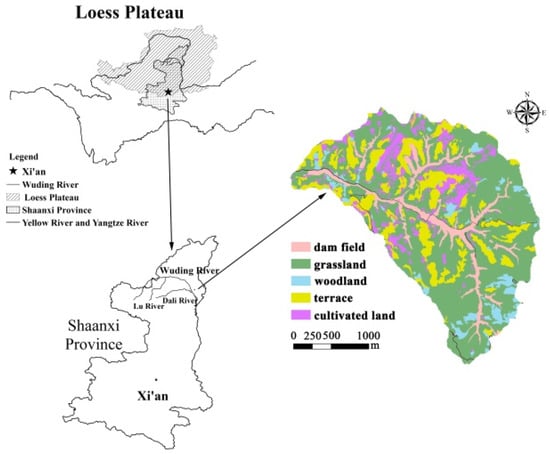
Figure 1.
Map of the study area.
2.2. Sample Collection
Samples were collected in late August 2016. Plots were categorized into one of the four main types of ecological restoration in the basin: woodland (WL), grassland (GR), shrub land (SH), and terrace (TE). The control plot in this study was sloping cultivated land (CL). The characteristics of the sample plots before sampling are listed in Table 1. From each land type, three plots were selected and sampled by excavating a soil profile 60 cm in-depth. A soil sampler collected three separate layers of undisturbed soil based on profile distribution [23]: 0–20 cm, 20–40 cm, and 40–60 cm. Each sample was collected in an “S” type pattern and then transported to the laboratory, the undisturbed soil at the same position was collected to test bulk density. A total of 810 samples (5 vegetation types with 3 replications, 9 sampling points in each plot, 3 soil layers, and 2 sampling forms for bulk density and nutrients determination, respectively) were taken and wrapped in foam to prevent disturbance during transportation. The samples collected with cylinders of 100 cm3 volume and 5 cm length [24] were dried at 105 °C and weighed to determine soil bulk density.

Table 1.
The characteristics of sample plots.
2.3. Sample Treatment
2.3.1. Sieving of Aggregates
The collected soil was first air-dried and dry-sieved (sieve mesh 5, 2, 1, 0.5, and 0.25 mm). According to the proportion of each particle size, 200 g of each sample was mixed together for wet sieving. Then, distilled water was used to soak soil particles by passing through a set of sieves underwater, with an oscillation rate of 50 shakes min−1 [25]. Six aggregate sizes were obtained with multiple sizes of sieves (sieve mesh 0.25, 0.5, 1, 2, and 5 mm) [26]. Soil water-stable aggregate fractions of 5 mm and 2–5 mm in diameter were classified as large macro-aggregates; aggregates of 1–2 mm, 0.5–1 mm, 0.25–0.5 mm in diameter were small macro-aggregates; and those with diameter <0.25 mm were micro-aggregates [27]. Mass fractions, the aggregate associated organic carbon, and total nitrogen of each fraction were determined.
2.3.2. Determination of Chemical Indexes
Soil organic carbon (SOC) measurements were executed with the Jena HT3100 robust module. The soil total nitrogen (TN) was measured with the Foss Company’s Foss8400 Kai nitrogen meter. The air-dried samples were sieved with 2mm mesh, and the soil particle size was measured using the Malvern Company’s laser particle size meter. Mo-Sb colorimetry was applied to detect phosphorus, available phosphorus, ammonium nitrogen, and nitrate nitrogen by using a discontinuous chemical analyzer, the ADA Clever Chem200, from Germany (http://dechem-tech.de/en/offers/cleverchem-200-en, accessed on 16 July 2018).
2.4. Data Processing
The SOC and the TN of the soil aggregates refer to the SOC and TN storage capacity indices for the soil aggregates [28]. The formula was calculated as follows:
where is the amount of soil-aggregate-associated SOC (kg m−2); is the amount of soil-aggregate-associated TN stored (kg m−2); is the SOC content of the soil aggregate (g kg−1); is the content of total nitrogen (TN) in soil aggregate (g kg−1); is the mass fraction of aggregates; is soil bulk density (g cm−3); and is the soil depth (m).
The mean weight diameter (MWD) of soil aggregates was used to assess the SAS quantitatively [29]. The formula was calculated as follows:
where is the average diameter of each aggregate size (mm), Wi is the proportion of the total soil for the aggregates that remain on each sieve, and n is the number of sieves.
Before all the statistical analysis of the data, the Shapiro–Wilk test and the Levene test were executed for normality and homogeneity of variance, respectively. The results show that the data were normally distributed and the variances were homogeneous. Therefore, one-way analysis of variance (ANOVA) and LSD (least-significant difference) test at 0.05 level were performed in SPSS 18.0 to detect significant differences between the means. In addition, the general linear models (GLM) were used to quantify the contribution of analyzed ecological measures and soil depth to MWD, SOC, and TN. Pearson correlation analysis was used to examine the relationships among SOC, TN, and MWD. Origin 8.0 software was used to generate graphs.
3. Results
3.1. Influence of Ecological Restoration on Soil Aggregate Size Distribution
As soil layer depth increased, the mass of macro-aggregates decreased, while the mass of micro-aggregates increased significantly (p < 0.05). These variations were consistent for different restoration types. In the control plot, the large, small, and micro-aggregates showed significant variations (p < 0.05) in the 0–20 cm soil layer (Figure 2). Micro-aggregates formed the majority, followed by small and large aggregates. For GR and SH plots, the mass of small and micro-aggregates was significantly less than that of the large aggregates (p < 0.05). WL and TE aggregates did not differ significantly. In the second soil layer (20–40 cm) in both CL and SH, the mass of the macro-aggregates was apparently lower than that of the micro-aggregates (p < 0.05), and the aggregate mass did not differ significantly in WL and GR (p > 0.05). In the 40–60 cm soil layer, CL, GR, SH, and TE all exhibited a trend of large macro- < small macro- < micro-aggregates (p < 0.05), but no significant difference was found in WL plots (p > 0.05).
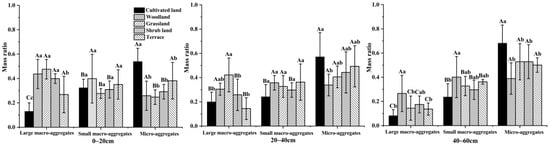
Figure 2.
Mass ratio of aggregates of different fraction sizes after ecological restorations. Note: A lowercase letter indicates a significant difference (p < 0.05) among different ecological restorations at the same fraction size level, and an uppercase letter indicates a significant difference (p < 0.05) among different fraction size levels within the same type of restoration site.
The data suggest that differences in ecological restoration methods significantly altered the size distribution of soil aggregates. As shown in Figure 3, the CL 0–60 cm soil layer was dominated by micro-aggregates of less than 0.25 mm, accounting for 59.68% of the particle size. WL, GR, SH, and TE were mainly composed of large and small macro-aggregates, making up more than 60% of the total particle size composition. After restoration, micro-aggregate (<0.25 mm) mass decreased for TE, SH, GR, and WL, being 35%, 46%, 66%, and 71% lower than in CL, respectively. The most significant increase for GR and WL was the content of large macro-aggregates.
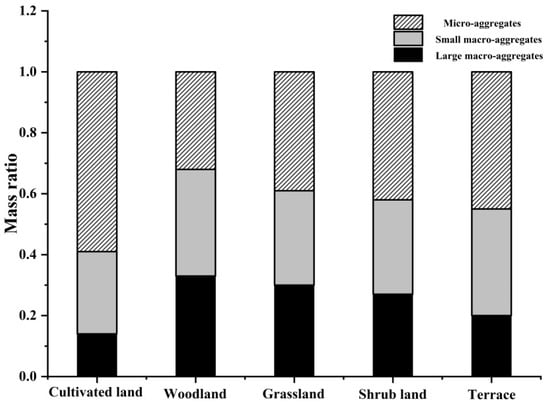
Figure 3.
Average mass ratio of aggregates of different particle sizes in the 0–60 cm soil layer under different ecological restoration conditions.
3.2. Effect of Ecological Restoration on the Content of Soil-Aggregate-Associated SOC
Figure 4 shows the SOC content in soil aggregates under different ecological restoration methods. In the topsoil layer (0–20 cm, Figure 4), the large-macro-aggregates-associated SOC was WL (10.2 g kg−1) = GR (10.1 g kg−1) = SH (9.71 g kg−1) > TE (6.70 g kg−1) > CL (4.14 g kg−1). Compared to CL, the SOC content for TE, SH, GR, and WL increased by 61%, 121%, 143%, and 146%, respectively (p < 0.05). The SOC content of the micro- and macro-aggregates was higher in all treatments than the CL (p < 0.05). Furthermore, among the treatment plots, the SOC content was lowest in TE. The SOC content had no significant difference between the treatments and the control in each aggregate fraction in the 20–60 cm soil layer (Figure 4) (p > 0.05). In the 0–60 cm soil layer, the SOC contents showed the same trend in CL, SH, and TE plots, where micro-aggregates < large macro-aggregates < small macro-aggregates (p < 0.05), while small = large macro- < micro-aggregates for CL and micro- = small macro- = large macro-aggregates for WL. For all four treatments, the SOC content was higher in the 0–20 cm soil layer than in the 20–60 cm soil layer (p < 0.05).
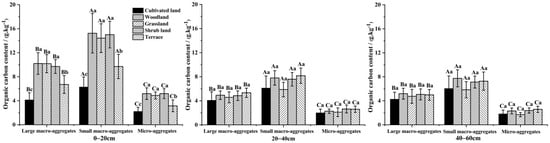
Figure 4.
SOC content of aggregates of different sizes for different ecological restoration treatments. Note: A lowercase letter indicates a significant difference (p < 0.05) among different ecological restoration treatments at the same fraction size, and an uppercase letter indicates a significant difference (p < 0.05) among different fraction sizes for the same ecological restoration treatment.
SOC differed significantly between the micro- and large macro-aggregates in all land types except for WL (Figure 5). The SOC of CL and SH was mainly distributed in micro-aggregates and that of GR in large aggregates. The large macro-aggregates in TE had the lowest SOC content. The SOC storage increased significantly in soil macro-aggregates after the ecological restoration of CL to TE, SH, GR, and WL (p < 0.05), but it did not increase significantly from the control to the treatments in the micro-aggregates. This suggests that macro-aggregates (particle diameter > 0.25 mm) may occlude and protect more organic carbon during ecological restoration and that macro-aggregates are not destroyed by tillage.
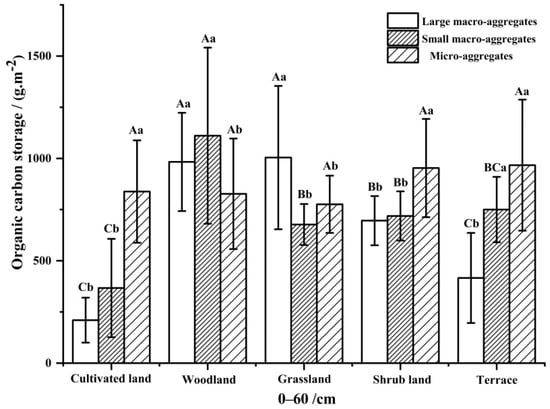
Figure 5.
SOC storage of soil aggregates of different sizes in different ecological restoration treatments. Note: An uppercase letter indicates a significant difference (p < 0.05) among different ecological restoration treatments at the same fraction size, and a lowercase letter indicates a significant difference (p < 0.05) among different fraction sizes in the same ecological restoration treatment.
3.3. Effect of Ecological Restoration on the Total Nitrogen of Soil Aggregates
Figure 6 shows the TN content in each particle size agglomeration of soil under different ecological recovery modes. In the 0–20 cm soil layer (Figure 6), the large-macro-aggregates (>2 mm)-associated TN was SH (1.08 g kg−1) > WL (0.86 g kg−1) > GR (0.76 g kg−1) > TE (0.49 g kg−1) > CL (0.29 g kg−1). The TN content increased most significantly (p < 0.05) in SH. The TN content was equivalent across the micro-aggregates and small and large macro-aggregates in WL, GR, SH, and TE, with the highest TN content in SH, followed by WL, GR and TE. In the 20–40 cm soil layer (Figure 6), the TN content differed significantly in the large macro-aggregates in GR and SH (p < 0.05). TN content was at its lowest in the small macro-aggregates of CL and GR (p < 0.05). The micro-aggregates-associated TN was higher in WL and SH than GR, but no other treatments showed a significant difference. The increase in the large-macro-aggregates-associated TN was not noticeable, and only that in the small macro-aggregates and micro-aggregates of WL did increase significantly. In the 40–60 cm soil layer, the micro-aggregates-associated TN in CL and SH was lowest, and in WL and TE, the small-macro-aggregates-associated TN was highest, but TN did not differ significantly among the particle sizes in GR (p > 0.05). TN content was greater in the 0–20 cm soil layer for all treatments than that in the 20–60 cm soil layer (p < 0.05).
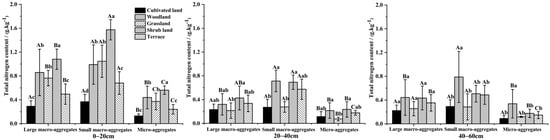
Figure 6.
TN content of aggregates of different sizes with different ecological restorations. Note: A lowercase letter indicates a significant difference (p < 0.05) among different ecological restoration treatments at the same fraction size, and an uppercase letter indicates a significant difference (p < 0.05) among different fraction sizes within the same ecological restoration treatment.
Figure 7 shows that TN is mainly concentrated in micro-aggregates in CL, and it is primarily concentrated in large macro-aggregates in GR. Additionally, large macro-aggregates have the lowest TN content in TE. Conversely, the TN distribution is relatively uniform in WL and SH, resulting in no noticeable difference in TN content among the aggregate sizes. The macro-aggregates-associated TN reserves are the largest in all treatments (p < 0.05). Compared to CL treatment, the small-macro-aggregates-associated TN in other treatments increased remarkably (p < 0.05), and the micro-aggregates-associated TN shows no statistical difference (p < 0.05), except for that in WL and GR plots.
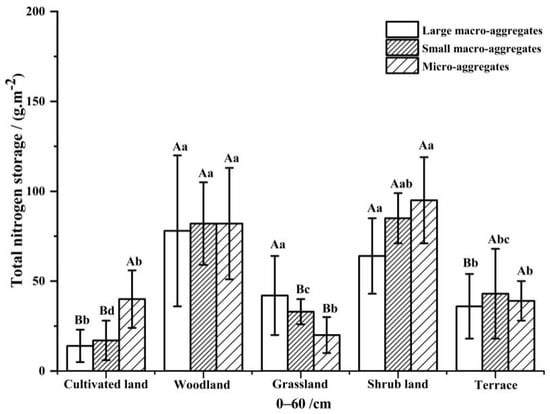
Figure 7.
TN reserves in aggregates of different sizes with different ecological restoration treatments. Note: A lowercase letter indicates a significant difference (p < 0.05) in different ecological restoration treatments at the same fraction size, and an uppercase letter indicates a significant difference (p < 0.05) at different fraction sizes within the same ecological restoration treatment.
3.4. The Effect of Ecological Restoration on the Stability of Soil Aggregates
The MWD of aggregates is an important index to infer SAS [30]. It was found that the greater the MWD of water stable aggregates, the better the structure and quality of soil, and the more resistant the soil [31]. In the different ecological restoration modes, the MWD values are listed in Table 2. SAS decreased gradually with the increase in soil depth. The SAS of WL, GR, SH, and TE at 0–20 cm depth was extremely greater than that in CL plots (p < 0.05), but no significant differences were found in MWD values at other soil depths (p > 0.05). The results show that SAS in soil surface increased after restoration treatment.
Table 2.
MWD of soil aggregates with the different ecological restoration treatments.
For the soil physical and chemical characteristics in the study area, see Table 3. No significant difference in bulk density was observed. Ecological restoration considerably increased soil ammonium nitrogen, while the soil in terrace had the lowest content of nitrate nitrogen (0.35 g kg−1 in mean). WL increased the available phosphorus significantly, while there was no remarkable difference between CL and TE. In GR plots, increases were observed in clay and silt particle size.
Table 3.
Soil properties of the four land types and the control.
3.5. Evaluation of the Stability Factors of Soil Aggregates
SAS was significantly affected (p < 0.01) by the ecological measures in each soil layer listed in Table 4. Soil-aggregate-associated TN significantly affected MWD of the aggregates (p < 0.01), contributing 21.8%. The MWD value of the aggregates did not differ significantly between SOC and TN interactions (p > 0.05). Soil depth is a key parameter that contribute to the aggregate-associated SOC and TN of aggregates (p < 0.01), which explained 96.80% of the variance in SOC and 85.70% of the variance in TN, respectively. Significant correlation between SOC and TN was explored as seen in Table 5, and MWD had a significant negative effect on SOC and TN. As we mentioned before, a greater MWD means more stable soil aggregate. Ecological restoration and soil depth directly affected the SOC and TN content, and the increase in SOC and TN content resulted in accelerated SAS.
Table 4.
List of the analyzed ecological measures and soil depth factors.
Table 5.
Correlation analysis of SOC, TN, and MWD.
4. Discussion
4.1. Analysis of the Difference in Soil-Aggregates-Associated SOC and TN under Ecological Restoration
In this study, SOC and TN were negatively associated with soil depth under four restoration treatments, not including the control (CL). The accumulation and protection of soil-aggregate-associated SOC in the topsoil (0–20 cm) was effectively promoted in all restoration treatments and helped to restore and hold soil SOC. Our results agree with Wu et al. [32]. The CL soil was relatively unstable in terms of SOC and TN, potentially due to annual farming practices including ploughing and depositing SOC and TN on the surface. Our results show that higher macro-aggregate-associated SOC and TN were found after ecological restoration. Because WL, GR, and SH were less disturbed by field management practices, the surface litter supplemented the soil carbon and nitrogen pools, and so did the turnover of plant roots. TE was planted with fruit trees in our study area and the human activities are frequent (fruit harvesting, etc.) on the land. Therefore, the soil organic matter sources are less than those of WL, GR, and SH. Because of ploughing, the soil is vulnerable to active water erosion, which can result in SOC and TN loss. Additionally, crops are not returned to the soil, but harvested, and there is little carbon input to the soil. These factors lessen levels of SOC and TN in CL [33].
After restoration, the SOC and TN reserves were lower in micro-aggregates than large and small macro-aggregates [34]. After newly imported organic carbon enters the soil, it first binds with small aggregates to form large aggregates, while micro-aggregates form inside of the particle. When the organic matter decomposes, the large aggregates break up to form micro-aggregates. The artificial disturbance (e.g., cultivation, harvest) was larger in the control than that in the treatments, and the large- and small-macro-aggregates-associated SOC content was also higher. Both large and small macro-aggregates with different ecological restorations in our study increased in number along with SOC and TN content. In this way, the soil carbon and nitrogen are better protected and retained, and the function of the carbon and nitrogen sinks in the soil improves accordingly [35].
4.2. Analysis of Factors Influencing the Stability of Soil Aggregates under Ecological Restoration
We analyzed the aggregate size distribution and the stability index of stable water aggregates selected from typical soils representing different ecological restoration treatments. We found that without restoration (CL), the soil was mainly dominated by micro-aggregates with varying particle size distribution at different soil depths. With increasing soil depth, soil aggregates gradually concentrated to micro-aggregation. Therefore, greater macro-aggregates content indicates higher soil structure stability. After restoration, the MWD value of aggregates increased gradually. The corresponding soil SOC and TN showed the same trend, and this played an essential role in aggregate formation [36].
Changes in land use patterns are expected to alter soil vegetation cover and shift soil quality, as well as SAS [37]. After ecological restoration here, the soil organic matter was also enriched [38], which increased the SAS as well. Table 4 indicates that ecological restorations were able to explain 28.20% of the variation in SAS. Ecological restoration measures, soil depth, and their interactions directly affect SAS via SOC and TN.
4.3. The Formation Mechanism of Soil Aggregates under Ecological Restoration
Our results indicate that aggregate composition could change under ecological restoration conditions [39]. In most treatment plots of our study, soil was dominated by macro-aggregates, while micro-aggregates dominated the CL plots. After restoration, the percentage of micro-aggregates was reduced, which increased soil structure and soil stability [40]. The SOC was high in most areas, which is important because organic matter is a vital cementing agent for micro-aggregates to become large or small macro-aggregates [41]. Therefore, the presence of SOC reduced the amount of soil micro-aggregates and contributed to increasing amount of large and small aggregates [42]. Additionally, the restoration improved SAS and enhanced soil erosion resistance. On the Loess Plateau, carbon and nitrogen cycling is often of crucial importance, as it allows for retaining soil fertility. However, the nutrient efficiency depends, among other things, on the carbon and nitrogen retention capacity. In the CL plots, this kind of capacity seems to be lower, linked to the soil aggregates situation. With ecological restoration, there is credible evidence to suggest that SOC and TN increased along with soil aggregates formation. In the background implementation of large-scale vegetation restoration over the Loess Plateau, there is reasonable evidence to indicate that it has altered the SOC and TN status through aggregate formation, especially in shrub land, which could be a basis for cost-effective soil protection.
On the other side, there were only three sample duplicates in our study, which may have limited the exploration of soil aggregate mechanism. In future research, more samples from each land conversion category should be taken.
5. Conclusions
Among the three levels of aggregate size, the large and small macro-aggregates dominated soil aggregate structure in the restored sites, while micro-aggregates dominated CL. After restoration, the SAS, SOC, and TN distribution and the aggregate reserves were significantly improved. In addition, the restoration of the vegetation promoted the recovery of organic matter in the soil. As aggregate formation developed, SAS improved significantly. Ecological restoration indirectly affected SAS directly by altering the SOC and TN content in the aggregates. Regional land managers should consider converting farmland to improve the local soil stability and the carbon and nitrogen uptake ability. Additionally, regional vegetation restoration, especially converting cultivated land to shrub land, and sustainable land management can be coordinated simultaneously for continuous vegetation renewal. Furthermore, additional control and protection measures should be implemented to benefit SAS, to improve SOC and TN reserves, and to enhance the carbon and nitrogen sink capacities in the region. Our results provide scientific support for the benefits of ecological restoration in protecting soil aggregates.
Author Contributions
Y.Z., P.L. and X.L. conceived the main idea of the paper. Y.Z. and L.X. designed and performed the experiment. Y.Z. wrote the manuscript, and all authors contributed in improving the paper. All authors have read and agreed to the published version of the manuscript.
Funding
Please add: This research was funded by [National Natural Science Foundation of China] grant number [42107365 and 42107368], [Shaanxi Province Innovation Talent Promotion Plan Project Technology Innovation Team] grant number [2018TD-037] and [Special Plan for Local Sci-Tech Development Guided by the Central Government of China] grant number [202008]. The APC was funded by [2018TD-037].
Institutional Review Board Statement
Not applicable.
Informed Consent Statement
Not applicable.
Data Availability Statement
Not applicable.
Conflicts of Interest
The authors declare no conflict of interests.
References
- Lan, J. Changes of Soil Aggregate Stability and Erodibility after Cropland Conversion in Degraded Karst Region. J. Soil Sci. Plant Nutr. 2021, 21, 3333–3345. [Google Scholar] [CrossRef]
- Ronick, C.J.; Lal, R. Soil structure and management: A review. Geoderma 2005, 124, 3–22. [Google Scholar] [CrossRef]
- Six, J.; Elliott, E.T.; Paustian, K. Soil structure and soil organic matter: II. A normalized stability index and the effect of mineralogy. Soil Sci. Soc. Am. J. 2000, 64, 1042–1049. [Google Scholar] [CrossRef]
- Zhang, Y.; Li, P.; Liu, X.J.; Xiao, L.; Shi, P.; Zhao, B.H. Effects of farmland conversion on the stoichiometry of carbon, nitrogen, and phosphorus in soil aggregates on the Loess Plateau of China. Geoderma 2019, 351, 188–196. [Google Scholar] [CrossRef]
- Deng, L.; Ma, B. Almost everywhere convergence of riesz means related to schrdinger operator with constant magnetic fields. Abstr. Appl. Anal. 2013, 2013, 859680. [Google Scholar] [CrossRef]
- Six, J.; Bossuyt, H.; Degryze, S.; Denef, K. A history of research on the link between (micro) aggregates, soil biota, and soil organic matter dynamics. Soil Tillage Res. 2004, 79, 7–31. [Google Scholar] [CrossRef]
- Justyna, S.; Agnieszka, J.; Karolina, W.; Tomasz, Z. Interrelationship between soil depth and soil properties of pieniny national park forest (Poland). J. Mt. Sci. 2019, 16, 1534–1545. [Google Scholar]
- Chaplot, V.; Cooper, M. Soil aggregate stability to predict organic carbon outputs from soils. Geoderma 2015, 243–244, 205–213. [Google Scholar] [CrossRef]
- Liu, X.J.; Li, Z.B.; Li, P. Changes in carbon and nitrogen with particle size in bottom sediments in the Dan River, China. Quat. Int. 2015, 380–381, 305–313. [Google Scholar] [CrossRef]
- Tisdall, J.M.; Oades, J.M. Organic matter and water-stable aggregates in soils. J. Soil Sci. 1982, 33, 141–163. [Google Scholar] [CrossRef]
- Li, Y.; Yu, P.; Shen, L. Changes in soil aggregate stability and aggregate-associated organic carbon during old-field succession in karst valley. Environ. Monit. Assess. 2022, 194, 15. [Google Scholar] [CrossRef] [PubMed]
- Deng, L.; Shang, Z.P. Afforestation drives soil carbon and nitrogen changes in china. Land Degrad. Dev. 2016, 28, 151–165. [Google Scholar] [CrossRef] [Green Version]
- Chang, E.H.; Li, P.; Li, Z.B.; Xiao, L.; Zhao, B.H.; Su, Y.Y.; Feng, Z.H. Using water isotopes to analyze water uptake during vegetation succession on abandoned cropland on the Loess Plateau, China. Catena 2019, 181, 104095. [Google Scholar] [CrossRef]
- Zhang, H.; Niu, L.; Hu, K.; Hao, J.; Li, F.; Wang, X.; Chen, H. Long-term effects of nitrogen and phosphorus fertilization on soil aggregate stability and aggregate-associated carbon and nitrogen in the North China Plain. Soil Sci. Soc. Am. J. 2021, 85, 732–745. [Google Scholar] [CrossRef]
- Jin, V.L.; Schmer, M.R.; Wienhold, B.J.; Stewart, C.E.; Varvel, G.E.; Sindelar, A.J. Twelve years of stover removal increases soil erosion potential without impacting yield. Soil Sci. Soc. Am. J. 2015, 79, 1169–1178. [Google Scholar] [CrossRef]
- Qiu, L.P.; Wei, X.R.; Gao, J.L.; Zhang, X.C. Dynamics of soil aggregate-associated organic carbon along an afforestation chronosequence. Plant Soil 2015, 391, 237–251. [Google Scholar] [CrossRef]
- Choudhury, S.G.; Srivastava, S.; Singh, R.; Chaudhari, S.K.; Sarkar, D. Tillage and residue management effects on soil aggregation, organic carbon dynamics and yield attribute in rice-wheat cropping system under reclaimed sodic soil. Soil Tillage Res. 2014, 136, 76–83. [Google Scholar] [CrossRef]
- Shi, P.; Zhang, Y.; Li, P.; Li, Z.; Yu, K.; Ren, Z.; Xu, G.; Cheng, S.; Wang, F.; Ma, Y. Distribution of soil organic carbon impacted by land-use changes in a hilly watershed of the Loess Plateau, China. Sci. Total Environ. 2019, 652, 505–512. [Google Scholar] [CrossRef]
- Li, S.; Gu, X.; Zhuang, J.; An, T.; Pei, J.; Xie, H. Distribution and storage of crop residue carbon in aggregates and its contribution to organic carbon of soil with low fertility. Soil Tillage Res. 2016, 155, 199–206. [Google Scholar] [CrossRef]
- Zhang, B.; Tian, L.; Zhao, X.; Wu, P. Feedbacks between vegetation restoration and local precipitation over the Loess Plateau in China. Sci. China Earth Sci. 2021, 64, 920–931. [Google Scholar] [CrossRef]
- Sarathjith, M.C.; Das, B.S.; Vasava, H.B.; Mohanty, B.; Sahadevan, A.S.; Wani, S.P. Diffuse reflectance spectroscopic approach for the characterization of soil aggregate size distribution. Soil Sci. Soc. Am. J. 2014, 78, 369–376. [Google Scholar] [CrossRef]
- Wang, T.; Li, P.; Li, Z.; Hou, J.M.; Xiao, L.; Ren, Z.; Su, Y. The effects of freeze–thaw process on soil water migration in dam and slope farmland on the Loess Plateau, China. Sci. Total Environ. 2019, 666, 721–730. [Google Scholar] [CrossRef]
- Zhang, Y.; Li, P.; Liu, X.; Xiao, L.; Li, Z.; Wu, H.; Zhou, S.; Ren, M. Tracer elements revealed the soil organic carbon sources in a dam-controlled watershed. Soil Tillage Res. 2022, 216, 105184. [Google Scholar] [CrossRef]
- Burghardt, W.; Schneider, T. Bulk density and content, density and stock of carbon, nitrogen and heavy metals in vegetable patches and lawns of allotments gardens in the northwestern Ruhr area. Ger. J. Soils Sediments 2018, 18, 407–417. [Google Scholar] [CrossRef]
- Liu, M.Y.; Chang, Q.R.; Qi, Y.B.; Liu, J.; Chen, T. Aggregation and soil organic carbon fractions under different land uses on the tableland of the loess plateau of china. Catena 2014, 115, 19–28. [Google Scholar] [CrossRef] [Green Version]
- Cambardella, C.A.; Elliott, E.T. Carbon and nitrogen dynamics of soil organic matter fractions from cultivated grassland soils. Soil Sci. Soc. Am. J. 1994, 58, 123–130. [Google Scholar] [CrossRef]
- Zhang, Y.; Dalal, R.C.; Bhattacharyya, R.; Meyer, G.; Wang, P.; Menzies, N.W.; Kopittke, P.M. Effect of long-term no-tillage and nitrogen fertilization on phosphorus distribution in bulk soil and aggregates of a Vertisol. Soil Tillage Res. 2021, 205, 104760. [Google Scholar] [CrossRef]
- Tyler, S.W.; Wheatcraft, S.W. Fractal scaling of soil particle-size distributions: Analysis and limitations. Soil Sci. Soc. Am. J. 1992, 56, 362–369. [Google Scholar] [CrossRef]
- Kemper, W.D.; Rosenau, R.C. Aggregate stability and size distribution. In Methods of Soil Analysis. Part I. Physical and Mineralogical Methods; Klute, A., Ed.; ASA and SSSA: Madison, WI, USA, 1986; pp. 422–425. [Google Scholar]
- Zhang, Q.; Shao, M.; Jia, X.; Zhang, C. Understory Vegetation and Drought Effects on Soil Aggregate Stability and Aggregate-Associated Carbon on the Loess Plateau in China. Soil Sci. Soc. Am. J. 2018, 82, 106–114. [Google Scholar] [CrossRef]
- Parsakhoo, A.; Lotfalian, M.; Kavian, A.; Hosseini, S.A. Assessment of soil erodibility and aggregate stability for different parts of a forest road. J. For. Res. 2014, 25, 193–200. [Google Scholar] [CrossRef]
- Wu, C.; Deng, L.; Huang, C.; Chen, Y.; Peng, C. Effects of vegetation restoration on soil nutrients, plant diversity, and its spatiotemporal heterogeneity in a desert-oasis ecotone. Land Degrad. Dev. 2021, 32, 670–683. [Google Scholar] [CrossRef]
- Liang, S.; Zhang, H.; Song, X.; Liu, S.; Yun, X.; Wu, Y. Loss of soil carbon and nitrogen rather than variations in soil particle size distribution decreased microbial residues during conversion of grassland to croplands. Eur. J. Soil Sci. 2021, 72, 2215–2224. [Google Scholar] [CrossRef]
- Niu, Z.; Su, Y.; An, F.; Liu, T. Changes in soil carbon and nitrogen content, associated with aggregate fractions, after conversion of sandy desert to irrigation farmland, northwest China. Soil Use Manag. 2022, 38, 396–410. [Google Scholar] [CrossRef]
- D’Acqui, L.P.; Bonetti, A.; Pini, R.; Certini, G. Physical protection of organic matter in minesoils assessed by low-temperature ashing (LTA). Geoderma 2017, 15, 120–129. [Google Scholar] [CrossRef]
- Soinne, H.; Hyyaluoma, J.; Ketoja, E. Relative importance of organic carbon, land use and moisture conditions for the aggregate stability of post-glacial clay soils. Soil Tillage Res. 2016, 158, 1–9. [Google Scholar] [CrossRef]
- Zhu, S.; Vivanco, J.M.; Manter, D.K. Nitrogen fertilizer rate affects root exudation, the rhizosphere microbiome and nitrogen-use-efficiency of maize. Appl. Soil Ecol. 2016, 107, 324–333. [Google Scholar] [CrossRef] [Green Version]
- Bach, E.M.; Hofmockel, K.S. A time for every season: Soil aggregate turnover stimulates decomposition and reduces carbon loss in grasslands managed for bioenergy. Glob. Chang. Biol. Bioenergy 2015, 8, 588–589. [Google Scholar] [CrossRef] [Green Version]
- Ovsepyan, L.; Kurganova, I.N.; Gerenyu, V.L.D.; Kuzyakov, Y. Recovery of organic matter and microbial biomass after abandonment of degraded agricultural soils: The influence of climate. Land Degrad. Dev. 2019, 30, 1861–1874. [Google Scholar] [CrossRef]
- Mi, W.; Wu, Y.; Zhao, H.; Wu, L.; Liu, Y. Effects of combined organic manure and mineral fertilization on soil aggregation and aggregate-associated organic carbon in two agricultural soils. J. Plant Nutr. 2018, 41, 2256–2265. [Google Scholar] [CrossRef]
- Ghosh, A.; Bhattacharyya, R.; Meena, M.C.; Dwivedi, B.S.; Singh, G.; Agnihotri, R. Long-term fertilization effects on soil organic carbon sequestration in an inceptisol. Soil Tillage Res. 2018, 177, 134–144. [Google Scholar] [CrossRef]
- Liu, M.Y.; Wu, J.-L.; Liu, L.W.; Yu, Y.-N. Stability characteristics of soil water-stable aggregates under different land-use patterns on the loess plateau. J. Nat. Resour. 2016, 31, 1564–1576. [Google Scholar]
Publisher’s Note: MDPI stays neutral with regard to jurisdictional claims in published maps and institutional affiliations. |
© 2022 by the authors. Licensee MDPI, Basel, Switzerland. This article is an open access article distributed under the terms and conditions of the Creative Commons Attribution (CC BY) license (https://creativecommons.org/licenses/by/4.0/).