Article

Economic and Reliability Assessment of Hybrid PRO-RO Desalination Systems Using Brine for Salinity Gradient Energy Production

by
Ewaoche John Okampo
1,*,
Nnamdi Nwulu
2 and
Pitshou N. Bokoro
1
1
Department of Electrical and Electronic Engineering Technology, University of Johannesburg, Johannesburg 2092, South Africa
2
Department of Electrical and Electronic Engineering Science, University of Johannesburg, Johannesburg 2092, South Africa
*
Author to whom correspondence should be addressed.
Sustainability 2022, 14(6), 3328; https://doi.org/10.3390/su14063328
Submission received: 30 January 2022 / Revised: 15 February 2022 / Accepted: 18 February 2022 / Published: 11 March 2022

Abstract

:
The energy requirements for desalination have made it an expensive process, however, it is still a viable and cost-effective means of water purification amidst freshwater scarcity. The management and disposal of brine is an external and extra desalination cost due to the effect of brine on the environment. The integration of Pressure Retarded Osmosis (PRO) with the Reverse Osmosis (RO) technique as modelled in this paper enhances brine management. The brine is fed back into the PRO unit to create a salinity gradient for water transfer via membrane and generate salinity gradient energy. The hybrid desalination model is designed to be powered by grid-tied offshore wind power. The use of wind power, a clean, renewable energy source devoid of carbon emission, as the main power source to drive the RO unit reduces the cost and effect of carbon emissions from the grid. The proposed model is assessed using Levelized cost of energy (LCOE), Annualized cost of the system (ACS), and cost of water (COW) as economic matrices. In contrast, loss of energy probability is used as a reliability matrix. Obtained results show a LCOE of 1.11 $/kW, ACW of $110,456, COW of 0.13 $/m3, loss of energy probability of 0.341, a low total carbon emissions of 193,323 kgCO2-e, and zero brine production. Results show that the proposed model is economically viable, technically reliable, environmentally friendly, and generally sustainable.

1. Introduction

1.1. Background and Motivation of Study

Freshwater is a basic human need, and access to it is a fundamental right recognized in the 2010 United National General Assembly (UNGA) [1]. Yet, its scarcity in many parts of the world is still a significant challenge. This challenge is aggravated by the continuous increase in population, increase in industrial demand, and agricultural purposes. On the other hand, the effect of climate change and other factors decreases supply sources of freshwater. The global demand for water is growing by 1% every year and can get to 120–130% of the immediate consumption by 2050 [1]. Desalination has become a suitable option for freshwater production, considering the abundance of seawater. Though desalination is considered expensive because of its energy requirement and environmental impact, it continues to gain popularity as several desalination methods have been initiated. Several attempts have been made to reduce its energy requirement and environmental impact, thus minimizing cost. The reverse osmosis (RO) desalination method has been identified as a less energy-intensive desalination method, as it typically requires 3–6 kWh to produce 1 m3 of freshwater, hence, it has gained 65% of global desalination installations [2]. Despite its lower energy requirement and popularity, reverse osmosis desalination (ROD) is still considered expensive. The environmental impacts of the commonly used energy sources and brine production are major challenges. To minimize or completely eradicate gas emissions from desalination power sources, renewable energy sources have been favored, either with the integration of conventional grid energy sources [3,4,5] or as stand-alone energy sources for desalination [6,7,8]. One of the main challenges of powering RO systems by renewable energy is the intermittent operation effect in the long-term on the performance of these systems [5,9]. Therefore, to further minimize the GHG emissions, the optimization of RO systems is key, as well as studying RO systems powered by renewable energy for example, studying SWRO systems under variable operating conditions and studying the operation windows and optimal operating points [10,11,12].
On the other hand, the hybridization of desalination methods has been suggested for brine management [13,14]. Therefore, to achieve sustainable desalination, most efforts aim to improve energy efficiency and address environmental concerns by using clean, renewable energy and efficient management of concentrated brine.
Thus far, solar and wind power are mostly used for desalination and integrated with thermal or fossil fuel generators to compensate for their intermittency. To further reduce the use of thermal or fossil fuel energy for desalination, energy storage systems have been explored alongside solar and wind energy. Energy storage systems have been explored alongside solar and wind energy to augment their inconsistency. Additionally, geothermal energy has been considered for desalination in locations where it is feasible. The full range and prospects of utilizing ocean energy for desalination purposes have not been extensively examined [15]. Few attempts have been made to investigate the use of wave and tidal energy, with most of these investigations at experimental stages. Ocean energy is predictable and has the highest energy density; therefore, it is more reliable than other forms of renewable energy [15]. Other advantages of ocean energy use for desalination include natural collocation of production and use, thereby eliminating the need and cost of energy transmission, and closeness to human settlements, as most human populations are settled along coasts [15]. In addition, there are different categories of ocean energy: thermal, mechanical, and chemical (salinity gradient). These varieties give room for dynamic applications. This article, therefore, presents a further examination of the application of one form of ocean energy (salinity gradient), with its unique characteristic, alongside wind energy to the hybrid of pressure-retarded osmosis (PRO) and RO.
Desalination processes are either thermal or membrane-based. The thermal processes, including humidification–dehumidification, multi-stage flash distillation, vapor compressor distillation and multi-effect distillation, are based on change state. In comparison, membrane desalination methods use membranes with unique chemical and physical properties, and examples of membrane desalination methods include: electrodialysis, forward osmosis, electrodialysis reversal, membrane distillation, nano-filtration, PRO and RO [9]. Thermal processes require both thermal and electrical energy; thus, they are highly energy-intensive, with specific energy consumption (SEC) ranging from 5.5 to about 27 kWh/m3. The membrane processes usually required only electrical energy or pressure differences for desalination, with SEC ranging between 2 to 6 kWh/m3. Despite the lower energy requirement of membrane processes, all desalination techniques have their peculiar limitations and share a common challenge of brine management.
Despite being the most reliable membrane method of seawater desalination, RO is faced with membrane fouling and some soluble rejection efficacy. Improvement on RO systems has led to extensive research on membrane development using nanomaterials [16,17,18]. In addition, several studies have suggested the hybrid of RO and other desalination methods to improve performance. The authors of [13,14,19] designed a model that combined RO, ED, and crystallization methods to achieve salt production and minimize brine production from seawater desalination. The cost and energy requirements of the systems were examined and prove to be economically viable and fit for brine management, but the capital and operational costs of ED and crystallization were not considered in the economic analysis. Hybridization of RO with either forward osmosis (FO), reverse electrodialysis (RED), or PRO is considered very promising, since the three (FO, RED, and PRO) are major technologies that utilize ocean salinity gradient energy. The authors of [20,21,22] present the hybrid of FO-RO technologies and evaluate the system’s performance and economic viability. It was suggested that the FO-RO hybrid could approach a SEC threshold of 1.3–1.5 kWh/m3 for seawater desalination using a FO membrane of about 10 L/m3 [20]. This hybrid process reduces energy demand and freshwater cost and reduces the environmental impact of brine.

1.2. Environmental Impacts and Treatment of Brine

The environmental effects and treatment of brine is a major concern of producing freshwater via desalination processes. Other than freshwater, brine is another product of desalination, but it has very high salinity and contains chemicals such as FeCl3, H2SO4, and many others [23]. The management of brine to avert negative impacts on the environment is considered an extra cost of desalination [24]. Currently, most desalination plants dispose of the brine product back into waterbodies nearest to the site of installation. This practice has a very hazardous impact on marine life [25,26]. Other forms of brine disposal are either on the land surface or dug pits. These methods are also not considered viable options, because the high temperature of the brine is capable of destroying arable land that could be used for other purposes. The methods are also cost-intensive. Several researchers agree on the danger and severity of the environmental impact of indiscriminate disposal of brine and further proposed different methods of treatment to mitigate the menace [27,28,29]. Roberts et al. [27] performed a critical review of the impacts of brine discharges on marine environment and suggested a control–impact testing and monitoring system to ascertain the severity of impact before and after the process of desalination. Noam Lior [28] suggested a holistic approach that considered social, economic, and environmental impacts for a paradigm sustainability model when performing assessment of desalination processes. Feed water pretreatment and post-treatment of brine using hybrid methods of desalination has been suggested as a sustainable means of brine management [20,21,22]. This approach has the additional advantage of energy generation and efficient utilization.
This paper presents the hybrid of PRO and RO for adequate brine management from seawater desalination, adopting a similar approach to the integration of FO-RO in [20,21,22]. While the focus of [20,21] is on the thermodynamic process optimization of the hybrid systems, [22] extends this to economic evaluation of the system using the life cycle cost index. This present study uses LCOE, ACS, and COW as economic indices while considering reducing carbon emissions and its associated cost. This study further assesses the reliability of the PRO-RO hybrid system using the LOLP index, considering optimal energy scheduling.

2. Materials and Methods

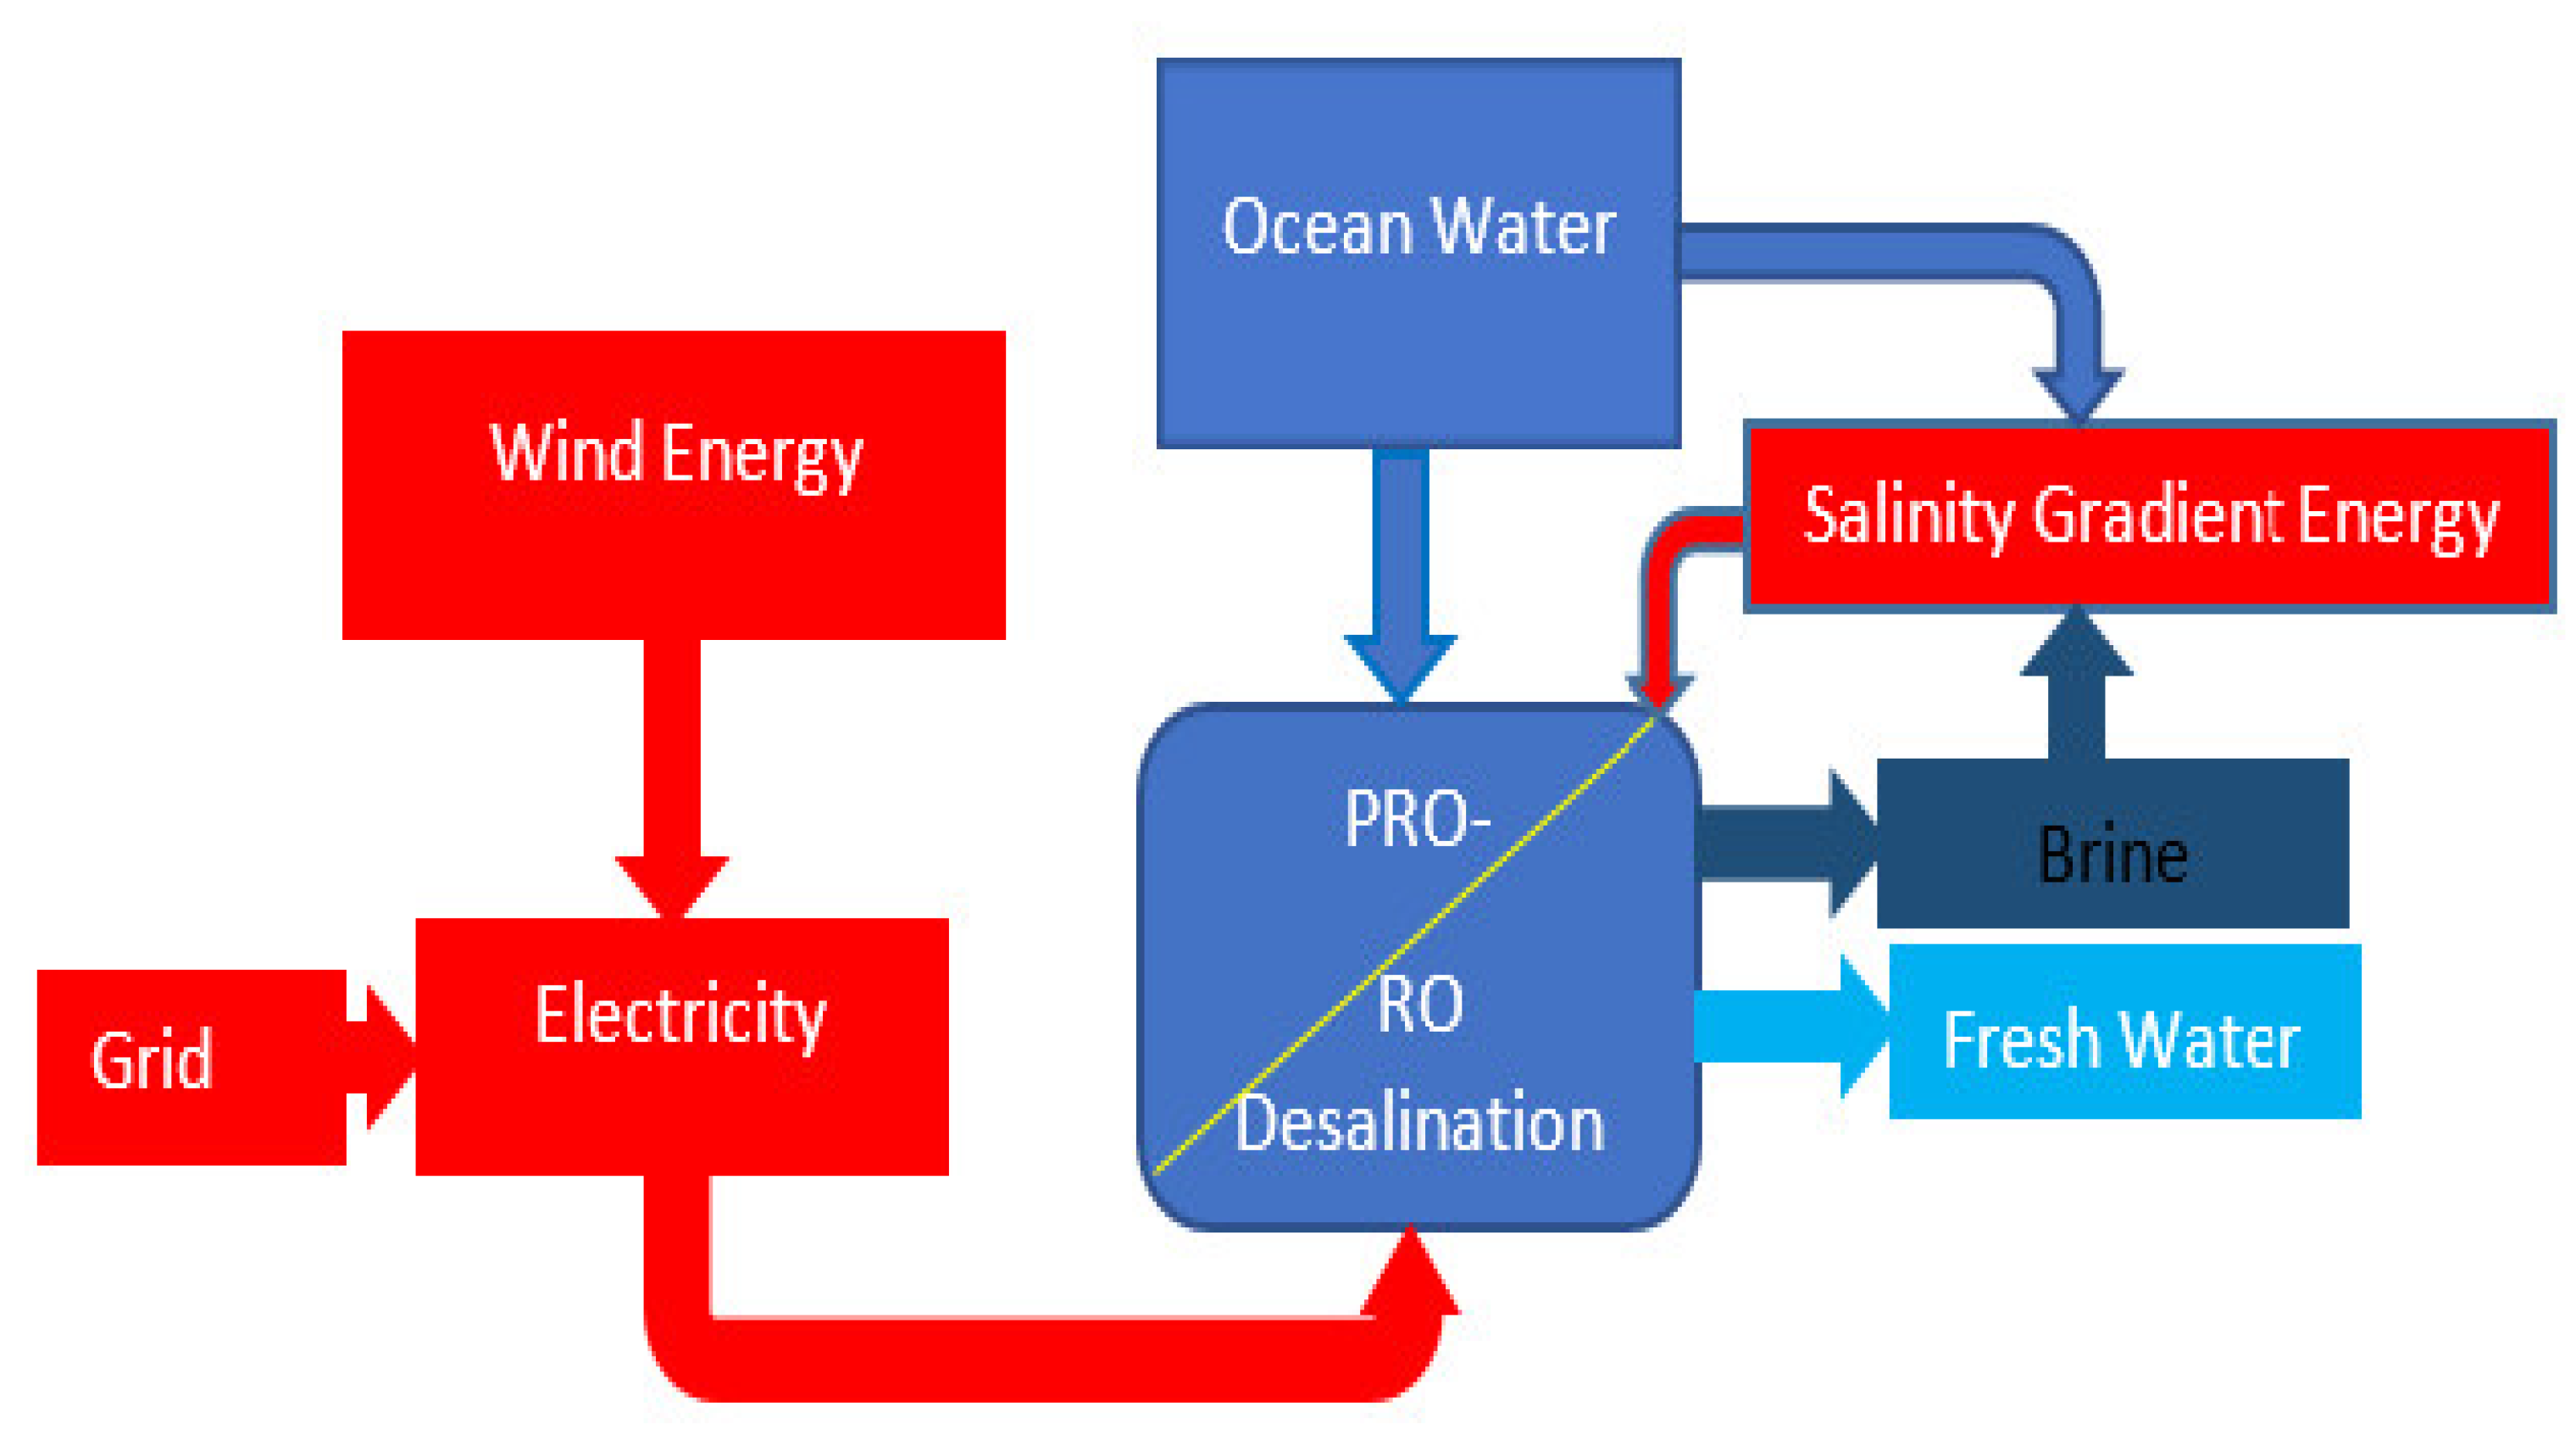
2.1. System Architecture

The proposed system configuration is such that the ocean water (feed water) is passed through the PRO process before the RO desalination process. At the PRO stage, the ocean water is also used as a low salinity solution to create a salinity gradient with the concentrated draw solution (brine), which is the byproduct of desalination. The salinity gradient is the pressure difference between the low concentrated feed water and the high concentrated brine solution that allows the transmission of feed water via the PRO membrane. The low salinity feed water from the PRO is then fed into the RO section, requiring low pressure for desalination. The low pressure needed for the RO unit is provided by wind energy and backed up by grid power. Figure 1 depicts a schematic diagram of the integrated PRO-RO desalination process powered by ocean salinity gradient and grid-tie offshore wind.

2.2. Salinity Gradient Energy

Salinity gradient energy, like other forms of ocean energy, is very predictable and has high energy density; therefore, it is more reliable than other forms of renewable energy [30]. It has the potential to improve energy sustainability if given adequate attention. This form of energy is yet to be harnessed for large-scale application, owing to limited technology. Few attempts have been made to investigate the use of ocean energy, with most of these investigations at experimental stages [30]. This energy, called blue energy, is sourced from the salinity concentration difference between two solutions. It can be used directly for desalination with technologies like FO, RED, and PRO or be captured and converted to electrical energy. The entropy change resulting from the irreversible mixing of two solutions of different salinity concentrations can be utilized to convert part of the thermal energy of the fluids into electrical energy [30]. While Jia et al. [30] reviewed different technologies used to capture salinity gradient energy, Tufa et al. [31] detail the thermodynamic characteristics of the process. According to Tufa et al. [31], the chemical potential μi of a solution, if known, determines the amount of free energy of mixing.
G = μ i n i
where n is the number of moles of each component, which can be expressed in terms of molar concentration c and total volume V as:
n i = c i V
The Gibbs free energy of mixing (∆ G m i x ) of two salt solutions at different concentrations is given by the difference between the Gibbs free energy of the mixed solution ( G t ) and the Gibbs free energy of the initial solutions:
Δ G m i x = G t ( G c + G d )
where subscripts c and d refer to concentrated and dilute solutions, respectively. Combining (1)–(5), Δ G m i x can be calculated as:
Δ G m i x = i ( c i , t V t R T I n γ i , t x i , t ) ( c i , c R T I n γ i , c x i , c ) + ( c i , d R T I n γ i , d x i , d )
In theory, the maximum extractable energy during the irreversible mixing of a low-concentration stream with high-concentration (draw) solutions is substantial, ranging from 0.75 kWh/m3 to 14.1 kWh/m3 depending on the low-concentration stream [30,31]. In this study, the salinity gradient energy is required only to run the PRO section, since there is no widely available commercial technology to harness it for a large desalination system.

2.3. PRO Power and Cost Model

The PRO process allows the transfer of water from a low concentration to a higher concentration via a membrane due to osmotic pressure difference between the two solutions. It requires a back pressure on the high concentration side that retards the permeate flow and can generate power when the solution is depressurized via a turbine, making it a very promising technology for salinity gradient energy generation [32,33]. The power demanded by PRO is mainly for the pressure pump, which a salinity gradient can effectively provide at no cost.
In PRO, the driving force across the membranes can be expressed as the osmotic pressure difference (∆π) and the hydrostatic pressure difference (∆P). The resulting pressure-retarded osmotic water flux Jw can be calculated from the membrane water permeability A and the driving force [31]:
J w = A ( Δ π Δ P )
In the same form as hydroelectric power, the power density Pd produced in a PRO process is the product of the augmented flow rate and pressure drop through a hydro-turbine:
P d = J w Δ P = A ( Δ π Δ P ) Δ P
The differentiation of (3) will give the maximum power as (7).
P d , m a x = A f Δ π 2
This is achieved when the applied force is half of the osmotic pressure (∆P = ∆π/2). The net salinity gradient power output (SGP) from the PRO plant would be “generated power” minus “consumed power”, expressed in (8) [34,35].
SG p = SG pg SG pc
The capital cost of a PRO system is difficult to estimate, since there is yet no commercial PRO plant in operation. Therefore, there is an unavailability of detailed data in the literature as to the capital cost of PRO systems, except for experimental cases and test systems [36,37]. Therefore, we benchmark capital expenditure for the RO system, similar to the approach of [35,36,37].

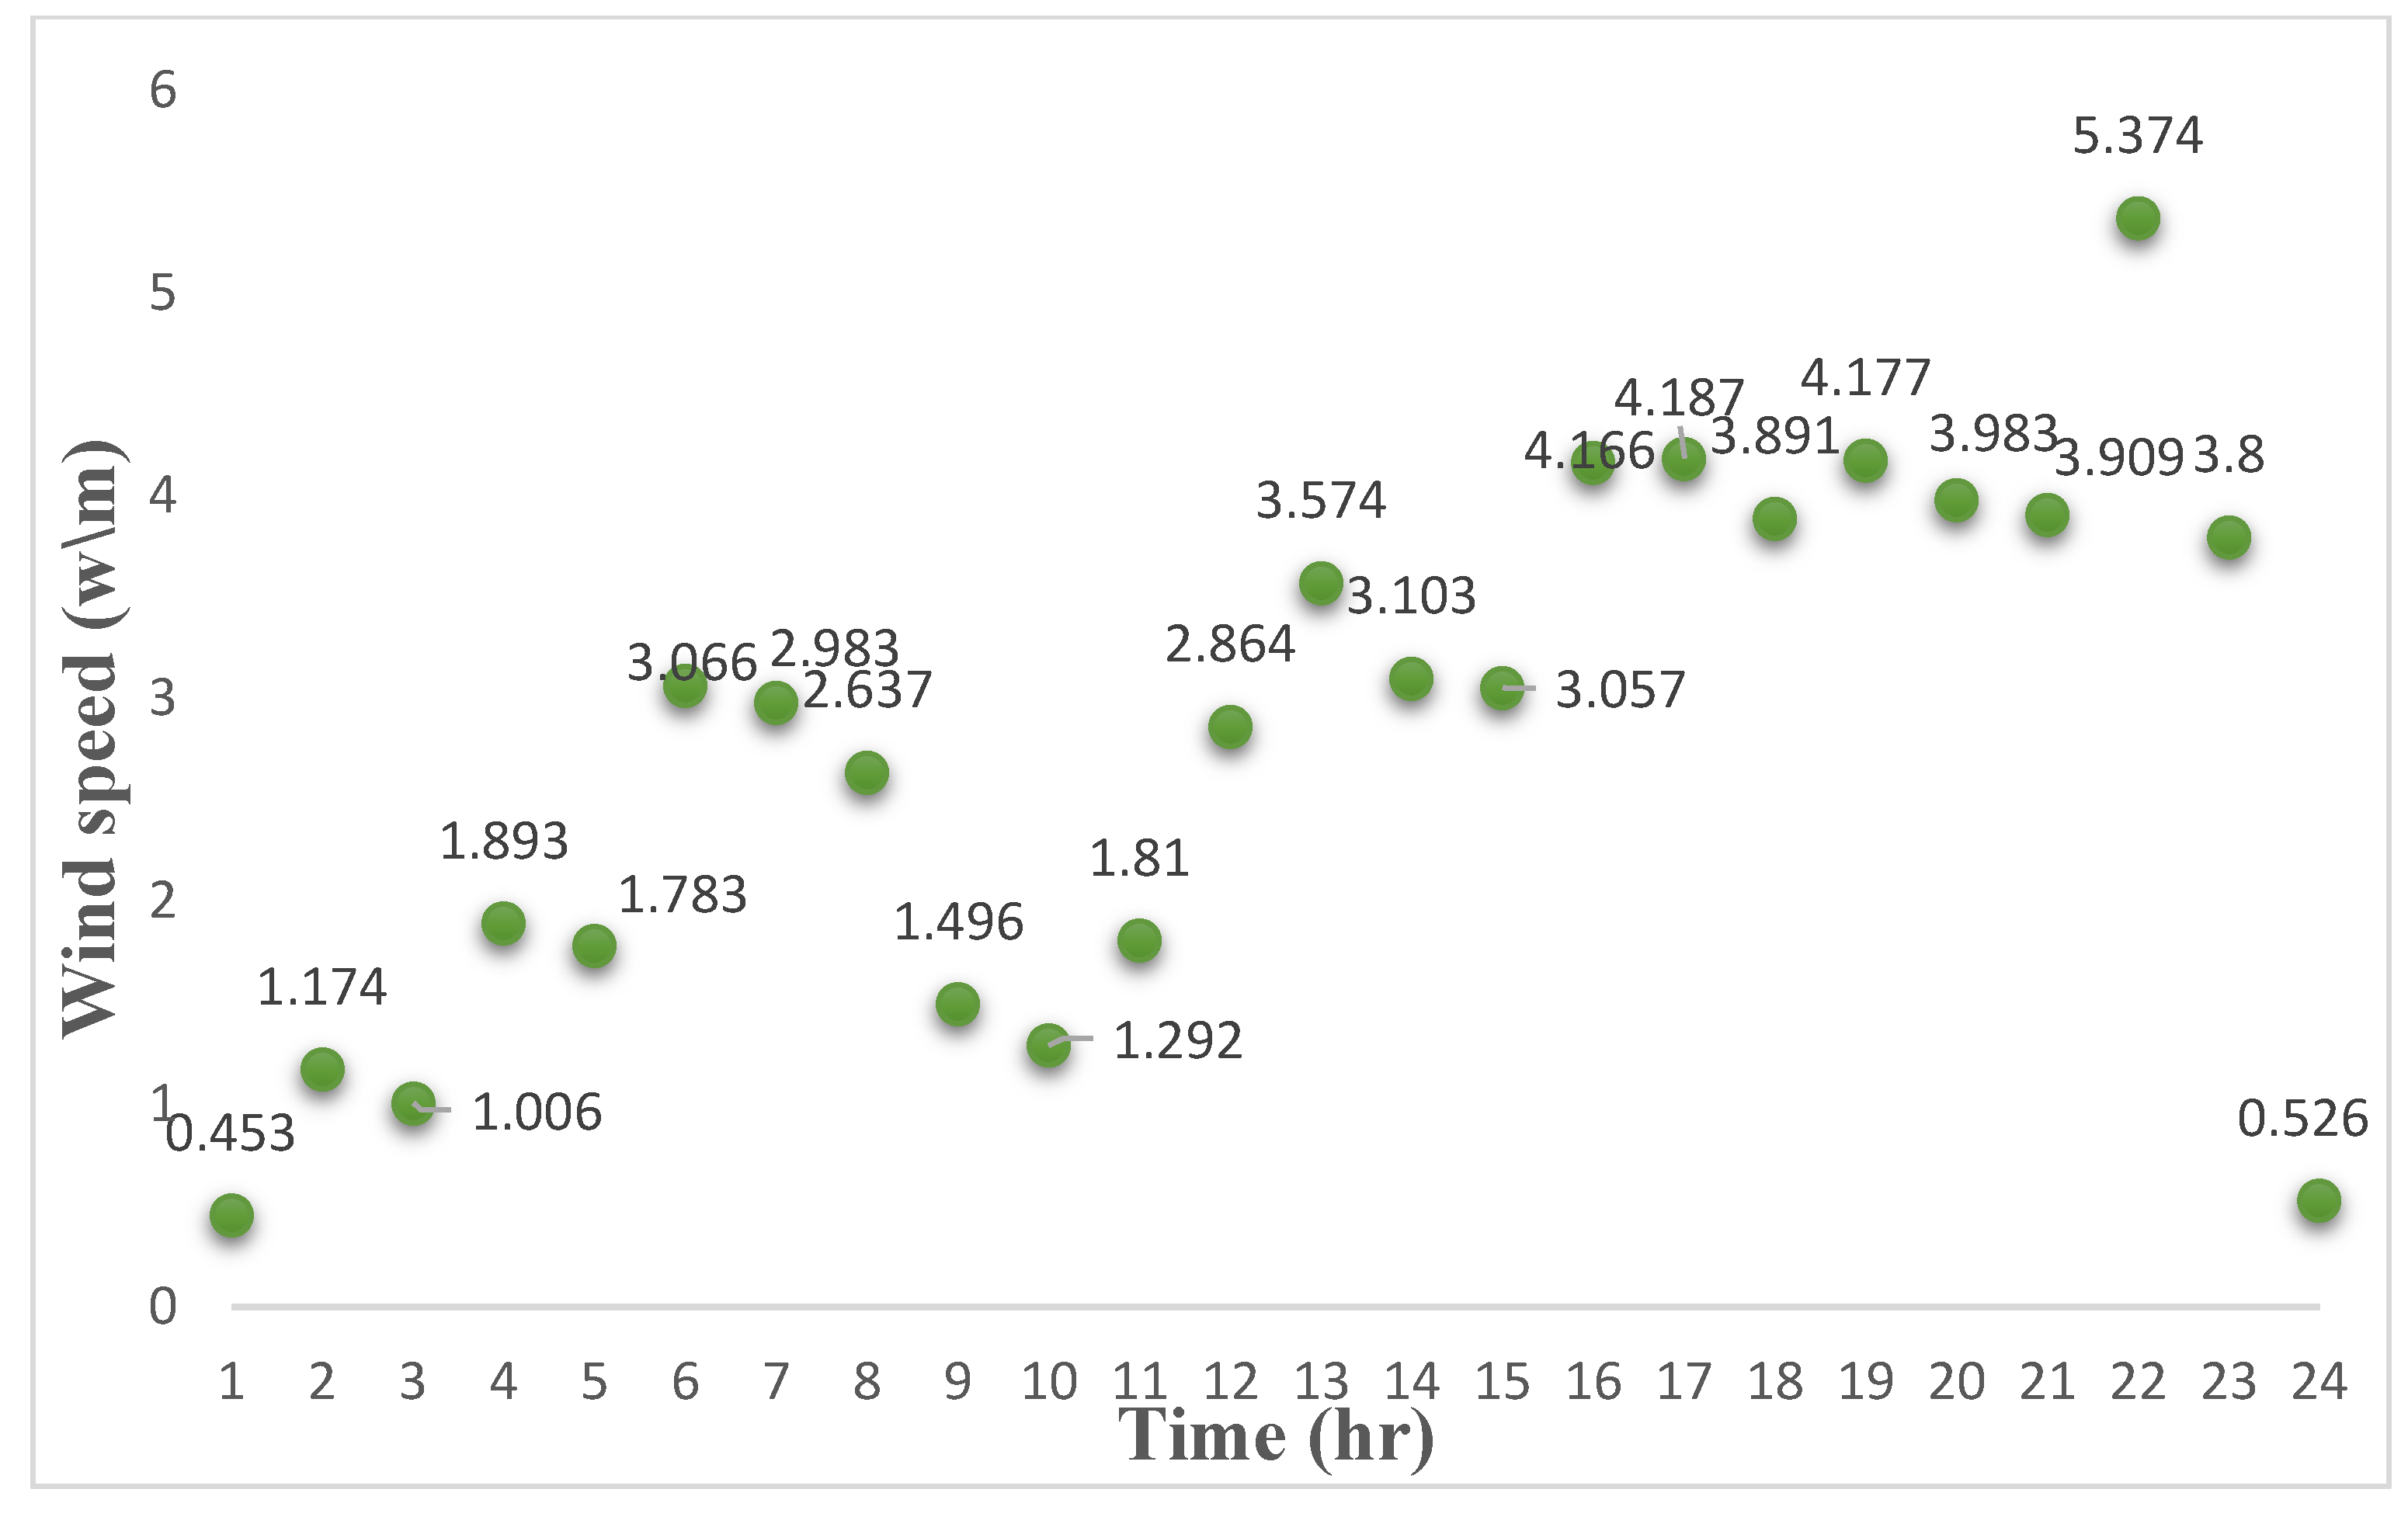
2.4. Wind Power and Cost Model

The wind energy is used mainly to power the RO unit of the desalination system. The proposed system design indicates that the wind station is closely located to the ocean and the RO unit; thus, the cost of power transmission and energy losses are considered negligible. The hourly power output of the wind generator (Wp(t)) is given as [38]:
W p ( t ) = 1 2 × η w × ρ a i r × C p × A W T × V ( t ) 3
where η w is the efficiency of the wind generator, ρair is the air density, Cp is the power coefficient, AWT is the swept area of the wind turbine, and V(t) is the hourly wind speed, given as [39] and depicted in Figure 2:
V ( t ) = V R × [ h h R ]
where V(t) is the hourly speed at projected height (h), VR is the hourly speed at reference height (hR), and α is the power-law exponent, equivalent to 1/7.
The economics of using wind power for desalination is analyzed based on the initial capital cost (ICWT) and total maintenance cost (TMCWT), depending on the area of the wind turbine, as follows:
IC WT = AWT × C WT
A M C W T = AWT × MC WT × r  

2.5. Grid Power, Cost, and Carbon Emission Factor

For reliability of power supply, the grid power is used as a backup to complement the intermittency of the wind power supply in order to satisfy the load demand of the RO unit at every hour of the day. The grid power supply per hour (GPi(t)) is an optimized variable ranging between zero and the maximum power demand by the RO unit. Additionally, the excess power output from the wind source is transferred to the grid at a cost equivalent to buying power from the utility. This tradeoff offsets certain energy costs. The grid power cost is a factor of the energy price and the difference between power bought and power sold back to the grid. Thus,
CGP = ( GP i ( t ) × P ( t ) GP e ( t ) × P ( t ) )    
t = 1 ,   2 ,   3 ,   8760
where, CGP is the total annual cost of transferable grid power, and GPi(t) is hourly power imported from the grid. In contrast, GPe(t) is the hourly exported power to the grid and P(t) is the hourly unit price of transferable grid power in South Africa, as represented in Figure 3 [40].
The emission of greenhouse gases, especially carbons, by the conventional energy sources of the power grid has been of great environmental concern, and yet most desalination plants depend on such energy sources for production of freshwater. In order to discourage overdependence on fossil energy sources by industries, there are standard measures put in place by governments of different countries to regularize such energy use. One such measure is a carbon tax. For effective implementation of carbon tax law, there is usually a standard benchmark, which is the specific emission factor. Therefore, the carbon tax and emission factor are used to determine the carbon emission cost, which also depends on the country where the plant is located. Additionally, the carbon emission cost is a function of energy consumption [24,41,42], as shown in (14).
C E   ( $ m 3 ) = E n e r g y   s u p p l y   ( k W h m 3 ) × E m i s s i o n   f a c t o r   ( kgCO 2 e k W h ) × C a r b o n   t a x   ( $ kgCO 2 e )
This study adopted the calculated emission factor for South Africa by reference [13,40,43]. The lowest value of $0.41 is utilized in this study such that the effect of carbon emissions cost is considered proportional to carbon tax rate.

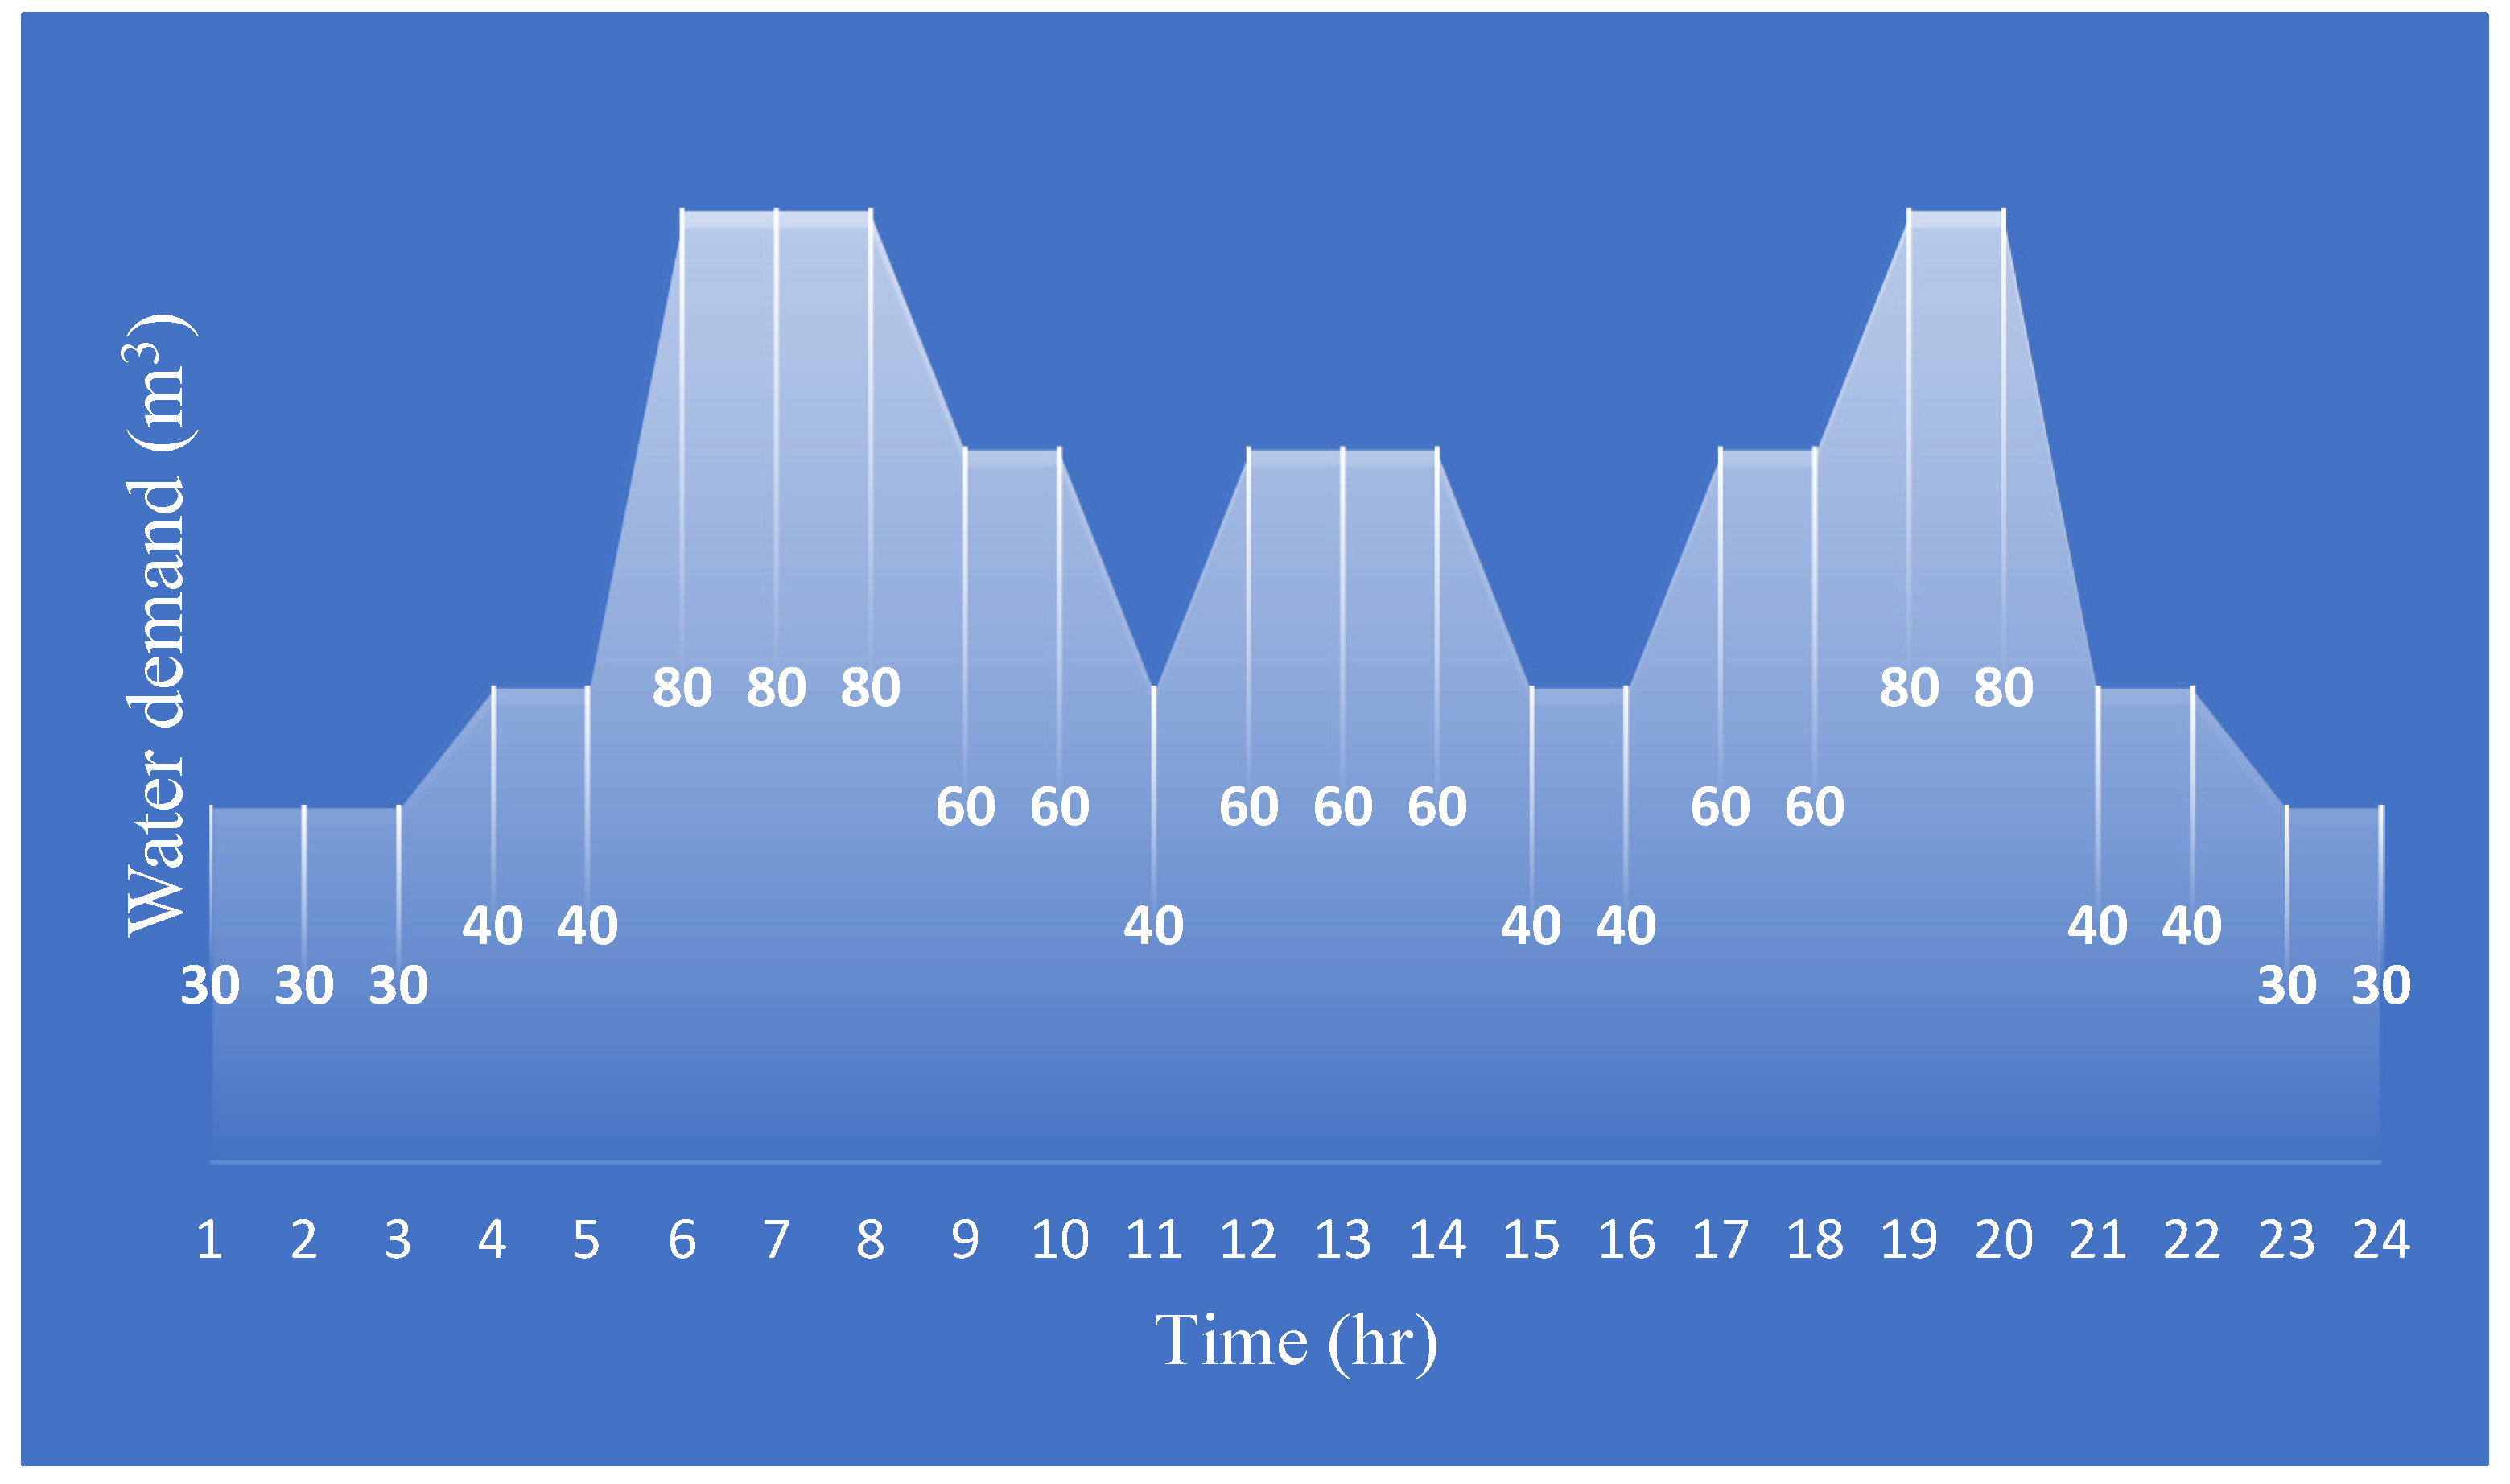
2.6. RO Desalination Power Demand and Cost Model

The hourly power demand (PWD(t)) of the RO desalination unit depends on the specific energy consumption (SEC) to produce 1 m3 of freshwater and the actual volume of water (QWRO(t)) produced per hour [44,45]. The SEC of a conventional RO system ranges between 3 and 6 kWh/m3, but a hybrid with PRO reduces this energy requirement to 1.2 kWh/m3 [41].
P WD ( t ) = QW R O ( t ) ×   SEC
The daily water production capacity is given as:
D Q W = t = 1 24 QW R O ( t )
The water tank capacity (WTK), expressed in m3, is assumed to be twice the daily water production capacity in order to make enough space for extra water produced.
W T K = D Q W × 2
The RO desalination cost model includes the initial capital cost (ICRO), annual maintenance and operational cost (AMCRO), annual membrane replacement cost (ACMR), annual treatment chemical cost (ACCH), and water tank cost (CWTK) [4,8].
I C RO = C RO × D Q W
I C W T K = C W T K × W T K

2.7. Economic and Reliability Assessment

Cost Optimization Problem Formulation

Optimization, in simple terms, is the minimization or maximization of a function of a system, such as cost or technical and operational functions. In this study, the ACS, LCOE, and COW cost matrices are used for the economic evaluation of the PRO-RO desalination. The ACS is the summation of the total system component cost with the capital recovery factor (CRF), a function of total initial system cost (TISC) [46,47,48]. The COW and the LCOE are other cost matrices for evaluating the cost of energy expended and the cost of producing 1 cm3 water, respectively.
TISC = IC WT + I C P R O + I C R O + I C W T K
TMC = A M C W T + A M C P R O + A M C R O
ACS = TISC × CRF + TMC + A C M R × CRF + A C C H
where:
CRF = i ( 1 + i ) n ( 1 + i ) n 1               n = 1 19
TMC is total maintenance and operation cost, and ACMR and ACCH are annual cost of membrane and treatment chemicals, respectively, while n is the number of years in the lifetime of the system, of which interest rate i is considered.
COW = ACS DQW ( t )
LCOE = ACS W p ( t ) + SG p ( t )
t = 1 , 2 , 3 8760
The multi-objective optimization problem is to minimize ACS while the quantity of freshwater produce is maximized, as expressed by (28). This linear programing problem is subject to constraints (29) to (33), with weighting factors (W1 and W2) which were allocated to rank the objective components on a preferential order of significance. The ACS is ranked higher than quantity of water produced, because this study considered that meeting water demand at lower cost is paramount than producing excess. The optimization problem is then solved with the aid of the COMPLEX solver of the advanced interactive multidimensional modeling system, commonly referred to as AIMMS.
Objective Function
M i n [ w 1 × ACS + w 2 × DQW ( t ) ]
S.t.
W p ( t ) + G pi ( t ) = P WD ( t ) + G pe ( t )
This constraint ensures power balance between supply and demand at time t. Similarly, (28) ensures that daily water produced equals or is in excess of water demand, while (29) maintains a boundary limit of water produced per hour.
D Q W ( t ) WD ( t )
QW m i n QW R O ( t ) QW m a x
The power required by RO is kept within a limit expressed by (30), while constraint (31) limits the wind turbine area.
P WD m i n P WD ( t ) P WD m a x
    t = 1 , 2 , 3 8760
AWT 0          

2.8. Reliability Assessment

The reliability assessment of this integrated system is aimed at evaluating the energy security of the system. This is to guarantee energy efficiency, considering the stochastic nature of wind energy. In this study, this reliability assessment focuses on the interruption caused by the intermittency of wind energy. The salinity gradient energy complements the loss of energy supply from the wind energy source. Therefore, the loss of load probability (LOLP) index is utilized for this assessment. Utilities often employ the LOLP to measure the total number of days in a year that generator capacity could not meet daily peak load. It is expressed as (32) [49].
L O L P = j = 1 j p j j    
where j is the capacity outage state, p j is the state probability of the capacity outage state j, and j is the outage duration of the capacity outage state j.
Figure 4 represents the flow chart of the optimization model.

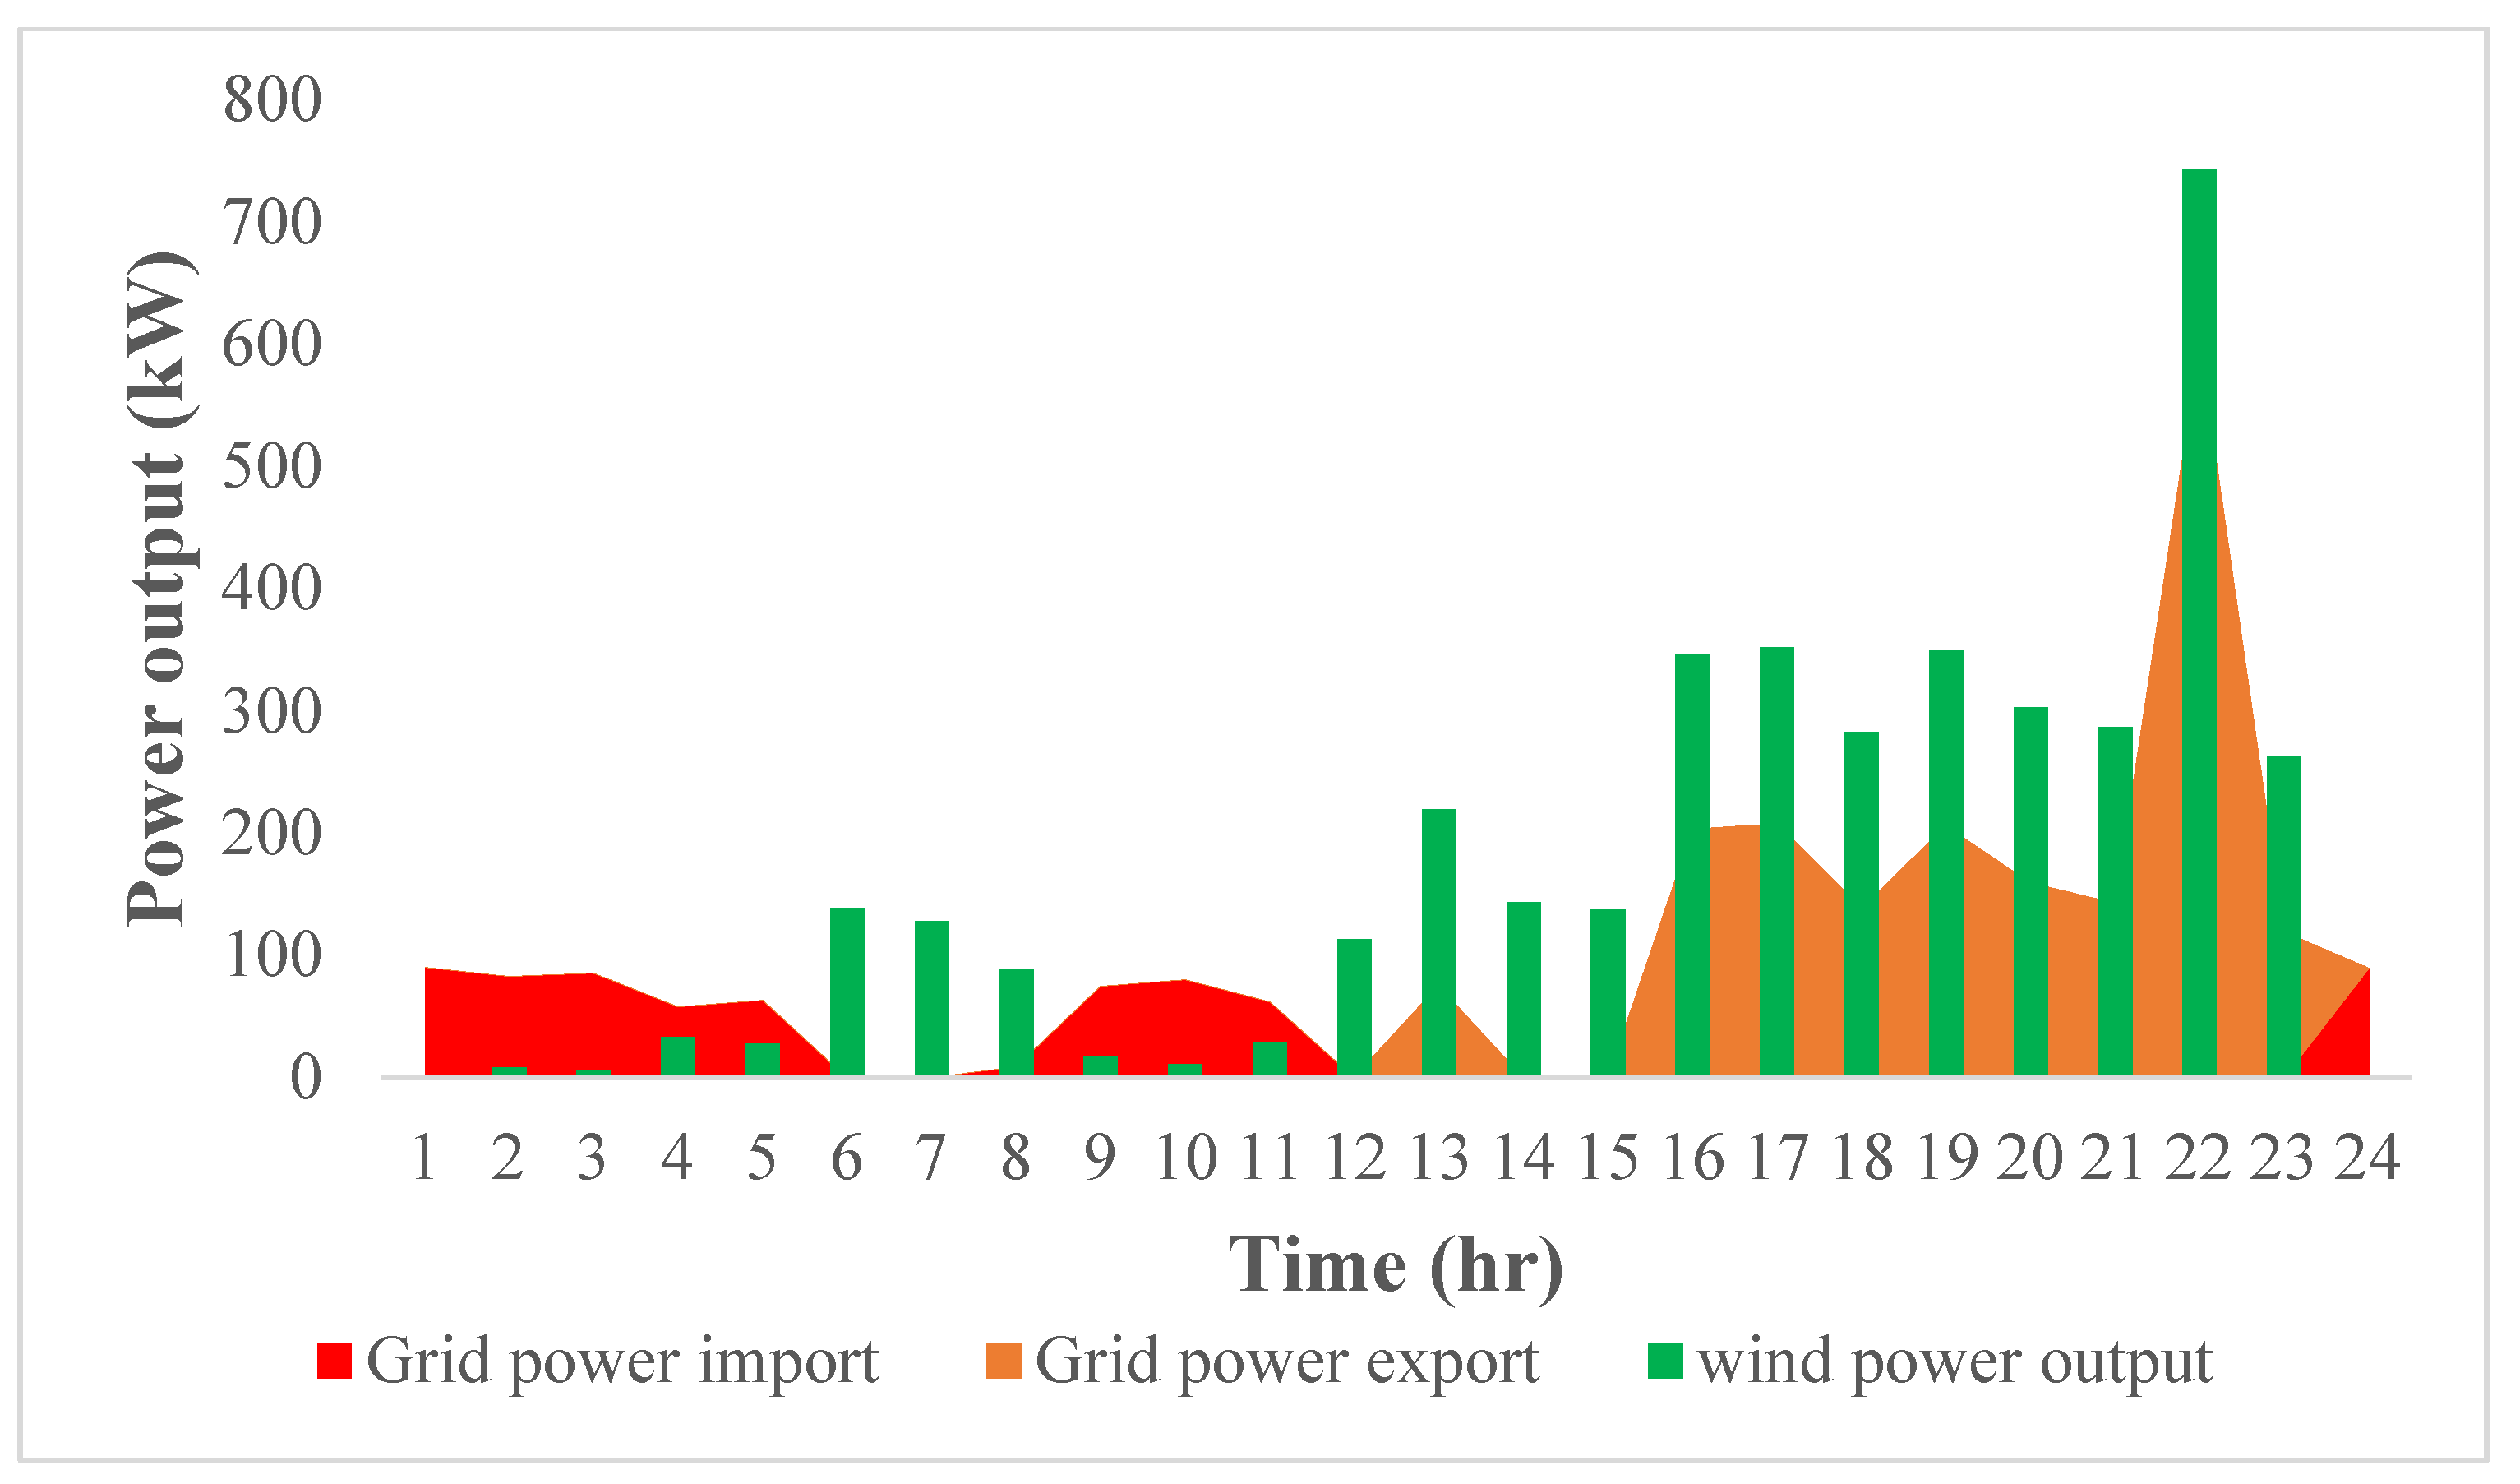
3. Results and Discussion

The metrological data, energy price, carbon emission cost, and emission factor used in this study are those obtainable in South Africa, similarly presented in [5,13,40]. Figure 5 represents the assumed hourly quantity of water demand, while Table 1 contains essential input parameters for optimal cost analysis.
This proposed model shows the hourly power output from the wind and grid sources as depicted in Figure 6 and the optimal hourly quantity of water produced represented in Figure 7. Furthermore, the summary of optimized parameters is contained in Table 2.
Figure 6 clearly shows that wind energy is preferred over grid power. When there is available wind power, the wind generator powers the RO desalination system. For hours where there is a shortage of wind energy due to wind speed variation, the grid power serves as a backup power to the RO desalination unit. The excess power output from the wind source is exported back to the grid at a cost equivalent to purchasing from the grid. As previously stated in Section 2.2, the salinity gradient energy is mainly used to run only the pressure pump of the PRO unit in order to enable water transfer through the membrane into the RO unit. This first stage can be considered a pretreatment process, while helping to reduce the RO unit’s energy requirement, and reduces the fouling effects on the RO membrane, thus increasing permissibility. The impact of these is the large quantity of water produced at every hour of the day, not just to meet demand but also to have excess, especially at hours with high wind energy output, as shown in Figure 7.
The summary results of the optimized parameters shown in Table 2 present the ACS of the integrated system to be $110,456, the LCOE 1.11 $/kW, and the COW 0.13 $/m3. These costs are relatively lower than some cases of standalone RO units and some similar hybrid cases in the literature that did not consider carbon emission cost and the component cost of PRO, assumed to be the same as that of RO in this study. For instance, [5,40] reported 1.33 $/m3 and 1.77 $/m3 for COW, respectively, for a standalone RO unit. It can be noted that these economic values are subject to change with variation in the actual cost of the PRO component, if known. In addition, the cost of this proposed model, if viewed extensively to cover brine management cost and the reduction in carbon emissions and its cost, is far more economical, as there is no need for the extra external cost of brine disposal or management. The carbon emission of 269,405 kgCO2-e is advantageously lower than a similar system with diesel generators or desalination systems predominantly powered by the grid’s conventional energy source. The LOLP is as low as 0.341, because the higher wind energy output is enough to power the RO desalination unit. This is especially so, because the energy requirement of the unit is reduced because of the reduced pressure required to get feed water through the RO membrane after passing through the PRO unit.

4. Conclusions

This study presents an optimal techno-economic and reliability evaluation model of a PRO-RO hybrid desalination system powered by a grid-tied wind energy source and salinity gradient energy. The design is of two stages. Stage one is the PRO unit powered by salinity gradient energy produced due to the mixture of ocean feed water (low concentration) and RO brine solution (high concentration). Stage two is the RO unit powered by grid-tied wind energy, where a secondary ocean feed water desalination is carried out. The brine produced from stage two is channeled back to stage one to create a salinity gradient for water transfer via PRO membrane and generation of energy. The proposed model optimally sized the grid-tied wind energy sources in order to minimize carbon emission and its cost and the whole system in order to minimize the ACS, LCOE, and COW. The results from the techno-economic evaluation of the proposed design model show ACS of $110,456, LCOE of 1.11 kW/m3, and COW of 0.13 $/m3. These cost values are relatively lower than those of the standalone RO desalination systems available in the literature. For instance, [5,40] reported 1.33 $/m3 and 1.77 $/m3 for COW, respectively, for a standalone RO unit. The extended advantages of zero brine disposal and management cost and the low carbon emission and emission cost make the hybrid PRO-RO model more environmentally friendly. The PRO-RO desalination system can also be considered economical, considering that the extra cost of brine disposal or treatment will no longer be a factor. The reliability index of low LOLP of 0.341 suggests the reliability of the proposed system. This is because of high power output from the wind energy source and the low energy required by the RO unit after the PRO unit partially desalinates the feed water.
In conclusion, the hybrid PRO-RO desalination system powered by wind energy is a promising approach to solving freshwater scarcity and the associated environmental issues of brine disposal. Furthermore, it solves the challenge of large carbon emissions when a conventional fossil fuel generator is used for RO desalination. In the future, with the advancements in PRO technology, salinity gradient energy can be harnessed to meet the energy requirements of RO desalination. This will substantively reduce the energy costs of desalination systems. By extension, it will reduce the cost of freshwater production.

Author Contributions

Conceptualization, E.J.O., N.N. and P.N.B.; methodology, E.J.O., N.N. and P.N.B.; software, E.J.O., N.N. and P.N.B.; validation, E.J.O., N.N. and P.N.B.; formal analysis, E.J.O., N.N. and P.N.B.; investigation, E.J.O., N.N. and P.N.B.; resources, E.J.O., N.N. and P.N.B.; data curation, E.J.O., N.N. and P.N.B.; writing—original draft preparation, E.J.O.; writing—review and editing, E.J.O., N.N. and P.N.B.; visualization, E.J.O., N.N. and P.N.B.; supervision, N.N. and P.N.B.; funding acquisition, N.N. and P.N.B. All authors have read and agreed to the published version of the manuscript.

Funding

This research received no external funding.

Acknowledgments

The authors acknowledge the school of postgraduate studies of the University of Johannesburg for the financial and technical support given towards this research.

Conflicts of Interest

The authors declare no conflict of interest.

Abbreviations

FOForward osmosis
PROPressure-retarded osmosis
ROReverse osmosis
RODReverse osmosis desalination
UNGAUnited Nations General Assembly
Set
ttime (hr)
Parameters
vPartial molar volume (m3 mol−1)
VTotal volume of concentration (mol m3)
cMolar concentration (mol m3)
xMole fraction (mol−1)
zValence of ion (equiv/mol)
FFaraday constant (c/equiv)
RGas constant (J mol−1 K−1)
TAbsolute temperature (K)
GGibbs free energy (J)
nNumber of moles
μ i Chemical potential (J mol−1)
μ i 0 Chemical potential under standard condition (J mol−1)
Δ ρ Pressure gradient (Pa)
Δ φ Electrical potential difference (V)
γActivity coefficient
Δ G m i x Gibbs free energy of the mixed solution (J)
G t Mixed solution
G c Concentrated solution
G d Dilute solution
J w Osmotic water flux (m3 m−2 h−1)
Δ π Osmotic pressure difference (Pa)
Δ P Hydrostatic pressure difference (Pa)
A Membrane water permeability (ms−1 Pa−1)
P d Power density (Wm−2)
P d , m a x Maximum power density (Wm−2)
S G p g Salinity gradient power generated (kW)
S G p c Salinity gradient power consumed (kW)
η w Efficiency of wind generator
ρ a i r Air density
C p Power coefficient
V(t)3Hourly wind speed (W/m)
hProjected wind turbine height (m)
VRReference wind speed (W/m)
hRReference wind turbine height (m)
αPower law exponent
IC WT Initial capital cost of wind turbine ($)
C W T Cost of wind turbine ($)
T M C W T Maintenance cost of wind generator ($)
A M C W T Annual maintenance cost of the wind generator ($)
M C W T Cost of maintenance of a wind turbine ($)
rDiscount rate
CRFCapital recovery factor
SECSpecific energy consumption (kWh/m3)
WD(t)Hourly water demand (m3)
I C R O Initial capital cost of RO ($/m3/day)
CRORO cost ($/m3)
ACCHAnnual cost of RO treatment chemicals ($)
ACMRAnnual cost of RO membrane replacement ($)
AMCRORO annual maintenance cost ($)
CPROPRO cost ($/m3)
I C P R O Initial capital cost of PRO ($/m3/day)
AMCPROPRO annual maintenance cost ($)
W T K Water tank capacity (m3)
CWTKWater tank cost ($/m3)
CWTWind turbine cost ($)
ICWTKInitial capital cost of the water tank ($)
TICCTotal initial capital cost of system ($)
TMCTotal maintenance and operational cost ($)
Q W m i n , Q W m a x Minimum and maximum water produce (m3)
P W D m i n , P W D m a x Minimum and maximum power demand (kW)
W1, W2Weighting factor
jCapacity outage state
p j State probability of j
j Outage duration of j
Variables
P W D ( t ) Hourly power demand by RO unit (kW)
Q W R O ( t ) Hourly volume of water produced (m3)
D W Q Daily water production capacity (m3)
A W T Swept area of wind turbine (m)
W p ( t ) Hourly power wind generator power output (kW)
S G p ( t ) Hourly net salinity gradient power out (kW)
G p i ( t ) Grid power imported (kW)
G p e ( t ) Grid power exported (kW)
COWCost of water ($/m3)
ACSAnnualized cost of system ($)
LCOELevelized cost of energy ($)
LOLPLoss of load probability

References

  1. Prathapaneni, D.R.; Detroja, K. Optimal design of energy sources and reverse osmosis desalination plant with demand side management for cost-effective freshwater production. Desalination 2020, 496, 114741. [Google Scholar] [CrossRef]
  2. Abdelkareem, M.A.; El Haj Assad, M.; Sayed, E.T.; Soudan, B. Recent progress in the use of renewable energy sources to power water desalination plants. Desalination 2018, 435, 97–113. [Google Scholar] [CrossRef]
  3. Ghenai, C.; Merabet, A.; Salameh, T.; Pigem, E.C. Grid-tied and stand-alone hybrid solar power system for desalination plant. Desalination 2018, 435, 172–180. [Google Scholar] [CrossRef]
  4. Abdelshafy, A.M.; Hassan, H.; Jurasz, J. Optimal design of a grid-connected desalination plant powered by renewable energy resources using a hybrid PSO–GWO approach. Energy Convers. Manag. 2018, 173, 331–347. [Google Scholar] [CrossRef]
  5. Okampo, E.J.; Nwulu, N.I. Optimal energy mix for a reverse osmosis desalination unit considering demand response osmosis. J. Eng. Des. Technol. 2020, 18, 1287–1303. [Google Scholar] [CrossRef]
  6. Koutroulis, E.; Kolokotsa, D. Design optimization of desalination systems power-supplied by PV and W/G energy sources. Desalination 2010, 258, 171–181. [Google Scholar] [CrossRef]
  7. Smaoui, M.; Abdelkafi, A.; Krichen, L. Optimal sizing of stand-alone photovoltaic/wind/hydrogen hybrid system supplying a desalination unit. Sol. Energy 2015, 120, 263–276. [Google Scholar] [CrossRef]
  8. Wu, B.; Maleki, A.; Pourfayaz, F.; Rosen, M.A. Optimal design of stand-alone reverse osmosis desalination driven by a photovoltaic and diesel generator hybrid system. Sol. Energy 2018, 163, 91–103. [Google Scholar] [CrossRef]
  9. Okampo, E.J.; Nwulu, N. Optimisation of renewable energy powered reverse osmosis desalination systems: A state-of-the-art review. Renew. Sustain. Energy Rev. 2021, 140, 110712. [Google Scholar] [CrossRef]
  10. Pohl, R.; Kaltschmitt, M.; Holländer, R. Investigation of different operational strategies for the variable operation of a simple reverse osmosis unit. Desalination 2009, 249, 1280–1287. [Google Scholar] [CrossRef]
  11. Ghobeity, A.; Mitsos, A. Optimal time-dependent operation of seawater reverse osmosis. Desalination 2010, 263, 76–88. [Google Scholar] [CrossRef]
  12. Ruiz-García, A.; Nuez, I. Performance evaluation and boron rejection in a SWRO system under variable operating conditions. Comput. Chem. Eng. 2021, 153, 107441. [Google Scholar] [CrossRef]
  13. Okampo, E.J.; Nwulu, N. Optimal design and techno-economic evaluation of renewable energy powered combined reverse osmosis desalination and brine treatment unit. Desalin. Water Treat. 2020, 202, 27–37. [Google Scholar] [CrossRef]
  14. Nayar, K.G.; Fernandes, J.; Mcgovern, R.K.; Dominguez, K.P.; Mccance, A.; Al-anzi, B.S.; Lienhard, J.H. Cost and energy requirements of hybrid RO and ED brine concentration systems for salt production. Desalination 2019, 456, 97–120. [Google Scholar] [CrossRef]
  15. Li, Z.; Siddiqi, A.; Anadon, L.D.; Narayanamurti, V. Towards sustainability in water-energy nexus: Ocean energy for seawater desalination. Renew. Sustain. Energy Rev. 2018, 82, 3833–3847. [Google Scholar] [CrossRef] [Green Version]
  16. Teow, Y.H.; Mohammad, A.W. New generation nanomaterials for water desalination: A review. Desalination 2019, 451, 2–17. [Google Scholar] [CrossRef]
  17. Mamah, S.C.; Goh, P.S.; Ismail, A.F.; Suzaimi, N.D.; Ahmad, N.A.; Lee, W.J. Flux enhancement in reverse osmosis membranes induced by synergistic effect of incorporated palygorskite/chitin hybrid nanomaterial. J. Environ. Chem. Eng. 2021, 9, 105432. [Google Scholar] [CrossRef]
  18. Ng, Z.C.; Lau, W.J.; Matsuura, T.; Ismail, A.F. Thin film nanocomposite RO membranes: Review on fabrication techniques and impacts of nanofiller characteristics on membrane properties. Chem. Eng. Res. Des. 2021, 165, 81–105. [Google Scholar] [CrossRef]
  19. Nayar, K.G.; Fernandes, J.; McGovern, R.K.; Al-Anzi, B.S.; Lienhard, J.H. Cost and energy needs of RO-ED-crystallizer systems for zero brine discharge seawater desalination. Desalination 2019, 457, 115–132. [Google Scholar] [CrossRef]
  20. Yangali-Quintanilla, V.; Li, Z.; Valladares, R.; Li, Q.; Amy, G. Indirect desalination of Red Sea water with forward osmosis and low pressure reverse osmosis for water reuse. Desalination 2011, 280, 160–166. [Google Scholar] [CrossRef]
  21. Valladares Linares, R.; Li, Z.; Abu-Ghdaib, M.; Wei, C.H.; Amy, G.; Vrouwenvelder, J.S. Water harvesting from municipal wastewater via osmotic gradient: An evaluation of process performance. J. Memb. Sci. 2013, 447, 50–56. [Google Scholar] [CrossRef]
  22. Valladares Linares, R.; Li, Z.; Yangali-Quintanilla, V.; Ghaffour, N.; Amy, G.; Leiknes, T.; Vrouwenvelder, J.S. Life cycle cost of a hybrid forward osmosis—Low pressure reverse osmosis system for seawater desalination and wastewater recovery. Water Res. 2016, 88, 225–234. [Google Scholar] [CrossRef] [Green Version]
  23. Panagopoulos, A.; Haralambous, K.; Loizidou, M. Desalination brine disposal methods and treatment technologies—A review. Sci. Total Environ. 2019, 693, 133545. [Google Scholar] [CrossRef]
  24. Molinos-Senante, M.; González, D. Evaluation of the economics of desalination by integrating greenhouse gas emission costs: An empirical application for Chile. Renew. Energy 2018, 133, 1327–1337. [Google Scholar] [CrossRef]
  25. Panagopoulos, A.; Loizidou, M.; Haralambous, K.J. Stainless Steel in Thermal Desalination and Brine Treatment: Current Status and Prospects. Met. Mater. Int. 2020, 26, 1463–1482. [Google Scholar] [CrossRef]
  26. Panagopoulos, A.; Haralambous, K. Environmental impacts of desalination and brine treatment—Challenges and mitigation measures. Mar. Pollut. Bull. 2020, 161, 111773. [Google Scholar] [CrossRef]
  27. Roberts, D.A.; Johnston, E.L.; Knott, N.A. Impacts of desalination plant discharges on the marine environment: A critical review of published studies. Water Res. 2010, 44, 5117–5128. [Google Scholar] [CrossRef]
  28. Lior, N. Sustainability as the quantitative norm for water desalination impacts. Desalination 2017, 401, 99–111. [Google Scholar] [CrossRef]
  29. Mannan, M.; Alhaj, M.; Mabrouk, A.N.; Al-Ghamdi, S.G. Examining the life-cycle environmental impacts of desalination: A case study in the State of Qatar. Desalination 2019, 452, 238–246. [Google Scholar] [CrossRef]
  30. Jia, Z.; Wang, B.; Song, S.; Fan, Y. Blue energy: Current technologies for sustainable power generation from water salinity gradient. Renew. Sustain. Energy Rev. 2014, 31, 91–100. [Google Scholar] [CrossRef]
  31. Tufa, R.A.; Curcio, E.; Fontananova, E.; Di Profio, G. Membrane-based processes for sustainable power generation using water: Pressure-retarded osmosis (PRO), reverse electrodialysis (RED), and capacitive mixing (CAPMIX). In Comprehensive Membrane Science and Engineering, 2nd ed.; Elsevier: Amsterdam, The Netherlands, 2017; pp. 206–248. [Google Scholar]
  32. Kim, Y.C.; Elimelech, M. Potential of osmotic power generation by pressure retarded osmosis using seawater as feed solution: Analysis and experiments. J. Memb. Sci. 2013, 429, 330–337. [Google Scholar] [CrossRef]
  33. Long, R.; Lai, X.; Liu, Z.; Liu, W. Pressure retarded osmosis: Operating in a compromise between power density and energy efficiency. Energy 2019, 172, 592–598. [Google Scholar] [CrossRef]
  34. Sakai, H.; Ueyama, T.; Irie, M.; Matsuyama, K.; Tanioka, A.; Saito, K.; Kumano, A. Energy recovery by PRO in sea water desalination plant. Desalination 2016, 389, 52–57. [Google Scholar] [CrossRef]
  35. Matsuyama, K.; Makabe, R.; Ueyama, T.; Sakai, H.; Saito, K.; Okumura, T.; Hayashi, H.; Tanioka, A. Power generation system based on pressure retarded osmosis with a commercially-available hollow fiber PRO membrane module using seawater and freshwater. Desalination 2021, 499, 114805. [Google Scholar] [CrossRef]
  36. Makabe, R.; Ueyama, T.; Sakai, H.; Tanioka, A. Commercial pressure retarded osmosis systems for seawater desalination plants. Membranes 2021, 11, 69. [Google Scholar] [CrossRef]
  37. Loeb, S. Large-scale power production by pressure-retarded osmosis, using river water and sea water passing through spiral modules. Desalination 2002, 143, 115–122. [Google Scholar] [CrossRef]
  38. Nwulu, N.I.; Xia, X. Optimal dispatch for a microgrid incorporating renewables and demand response. Renew. Energy 2017, 101, 16–28. [Google Scholar] [CrossRef]
  39. Salameh, Z.M.; Borowy, B.S. Methodology for Optimally Sizing the Combination of a Battery Bank and PV Array in a Wind/PV Hybrid System. IEEE Trans. Energy Convers. 1996, 11, 367–375. [Google Scholar] [CrossRef]
  40. Okampo, E.J.; Nwulu, N. Techno-economic evaluation of reverse osmosis desalination system considering emission cost and demand response. Sustain. Energy Technol. Assess. 2021, 46, 101252. [Google Scholar] [CrossRef]
  41. Naserisafavi, N.; Yaghoubi, E.; Sharma, A.K. Alternative water supply systems to achieve the net zero water use goal in high-density mixed-use buildings. Sustain. Cities Soc. 2021, 76, 103414. [Google Scholar] [CrossRef]
  42. Kesieme, U.K.; Milne, N.; Aral, H.; Yong, C.; Duke, M. Economic analysis of desalination technologies in the context of carbon pricing, and opportunities for membrane distillation. Desalination 2013, 323, 66–74. [Google Scholar] [CrossRef] [Green Version]
  43. Brander, A.M.; Sood, A.; Wylie, C.; Haughton, A.; Lovell, J.; Reviewers, I.; Davis, G. Technical Paper|Electricity-Specific Emission Factors for Grid Electricity. Available online: https://ecometrica.com/assets/Electricityspecific-emission-factors-for-grid-electricity.pdf. (accessed on 15 February 2022).
  44. Maleki, A.; Khajeh, M.G.; Rosen, M.A. Weather forecasting for optimization of a hybrid solar-wind–powered reverse osmosis water desalination system using a novel optimizer approach. Energy 2016, 114, 1120–1134. [Google Scholar] [CrossRef]
  45. Peng, W.; Maleki, A.; Rosen, M.A.; Azarikhah, P. Optimization of a hybrid system for solar-wind-based water desalination by reverse osmosis: Comparison of approaches. Desalination 2018, 442, 16–31. [Google Scholar] [CrossRef]
  46. Acuña, L.G.; Lake, M.; Padilla, R.V.; Lim, Y.Y.; Ponzón, E.G.; Soo Too, Y.C. Modelling autonomous hybrid photovoltaic-wind energy systems under a new reliability approach. Energy Convers. Manag. 2018, 172, 357–369. [Google Scholar] [CrossRef]
  47. Al-Obaidi, M.A.; Filippini, G.; Manenti, F.; Mujtaba, I.M. Cost evaluation and optimisation of hybrid multi effect distillation and reverse osmosis system for seawater desalination. Desalination 2019, 456, 136–149. [Google Scholar] [CrossRef] [Green Version]
  48. Koroneos, C.; Dompros, A.; Roumbas, G. Renewable energy driven desalination systems modelling. J. Clean. Prod. 2007, 15, 449–464. [Google Scholar] [CrossRef]
  49. Gbadamosi, S.L.; Nwulu, N.I. Optimal power dispatch and reliability analysis of hybrid CHP-PV-wind systems in farming applications. Sustainability 2020, 12, 8199. [Google Scholar] [CrossRef]
Figure 1. Integrated PRO-RO desalination process powered by grid-tied offshore wind and ocean salinity gradient.
Sustainability 14 03328 g001
Figure 2. Hourly wind speed of a coastal area of Cape Town, South Africa.
Sustainability 14 03328 g002
Figure 3. Hourly price of grid power from the South Africa utility company.
Sustainability 14 03328 g003
Figure 4. Flow chart of the optimization model.
Sustainability 14 03328 g004
Figure 5. Hourly water demand.
Sustainability 14 03328 g005
Figure 6. Hourly energy dispensed from the grid and wind power generators.
Sustainability 14 03328 g006
Figure 7. Hourly freshwater produced from the integrated PRO-RO system.
Sustainability 14 03328 g007
Table 1. Input parameters [4,8,13].
ParametersValueParametersValueParametersValue
Project time20 yearsCp0.59B0.85 Lm−2 h−1
Interest rate5%CWT$1804 Δ π 25.35 bar
Discount rate3%CRO532 $/m3/dayA4.0 Lm−2 h−1
Emission factor1.07Plant maintenance cost0.2 $/m3WT rated power1 kW
Emission tax0.41 $Chemical cost0.6 $/m3CMR0.6 $/m3
η w 85%CWTK255 $/m3ρair1.23 kg m3
Table 2. Summary of optimized parameters.
ACS ($)LCOE ($/kW)COW ($/m3)Emission (kgCO2-e)Emission Cost ($)Daily Water Produced (m3)AWT (m2)JW (m3 m−2 h−1)
110,4561.110.13269,405110,456238415,54317.031
Publisher’s Note: MDPI stays neutral with regard to jurisdictional claims in published maps and institutional affiliations.

