Article

Elevated Atmospheric CO2 Concentration Influences the Rooting Habits of Winter-Wheat (Triticum aestivum L.) Varieties

Agricultural Institute, Centre for Agricultural Research, Eötvös Loránd Research Network, 2462 Martonvásár, Hungary
*
Authors to whom correspondence should be addressed.
Sustainability 2022, 14(6), 3304; https://doi.org/10.3390/su14063304
Submission received: 24 February 2022 / Revised: 7 March 2022 / Accepted: 10 March 2022 / Published: 11 March 2022
(This article belongs to the Special Issue Plant Breeding Supporting the Sustainable Field Crop Production)

Abstract

:
The intensity and the frequency of extreme drought are increasing worldwide. An elevated atmospheric CO2 concentration could counterbalance the negative impacts of water shortage; however, wheat genotypes show high variability in terms of CO2 reactions. The development of the root system is a key parameter of abiotic stress resistance. In our study, biomass and grain production, as well as the root growth of three winter-wheat varieties were examined under optimum watering and simulated drought stress in a combination with ambient and elevated atmospheric CO2 concentrations. The root growth was monitored by a CI-600 in situ root imager and the photos were analyzed by RootSnap software. As a result of the water shortage, the yield-related parameters decreased, but the most substantial yield reduction was first detected in Mv Karizma. The water shortage influenced the depth of the intensive root development, while under water-limited conditions, the root formation occurred in the deeper soil layers. The most intensive root development was observed until the heading, and the maximum root length was recorded at the beginning of the heading. The period of root development took longer under elevated CO2 concentration. The elevated CO2 concentration induced an accelerated root development in almost every soil layer, but generally, the CO2 fertilization induced in the root length of all genotypes and under each treatment.

1. Introduction

One of the most important drivers of climatic changes is the increasing atmospheric CO2 concentration [1]. The rising temperature is a well-known worldwide phenomenon; however, the changes in precipitation vary greatly by region [2,3,4]. Still, it can be stated that the frequency and the intensity of drought have been increasing in the most important agricultural areas of the world, and this has resulted in reduced harvested yield and has caused uncertainties in this strategic sector [5]. Many studies have focused on the negative effects of a water-limited environment regarding winter-wheat productivity [2,5,6]. Apart from yield reduction, due to intensive drought, water sources can be utilized less efficiently [7,8]. Several recently published studies confirmed that the elevated CO2 could more or less counterbalance the negative effects of water shortage through the intensification of photosynthesis in C4 plants [9,10] and the regulation of the stomata closure in C3 plants [11,12]. The majority of these studies focused on the aboveground biomass, especially on the harvested yield; however, it must be highlighted that the root system plays an important role in the water and nutrient uptake of the plants [13,14,15]. Rooting depth, as well as the structure of the root system and the depth of intensive root development, are the crucial factors that can influence plants’ water uptake. Still, a well-developed root structure is not the sole determinant of drought tolerance. Roots are often more varied than shoots and are affected by changes in the climate, soil conditions, plant varieties and soil nutrient and water availability throughout the growing season [16]. The accurate examination of the belowground parts of a plant is more complicated than the analysis of the aboveground biomass. Conventionally, destructive and non-repeatable approaches have been applied in order to examine the rooting habits of plants, such as soil coring [17,18], the use of mini rhizotrons [19] or pots of different sizes, but all of these methods have their limitations. First of all, the root development and turnover cannot be measured throughout the vegetation period within the same plant stand. Recently, various methods have been developed to detect the properties of the belowground biomass. They mainly consist of imaging and an image-processing phase. Another option could be to use impedance spectroscopy; however, only a few parameters of the root system can be determined by this approach. This tool is not suitable for measuring the parameters of the individual roots or for inspecting the depth of the intensive root development during the plant-growth period [20,21]. MRI (Magnetic Resonance Imaging) or CT (X-ray Computed Tomography) technologies are highly sophisticated methodologies, but they are exceedingly expensive and could be applied only in pot experiments [22,23,24]. However, under real field conditions, as well as in a model experiment, root-scanning technology can be efficiently used throughout vegetation. The transparent polycarbonate tubes can be dug or drilled into the soil at different positions and lengths to detect the rooting habits of the plants from germination until harvest. The advantages of this approach are that the measurements can be carried out in the same position and the potential influences of the various environmental factors on the rooting can be excluded [25]. Wheat landraces are better adapted to changing climatic conditions and to stress environments than modern cultivars due to their population’s genetic structure, buffering capacity, and morpho-physiological traits, such as rooting habits conferring adaptability to stress environments [26]. However, even among the recently bred cultivars, there is high variability in terms of abiotic stress tolerance [27,28]. Drought resistance is a complex phenomenon, and it develops through the interaction of various plant properties that are determined by several genes, including dwarfing genes, such as Rht1, Rht2, Rht8, etc. [29]. Using dwarfing genes to reduce plant height increases the harvest index, improves lodging resistance and increases grain yield. Their application has been one of the major strategies in developing modern bread-wheat cultivars [30]. The presence of these genes in modern wheat varieties is necessary because due to the cultivation technology, shorter plants are more resistant to lodging. The presence of the effective dwarfing genes in the genome not only reduces the plant height but also can negatively affect the intensity of the root development [29].
The objectives of the study were (1) to determine the dynamics of root development during the vegetation period of winter-wheat varieties, (2) to examine how plants react through the modification of the root development to the drought stress in the different soil layers, and (3) to quantify the genotypic responses to elevated atmospheric CO2 concentrations through the root development under optimum and limited water availability. The results of the experiments could contribute to the efficiency of plant-breeding activities for improved drought tolerance. Moreover, from a practical point of view, the experiments emphasize that the rooting habits of the different varieties should also be considered by the farmers.

2. Materials and Methods

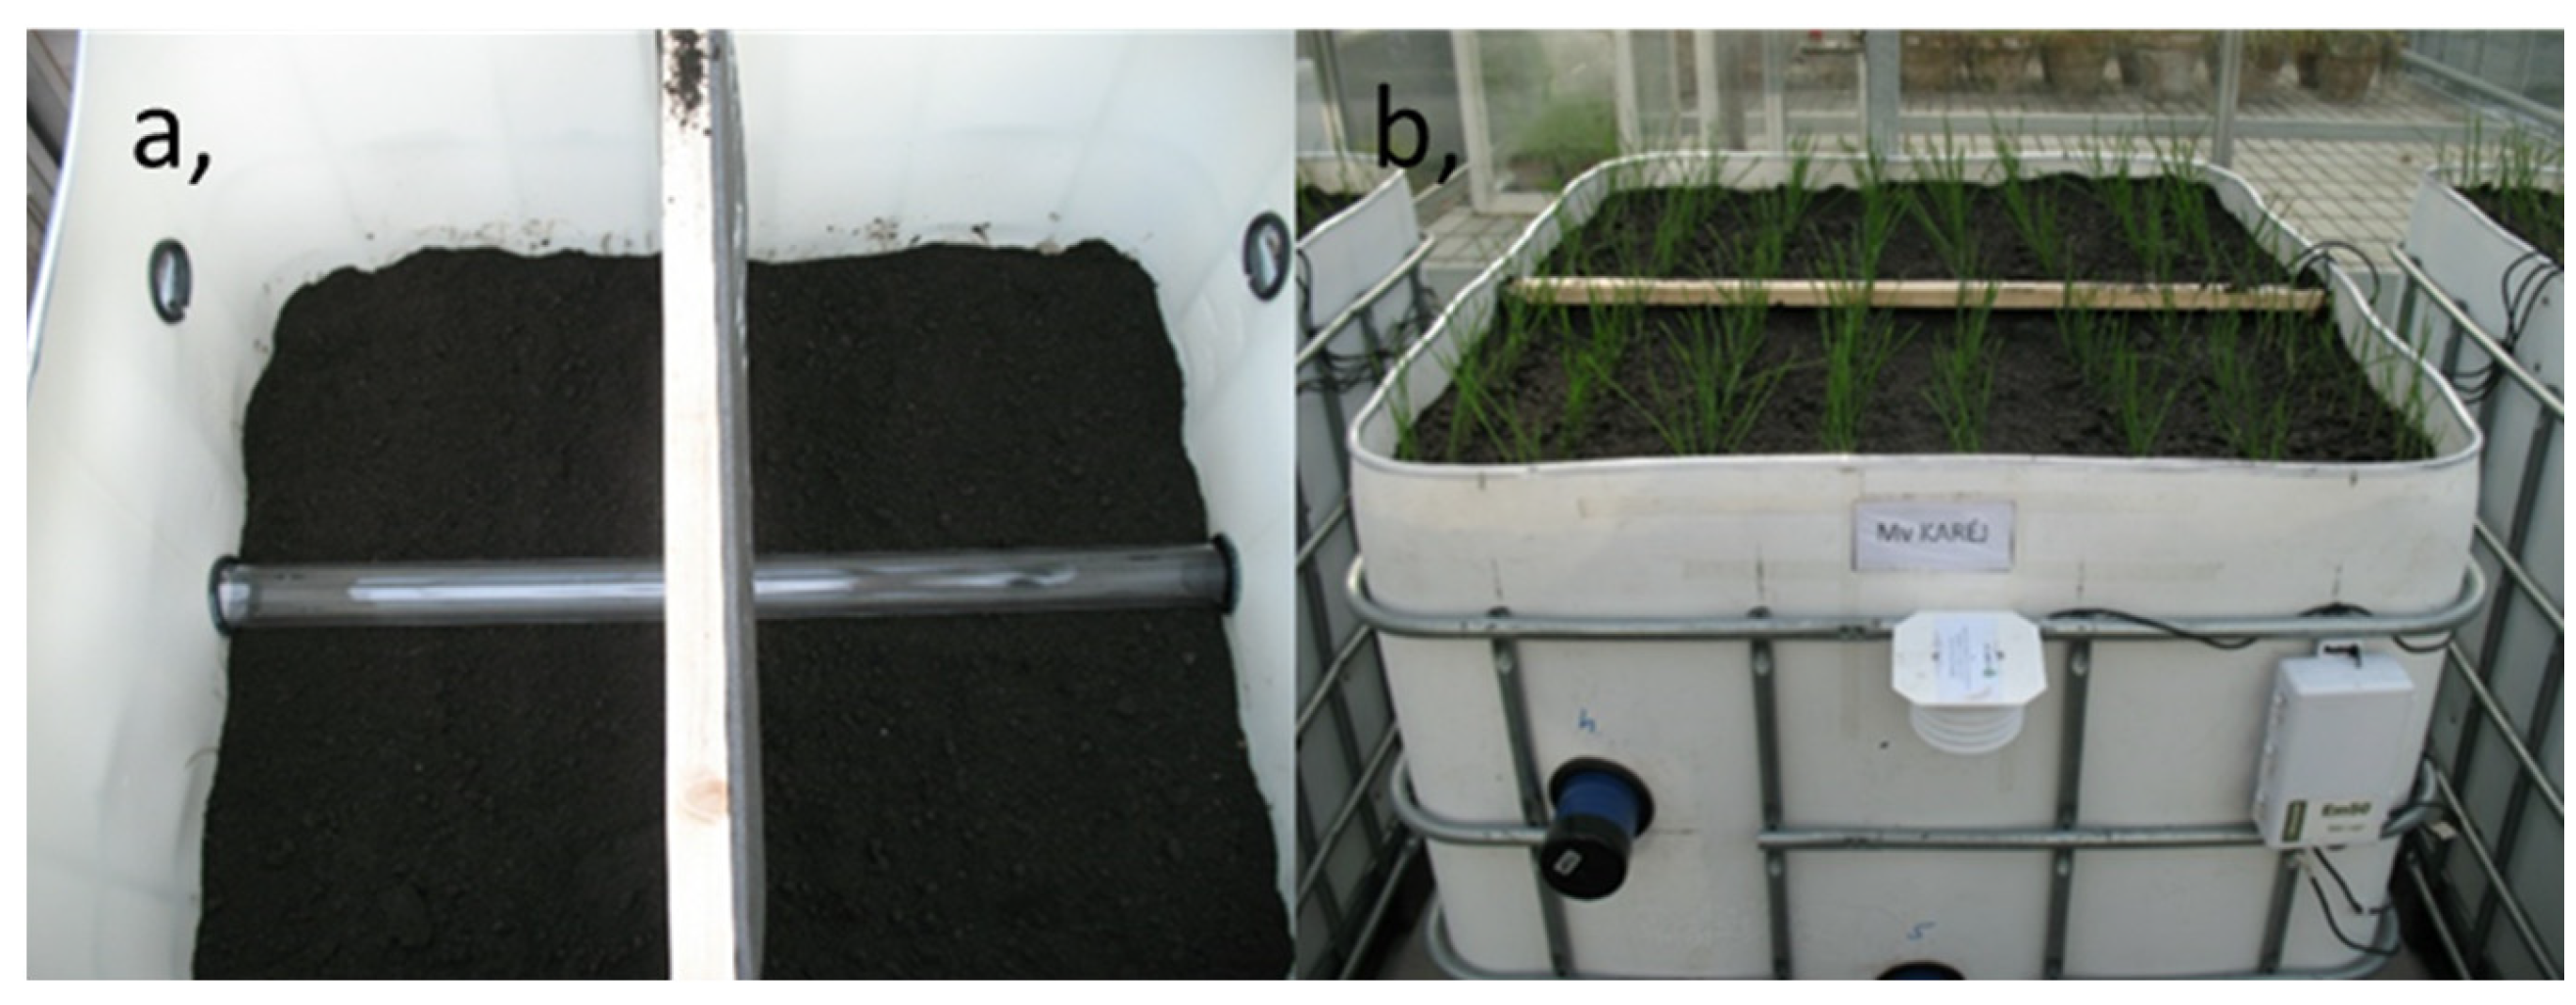
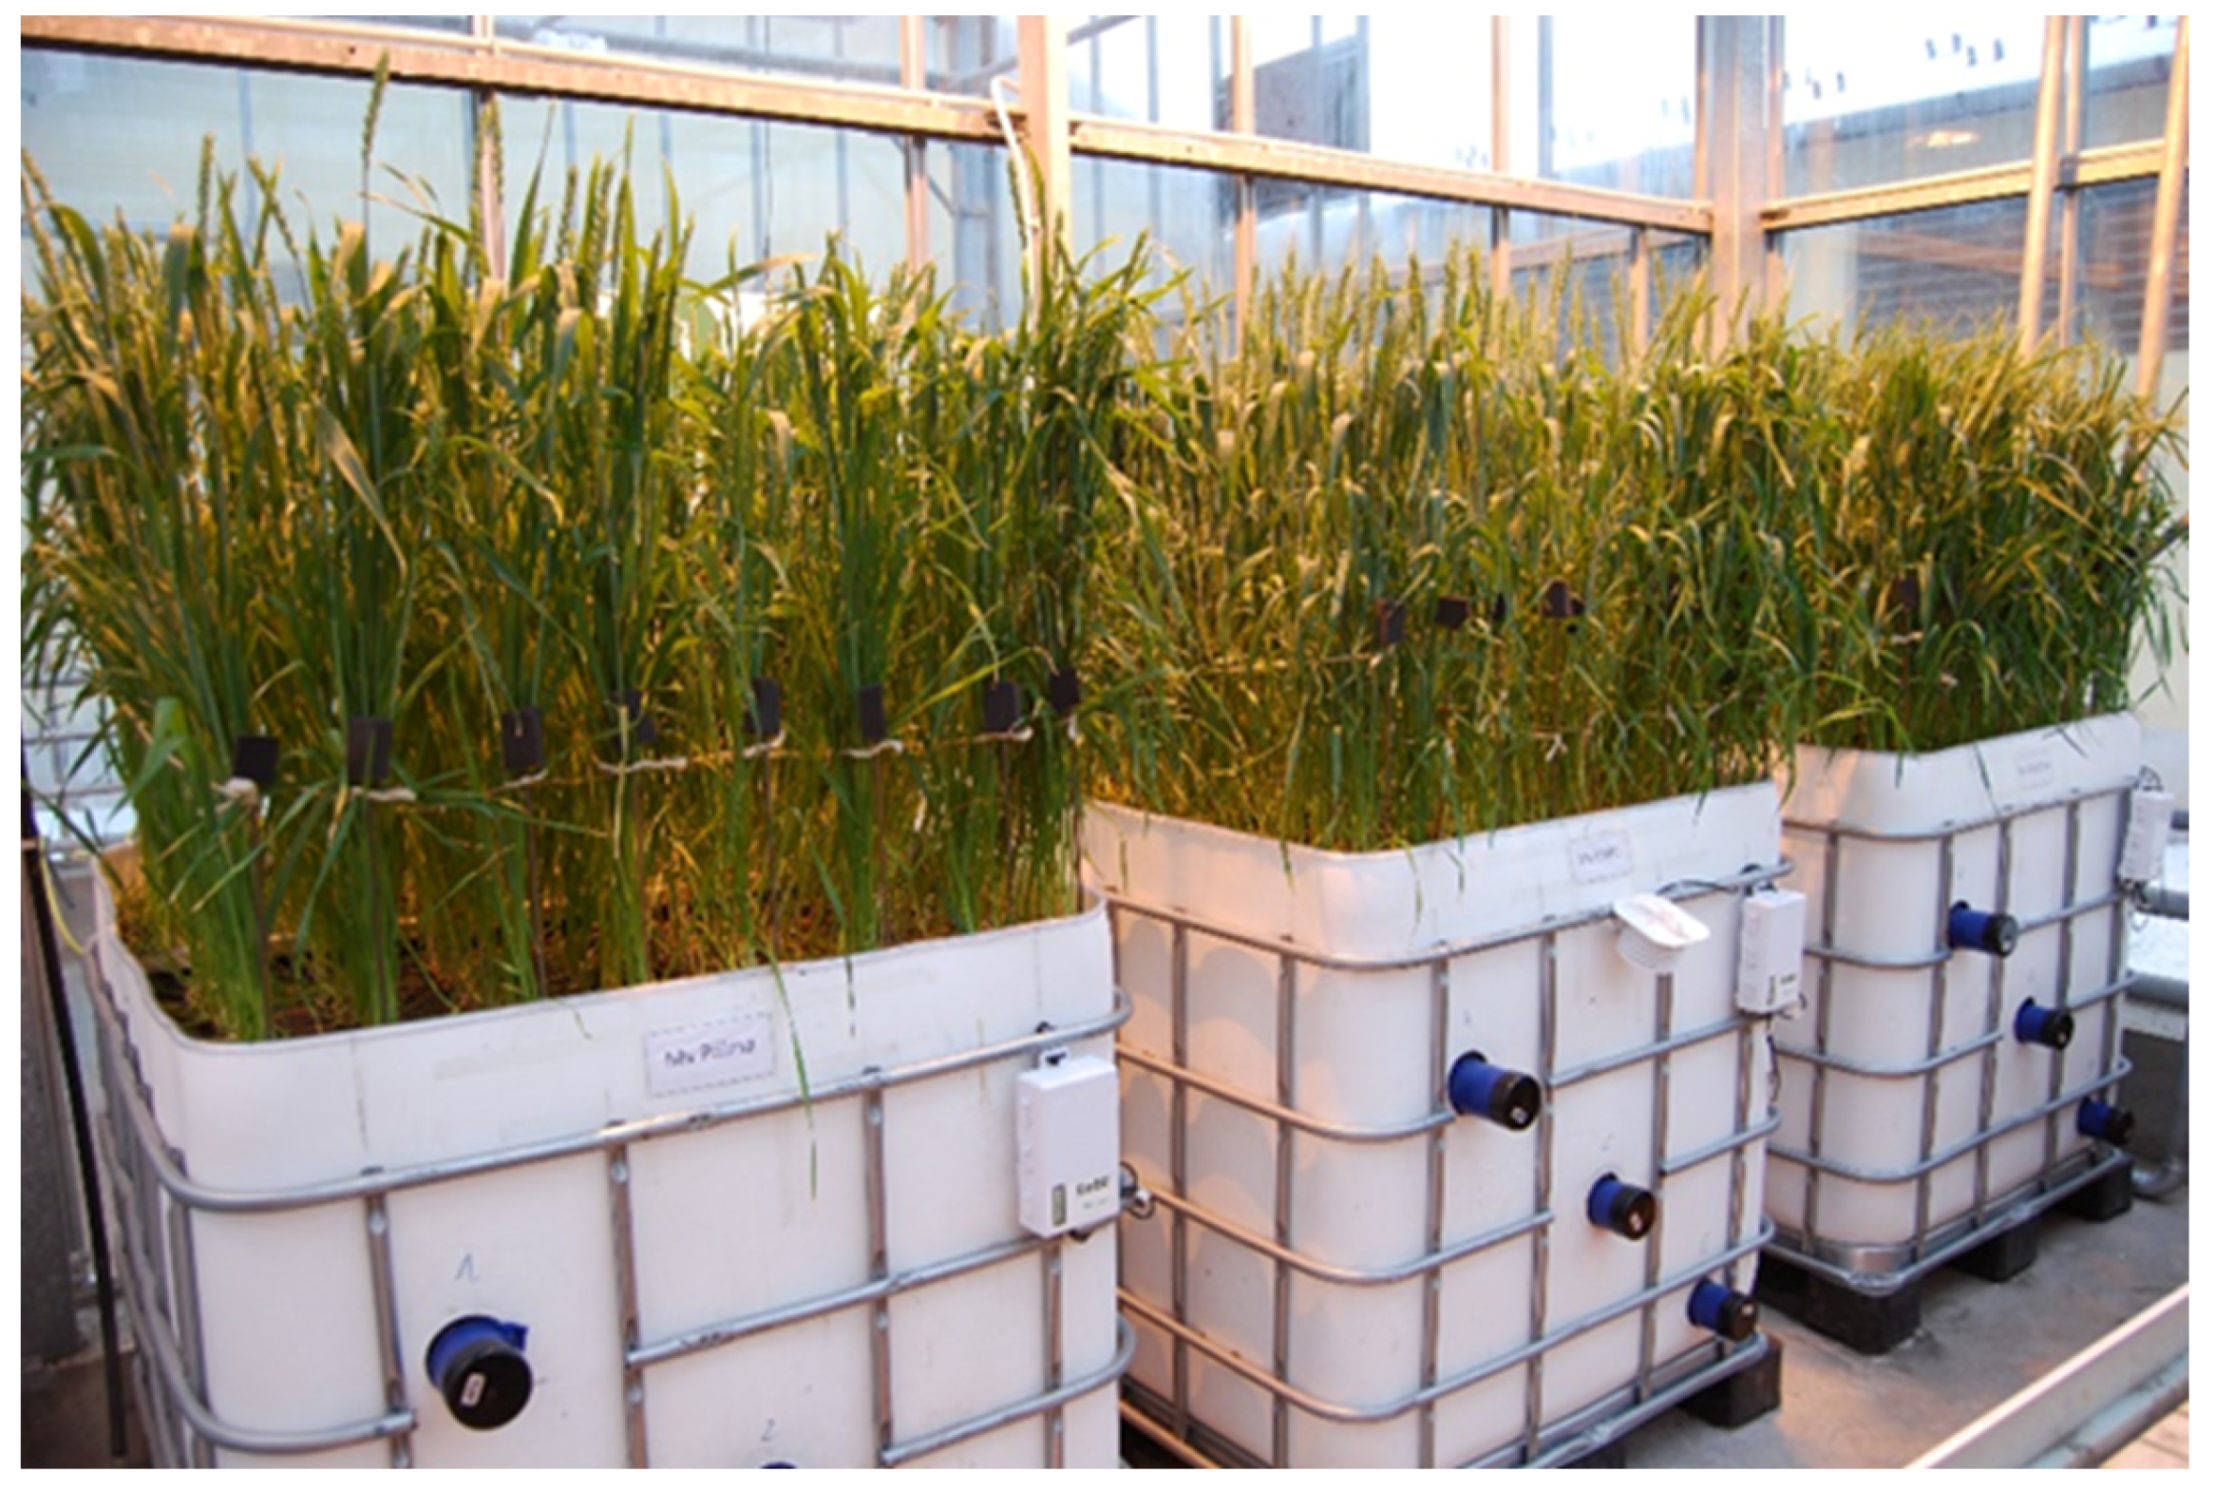
2.1. Experimental Layout
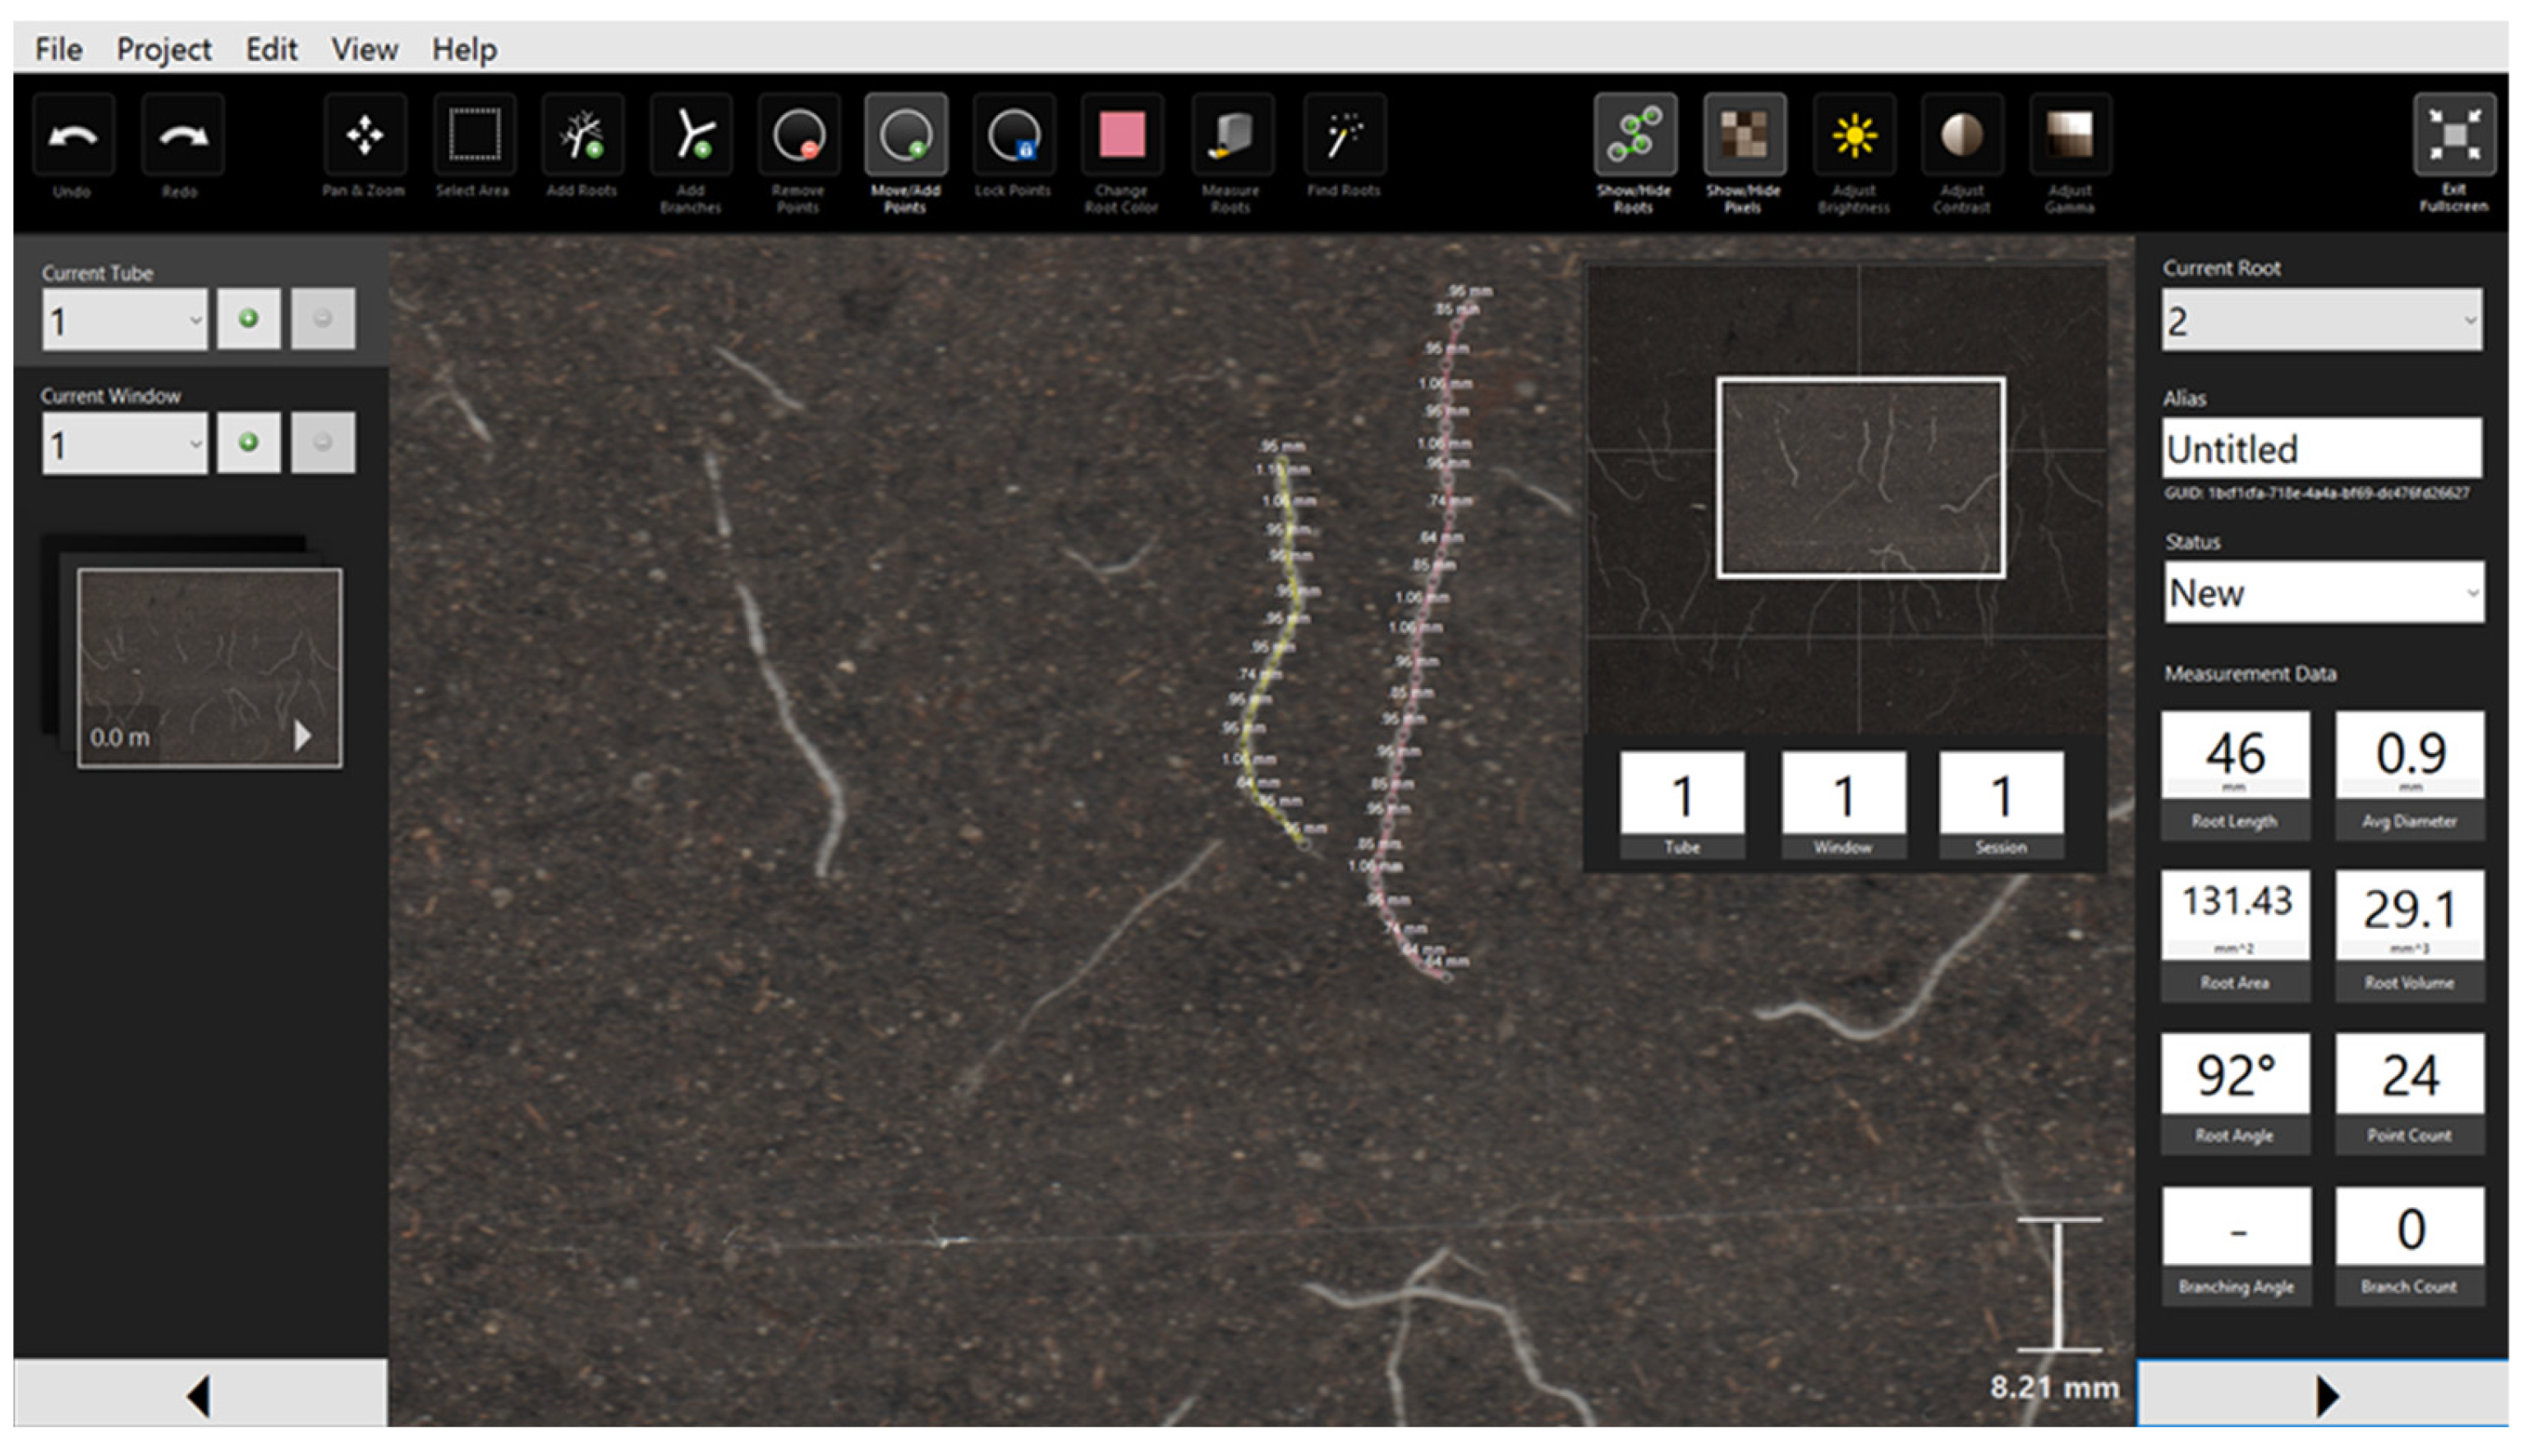
Three registered Hungarian winter-wheat (Triticum aestivum L.) varieties, Mv Pálma, Mv Karéj and Mv Karizma carrying Rht8, Rht1 and Rht2 dwarfing genes (30), respectively, were selected for the model experiment, which was carried out in two similar climate-controlled greenhouse chambers of the Agricultural Institute, Centre for Agricultural Research, Hungary. Plants were vernalized at 4 °C for 6 weeks and the germinated seeds were planted into plastic containers (120 cm× 90 cm × 100 cm) filled with ca. 1000 liters of a 3:1:1 (v/v) mixture of soil, sand and humus. Water-soluble fertilizer (14% N, 7% P2O5, 21% K2O, 1% Mg, 1% B, Cu, Mn, Fe, Zn; Volldünger Classic; Kwizda Agro Ltd., Vienna, Austria) was added bi-weekly to both water treatments based on the manufacturer’s recommendations. Plant density was 450 plants/m2, which is similar to the commonly applied sowing rate in local agricultural practice (Figure 1b and Figure 2). Each container consisted of 8 rows and each row of 28 plants.
The air temperature and the additional light intensity of the greenhouse chambers were automatically regulated. The air temperature was increased from the initial 10–12 °C to 24–26 °C over 16 weeks, while air humidity was maintained between 60% and 80% and was regulated by ventilating the greenhouse chambers’ air [31]. Whenever it was necessary, the natural-light intensity was enhanced by artificial illumination to 500 μmol m−2 s−1 at the beginning of the vegetation period, which was gradually increased to 700 μmol m−2 s−1. Thiovit Jet fungicide (Syngenta AG, Basel, Switzerland) (active ingredient: sulfur) and Karate 2.5 WG insecticide (Syngenta AG, Basel, Switzerland) (active ingredient: lambda-cyhalothrin) were applied two times (BBCH 23 and 37) [32] following the distributor’s recommendations by the dosage against powdery mildew and aphids, respectively. The atmospheric CO2 concentration in the control (ambient) chamber was maintained at ~400 ppm and the gas concentration was enhanced to 750 ppm in the other chamber by using a network of perforated pipes placed at a height of 0.5 m above the plants. The uniform distribution was achieved through ventilation.
The containers were separated into two parts of equal size (optimum watered and drought-stressed) by using water-insulating PVC foil (thickness 1 mm).
The water-holding capacity of the soil was determined by using the gravimetric method before starting the experiment and the control treatments were watered until optimum (60%) soil-water content [SWC]. The water content of the soil was monitored by 5 TA sensors (Decagon Devices Ltd., Pullman, WA, USA) at 3 depths (30, 60 and 90 cm). Water-stressed plants did not receive additional watering after the planting until the volumetric soil-water content dropped below 8–10% (average of the three depths). The plants in the drought-stress treatment were irrigated first at the BBCH 51 stage, 68 days after the planting. Afterwards, halved water doses compared to the control were applied to the stress-treated stands.

2.2. Measurements

Without overlapping, three transparent polycarbonate tubes were set up in the containers in a horizontal position, at 30, 60 and 90 cm soil depths (Figure 1a). The root development/turnover was monitored every two weeks in the same positions of the tubes by a CI-600 in situ root imager (CID-Bioscience Ltd., Camas, WA, USA). The plant phenophases were ranked according to the BBCH scale (Table 1) [32].
RootSnap software (CID-Bioscience Ltd., Camas, WA, USA) was applied for image processing and to determine the root length (Figure 3). Simultaneously, soil temperature and soil-water content were monitored continuously in the three layers by 5 TE sensors and EM50 data loggers (Decagon Devices Ltd., Pullman, WA, USA).
At the end of the vegetation period, all plants were manually harvested row by row (8 replications). The weight of the total aboveground biomass, grain weight and thousand-kernel weight was measured by a digital balance (ME 1002E, Mettler-Toledo Ltd., Worthington, OH, USA), and the harvest index (Equation (1)) was calculated.
Harvest   index = grain   yield   ( g ) total   aboveground   biomass   ( g ) 100
Relative changes in the root length in response to elevated carbon dioxide levels were calculated as:
CO 2   responses = Ex A
where A is the root length at the 400 ppm CO2 level, Ex is the root length at the 700 ppm CO2 level.

2.3. Analysis

The experimental design (2 × 2 × 3) consisted of two CO2 levels, two watering levels and three genotypes. The rooting habits of a closed plant stand were analyzed. The scanning was always carried out in three replications in the same position. The effects of the tested factors on yield parameters were determined by multi-way ANOVA and means were compared by Tukey’s HSD test (p ≤ 0.05). The significant differences in the length parameters between the water treatments and CO2 levels were evaluated by Student’s t-test and the significant differences between the root lengths measured in the plant growth stages were analyzed by one-way ANOVA followed by Tukey’s HSD test.

3. Results

3.1. Effects of Water Shortage and Elevated Atmospheric CO2 Concentration on Yield Parameters

The biomass (BM), grain yield (GY), thousand-kernel weight (TKW) and harvest index (HI) of the individual treatments are summarized in Table 2.
The ANOVA shows that the effects of the watering levels, genotypes and the CO2 concentrations significantly influenced the grain yield, but their interactions were not statistically significant. The effects of the watering and the genotypes were significant on the aboveground biomass, but the ANOVA shows that the interactions of the factors remained insignificant (Tables S1 and S2). Different CO2 levels and irrigation regimes were assumed to have contradictory effects on the yield-related parameters. Water shortage resulted in decreased BM and GY both under ambient and elevated CO2 concentrations. The ratio of the yield reduction did not differ between the two CO2 concentrations. Compared to the well-watered plant stands, the biomass of Mv Pálma and Mv Karéj decreased by 8.02% and 10.03% under ambient CO2 concentration and 11.2% and 10.45% under elevated CO2, respectively, in the drought-stress treatment (Table 2).
Generally, the simulated drought stress did not significantly affect the TKW and the HI, but the effects of the genotypes and watering levels were statistically significant in terms of both parameters (Tables S3 and S4). In the case of Mv Pálma, water shortage led to a 12.75% and 13.75% increase in TKW compared with the non-stressed controls under 400 ppm and 750 ppm CO2 concentration, respectively. The highest yielding capacity was observed for Mv Karizma, and this genotype showed the lowest yield reduction under the simulated drought stress. In Mv Karizma, the elevated CO2 concentration played a role in counterbalancing the negative effects of the water shortage. Taking the average of the three examined varieties, the CO2 enrichment increased the biomass (by 4.57% and 4.97% under normal watering and drought stress, respectively) as well as the grain yield (by 8.1% and 8.96% under normal watering and drought stress, respectively) (Table 2). Improved harvest indices (4.3% and 4.0% under normal watering and drought-stress conditions, respectively) could be determined as a result of the observed tendencies in biomass and grain weight, which would be highly favorable for nutrient- and water-utilization efficiency. In Mv Karéj, no differences were observed between the two water treatments in terms of CO2 reactions. The interaction of water shortage and CO2 fertilization showed opposite tendencies in the other two varieties. The increase in the yield parameters was more intense under the control water supply in Mv Pálma, while the positive effect of the elevated CO2 compared with the control was more significant under drought-stress conditions in Mv Karizma (Table 2).

3.2. Dynamics of the Root Development of Winter-Wheat Varieties under Optimum Watering and Drought-Stressed Conditions Grown at Ambient and Elevated CO2 Concentrations

Under ambient CO2 concentration, the root length of Mv Pálma continuously developed in the well-watered treatment after planting until it reached its maximum level at the BBCH 51 stage in the two upper soil layers (30 and 60 cm), while a faster root development was detected in the drought-stressed treatment when the root length did not significantly increase after the BBCH 29 and BBCH 37 stages at 30 and 60 cm, respectively. (Table 3). Significantly higher root length was observed at 30 cm between the BBCH 29 and 51 stages under drought-stressed conditions, but the root length did not significantly differ between the water treatment at 60 cm except at the BBCH 21 and 83 stages. At 90 cm, the root length of Mv Pálma reached its maximum (does not significantly increase further) at BBCH 69 under optimum irrigation and at BBCH 51 under drought-stressed conditions, and significantly higher root length was measured under drought stress between BBCH 37 and BBCH 83 than in the control treatment (Table 2). Under elevated CO2, the root length of Mv Pálma was consequently higher in the well-irrigated treatment at 30 cm between BBCH 21 and BBCH 77 than under drought stress (Table 3). The root length did not significantly increase at 30 or 90 cm after the BBCH 37 stage, but at 60 cm, the root length did not significantly increase after the BBCH 29 stage under drought-stressed conditions.
Under ambient CO2 concentration, the root length of Mv Karéj reached its maximum in the upper soil layer (30 cm) at the BBCH 29 stage in both water treatments, and the root length was significantly higher under optimum watering at BBCH 51 and BBCH 77 than in the drought-stressed treatment (Table 4). In the middle layer (60 cm), the root length did not significantly increase after BBCH 37 and BBCH 29 in the control and drought-stressed treatments, respectively, and a significant difference between the water treatments can be observed only at the BBCH 29 phenophase. In Mv Karéj, the maximum root length was observed at the BBCH 51 stage at 90 cm in both water treatments, but significantly higher values were measured under drought-stressed conditions from BBCH 37 compared to the control treatment.
Under 750 ppm CO2, the root length of Mv Karéj reached its maximum at the BBCH 37 stage at each soil layer under optimum and drought-stressed conditions. No significant differences were observed between the water treatments at the 30 cm soil layer after the BBCH 21 stage, but the CO2 enrichment resulted in a significant decrease in root length in each phenophase at 60 and 90 cm (Table 4).
The root development of Mv Karizma showed the highest variability among the studied varieties under ambient CO2 concentration in different soil layers and irrigation regimes. Intensive root development was observed from planting until the BBCH 29 stage at 30 cm, but the root length did not increase further during vegetation. Oppositely, a significant reduction in root length was determined from the BBCH 69 stage (Table 5). The root length at 30 cm was significantly higher under optimum watering than under drought stress in each phenophase. At 60 cm, the root-length development was faster under drought-stress conditions than under optimum irrigation, and the measured data did not significantly increase after BBCH 37 and BBCH 51 under drought stress and optimum watering, respectively. The water shortage induced a significantly more developed root system in Mv Karizma for each phenophase at 60 cm (Table 5). The root system developed intensively until the BBCH 51 stage at 90 cm under both watering regimes, then a root turnover can be observed in the BBCH 69 and 77 stages, but another intensive root formation was detected at the BBCH 83 stage. Significantly higher root-length values were measured in Mv Karizma under drought-stressed conditions at 90 cm than in the control treatment from BBCH 29 until BBCH 83, except BBCH 37 at 400 ppm CO2 concentration. Under elevated CO2 levels (750 ppm), a delay can be observed at 30 cm in the time that the root length takes to reach its maximum compared to the ambient treatment. The maximum values were observed at the BBCH 37 stage in both water treatments. The water supply had no significant effects on the root length of Mv Karizma during vegetation at 30 cm under 750 ppm CO2 between the BBCH29 and BBCH77 stages. At 60 cm, the highest root length was observed at the end of vegetation under optimum watering, while the highest data were measured at the BBCH 37 and BBCH 51 stages under limited water supply. The water shortage induced a significant increase in root length in each phenophase of Mv Karizma under CO2 enrichment. The trends in root development at 90 cm were similar to that at 60 cm, and the water shortage resulted in an increase in root length between the BBCH 37 and BBCH 77 stages (Table 5).

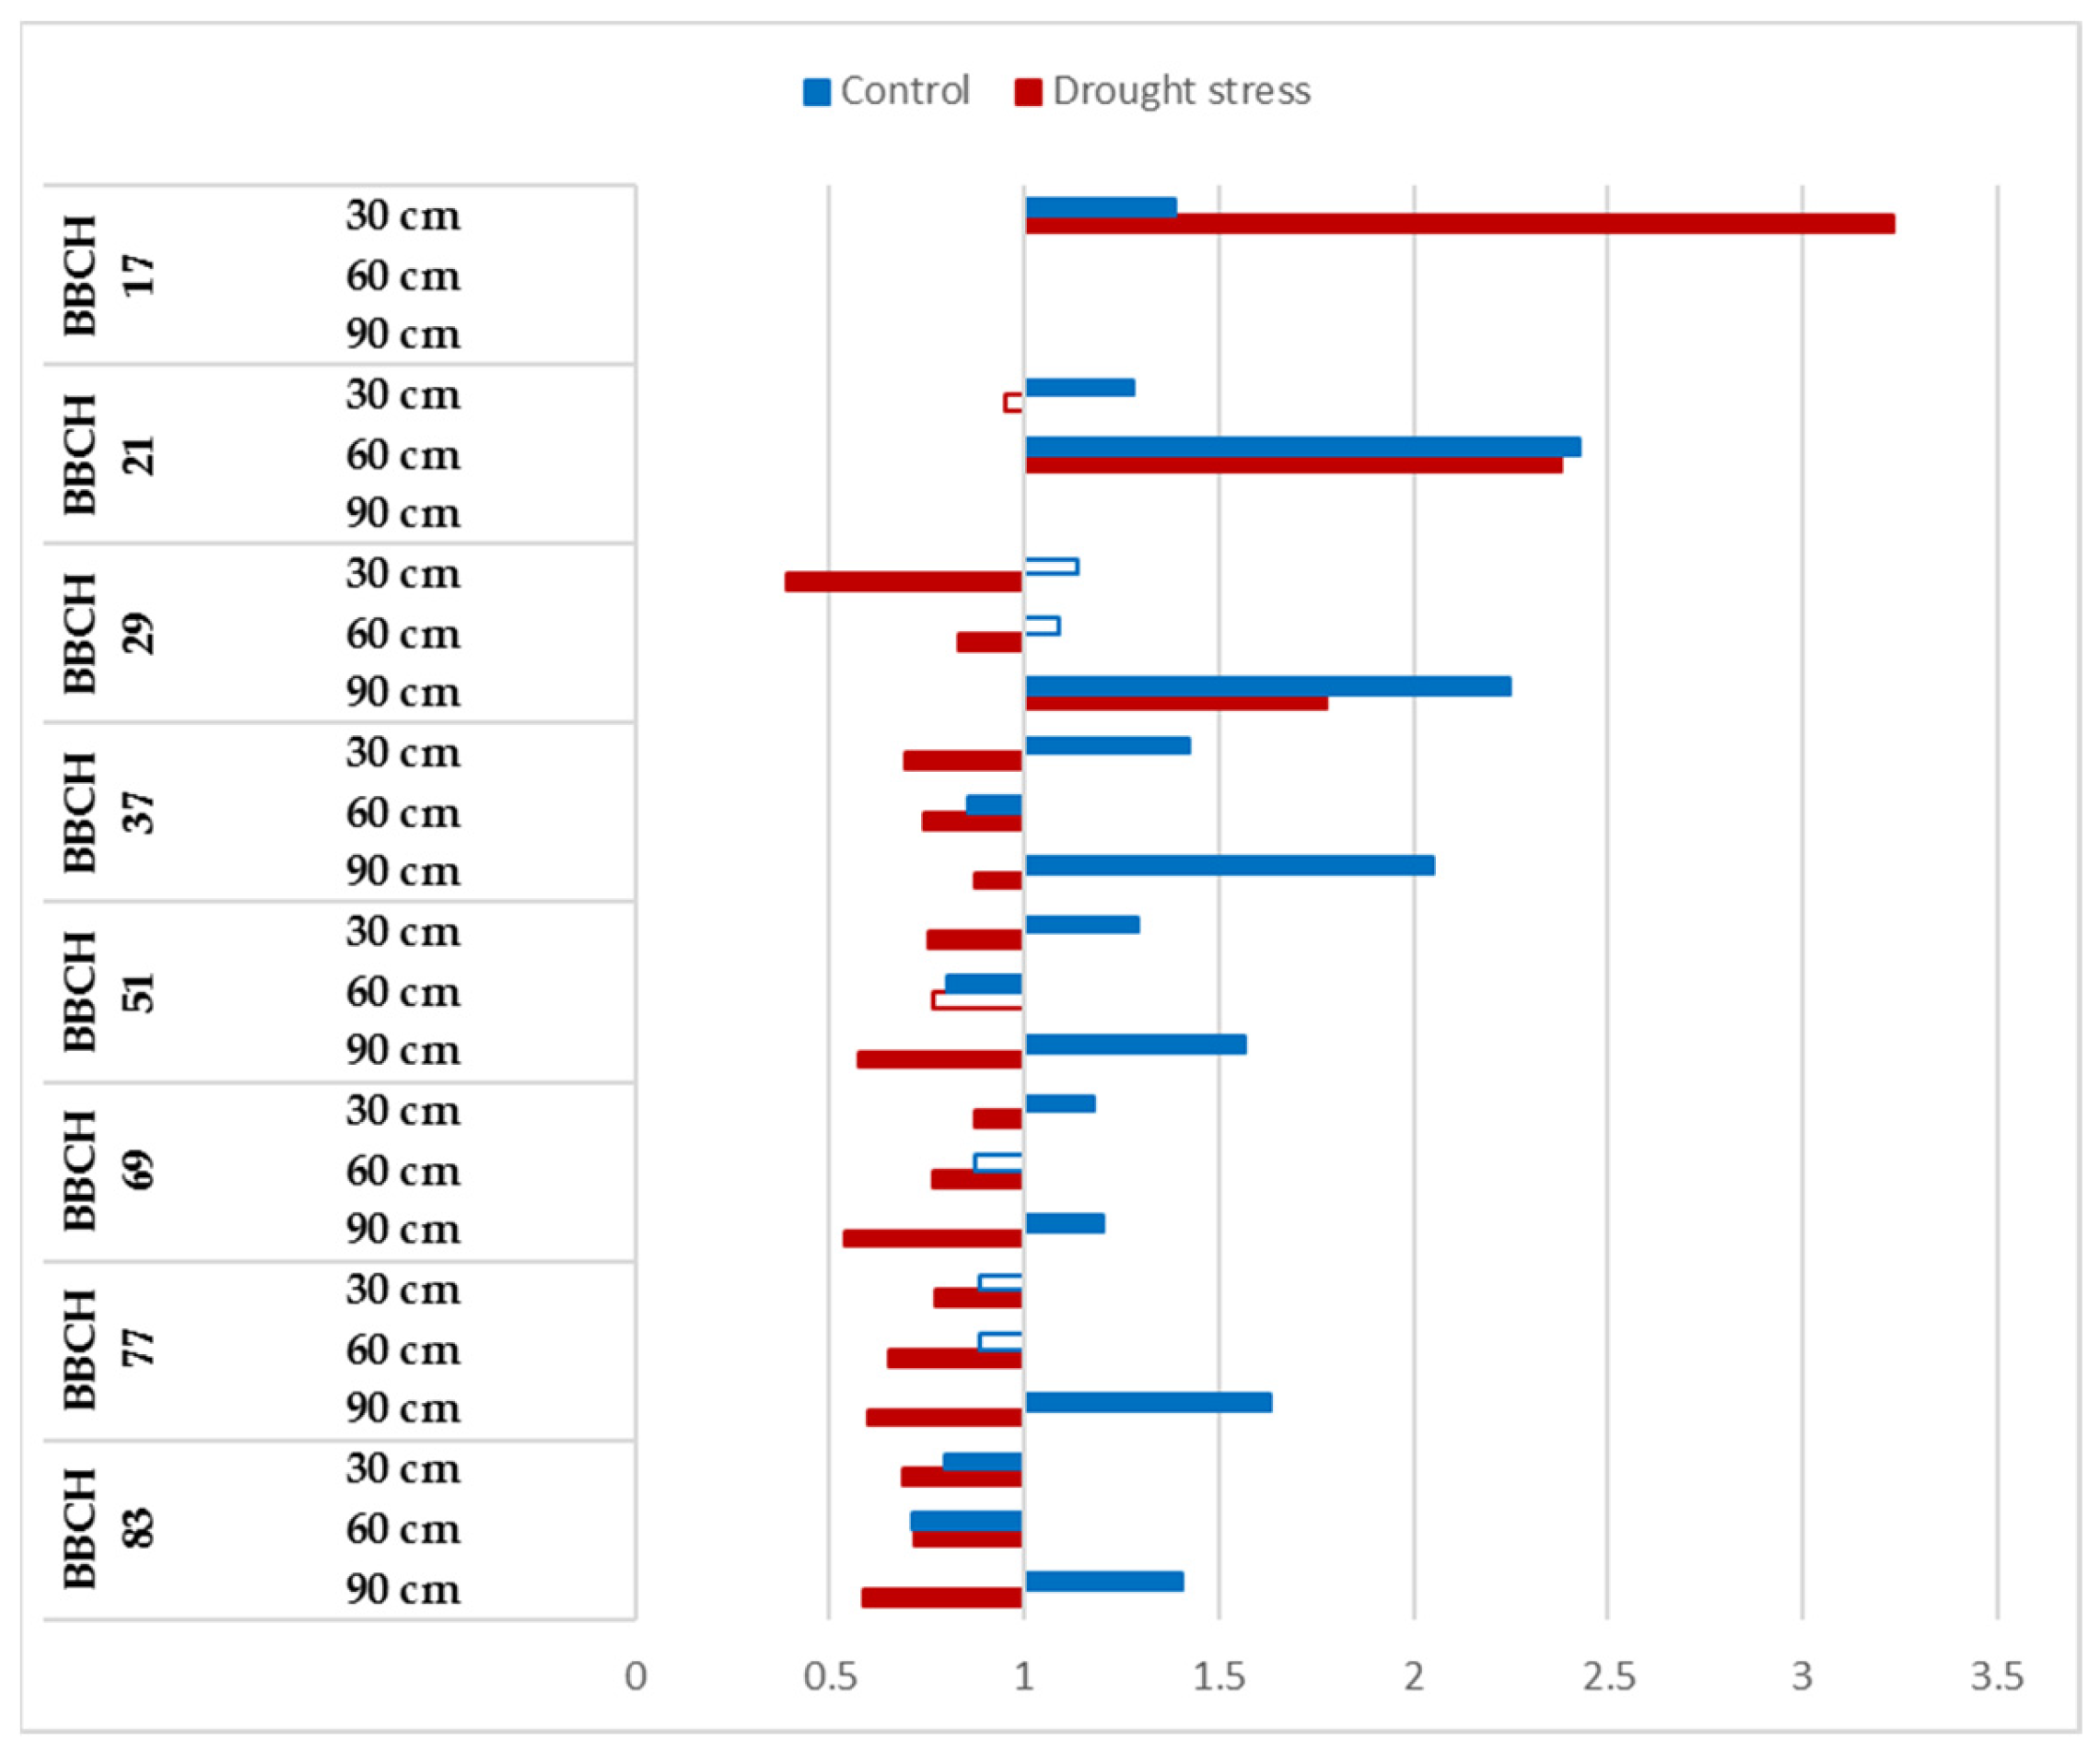
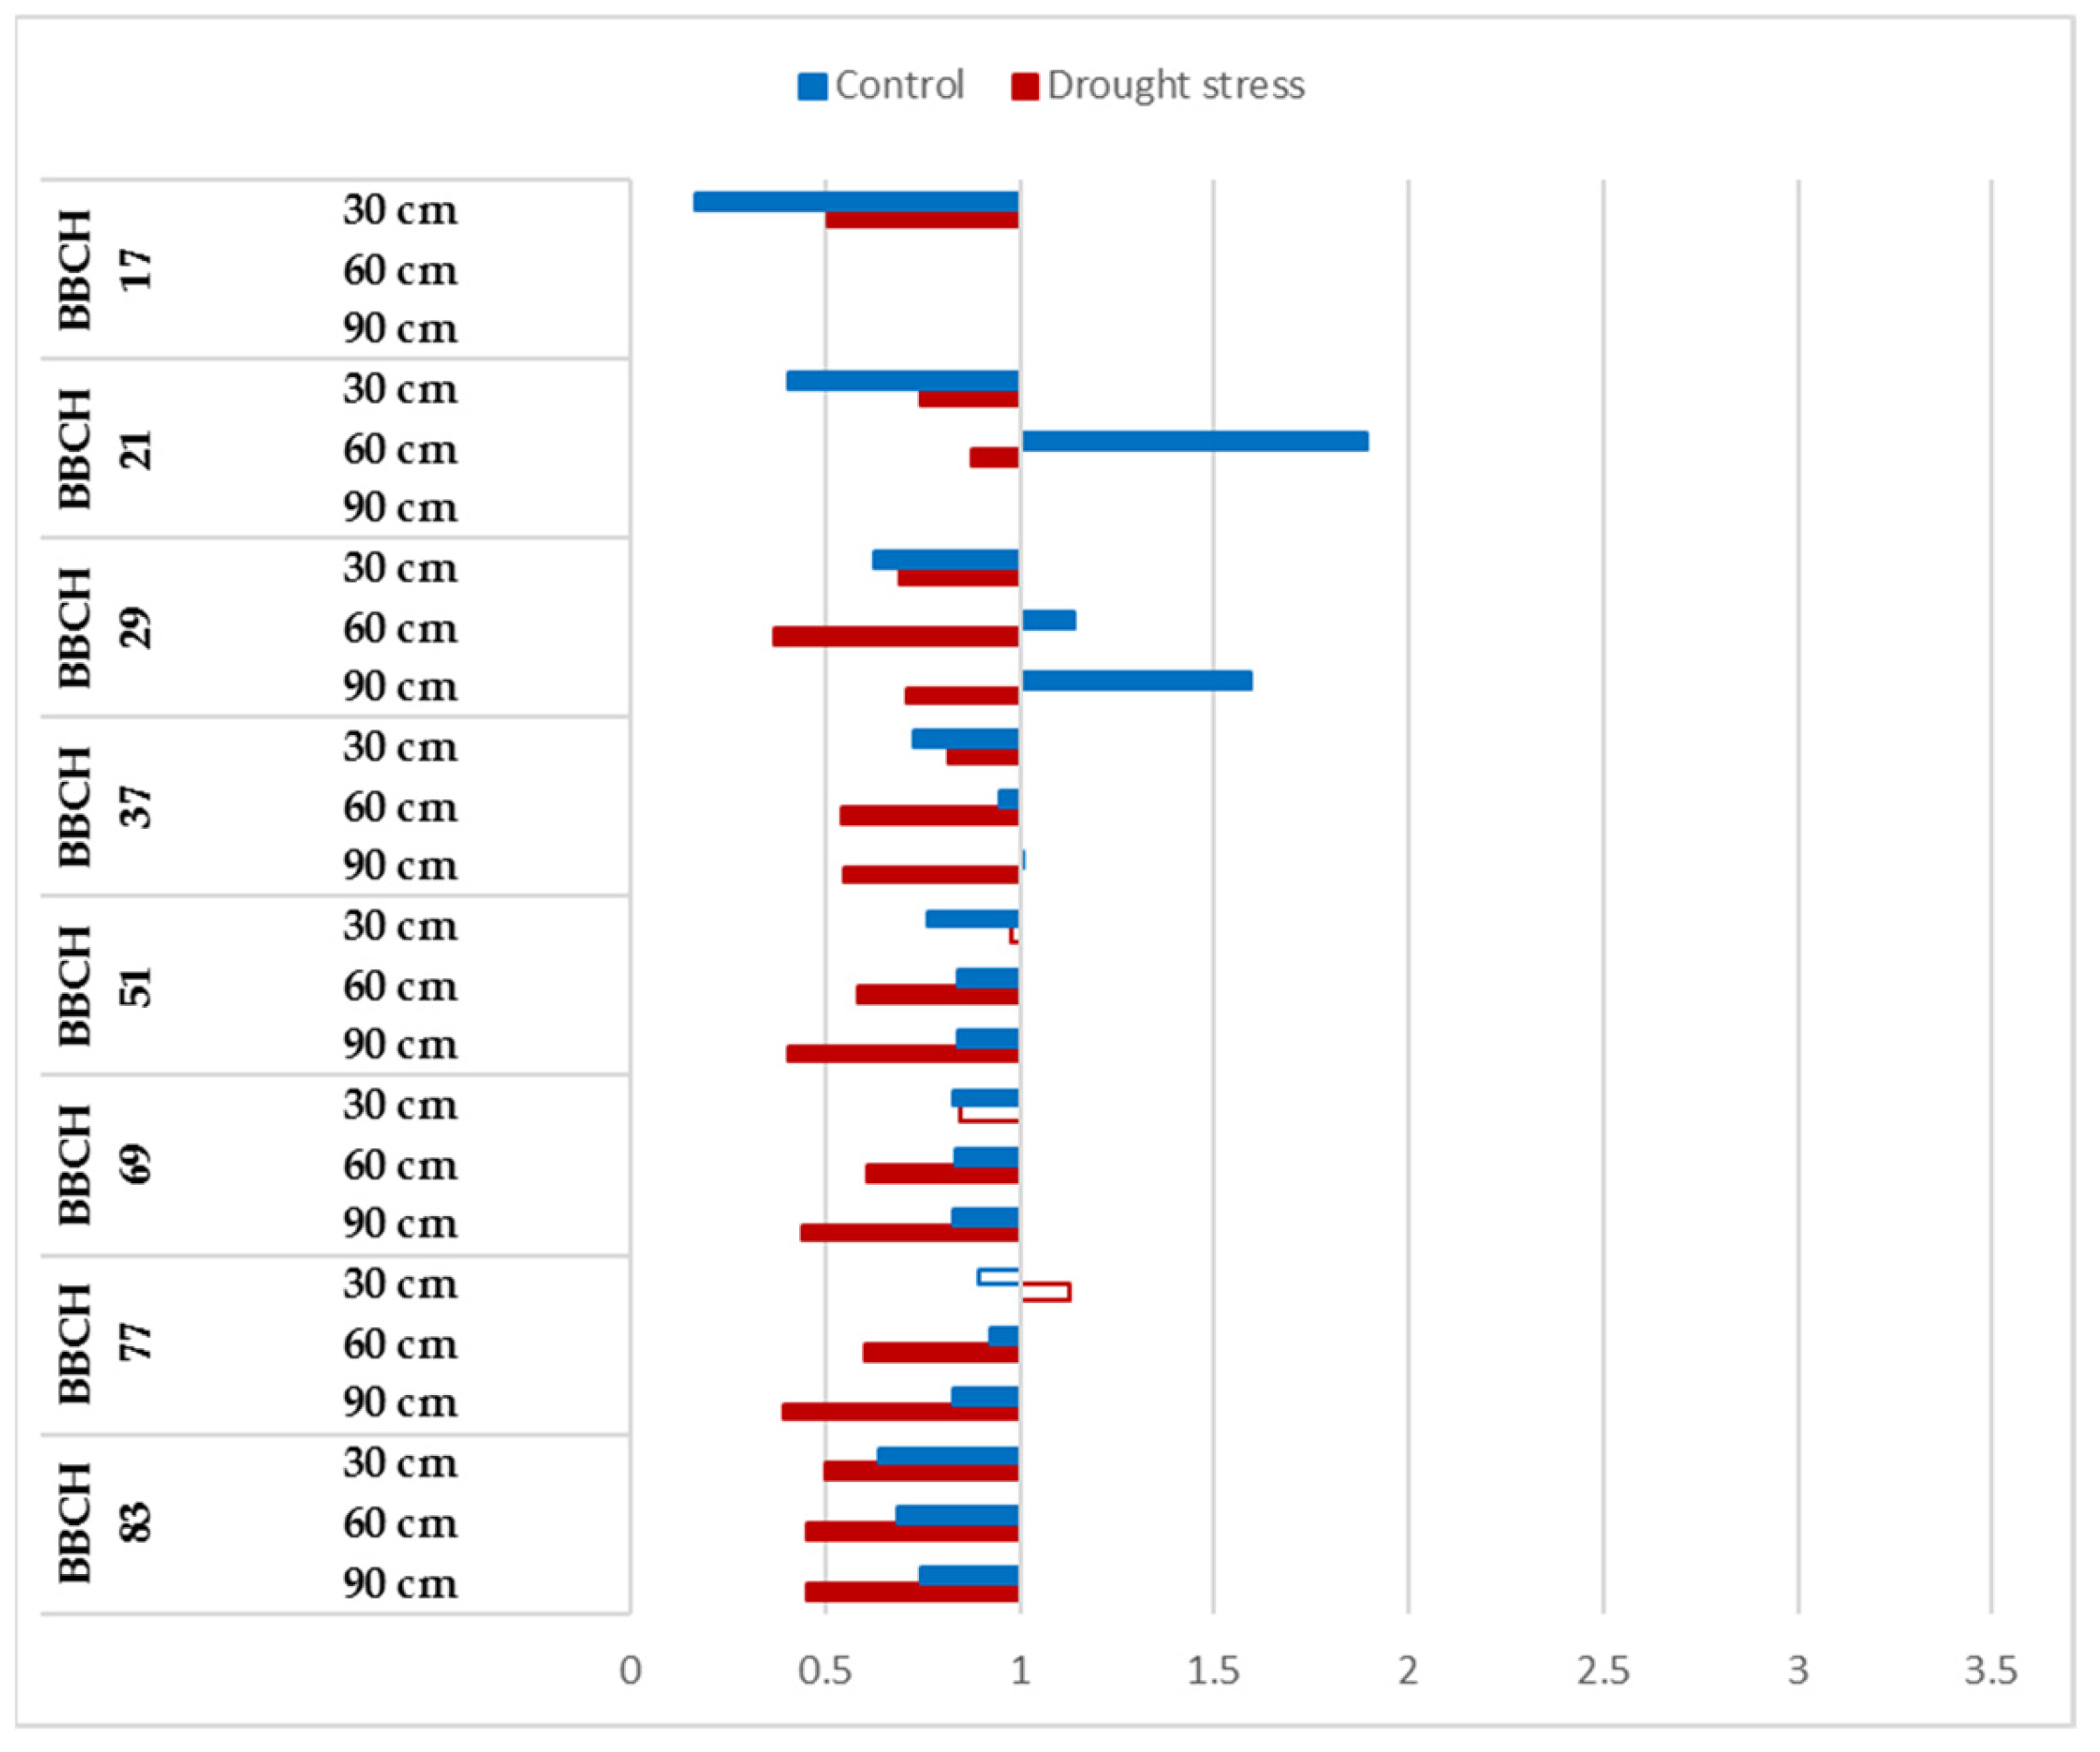
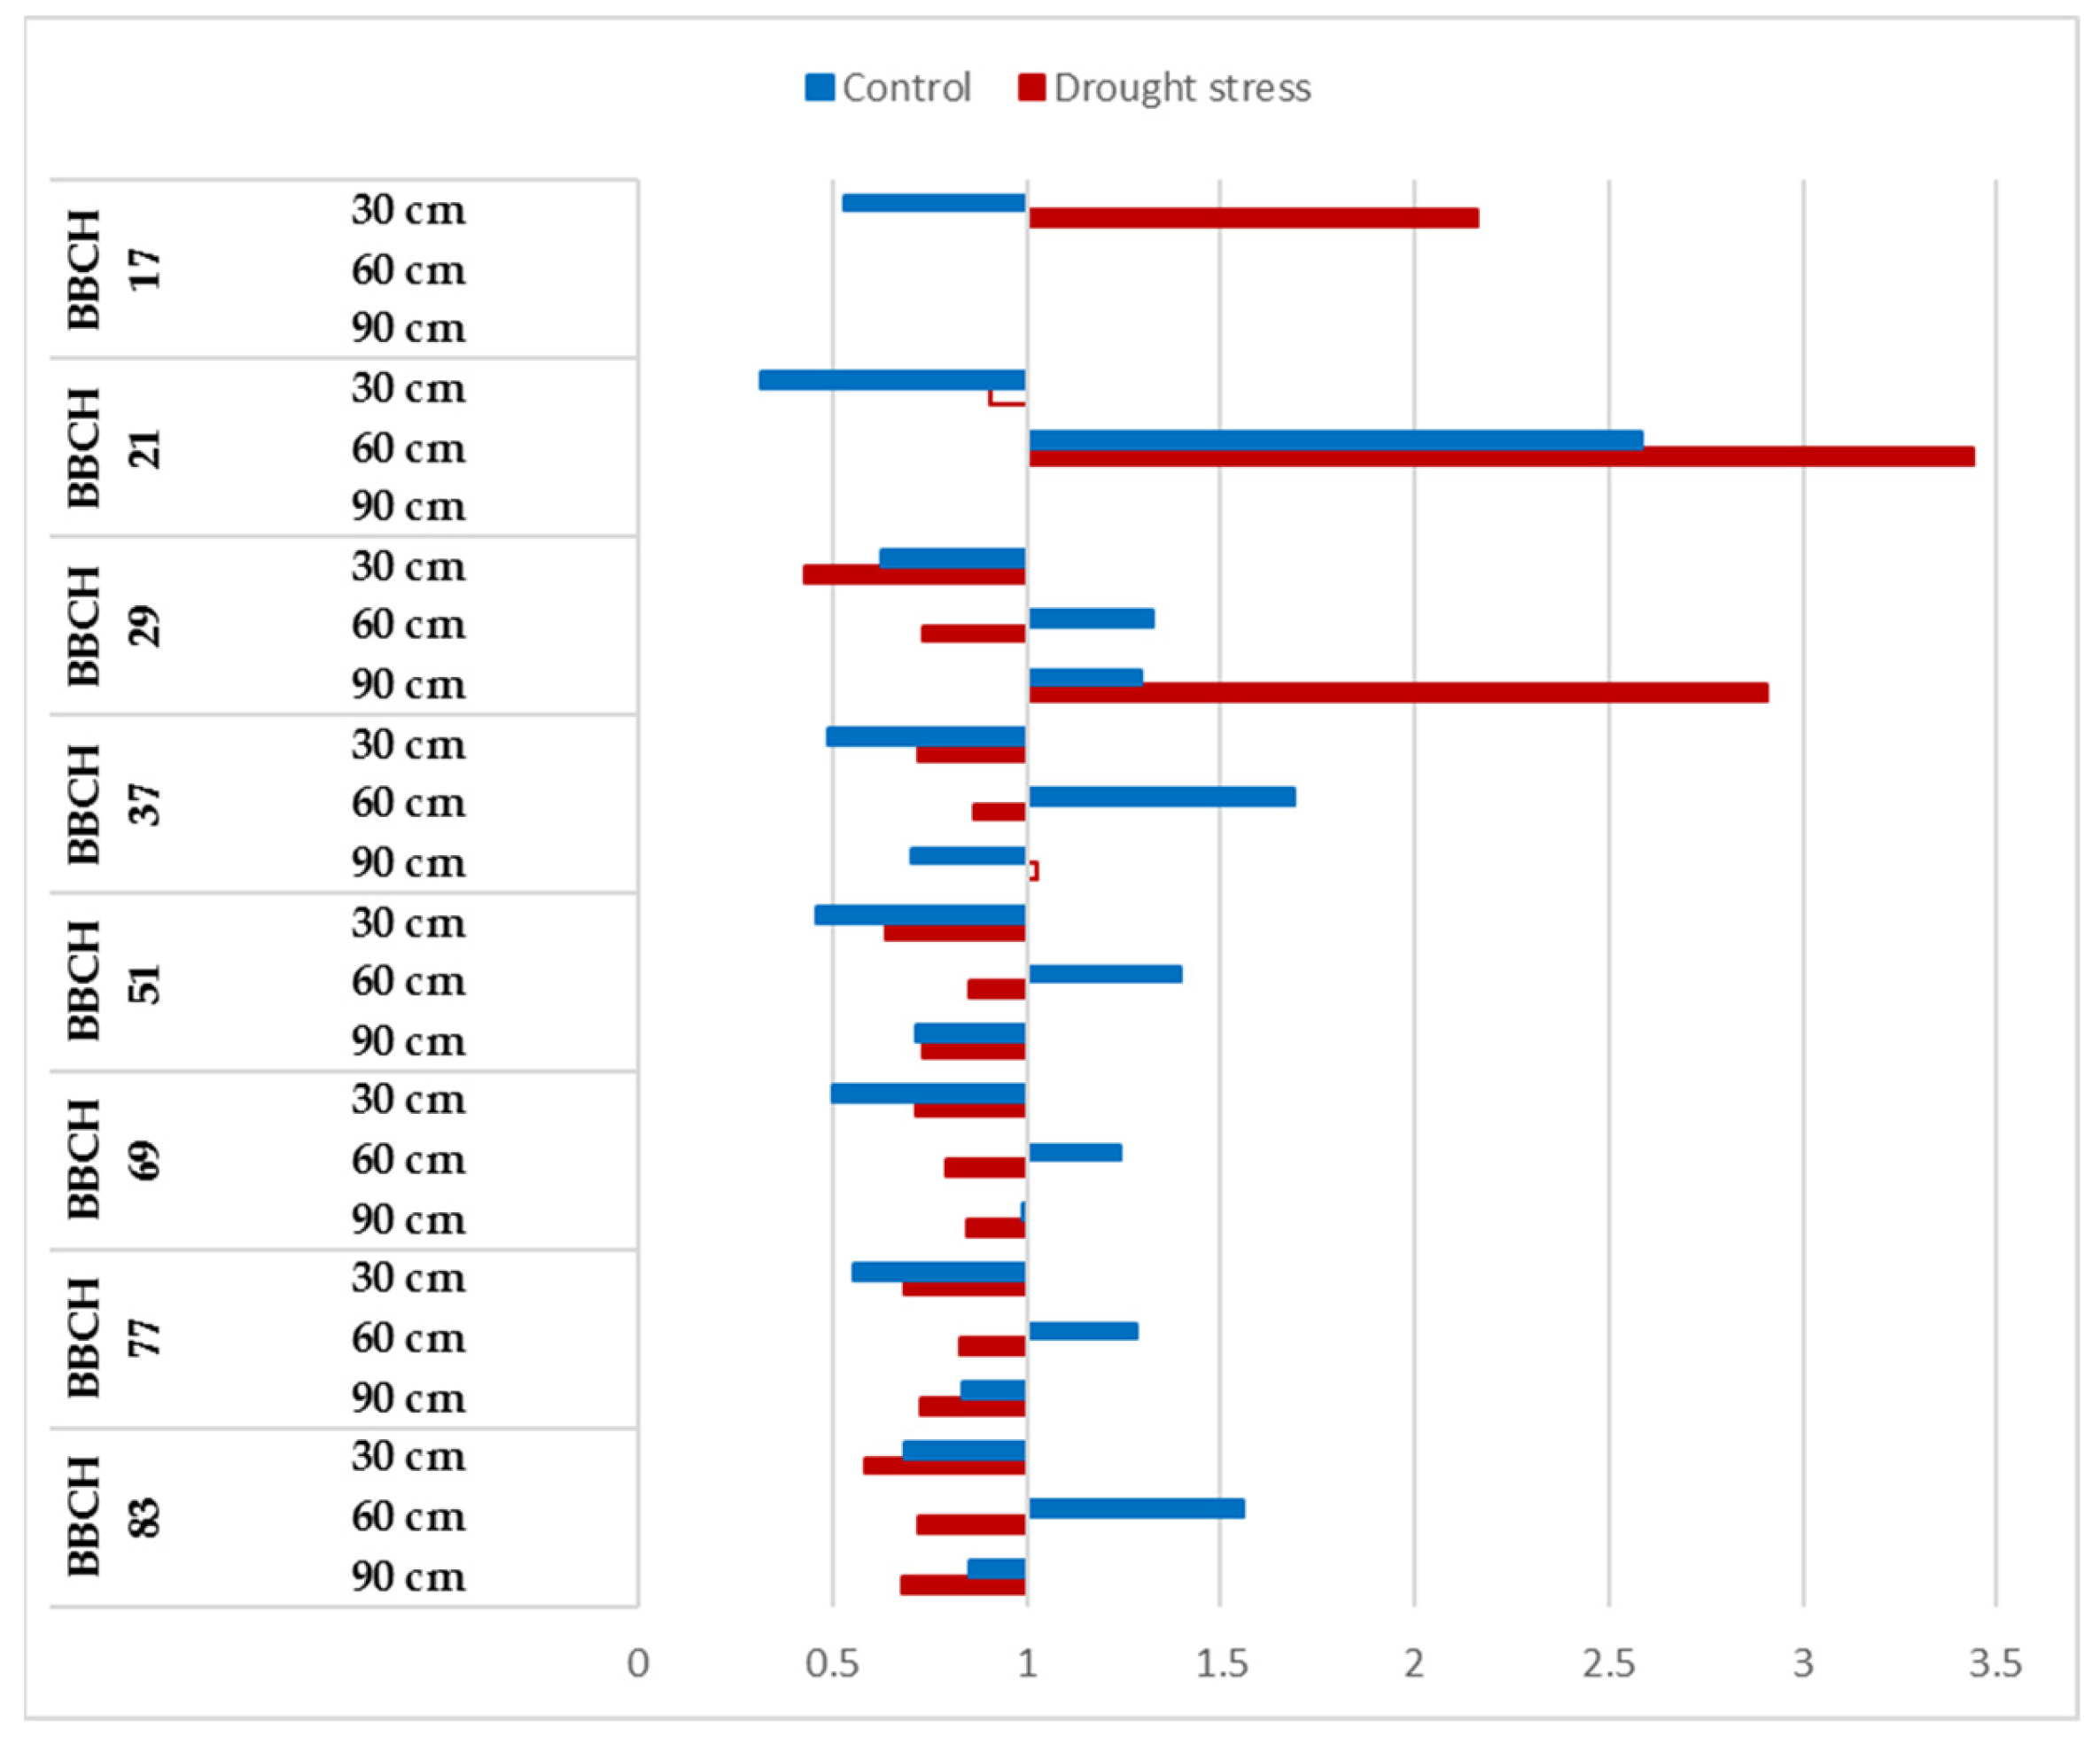
3.3. CO2 Reactions of Winter-Wheat Genotypes during Vegetation at Different Soil Layers under Well-Watered and Drought-Stressed Conditions

The responses of Mv Pálma to the elevated CO2 showed a variability during the vegetation period and significant alterations were determined between the well-watered and drought-stressed treatments (Figure 4). The CO2 response was positive and significant from the sowing until the BBCH 21 stage at 30 and 60 cm, and this tendency can be observed for 90 cm at the BBCH 29 stage. Generally, the CO2 enrichment induced faster root development in Mv Pálma.
Positive and statistically significant CO2 reactions were observed between the BBCH 37 and BBCH 83 growth stages under optimum watering at 90 cm, and between BBCH 51 and BBCH 69 at 30 cm (Figure 4). The CO2 fertilization resulted in a significant decrease in the root length of Mv Pálma under drought-stressed conditions at the BBCH 37 stage, and at the later stages of vegetation in each soil layer except in the BBCH 51 stage at 60 cm (Figure 4).
Overall, the CO2 responses of Mv Karéj were negative in each phenophase, and the reactions were not influenced by the watering (Figure 5). The negative CO2 responses were more intensive at the end of vegetation, which indicates that the CO2 fertilization influenced the water balance of plants and induced faster root turnover. The unfavorable impacts of the CO2 enrichment were more intensive under drought-stressed conditions on the root length, but this process could be a component of the survival strategy of this genotype (Figure 5).
The CO2 reactions of Mv Karizma showed variability during vegetation, and this parameter was influenced significantly by the watering (Figure 6). Roots can be observed only at 30 cm at the BBCH 17 stage, and significant positive CO2 responses were observed in terms of the root development under drought-stressed conditions, while the opposite tendency was observed under optimum irrigation. The negative impacts of the CO2 enrichment were detected at 30 cm under optimum irrigation in the BBCH 21 stage, but significant positive responses to both watering levels were observed at 60 cm. The reactions of Mv Karizma to CO2 enrichment was consequently negative at 30 cm, and this trend was not influenced by the intensity of watering, while the CO2 reactions were tendentially negative between the BBCH29 and BBCH 83 stages under drought-stressed conditions and positive at 60 cm under controlled irrigation. Negative CO2 reactions were determined at 90 cm at both watering levels, but this tendency was significant at first when plants reached the BBCH 51 stage (Figure 6).

4. Discussion

CO2 molecules in the atmosphere are essential substrates of photosynthesis; therefore, in general, increasing the concentration of CO2 leads to improved assimilation and crop productivity. Previously, the effects of elevated CO2 have been widely investigated in various field crops, such as wheat [33,34], maize [35,36], rice [37], sorghum [35], etc. Primarily, these studies determined that CO2 fertilization improved biomass and grain production, which is also confirmed by our experiment. It has already been correspondingly established that there are differences in the CO2 reactions of cereal varieties, especially under stress conditions [37,38,39]. In our experiment, Mv Karizma showed the most intense responses to the increased CO2 level. Previously conducted studies also highlighted that the increasing CO2 concentration could partly counterbalance the negative impact of abiotic stresses, such as drought or heat [7,40]. In our experiment, the CO2 response was variety dependent and the most favorable reactions were observed for Mv Karizma. The yield reduction under drought stress dropped by approximately one half under elevated CO2 compared to ambient conditions. The physiological background of this result might be that the high CO2 concentration modifies the intensity of the photosynthesis [39,41], decreases the stomatal conductance and increases the evaporation [42]. Based on this, it can be concluded that although the influence of elevated CO2 on the aboveground parts of the plants is well-known, the development of the root system should also offset the increased water loss and nutrient uptake. There are differences in the rooting habits of wheat varieties, even under ambient conditions [43,44]; furthermore, the cultivars also give diverse responses to CO2 [45,46]. Considering the above, it would be highly important to reveal how these effects interact under various irrigation regimes.
The novel aspect of our study is that the effects of the elevated CO2 concentration were combined with the drought stress, and the differences in the CO2 responses of the tested varieties were also determined.
Asseng et al. [47] described in a minirhizotron study that the fastest root-growth development was observed between the visible terminal spikelet stage (BBCH 51) and anthesis (BBCH 65), and the maximum root length was measured beyond 90 days after sowing. Based on our results, the most intensive root growth occurred in the vegetative phase, while the date of the highest root length was influenced by the atmospheric CO2 as well. Under ambient conditions, the maximum root length could be observed at the BBCH 37 stage, but the elevated CO2 resulted in a constant increase in the root length until the BBCH 51 phase. Uddin et al. [48] described that elevated CO2 resulted in the intensive root-length formation of wheat plants, especially in the upper soil layer. In our study, however, significant differences were observed between the examined varieties in terms of CO2 reactions. Our study partly confirmed this trend: although accelerated root development was detected in each soil layer induced by the CO2 fertilization, overall, the root length was reduced under elevated CO2 concentration. Mitchell et al. [49] proposed that the potential reason for this phenomenon could be that the surplus assimilates availability for extra root growth under elevated CO2. Manschadi et al. [50] found in a wheat experiment, in root-observation chambers, that genotypes that were developed for dry conditions had longer root systems in deep soil layers. In our study, the intensive root formation in the deeper soil layers (60 and 90 cm) under drought-stressed conditions indicate the good adaptive capacity of the examined genotypes, especially that of Mv Pálma and Mv Karizma, to a water-limited environment.
In the root characteristics, no differences were detected in near-isogenic lines in the case of the reduced height genes (Rht1 and Rht2) in Western Australia [51], whereas in Argentina, an increase in the total root length and root weight was associated with reduced height [52]. In our experiment, Mv Karizma had the greatest root length, especially under dry conditions, in the deepest soil layer. This might be due to the presence of the less-efficient dwarfing gene (Rht2) in its genome. Mv Pálma had the less-developed root system, even under elevated CO2 concentration, which could be in accordance with the presence of the Rht8 gene.

5. Conclusions

As a consequence of the water shortage, the depth of the intensive root development remained in the deeper soil layers and under elevated CO2 concentration, the distribution of the root system was more homogeneous in the whole soil profile than under ambient conditions. The elevated CO2 concentration induced an accelerated root formation, but considering the whole vegetation period, the CO2 fertilization had a reducing effect on the root length.
The most intensive root development was detected in the vegetative stage of the plants. The maximum root length was observed at the beginning of the heading, and this period took longer under elevated CO2 concentration. After the heading, the development of the new roots became slower and intensive root turnover was observed. Increased root formation was determined at the maturity stage in almost every treatment, which could be in association with the re-growth of the stubble under field conditions.
The water shortage generally stimulated root growth, but the depth of the intensive root development proved to be variety dependent and this phenomenon was more intensive under ambient CO2 concentration.

Supplementary Materials

The following supporting information can be downloaded at: https://www.mdpi.com/article/10.3390/su14063304/s1, Table S1: The effects of the tested factors and their interactions on the aboveground biomass, Table S2: The effects of the tested factors and their interactions on the grain yield, Table S3: The effects of the tested factors and their interactions on the thousand-kernel weight, Table S4: The effects of the tested factors and their interactions on the harvest index.

Author Contributions

Conceptualization, B.V.; methodology, B.V.; validation, G.V., O.V. data curation, B.V., E.V.-L.; writing—original draft preparation, B.V., Z.F.; writing—review and editing G.V., O.V.; visualization, E.V.-L.; funding acquisition, O.V. All authors have read and agreed to the published version of the manuscript.

Funding

This research was funded by the Hungarian Government and the European Union, with the co-funding of the European Regional Development Fund within the framework of the Széchenyi 2020 Program’s grant number GINOP-2.3.2-15-2016-00029.

Institutional Review Board Statement

Not applicable.

Informed Consent Statement

Not applicable.

Data Availability Statement

The data presented in this study are available on request from the corresponding author.

Conflicts of Interest

The authors declare no conflict of interest. The funders had no role in the design of the study; in the collection, analyses, or interpretation of data; in the writing of the manuscript, or in the decision to publish the results.

References

  1. Intergovernmental Panel on Climate Change. Climate Change 2013: The Physical Science Basis–Working Group I Contribution to the IPCC Fifth Assessment Report; Cambridge University Press: Cambridge, UK, 2013. [Google Scholar]
  2. Matiu, M.; Ankrest, D.P.; Menzel, A. Interactions between temperature and drought in global and regional crop yield variability during 1961–2014. PLoS ONE 2017, 12, e0178339. [Google Scholar] [CrossRef] [PubMed] [Green Version]
  3. Lobell, D.B.; Hammer, G.L.; McLean, G.; Messina, C.; Roberts, M.J.; Schlenker, W. The critical role of extreme heat for maize production in the United States. Nat. Clim. Chang. 2013, 3, 497–501. [Google Scholar] [CrossRef]
  4. Good, P.; Both, B.B.B.; Chadwick, R.; Hawkins, E.; Jonko, A.; Lowe, J.A. Large differences in regional precipitation change between a first and second 2 K of global warming. Nat. Commun. 2016, 7, 13667. [Google Scholar] [CrossRef] [PubMed] [Green Version]
  5. Leng, G.; Hall, J. Crop yield sensitivity of global major agricultural countries to droughts and the projected changes in the future. Sci. Total Environ. 2019, 654, 811–821. [Google Scholar] [CrossRef]
  6. Lesk, C.; Rowhani, P.; Ramankutty, N. Influence of extreme weather disasters on global crop production. Nature 2016, 529, 84–87. [Google Scholar] [CrossRef]
  7. Varga, B.; Vida, G.; Varga-László, E.; Hoffmann, B.; Veisz, O. Combined effects of drought stress and elevated atmospheric CO2 concentration on the yield parameters and water use properties of winter wheat (Triticum aestivum L.). J. Agron. Crop. Sci. 2017, 203, 192–205. [Google Scholar] [CrossRef]
  8. Farkas, Z.; Varga-László, E.; Anda, A.; Veisz, O.; Varga, B. Effects of waterlogging, drought and their combination on yield and water-use efficiency of five Hungarian winter wheat varieties. Water 2020, 12, 1318. [Google Scholar] [CrossRef]
  9. Chun, J.A.; Wang, Q.; Timlin, D.; Fleischer, D.H.; Reddy, V.R. Effect of elevated carbon dioxide and water stress on gas exchange and water use efficiency in corn. Agric. For. Meteorol. 2011, 151, 378–384. [Google Scholar] [CrossRef]
  10. Meng, F.C.; Zhang, J.H.; Yao, F.M.; Hao, C. Interactive effects of elevated CO2 concentration and irrigation on photosynthetic parameters and yield of maize in Northeast China. PLoS ONE 2014, 5, e98318. [Google Scholar] [CrossRef] [Green Version]
  11. Wang, M.; Xie, B.; Fu, Y.; Dong, C.; Hui, L.; Guanghui, L.; Liu, H. Effects of different elevated CO2 concentrations on chlorophyll contents gas exchange, water use efficiency, and PSII activity on C3 and C4 cereal crops in a closed artificial ecosystem. Photosynth. Res. 2015, 126, 351–362. [Google Scholar] [CrossRef]
  12. Franzaring, J.; Holz, I.; Fangmeier, A. Responses of old and modern cereals to CO2-fertilisation. Crop Pasture Sci. 2013, 64, 943–956. [Google Scholar] [CrossRef]
  13. Rogers, E.D.; Benfrey, P.N. Regulation of plant root system architecture: Implication for crop advancement. Curr. Opin. Biotechnol. 2015, 32, 93–98. [Google Scholar] [CrossRef] [PubMed]
  14. Ristova, D.; Busch, W. Natural variation of root traits: From development to nutrient uptake. Plant Physiol. 2014, 166, 518–527. [Google Scholar] [CrossRef] [PubMed] [Green Version]
  15. Benlloch-Gonzalez, M.; Bochicchio, R.; Berger, J.; Bramley, H.; Palta, J.A. High temperature reduces the positive effects of elevated CO2 on wheat root system growth. Field Crop. Res. 2014, 165, 71–79. [Google Scholar] [CrossRef]
  16. Zuo, Q.; Jie, F.; Zhang, R.; Mend, L. A generalized function of wheat’s root length density distribution. Vadose Zone J. 2004, 3, 271–277. [Google Scholar] [CrossRef]
  17. Wasson, A.P.; Rebetzke, G.J.; Kirkegaard, J.A.; Christopher, J.; Richards, R.A.; Watt, M. Soil coring at multiple field environments can directly quantify variation in deep root traits to select wheat genotypes for breeding. J. Exp. Bot. 2014, 65, 6231–6249. [Google Scholar] [CrossRef] [Green Version]
  18. Zhao, G.; Liu, J.; Ciu, J.; Wang, H.; Wen, G. Revealing the mechanism of the force dragging the soft bag in the dynamic process pf deep soil coring. Powder Technol. 2019, 344, 251–259. [Google Scholar] [CrossRef]
  19. Cai, G.; Vanderbought, J.; Klotzche, A.; van der Kruk, J.; Neumann, J.; Hermes, N.; Vereecken, H. Construction of Minirhizotron Facilities for Investigating Root Zone Processes. Vadose Zone J. 2016, 15, vzj2016.05.0043. [Google Scholar] [CrossRef] [Green Version]
  20. Weigand, M.; Kemna, A. Imaging and functional characterization of crop root systems using spectroscopic electrical impedance measurements. Plant Soil 2019, 435, 201–224. [Google Scholar] [CrossRef] [Green Version]
  21. Weigand, M.; Kemna, A. Multi-frequency electrical impedance tomography as a non-invasive tool to characterize and monitor the crop root system. Biogeosciences 2017, 14, 921–939. [Google Scholar] [CrossRef] [Green Version]
  22. Xu, Z.; Valdes, C.; Clarke, J. Existing and potential statistical and computational approaches for the analysis of 3D CT images of plant roots. Agronomy 2018, 8, 71. [Google Scholar] [CrossRef] [Green Version]
  23. Atkinson, J.A.; Pound, M.P.; Bennett, M.J.; Wells, D.M. Uncovering the hidden half of the plants using new advances in root phenotyping. Curr. Opin. Biotechnol. 2019, 55, 1–8. [Google Scholar] [CrossRef] [PubMed]
  24. Tracy, S.R.; Nagel, K.A.; Postman, J.A.; Fassbender, H.; Wasson, A.; Watt, M. Crop improvement from phenotyping roots: Highlights reveal expanding opportunities. Trends Plant Sci. 2020, 25, 105–118. [Google Scholar] [CrossRef] [PubMed] [Green Version]
  25. Barnett, S.; Zhao, S.; Ballard, R.; Franco, C. Selection of microbes for control of Rhizoctonia root rot on wheat using a high throughput pathosystem. Biol. Control. 2017, 113, 45–57. [Google Scholar] [CrossRef] [Green Version]
  26. Jaradat, A.A. Wheat landraces: A mini-review. Emir. J. Food Agric. 2013, 25, 20–29. [Google Scholar] [CrossRef]
  27. Abido, W.E.A.; Zsombik, L. Effect of water stress on germination of some Hungarian wheat landraces varieties. Acta Ecol. Sin. 2018, 38, 422–428. [Google Scholar] [CrossRef]
  28. Nagy, É.; Lehoczki-Krsjak, S.; Lantos, C.; Pauk, J. Phenotyping for testing drought tolerance on wheat varieties of different origins. S. Afr. J. Bot. 2018, 116, 216–221. [Google Scholar] [CrossRef]
  29. Dowla, M.A.N.; Edwards, I.; O’Hara, G.; Islam, S.; Ma, W. Developing Wheat for Improved Yield and Adaptation Under a Changing Climate: Optimization of a Few Key Genes. Engineering 2018, 4, 514–522. [Google Scholar] [CrossRef]
  30. Gulyás, G.; Bognár, Z.; Láng, L.; Bedő, Z. Distribution of dwarfing genes (Rht-B1b and Rht-D1b) in Martonvásár wheat breeding materials. Acta Agron. Hung. 2011, 59, 249–254. [Google Scholar] [CrossRef]
  31. Tischner, T.; Kőszegi, B.; Veisz, O. Climatic programmes used on Martonvásár phytotron most effectively in recent years. Acta Agron. Hung. 1997, 45, 85–104. [Google Scholar]
  32. Lancashire, P.D.; Bleiholder, H.; van den Boom, T.; Langlüdekke, P.; Stauss, R.; Weber, E.; Witzenberger, A. A uniform decimal code for growth stages of crops and weeds. Ann. Appl. Biol. 1991, 119, 561–601. [Google Scholar] [CrossRef]
  33. Kimball, B.A.; Pinter, P.J.; Garcia, R.L.; LaMorte, R.L.; Wall, G.W.; Hunsaker, D.J. Productivity and water use of wheat under free-air CO2 enrichment. Glob. Chang. Biol. 1995, 1, 429–442. [Google Scholar] [CrossRef]
  34. Högy, P.; Wiese, H.; Koehler, P.; Schwadorf, K.; Breuer, J.; Franzaring, J. Effects of elevated CO2 on grain yield and quality of wheat: Results from a 3-year free-air CO2 enrichment experiment. Plant Biol. 2009, 11, 60–69. [Google Scholar] [CrossRef]
  35. Manderscheid, R.; Erbs, M.; Weigel, H.-J. Key physiological parameters related to differences in biomass production of maize and four sorghum cultivars under drought and free-air CO2 enrichment. Procedia Environ. Sci. 2015, 29, 89–90. [Google Scholar] [CrossRef] [Green Version]
  36. Qiao, Y.; Miao, S.; Li, Q.; Jin, J.; Lou, X.; Tang, C. Elevated CO2 and temperature increase grain oil concentration but their impacts on grain yield differ between soybean and maize grown in a temperate region. Sci. Total Environ. 2019, 666, 405–413. [Google Scholar] [CrossRef] [PubMed]
  37. Hu, S.; Wang, Y.; Yang, L. Response of rice yield traits to elevated atmospheric CO2 concentration and its interaction with cultivar, nitrogen application rate and temperature: A meta-analysis of 20 years FACE studies. Sci. Total Environ. 2020, 764, 142797. [Google Scholar] [CrossRef]
  38. Weigel, H.-J.; Manderscheid, R. Crop growth responses to free-air CO2 enrichment and nitrogen fertilization: Rotating barley, ryegrass, sugar beet and wheat. Eur. J. Agron. 2012, 43, 97–107. [Google Scholar] [CrossRef]
  39. Zheng, Y.; He, C.; Guo, L.; Hao, L.; Cheng, D.; Li, F.; Peng, Z.; Xu, M. Soil water status triggers CO2 fertilization effect on the growth of winter wheat (Triticum aestivum). Agric. For. Meteorol. 2020, 291, 108097. [Google Scholar] [CrossRef]
  40. Zhang, X.; Shi, Z.; Jiang, D.; Högy, P.; Fangmeier, A. Independent and combined effects of elevated CO2 and post-anthesis heat stress on protein quantity and quality in spring wheat grains. Food Chem. 2019, 277, 524–530. [Google Scholar] [CrossRef]
  41. Sinha, P.G.; Saradhi, P.P.; Upverty, D.C.; Bhatnagar, A.K. Effect of elevated CO2 concentration on photosynthesis and flowering in three wheat species belonging to different ploidies. Agric Ecosyst. Environ. 2011, 142, 432–436. [Google Scholar] [CrossRef]
  42. Manderscheid, R.; Dier, M.; Erbst, M.; Sickora, J.; Weigel, H.-J. Nitrogen supply–A determinant in water use efficiency of winter wheat grown under free-air CO2 enrichment. Agric Water Manag. 2018, 210, 70–77. [Google Scholar] [CrossRef]
  43. Severini, A.D.; Wasson, A.P.; Evans, J.R.; Richards, R.A.; Watt, M. Root phenotypes at maturity in diverse wheat and triticale genotypes grown in three field experiments: Relationships to shoot selection, biomass, grain yield, flowering time, and environment. Field Crop. Res. 2020, 255, 107870. [Google Scholar] [CrossRef]
  44. Dreccer, M.F.; Condon, A.G.; Macdonald, B.; Rebetzke, G.J.; Awasi, M.-A.; Borgognone, M.G.; Peake, A.; Pinare-Chavez, F.J.; Hungt, A.; Jackway, P.; et al. Genotypic variation for lodging tolerance in spring wheat: Wider and deeper root plates, a feature of low lodging, high yielding germplasm. Field Crop Res. 2020, 258, 1078942. [Google Scholar] [CrossRef]
  45. Hansen, E.M.O.; Hauggaard-Nielsen, H.; Launay, M.; Rose, P.; Mikkelsen, T.N. The impact of ozone exposure, temperature and CO2 on the growth and yield of three spring wheat varieties. Environ. Exp. Bot. 2019, 168, 103868. [Google Scholar] [CrossRef]
  46. Erice, G.; Sanz-Sáez, Á.; González-Torralba, J.; Méndez-Espinoza, A.M.; Urretavizcaya, I.; Nieto, M.T.; Serret, M.D.; Araus, J.L.; Irigoyen, J.J.; Aranjuelo, I. Impact of elevated CO2 and drought on yiled and quality traits of a historical (Blanqueta) and a modern (Sula), durum wheat. J. Cereal. Sci. 2019, 87, 194–201. [Google Scholar] [CrossRef]
  47. Asseng, S.; Ritchie, J.T.; Smucker, A.J.M.; Robertson, M.J. Root growth and water uptake during water deficit and recovering in wheat. Plant Soil 1998, 201, 265–273. [Google Scholar] [CrossRef]
  48. Uddin, S.; Löw, M.; Parvin, S.; Fitzgerald, G.; Bahrami, H.; Tausz-Posch, S.; Armstrong, R.; O’Leary, G.; Tausz, M. Water use and growth responses of dryland wheat grown under elevated [CO2] are associated with root length in deeper, but not upper soil layer. Field Crops Res. 2018, 224, 170–181. [Google Scholar] [CrossRef]
  49. Mitchell, J.H.; Chapman, S.C.; Rebetzke, G.J.; Bonnett, D.G.; Fukai, S. Evaluation of a reduced-tilling (tin) gene in wheat lines grown across different production environments. Crop Pasture Sci 2012, 63, 128–141. [Google Scholar] [CrossRef]
  50. Manschadi, A.M.; Christopher, J.; Devoil, P.; Hammer, G.L. The role of root architectural traits in adaptation of wheat to water-limited environments. Funct. Plant Biol. 2006, 33, 823–837. [Google Scholar] [CrossRef] [Green Version]
  51. Siddique, K.H.M.; Belford, R.K.; Tennant, D. Root: Shoot ratios of old and modern, tall and semi-dwarf wheat in a Mediterranean environment. Plant Soil 1990, 121, 89–98. [Google Scholar] [CrossRef]
  52. Miralles, D.J.; Slafer, G.A.; Lynch, V. Rooting patterns in near-isogenic lines of spring wheat for dwarfism. Plant Soil 1997, 197, 79–86. [Google Scholar] [CrossRef]
Figure 1. (a) The position of the polycarbonate tubes in the container; (b) The plant stand after the planting.
Sustainability 14 03304 g001
Figure 2. The experimental design in the ambient chamber. The tubes with the black end caps are the polycarbonate tubes for scanning the root system.
Sustainability 14 03304 g002
Figure 3. An image taken by the CI-600 root scanner under analysis by the RootSnap software.
Sustainability 14 03304 g003
Figure 4. Relative changes in root length of Mv Pálma to elevated CO2 concentration during the vegetation period at 30, 60 and 90 cm soil layer under optimum watering (control) and drought-stressed conditions. Full bars represent significant differences compared to the control (400 ppm) p ≤ 0.05 level (n = 3).
Sustainability 14 03304 g004
Figure 5. Relative changes in root length of Mv Karéj to elevated CO2 concentration during the vegetation period at 30, 60 and 90 cm soil layer under optimum watering (control) and drought-stressed conditions. Full bars represent significant differences compared to the control (400 ppm) p 0.05 level (n = 3).
Sustainability 14 03304 g005
Figure 6. Relative changes in root length of Mv Karizma to elevated CO2 concentration during the vegetation period at 30, 60 and 90 cm soil layer under optimum watering (control) and drought-stressed conditions. Full bars represent significant differences compared to the control (400 ppm) p 0.05 level (n = 3).
Sustainability 14 03304 g006
Table 1. List of phenophases when the root length measurements were carried.
BBCH CodesExplanation
BBCH 17Leaf development: 7 or more leaves unfolded
BBCH 29End of tillering: the maximum number of tillers detectable
BBCH 37Flag leaf just visible, still rolled
BBCH 51Beginning of heading: the tip of inflorescence emerged from the sheath, the first spikelet just visible
BBCH 69End of flowering: all spikelets have completed flowering but some dehydrated anthers may remain
BBCH 77Late milk stage
BBCH 83Ripening, early dough
Table 2. Responses of winter-wheat varieties to elevated CO2 and water shortage.
FactorsVariables
GenotypesCO2 LevelsWateringBM (g)GY (g)TKW (g)HI (%)
Mv PálmaNCC67.426.0636.8738.57
NCD62.023.3741.5737.54
ECC73.630.4735.6341.95
ECD65.325.6540.5339.62
Mv KaréjNCC73.827.4743.0037.18
NCD66.424.4542.6037.05
ECC75.628.4441.4737.90
ECD67.725.8340.5238.15
Mv KarizmaNCC77.432.1241.7741.76
NCD70.628.9637.8741.17
ECC79.433.7041.4642.71
ECD75.932.2035.1142.64
HSD5% valuesWatering1.8171.223n.s.n.s.
CO2n.s.1.0796.427.69
Genotype1.1980.9986.598.08
BM: aboveground biomass; GY: grain yield; TKW thousand-kernel weight; HI: harvest index; NC: ambient CO2; EC: 750 ppm CO2; C: controlled watering; D: drought stress, n.s. the effects of the factor are not significant (the presented data are means of eight replications).
Table 3. Root length of Mv Pálma in different stages of vegetation under well-watered and drought-stressed conditions in different soil layers by ambient and elevated atmospheric CO2 concentrations.
400 ppm750 ppm
C30D30C60D60C90D90C30D30C60D60C90D90
BBCH 17362a4160b5n.r.n.r.n.r.n.r.503a4518a3n.r.n.r.n.r.n.r.
BBCH 21884a3897a4262a4276a4n.r.n.r.1133a3851b2634a4656a2n.r.n.r.
BBCH 291215b21516a1858b31225a23457a4666a31380a2596b3933a231021a11029b31180a4
BBCH 371249b21532a11385a11452a1951b32228a21778a11063b11185a11079a11947a11952a1
BBCH 511276b11452a11537a11492a11194b23190a11649a11097b11231a11146a11871a1,21843a1,2
BBCH 691253a21242a2,31234a21337a11540b12877a11477a21087b11079a1,21027a11852a1,21548b3
BBCH 771506a11137b3927a31034a31008b2,32730a11334a2876b2821a3674b21646a21637a2,3
BBCH 831293a21439a1,21209b21387a1,21340b1,23200a11026a3991a1,2862a3995a11887a1,21882a1,2
C30, D30, C60, D60, C90 and D90 indicate the soil layer at 30 cm under controlled watering, the soil layer at 30 cm under drought stress, the soil layer at 60 cm under controlled watering, the soil layer at 60 cm under drought stress, the soil layer at 90 cm under controlled watering and the soil layer at 90 cm under drought stress, respectively. Lowercase letters indicate significant differences between drought and control treatments within the same soil layer and CO2 treatment (Student’s t-test) (p < 0.05) and the numbers in superscripts indicate significant differences between phenophases (HSD test (p ≤ 0.05) (n = 3), n.r., no roots were observed.
Table 4. Root length of Mv Karéj at different stages of vegetation under well-watered and drought-stressed conditions in different soil layers by ambient and elevated atmospheric CO2 concentrations.
400 ppm750 ppm
C30D30C60D60C90D90C30D30C60D60C90D90
BBCH 17357a4412a4n.r.n.r.n.r.n.r.60b6208a4n.r.000
BBCH 211450a31425a2288a3237a3n.r.n.r.588b51060a3544a3208b400
BBCH 291982a1,21818a1982b21280a1,2470a3785a31240a41257a2,31121a2472b3750a3559b3
BBCH 372111a11890a11476a11375a12326b22832a21539a11550a11398a1746b1,22341a1,21562b1,2
BBCH 512167a11582b21659a11474a13205b13804a11657a11548a11396a1862b12703a11551b1,2
BBCH 691870a21575a21484a11334a1,22867b13747a11551a1,21338b11242a1,2809b1,22387a1,21664b1
BBCH 771578a31153b31122a21122a22454b23480a11411a2,31298a21041a2673b22038a21361b2
BBCH 832173a11933a11623a11466a13232b13802a11382a3969a31117a2662b22404a1,21716b1
C30, D30, C60, D60, C90 and D90 indicate the soil layer at 30 cm under controlled watering, the soil layer at 30 cm under drought stress, the soil layer at 60 cm under controlled watering, the soil layer at 60 cm under drought stress, the soil layer at 90 cm under controlled watering and the soil layer at 90 cm under drought stress, respectively. Lowercase letters indicate significant differences between drought and control treatments within the same soil layer and CO2 treatment (Student’s t-test) (p < 0.05) and the numbers in superscripts indicate significant differences between phenophases (HSD test (p ≤ 0.05) (n = 3), n.r., no roots were observed.
Table 5. Root length of Mv Karizma at different stages of vegetation under well-watered and drought-stressed conditions in different soil layers by ambient and elevated atmospheric CO2 concentrations.
400 ppm750 ppm
C30D30C60D60C90D90C30D30C60D60C90D90
BBCH 17375a4156b5n.r.n.r.n.r.n.r.200a4338b4n.r.n.r.n.r.n.r.
BBCH 212013a31057b4114b4153a4n.r.n.r.641a3956b3294b5525a4n.r.n.r.
BBCH 292729a1,21711b1,2561b31843a3528a4195b41170a21067a2,3742b41355a3684b3568a3
BBCH 372820a11829b1,2810b22356a1,22847a23251a31381a11322a11366b2,32041a11997b23345a1
BBCH 512931a11853b11142b12560a13469b14411a11338a1,21181a1,21592b22188a12483b23242a1
BBCH 692470a21609b21156b12086a2,32433b33744a21244a1,21155a1,21432b2,31660a22407b23178a1
BBCH 772128a31476b2,3991b1,22012a2,32629b2,33481a31180a1,21013a21271b31665a22196b22535a2
BBCH 831963a31766b1,21182b12474a13365b14468a11342a1,21031b21845a11792a22864a13050a1
C30, D30, C60, D60, C90 and D90 indicate the soil layer at 30 cm under controlled watering, the soil layer at 30 cm under drought stress, the soil layer at 60 cm under controlled watering, the soil layer at 60 cm under drought stress, the soil layer at 90 cm under controlled watering and the soil layer at 90 cm under drought stress, respectively. Lowercase letters indicate significant differences between drought and control treatments within the same soil layer and CO2 treatment (Student’s t-test) (p < 0.05) and the numbers in superscripts indicate significant differences between phenophases (HSD test (p ≤ 0.05) (n = 3), n.r., no roots were observed.
Publisher’s Note: MDPI stays neutral with regard to jurisdictional claims in published maps and institutional affiliations.

