Abstract
The smart city presupposes the integration of different parts—Smart Economy, Smart Environment, Smart People, Smart Living, Smart Mobility, and Smart Governance. The integration assumes the certain relations between them. There are researches considering the impact of separate economic indicators on specific smart area or solutions. Nevertheless, the authors have not come across any studies considering the mutual impact of these areas. The goal of the research is to determine the direct effects of smart economy on other smart components and the indirect (mediation) impact of general indicators of national economy on smart domains. The model was estimated using the PLS-SEM technique tested in SmartPLS-3.3.7. software. The sample included statistical data on the indicators, received from Eurostat Database and Latvian Statistical Office. Data referred to Latvia for years 2009–2019. As a result, the hypotheses that Smart Economy has direct impact on smart people, smart living, smart mobility, smart environment, and smart society were supported. The mediation effect of general indicators of national economy was confirmed only for the smart society domain; other hypotheses were rejected. The obtained results can be practically applied by the authorities responsible for sustainable development of smart areas. The results of mediation effect can be especially interesting for countries that do not present a very high level of economic development but are developing smart, sustainable cities.
1. Introduction
The ideas of sustainable development are supported by many countries, and sustainability has become the dominating idea in ecology, consumption, economy, science, and so on. Sustainable development puts forward the requirements towards all components of human activities. One of the answers to these requirements is the development of concept of Smart City, which is an implementation of the principal postulates of sustainability.
The concept of Smart City is gaining more and more attention from scholars all over the world. Many factors contribute to this research interest: the rate of urbanization is so great [1,2] that the traditional urban area cannot stand the pressure of this growth and has to adjust to the realia, changing in the way to provide the proper sustainable standard of living and working for its citizens [3,4].
Smart ideas seem to be the answer to many contemporary challenges. In general, the ideas of being “smart” nowadays assume more dimension of being user-friendly than really intelligent [5,6]. Therefore, smart ideas could be referred not only to technologies, which are intelligent by their definition, but also to people, using these user-friendly technologies in different operations, and these operations create smart environment.
Smart ideas seem to be the answer to many contemporary challenges. In general, the ideas of being “smart” nowadays assume more dimension of being user-friendly than really intelligent [5,6]. Therefore, smart ideas could refer not only to technologies, which are intelligent by their definition, but also to the people using these user-friendly technologies in different operations, and these operations create smart environment.
Smart City assumes the integration of different parts—Smart Economy, Smart environment, Smart People, Smart Living, Smart Mobility, and Smart Governance [1,7]. The integration presupposes that all these areas are interconnected and mutually dependent.
Dirks and Keeling [8] emphasized the organic nature of the system, presupposing integration of all its parts. According to [9], it is not enough to use technologies in all subsystems that are considered to be smart by just using the state-of-the-art technologies; it is necessary to treat all these subsystems as a system operating in network. The intelligent behavior of each subsystem should be coordinated [10].
To create the coordinated approach to various smart dimensions, it is necessary to comprehend the types of relationships between the components to understand the ways of impacting each of them.
There are some studies devoted to investigation of each of these smart fields. For example, Nam and Pardo [11] considered several smart dimensions, but they did not reveal the relationships between them.
There are researches considering the impact of separate economic indicators on specific smart area or solutions. Nevertheless, the authors did not come across any studies considering the mutual impact of these areas [12,13,14].
The authors are interested especially in the impact of smart economy on other smart components since economic factors allow the allocation of resources, providing the possibilities of implementation of smart solutions.
Another investigated issue is as follows: whether the general indicators of national economy have the mediation effect on smart components; therefore, it was decided to study the impact of the set of economic indicators referred to smart economy with mediation of general indicators of national economy on other smart domains.
The goal of the research is to determine the direct effects of smart economy on other smart components and the indirect (mediation) impact of general indicators of national economy on smart domains.
The scientific novelty of the research lies in the approach: to estimate not the interrelations of separated smart issues but to see the impact of smart economy on all other smart areas.
Considering the impact of general indicators of national economy not directly but as mediation of smart economy is also new.
The authors also see the significant practical value of this research. If the research demonstrates that smart economy has the effect on other smart components, these effects can be used in the process of developing other smart areas. The authorities and organizations responsible for the smart fields can use the specific tools of progressing smart economy, and smart economy, in its turn, will improve the situation in other smart areas.
Therefore, the obtained results might be interesting for many countries, promoting the smart areas both developed and developing. We tested whether general economic indicators can indirectly facilitate the impact of smart economy on other smart areas. It allows understanding how to use the economic indicators for stimulation of smart concept development, and it could give weight to the idea that countries with different levels of economic development can achieve success in developing smart areas. Certainly, these assumptions would require additional study, predetermining the possible future researches.
The research consists of the following sections: Literature Review, Setting the Hypotheses, Methods, Results, and Discussion and Conclusions.
2. Literature Review
Smart economy is the area where the new economic phenomena take place. The standard scheme that has been working for ages stops functioning properly, and new forms of economic relations appear [15]. As a result, for example, it is more beneficial to use resources without ownership. A small company that has almost no fixed capital can show better results in financial operations than the powerful banks due to sharing but not owning the facilities [16]. We live in the era of smart economy and must recognize, understand, and use these new realia.
According to IGI Global [17], the main principles of smart economy are based on the resource efficiency. This efficient usage of resources is achieved via technological innovations. Therefore, the smart economy will facilitate the innovative development and contribute to sustainability, and this environment will create a beneficial situation for social welfare [18].
Smart economy uses IT solutions for achieving efficiency and for identifying the problems; it uses the collected data for making decisions, for allocating the resources with efficacy, and for enabling the cooperation across various domains [9].
Smart economy is an environment for facilitated development of e-business and e-commerce and new opportunities for entrepreneurs [14]. The innovations and innovative activities become the constituent part of the concept of a smart future based on sustainability and environmental protection, high level of scientific researches, and creative approaches to the processes [19,20]. Smart economy must be efficient, providing the necessary balance of costs and benefits [21,22]
Balaceanu et al. [23] summarized that economy becomes smart due to more dynamic operations, more competitive performance, and innovative entrepreneurial activities.
As we see, the scholars mention the impact of smart economy on other areas of life, but their studies do not contain any investigation of these relationships. Therefore, in order to not produce normative and declarative statements, it is necessary to study these connections.
The researches dealing with Smart People suppose them to be creative, flexible in all areas of their lives, and integrated into society, having highly developed professional competences and skills, actively participating in all initiatives, and always ready to learn [24,25,26,27,28,29]. These features can be implemented only in the case when the economy of the country really requires them, and we can assume that the smart economy will have a specific impact on the area.
According to the European Environment Agency [30], Smart Mobility provides access to national and international transport systems, including the possibilities and safety of mobility, and these should be based on innovations and new technologies. Moreover, the solutions in the area of smart transportation must be efficient [31,32,33]
The authors have not found any researches directed on detecting the impact of smart economy on smart mobility, but even the description of the smart mobility area proves that these smart innovations and smart technologies should be produced, and they are produced by an economy that is also smart. Therefore, the impact of smart economy on the field might exist.
The concept of Smart Living comprises such areas as safe and convenient living environment, efficient technological and user-friendly communication, the balance of working and non-working hours, contributing to the possibilities of development of people, technological home environment, and the efficient use of resources and convenience of people [34,35,36,37,38,39].
In general, when the researchers describe smart domains, they usually separate “Smart Governance”. They usually consider the participation of the population in decision-making processes and the transparent and democratic way of authorities working, which is achieved via the creation of public services [40,41].
Nevertheless, this research does not consider Smart Governance. It is due to the lack of available data on the required indicators. However, some indicators, on which information is available, are included in the study. It was decided to use the domain “Smart Society”, comprising the available indicators on Smart Governance (female and youth participation and availability of e-public services) and also the indicators, which are difficult to ascribe to any one “smart” area, and simultaneously, they determine the wellness of people in smart environment, such as indicators of risk of poverty, indicators of health system, and women and youth inequality indicators. As a result, the section regarding Smart Society has the largest number of indicators.
The part of the indicators considered in this section has an economic nature; it can be very interesting to investigate the impact of smart economy on this domain.
Smart Environment refers, first of all, to sustainability in resources use, allocation and management, protection of nature, and decreased pollution and is oriented toward preservation of green areas [38,42,43]. Here, it is possible to mention the valuable contribution of all the researchers in investigating energy fields, new sources of energy, and the possibility to decrease energy consumption as one of the touchiest issues in the con-temporary world [36,44,45,46].
Another very important area of Smart Environment is waste management, which can be considered as a significant stage of circular economy. On the one hand, waste is a real threat for the environment, and smart organization of waste treatment is very important for area preservation. On the other hand, new technologies allow simultaneous economic development and nature protection; for example, today’s waste is a very promising resource for tomorrow. The contemporary technologies allow turning piles of waste into useful production factors, contributing both to clean environment and smart allocation of resources. However, the process of waste management should be very smart to achieve the ambitious and challenging aims that have been put forward by Smart Environment domain [47,48,49,50,51]. It is possible to speak about other indicators and fields representing Smart Environment, for example, utility services [38,52,53], but any field of the environment must use the tools of smart economy for promoting smart solutions in the environmental sphere. Smart solutions in environment can provide energy efficiency and improve manufacturing capabilities [54], mitigate the negative impact on nature [55], and decrease carbon footprints [56]; in general, ecology is in the center of all decisions, and the researchers pay the greatest attention to the ecological factors in all their studies and their practical implementation [57].
However, many scholars suppose that economic development has a negative impact on the environment. For example, Shaheen et al. [58] stated that the FDI (Foreign Direct Investments) have negative impact on environment; Ahmed et al. [59] were certain that the abundance of natural resources has a destroying impact on the environment; and Yasmeen et al. [60] assumed the general negative impact of development on the natural environment.
As we can see, the relationship between economy and environment is a contradictory issue, and therefore, it is especially interesting to see the impact of smart economy on smart environment.
As a result, these six smart domains considered by many scholars in their studies will be investigated for their interrelations in this research.
3. Setting the Hypotheses
The goal of the research is to analyze the impact that Smart Economy has on other smart areas. Therefore, the first set of hypotheses refers to the direct effect of smart economy.
Hypothesis 1 (H1).
Smart economy positively affects Smart People domain.
Hypothesis 2 (H2).
Smart economy positively affects Smart Society domain.
Hypothesis 3 (H3).
Smart economy positively affects Smart Environment domain.
Hypothesis 4 (H4).
Smart economy positively affects Smart Living domain.
Hypothesis 5 (H5).
Smart economy positively affects Smart Mobility domain.
Another set of hypotheses refers to the assumption that the general indicators of national economy can serve as mediators for smart economy and facilitate its influence. Smart economy is a constituent part of national economy; the level of economic development and economic indicators can affect all the processes in the country, including the smart ones. Therefore, the set of indicators of national economy was taken as a mediator for smart domains.
Hypothesis 6 (H6).
National economy indicators serve as a mediator for Smart Economy and Smart People domains.
Hypothesis 7 (H7).
National economy indicators serve as a mediator for Smart Economy and Smart Society domains.
Hypothesis 8 (H8).
National economy indicators serve as a mediator for Smart Economy and Smart Environment domains.
Hypothesis 9 (H9).
National economy indicators serve as a mediator for Smart Economy and Smart Living domains.
Hypothesis 10 (H10).
National economy indicators serve as a mediator for Smart Economy and Smart Mobility domains.
These hypotheses were set within the frameworks of the proposed research conceptual model (see Figure 1).
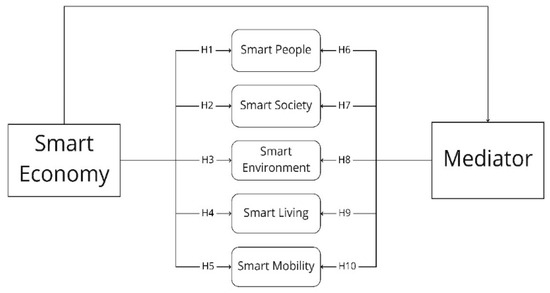
Figure 1.
The proposed research conceptual model. Source: Figure is generated by the authors.
4. Materials and Methods
4.1. Data
The goal of the research is to analyze the impact of smart economy on such smart domains as smart people, smart mobility, smart society, smart environment, and smart living.
Each domain comprises the traditional components:
- Smart Economy: turnover of SMEs due to e-commerce, employment in knowledge-intensive areas, ICT staff as percentage of total employment, ICT input in GDP, individual online consumption in the domestic market and in the EU countries, import of ICT products, and fixed assets as a percentage of GDP [16,17,18,19,20];
- Smart People: Human Development Index, adult learning, number of students, expenditures on education, schooling years, number of higher educational establishments, % of 18-year-old students, and percentage of people often using the internet [24,25,26,27,28,29];
- Smart Environment: air emissions, resource productivity, expenditures on environment protection, hazardous waste, hazardous pollutions of different types, emissions of heat plants and producing industries, various air pollutants, and share of electricity from renewable sources [38,42,43,44,45,46,47,48,49,50,51,52,53,54,55,56,57];
- Smart Society (combines the indicators of Smart Governance and the traditional indicators of sustainable society): female employment in technological industries, inequality in education, social protection expenditures, female graduates from the universities, gender inequality index, youth participation, availability of e-public services, indicators of risk of poverty (Gini and Quintile indices), expenditures on health system, youth inequality indicators, and decreased access to the internet due to the cost factor [40,41,61];
- Smart Living: working hours, proportion of leisure and working hours, consumption expenditures of households per capita in PPS, vulnerable employment, rate of urban population, and level of crime [34,35,36,37,38,39];
- Smart Mobility: passenger transportation, green gas emissions in transportation, share of renewable sources in fuel consumption, number of transport-sharing companies transportation of goods, death numbers on the roads, and investments in road infrastructure [30,31,32,33];
- “Mediator” variable contains the general indicators of economy development, such as GDP, GDP growth (to year 2010), energy consumption per capita, rate of unemployment, rate of self-employment, and rate of inflation (consumer price index) [61].
All the data are standardized.
The authors used data from Eurostat Database and Latvian Statistical Office. The timespan was for year 2009–2019. All the data refer to Latvia.
4.2. Model
The conceptual structure of the model of the study is presented in Figure 1. The process of analysis comprised the specification of structural model according to the set goal and hypotheses and then the estimation of the latent variables and structural model [62,63].
All the constructs in this model are reflective. The mediator, consisting of indicators of national economy, is a formative construct as it often happens in economics. According to [64,65], the formative latent variables refer to independent indicators. The factors in this variable do not belong to a common theme [66,67]. The indicators in this model should be referred to the reflective ones.
Then, the effect of mediation was estimated using the PLS-SEM technique [68,69].
The choice of PLS-SEM technique is based on the fact that this research is devoted to the stage of exploration of the theory but not testing the existing one. While CB-SEM is mostly used to test and confirm the existing theories, PLS-SEM is a good causal-predictive technique, mostly oriented on the explanation of the variance in independent variables. However, the most significant reason to use PLS-SEM and not CB-SEM is small sample in this research [70,71]. Moreover, according to Iqbal et al. [63], the researchers often use this method for studying the innovative knowledge areas [72,73,74].
This method allows studying simultaneously direct and indirect mediating relations of the constructs [75], which is very suitable for the purposes of this research. This method permits analyzing the key components in combination with path analysis based on regressions [76,77], which makes it possible to estimate the cause–effect models and use them for forecasting the specified construct behavior [77,78,79].
The number of iterations was 8.
4.3. Software
The authors used the partial least square structural equation modeling (PLS-SEM), which is the tool for analyzing data, and it is very often used in social sciences [75,80,81]; it is also used for small sample size and involves complex model structures [65,75,82]; the model was constructed using the software Smart PLS-3.3.7. PLS-SEM. The statistical significance α was taken at the value of the criterion p < 0.05.
4.4. Research Process
One of the most widely-used methods for structural equation modeling is the partial least squares regression. The first step presupposes the evaluation of validity and reliability of the model, and the second step is the interpretation of the structural model [83].
The first stage comprises the estimation of measurement model [84,85]. It includes testing indicators’ reliability, internal consistency, and convergent and discriminant validity and the measurement of indicators loadings and weights [86]. The second stage includes predictive relevance and path coefficients at [74].
All the indicators with factors weights/loadings lower than 0.50 were removed from the model. For example, Hair et al. [84] used even stricter criterion—loading must be more than 0.708. However, in this research, we left 3 indicators with the loadings of 0.648, 0.654, and 0.689 since these factors are important for the model, and their exclusion from the model will decrease the value of it. According to Rahi [86], it is possible if the elimination of the factor does not increase CR [87].
The model was checked for multicollinearity using the Variation Inflation Factor (VIF). The threshold of 10.00 was taken for this analysis [88]. The convergent validity was measured with employment of the Average Variance Extracted (AVE) methods, which is above 0.5 and explains more than 50% of indicators’ variance. The internal consistency was measured for the model in this research, using ρA, which is “approximately exact reliability measure of the PLS-SEM composites” [74]. The authors also used the Composite Reliability (CR) for evaluating the reliability, which is supposed to be the most “liberal” criterion of reliability measure [65,74]. The researchers determine the different values as acceptable ones for different types of studies. For example, for exploratory purposes CR should be more or equal to 0.6 [65,89,90].
If the goal of the study is to confirm the existing ideas, then CR should be ≥0.7 [76] or ≥0.8 [91,92]. This study is an exploratory one; almost all the CR values are more than 0.6. The discriminant validity is measured for reflective model and shows the contrast be-tween variables and how one variable is distinct from another. If we investigate the questions, it is a very important to see the difference between the groups of questions. In case of this research, the difference between the constructs is obvious by their nature, but the authors examined the model using Fornell–Larcker criterion and cross loadings [93]. We also applied HTMT.
Research also included determination of f2 and Q2, which also demonstrate the quality of the model.
Next step was testing the hypotheses H6–H10. Since the mediation effect was analyzed for these hypotheses, it was necessary to measure the direct and indirect effects and also total effect, which is the sum of the aforementioned two [65,94,95].
5. Results
5.1. Testing the Quality of the Constructs
First, the model components were checked for factors weights/loadings. As a result, indicators with low weights/loadings were removed from the latent variables. The indicators, which were included in the model, and their loadings are shown in Table 1. The third column of this table shows the indicators that were removed from the model.

Table 1.
Indicators of the model, their loadings, and p-values.
The model was checked for multicollinearity with the threshold of 10.00. The values of Cronbach’s alpha are not good, but some researchers insist that it is “conservative measure” ([65], p.64), and it underestimates the internal consistency ([65], p. 63), [86,89,96].
The results of applying Composite Reliability (CR), ρA, and Average Variance Extracted (AVE) are shown in Table 2. These methods prove that the construct explains the variance and not errors. Determination coefficients also demonstrate that the chosen variables have a high level of explanation by the model.
Table 2.
Values of model measurement.
As we can see, the composite reliability values are not good enough for Smart People and Smart Society, as they are lower than the threshold 0.6; and they are not quite good for Smart Living although it is above 0.6. It demonstrates the low degree of internal consistency of these latent variables. The indicators determining these constructs are very different; for example, Smart People construct is described by the number of adult learners, expenditures on education, and number of people without higher education; the construct Smart Society consists of indicators of female employment in technological industries, inequality in education, gender inequality index, and social protection expenditures. As we understand, the indicators are not homogenous; AVE and rho A are good for these constructs.
The model was checked for f2, demonstrating the effect on R2 when the exogeneous variable is excluded from the model. According to Cohen [97], f2 ≥ 0.02 presents a small effect, f2 ≥ 0.15—medium, and f2 ≥ 0.35—large. This value shows the proportion of variance, which is not explained [98].
The results of our model are in Table 3, and they represent the values higher than 0.02 but lower than 0.15. As we see, the effect is low, and the proportion of not explained variance is not large. It is large only for the construct Smart Society.
Table 3.
Values of f2 and Q2.
The next important analysis is predictive relevance.
The predictive relevance is measured via cross-validated redundancy Q2. This measure estimates the parameters, which were omitted from the model; the omitted parts were estimated, and the difference between original and predicted value was measured. the smaller this difference is, the higher the value of Q2. Q2 higher than zero is taken as relevant ones, but the higher Q2 is, the higher the predictive accuracy of model measurements. According to the rule of thumb, the following values determine the predictive relevance: Q2 > 0, 0.25—small, and Q2 > 0.50—medium and large [84,99]. It shows whether the values are well reconstructed within the model [100,101]. Q2 was received from the Run Blindfolding procedure in SMART-PLS.
The obtained results are shown in Table 3.
5.2. Hypotheses Testing
The hypotheses set in this research were tested with path coefficients, calculated within a bootstrapping algorithm in Smart PLS-3.3.7. PLS-SEM software.
As a result, all hypotheses of the first set were supported:
H1:
Smart economy positively affects Smart People domain.
H2:
Smart economy positively affects Smart Society domain.
H3:
Smart economy positively affects Smart Environment domain.
H4:
Smart economy positively affects Smart Living domain.
H5:
Smart economy positively affects Smart Mobility domain.
The obtained model can be seen in Figure 2, and the values of descriptive statistics for these hypotheses are presented in Table 4.

Figure 2.
Visual representation of the obtained model. Source: Figure generated by the authors.
Table 4.
Total path significance testing by bootstrap algorithm for hypotheses H1, H2, H3, H4, and H5.
The values in the circles demonstrate the coefficient of determination R2. As we see, all domains are well explained by the indicators. Yellow circles represent the smart domains, which are affected by Smart Economy. The values on the arrows show the path coefficients, and values in parentheses demonstrate p-values. The path coefficients demonstrate strong interrelations between the variables. The p-values for all domains are below the required criterion p < 0.05. The hypotheses H1–H5 are confirmed.
For testing hypotheses H6–H10 and the mediation effect of indicators of national economy, the direct, indirect, and total effects were measured. After analyzing these effects, only one hypothesis, H7, was confirmed; other hypotheses were rejected. National economy has a mediating effect on Smart Society and does not have a reliable effect on other smart components.
The values of the bootstrapping algorism are demonstrated in Table 5.
Table 5.
Testing hypotheses H6–H10: Direct, Indirect, and Total Effects (bootstrap algorithm).
As we see, the obtained values determine the moderating effect of the factors of national economy:
H7:
National economy indicators serve as a mediator for Smart Economy and Smart Society domains.
All other hypotheses (H6, H8, H9, H10) should be rejected.
The descriptive statistics for specific indirect effects are presented in Table 6.
Table 6.
Some descriptive statistics values.
As we see from the table, the descriptive statistics shows that Mediator affects Smart Society and does not have impact on other constructs. The indirect moderating impact for them is not confirmed. The results of testing hypotheses H6–H10 are presented in Figure 3.
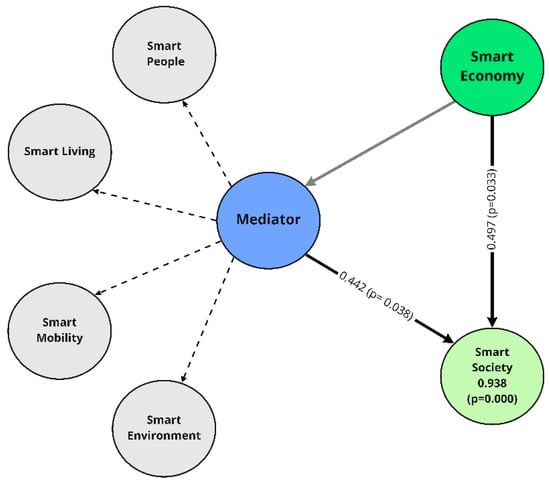
Figure 3.
Visual representation of testing the second set of hypotheses. Source: Figure generated by the authors.
Therefore, the research reveals the impact of Smart Economy on all smart components and demonstrated that the general indicators of national economy have a mediation effect only on Smart Society domain.
6. Discussion
The concept of smart development presupposes that all areas of life should function in balance, and also, it assumes their mutual interdependence.
The research was conducted to determine the direct effects of smart economy on other smart components and the indirect (mediation) impact of general indicators of national economy on smart domains. The topic seems to be interesting since the smart domains are not functioning individually, but they create a system, each subsystem of which is capable of changing the whole performance. We can assume that this system of smart components works as a complex, self-developing (evolutionary) system [102], but it was not considered in this article although it can present a great interest for future researches. However, it was decided to investigate the interrelations between smart economy and other smart components.
The authors did not find studies devoted to this issue although the internal relations between smart economy and other smart areas should exist. All smart areas are based on the use of technologies and innovations, and their development on such a scale is possible only in the case of proper development of a smart economy, which presupposes the involvement of economic resources in the necessary amount in smart technologies and innovations.
The research revealed the impact of smart economy on smart people, smart living, smart mobility, smart environment, and smart society. We could expect this result since the new processes in economy, which we call smart processes, have become a substantial part of all spheres of our contemporary life. The existence of new forms of economy, functioning on the basis of knowledge, technologies, and innovations, require people to correspond to these new tendencies, and people are pushed to become smarter. Almost for sure, we can assume that it is correct also in opposite direction: the progress in people’s education, knowledge, skills, and, most importantly, approaches and attitudes contribute greatly to the development and progress of smart economy. These interrelations were not considered in this research; however, the topic is interesting and can become the subject of future studies.
Smart economy inevitably should influence smart living since the level of technological development allows decreasing the working hours and change the proportion of leisure time and work for people, and this is supported by the examples of the countries having smart cities, influencing the standards of living, and creating new consumption habits and new way of thinking.
Smart mobility is very dependent on investments in new infrastructure and new technologies and should satisfy the increased needs of smart people and green smart environment. The creation of these technologies is possible only on the basis of new smart economy, and the dependence is quite predictable.
Smart society in this research combines the “traditional” smart domain—smart governance—and social indicators. The authors suppose the social indicators could be referred to smart living, but these indicators are so closely connected to the areas usually related to smart governance that it was considered to place these indicators in the construct “Smart Society”, combining the indicators of smart governance and social indicators. These indicators describe the various types of inequality in the society, and government traditionally takes responsibilities for these areas. Due to responsibility of authorities for these processes, the existence of relations between this domain and smart economy was assumed as not unambiguous, and it was expected there might be no relationship. However, the relationships exist. New economic structures have become the integral part of life and affect even the areas that are traditionally supposed to be under governmental control.
The study revealed the relationship between smart economy and smart environment. On the one hand, it could be expected that the development of smart economy has a positive effect on Smart Environment since it uses innovative ecology-friendly technologies. There are even studies that suppose that the intensive use of resource can decrease the ecological footprint [103,104,105].
These studies are confirmed by the obtained results: smart economy positively affects smart environment domain.
It might be expected that general indicators of national economy have a negative impact on environment; many authors consider the negative impact of economic activities on the ecological situation, for example, via carbon footprint [106,107,108].
According to Ivlev and Ivleva [57], Baloch et al. [109], Hassan et al. [110], and Sarkodie [111], intensive economic activities result in the expanded extraction of natural re-sources, destroyed natural habitat, and significantly increased pollution of the natural environment. However, this research did not show the effect of national economy on the environment.
Great practical value could result from the determination of the role of general indicators of national economy in the influence on the smart areas. The mediation effect of national economy as revealed for the domain of Smart Society and not observed for all other variables.
The mediation effect of national economy on smart society is positive; it facilitates the impact of smart economy on this variable. If we look at betas, we will see, that the beta of direct impact is not substantially bigger than the beta of indirect specific effect (0.497 and 0.442, correspondently); nevertheless, the total effect is significant, and the variables facilitate influence on the domain. The development of society can be under almost equal influence of national economy and smart components of economy. Countries can use both opportunities for developing this domain.
The absence of a mediation effect of national economy on other smart domains provides additional opportunities for developing countries, which have the possibility to advance smart areas without the negative influence of the lack of well-developed national economies. This conclusion is supported by example of many developing countries having some highly advanced smart areas.
Smart components are developed in many countries all over the world. There are many studies devoted to “smart” issues in both developed and developing countries. The results of this study can facilitate the development of smart areas in developing countries, allowing them to concentrate the resources in the peculiar areas and use them for advancing specific components that facilitate the smart processes.
Research Problem
The model has low indicators of discriminant validity by HTMT method. According to this algorithm, the latent variables are similar to each other. Nevertheless, we assume this “similarity” to be false, which is very similar to the discussions of spurious correlations (for example, [112]). We can see the similarity between female employment in technological industries and air pollution, share of SMEs turnover due to e-commerce, and people without higher education. The indicators included in the model are different in their nature. The economic development presupposes that all spheres of human life change with the development of society and economy, and they have the same trend. For example, it is possible to say that the progress of economy results in more active use of resources and increased production, which obviously increases the air pollution. Simultaneously, new trends in economy require more specialists in technological spheres, and their number increases with the development of economy, and inevitably the number of women employed in this industry will increase even if their proportion does not change. The trend is obvious, as both “increases” are connected with a third factor—economic development—but they are not interconnected. The latent variables look similar to each other, but they cannot interchange with each other since they describe different areas of life.
The presented research has some restrictions. The study reveals the interrelation of the components within one country—Latvia. Latvia represents CEE countries and has rather good indicators of “smartness” [16]. Nevertheless, the fact that the research comprises only one country is a limitation.
Another fact that can be considered as a restriction of this study is the set of indica-tors used for analysis. The authors adopted the indicators that are shown by the prominent scholars. Nevertheless, there are no fixed lists of indicators referring to a certain smart area, and the factors may vary depending on the researcher’s approach, country, area of study, etc. Therefore, similar studies can be conducted with another set of indicators, and the obtained results might be different.
The next research limitation is the rejection of the domain Smart Governance; this decision was made due to lack of available information on the required indicators for all years. Instead of this domain, the authors considered the domain Smart Society, which comprises the available indicators determining Smart Governance and also other indicators demonstrating the smartness of social environment and affecting human life.
7. Conclusions
The research is devoted to the determination of the relationships between smart economy and other smart areas and also to revealing the mediation effect of the general indicators of national economy.
Two sets of hypotheses were put forward as follows: the first set revealed the direct impact of smart economy on other smart domains, and the second determined the mediation effect of general indicators of national economy.
All the investigated domains present the high-quality constructs. The obtained models also demonstrate high quality.
For testing the first set of hypotheses, the bootstrap algorithm was applied. As a result, the hypotheses H1–H5 were confirmed: Smart Economy has an impact on Smart People, Smart Society, Smart Living, Smart Mobility, and Smart Environment.
Testing the second set of hypotheses demonstrated that national economy indicators have a mediation effect on Smart Society only (H7); other domains do not feel the mediation effect of indicators of national economy. Hypotheses H6 and H8–H10 were rejected.
The results of the research have the practical value since they allow the countries concentrate the efforts on the smart economy area, which, in its turn, will influence and facilitate the development of other smart domains.
The rejected hypotheses of the second set can present a special interest for the group of developing countries or countries with some economic problems. The results demonstrate that the indicators of national economy have no mediation impact on smart areas. Therefore, the countries that lack truly strong national economies still have opportunities for the development of smart areas.
The research has formed a great field for the following further studies: assumption that smart city is a complex, self-developing system; determining the impact of smart people domain on smart economy; and further research on relations of smart economy and other smart domains and so on.
Author Contributions
Conceptualization, Y.P.; methodology, Y.P.; software, S.P.; validation, Y.P. and S.P.; formal analysis, Y.P.; data curation, Y.P.; writing—original draft preparation, Y.P. and S.P.; writing—review and editing, Y.P.; visualization, S.P.; supervision, Y.P.; project administration, Y.P.; All authors have read and agreed to the published version of the manuscript.
Funding
This research was financially supported by the specific support objective activity, Project id. N. 1.1.1.2/16/I/001) of the Republic of Latvia, funded by the European Regional Development Fund. Research project No.1.1.1.2/VIAA/3/19/458 “Development of Model of Smart Economy in Smart City”.
Institutional Review Board Statement
Not applicable.
Informed Consent Statement
Not applicable.
Data Availability Statement
Available on request.
Conflicts of Interest
The authors declare no conflict of interest.
References
- Vinod Kumar, T.M.; Dahiya, B. Smart Economy in Smart Cities; Springer: Singapore, 2017; pp. 3–76. [Google Scholar]
- Gavalas, D.; Nicopolitidis, P.; Kameas, A.; Goumopoulos, C.; Bellavista, P.; Lambrinos, L.; Guo, B. Smart cities: Recent trends, methodologies, and applications. Wirel. Commun. Mobile Comput. 2017, 2017, 7090963. [Google Scholar] [CrossRef]
- Kirimtat, A.; Krejcar, O.; Kertesz, A.; Tasgetiren, M.F. Future Trends and Current State of Smart City Concepts: A Survey; IEEE Access: Piscataway, NJ, USA, 2020; Volume 8, pp. 86448–86467. [Google Scholar]
- Ismagilova, E.; Hughes, L.; Dwivedi, Y.K.; Raman, K.R. Smart cities: Advances in research—An information systems perspective. Int. J. Inf. Manag. 2019, 47, 88–100. [Google Scholar] [CrossRef]
- Klein, C.; Kaefer, G. From smart homes to smart cities: Opportunities and challenges from an industrial perspective. Next Generation Teletraff and Wired/Wireless Advanced Networking. Proc. Lect. Notes Comput. Sci. 2008, 5174, 260. Available online: http://www.sciepub.com/reference/40900 (accessed on 7 October 2021).
- Marsa-Maestre, I.; Lopez-Carmona, M.A.; Velasco, J.R.; Navarro, A. Mobile agents for service personalization in smart environments. J. Netw. 2008, 3, 30–41. [Google Scholar] [CrossRef]
- Giffinger, R.; Fertner, C.; Kramar, H.; Kalasek, R.; PichlerMilanoviü, N.; Meijers, E. Smart Cities: Ranking of European Medium-Sized Cities; Centre of Regional Science (SRF), Vienna University of Technology: Vienna, Austria, 2007; Available online: http://www.smartcities.eu/download/smart_cities_final_report.pdf (accessed on 13 December 2021).
- Dirks, S.; Keeling, M.A. Vision of Smarter Cities: How Cities Can Lead the Way into a Prosperous and Sustainable Future; IBM Global Business Services: Somers, NY, USA, 2009; Available online: https://www.semanticscholar.org/paper/A-Vision-of-Smarter-Cities-%3A-How-Cities-Can-Lead-a-Kulesa/f0a85e8413c1238c6c705b3fd02c38cb67933254 (accessed on 22 December 2021).
- Kanter, R.M.; Litow, S.S. Informed and Interconnected: A Manifesto for Smarter Cities; Harvard Business School General Management Unit Working Paper; 2009; Available online: http://papers.ssrn.com/sol3/papers.cfm?abstract_id=1420236 (accessed on 22 December 2021).
- Mitchell, W.J. Smart City 2020. Metropolis, April 2006. Available online: http://www.metropolismag.com/story/20060320/smart-city-2020 (accessed on 7 August 2021).
- Nam, T.; Pardo, T.A. Conceptualizing smart city with dimensions of technology, people, and institutions. In Proceedings of the 12th Annual International Digital Government Research Conference: Digital Government Innovation in Challenging Times, College Park, MD, USA, 12–15 June 2011; pp. 282–291. [Google Scholar]
- Shapiro, J.M. Smart cities: Quality of life, productivity, and the growth effects of human capital. Rev. Econ. Stat. 2006, 88, 324–335. [Google Scholar] [CrossRef]
- Hollands, R.G. Will the real smart city please stand up? Intelligent, progressive, or entrepreneurial? City 2008, 12, 303–320. [Google Scholar] [CrossRef]
- Caragliu, A.; Nijkamp, P. The impact of regional absorptive capacity on spatial knowledge spillovers: The cohen and levinthal model revisited. Appl. Econ. 2012, 44, 1363–1374. [Google Scholar] [CrossRef]
- Kim, K.; Jung, J.K.; Choi, J.Y. Impact of the smart city industry on the Korean national economy: Input-output analysis. Sustainability 2016, 8, 649. [Google Scholar] [CrossRef]
- Popova, Y. Economic Basis of Digital Banking Services Produced by FinTech Company in Smart City. J. Tour. Serv. 2021, 23, 86–104. [Google Scholar] [CrossRef]
- IGI Global. Publisher of Timely Knowledge. What Is Smart Economy. 2021. Available online: https://www.igi-global.com/dictionary/smart-city--smart-citizen--smart-economy/87778 (accessed on 13 August 2021).
- University of Alicante. Smart Economy. 2015. Available online: https://web.ua.es/en/smart/smart-economy-economia-inteligente.html (accessed on 7 October 2021).
- Apostol, D.; Balaceanu, C.; Constantinescu, E.M. Smart Economy Concept—Facts and Perspectives. International Conference European Perspective of Labor Market-Inovation, Expertness, Performance. 2015. Available online: http://www.ipe.ro/RePEc/WorkingPapers/wpconf141113.pdf (accessed on 28 November 2021).
- Kézai, P.K.; Fischer, S.; Lados, M. Smart Economy and Startup Enterprises in the Visegrád Countries—A Comparative Analysis Based on the Crunchbase Database. Smart Cities 2020, 3, 1477–1494. [Google Scholar] [CrossRef]
- Turečková, K.; Nevima, J. The Cost Benefit Analysis for the Concept of a Smart City: How to Measure the Efficiency of Smart Solutions? Sustainability 2020, 12, 2663. [Google Scholar] [CrossRef]
- Popova, Y. Economic or Financial Substantiation for Smart City Solutions: A Literature Study. Econ. Ann. XXI 2020, 83, 125–133. [Google Scholar] [CrossRef]
- Balaceanu, C.; Tilea, D.M.; Penu, D. Perspectives on Eco Economics. Circular Economy and Smart Economy. Acad. J. Econ. Stud. 2017, 3, 105–109. [Google Scholar]
- Barrett, C. Smart People, smart ideas and the right environment drive innovation. Res. Technol. Manag. 2017, 53, 40–43. [Google Scholar] [CrossRef]
- Bates, T.C.; Gupta, S. Smart groups of smart people: Evidence for IQ as the origin of collective intelligence in the performance of human groups. Intelligence 2017, 60, 46–56. [Google Scholar] [CrossRef]
- Gurashi, R. Smart people: The individual challenge of the fourth industrial revolution. In Smart Society. A Sociological Perspective on Smart Living; Iannone, R., Gurashi, R., Iannuzzi, I., de Ghantuz Cubbe, G., Sessa, M., Eds.; Routledge: London, UK, 2019; Chapter 3. [Google Scholar]
- Gurashi, R. The era of the smart people. How techno capitalism is changing the lifestyles of the individuals of the smart society. Storiadelmondo 2018, 86, 1–12. [Google Scholar]
- Kar, A.K.; Gupta, M.P.; Ilavarasan, P.V.; Dwivedi, Y.K. Advances in Smart Cities: Smarter People, Governance, and Solutions; CRC Press: Boca Raton, FL, USA, 2017. [Google Scholar]
- Pournaras, E.; Yadhunathan, S.; Diaconescu, A. Holarchic structures for decentralized deep learning: A performance analysis. Clust. Comput. 2020, 23, 219–240. [Google Scholar] [CrossRef]
- European Environment Agency. Towards Clean and Smart Mobility: Transportation and Environment in Europe; Publications Office of the European Union: Luxembourg, 2016.
- Chen, C.; Liu, J.; Li, Q.; Wang, Y.; Xiong, H.; Wu, S. Warehouse Site Selection for Online Retailers in Inter-Connected Warehouse Networks. IEEE Int. Conf. Data Min. ICDM 2017, 2017, 805–810. [Google Scholar] [CrossRef]
- Gavalas, D.; Konstantopoulos, C.; Pantziou, G. Design and management of vehicle-sharing systems: A survey of algorithmic approaches. Smart Cities Homes 2016, 3, 261–289. [Google Scholar] [CrossRef]
- Sarma, U.; Ganguly, S. Modelling and cost-benefit analysis of PEM fuel-cell-battery hybrid energy system for locomotive application. Technol. Smart-City Energy Secur. Power ICSESP 2018, 1–5. [Google Scholar] [CrossRef]
- Bataev, A.V.; Dedyukhina, N.; Nasrutdinov, M.N. Innovations in the Financial Sphere: Performance Evaluation of Introducing Service Robots with Artificial Intelligence. In Proceedings of the 9th International Conference on Industrial Technology and Management (ICITM), Oxford, UK, 11–13 February 2020; pp. 256–260. [Google Scholar] [CrossRef]
- Bibri, S. The IoT for smart sustainable cities of the future: An analytical framework for sensor-based big data applications for environmental sustainability. Sustain. Cities Soc. 2018, 38, 230–253. [Google Scholar] [CrossRef]
- Boeri, A.; Gianfrate, V.; Longo, D. Green buildings and design for adaptation: Strategies for renovation of the built environment. Int. J. Energy Prod. Manag. 2016, 1, 172–191. [Google Scholar] [CrossRef][Green Version]
- Beccali, M.; Bonomolo, M.; Galatioto, A.; Pulvirenti, E. Smart lighting in a historic context: A case study. Int. J. Manag. Environ. Qual. 2017, 28, 282–298. [Google Scholar] [CrossRef]
- Ahvenniemi, H.; Häkkinen, T. Households’ potential to decrease their environmental impacts: A cost-efficiency analysis of carbon saving measures. Int. J. Energy Sect. Manag. 2020, 14, 193–212. [Google Scholar] [CrossRef]
- Silva, B.N.; Khan, M.; Han, K. Towards sustainable smart cities: A review of trends, architectures, components, and open challenges in smart cities. Sustain. Cities Soc. 2018, 38, 697–713. [Google Scholar] [CrossRef]
- Vinod Kumar, T.M. (Ed.) E-Governance for Smart Cities; Springer: Singapore, 2015. [Google Scholar]
- Willke, H. Smart Governance: Governing the Global Knowledge Society; Campus Verlag: Frankfurt, Germany, 2007. [Google Scholar]
- European Environment Agency. Shaping the Future of Energy in Europe: Clean, Smart and Renewable; Publications Office of the European Union: Luxembourg, 2017.
- Popova, Y.; Gunare, M.; Popovs, S. Forest Stock as a Renewable Energy Resource within the Frameworks of the Concept of Sustainable Development in Latvia: Pros and Cons. Acta Oecon. Univ. Selye 2019, 8, 127–138. [Google Scholar]
- Li, X.; Chalvatzis, K.; Stephanides, P. Innovative Energy Islands: Life-Cycle Cost-Benefit Analysis for Battery Energy Storage. Sustainability 2018, 10, 3371. [Google Scholar] [CrossRef]
- Huang, M.; Fu, L.; Zhang, Y.; Gao, X. Optimal design of an island microgrid with considering scheduling optimization. In Proceedings of the 2017 International Smart Cities Conference (ISC2), Wuxi, China, 14–17 September 2017; pp. 1–6. [Google Scholar] [CrossRef]
- Bačeković, I.; Østergaard, P.A. A smart energy system approach vs a non-integrated renewable energy system approach to designing a future energy system in Zagreb. Energy 2018, 155, 824–837. [Google Scholar] [CrossRef]
- Abdullah, N.; Alwesabi, O.A.; Abdullah, R. IoT-Based Smart Waste Management System in a Smart City. In International Conference of Reliable Information and Communication Technology; Springer: Cham, Switzerland, 2018; pp. 364–371. [Google Scholar]
- European Commission. European Packaging Waste Management Systems; Main Report; European Commission: Brussels, Belgium, 2001. [Google Scholar]
- Mingaleva, Z.; Vukovic, N.; Volkova, I.; Salimova, T. Waste Management in Green and Smart Cities: A Case Study of Russia. Sustainability 2019, 12, 94. [Google Scholar] [CrossRef]
- Popova, Y.; Sproge, I. Decision-Making within Smart City: Waste Sorting. Sustainability 2021, 13, 10586. [Google Scholar] [CrossRef]
- Tambovceva, T.; Urbane, V.; Ievins, J. Innovations in Construction Waste Management: Case of Latvia. Mark. Manag. Innov. 2020, 3, 234–248. [Google Scholar] [CrossRef]
- Rodrigues Filho, B.A.; Gonçalves, R.F.; Pessôa, M.S.P. Measuring the impact of utility services for a Smart City infrastructure using an Input-Output approach. J. Phys. Conf. Ser 2018, 1065, 202003. [Google Scholar] [CrossRef]
- Tsegaye, S.; Gallagher, K.C.; Missimer, T.M. Coping with future change: Optimal design of flexible water distribution systems. Sustain. Cities Soc. 2020, 61, 102306. [Google Scholar] [CrossRef]
- Nguyen, H.P.; Le, P.Q.H.; Pham, V.V.; Nguyen, X.P.; Balasubramaniam, D.; Hoang, A.T. Application of the Internet of Things in 3E (efficiency, economy, and environment) factor-based energy management as smart and sustainable strategy. Energy Sources Part A Recovery Util. Environ. Eff. 2021, 1–23. [Google Scholar] [CrossRef]
- Khan, S.A.R.; Zhang, Y.; Anees, M.; Golpîra, H.; Lahmar, A.; Qianli, D. Green supply chain management, economic growth and environment: A GMM based evidence. J. Clean. Prod. 2018, 185, 588–599. [Google Scholar] [CrossRef]
- Schenkel, M.; Caniels, M.C.J.; Krikke, H.; Van Der Laan, E. Understanding value creation in closed loop supply chains—Past findings and future directions. J. Manuf. Syst. 2015, 37, 729–745. [Google Scholar] [CrossRef]
- Ivlev, V.Y.; Ivleva, M.L. Philosophical Foundations of the Concept of Green Economy. In Proceedings of the International Conference on Contemporary Education, Social Sciences and Ecological Studies (CESSES 2018), Moscow, Russia, 29–30 March 2018; Volume 283, pp. 869–873. [Google Scholar]
- Shaheen, K.; Zaman, K.; Batool, R.; Khurshid, M.A.; Aamir, A.; Shoukry, A.M.; Gani, S. Dynamic linkages between tourism, energy, environment, and economic growth: Evidence from top 10 tourism-induced countries. Environ. Sci. Pollut. Res. 2019, 26, 31273–31283. [Google Scholar] [CrossRef] [PubMed]
- Ahmed, Z.; Asghar, M.M.; Malik, M.N.; Nawaz, K. Moving towards a sustainable environment: The dynamic linkage between natural resources, human capital, urbanization, economic growth, and ecological footprint in China. Resour. Policy 2020, 67, 101677. [Google Scholar] [CrossRef]
- Yasmeen, H.; Wang, Y.; Zameer, H.; Solangi, Y.A. Decomposing factors affecting CO2 emissions in Pakistan: Insights from LMDI decomposition approach. Environ. Sci. Pollut. Res. 2019, 27, 3113–3123. [Google Scholar] [CrossRef]
- Popova, Y. Relations between wellbeing and transport infrastructure of the country. Procedia Eng. 2017, 178, 579–588. [Google Scholar] [CrossRef]
- Wong, K.K.K. Partial least squares structural equation modeling (PLS-SEM) techniques using SmartPLS. Mark. Bull. 2013, 24, 1–32. [Google Scholar]
- Iqbal, A.; Latif, F.; Marimon, F.; Sahibzada, U.F.; Hussain, S. From knowledge management to organizational performance: Modelling the mediating role of innovation and intellectual capital in higher education. J. Enterp. Inf. Manag. 2019, 32, 36–59. [Google Scholar] [CrossRef]
- Coltman, T.; Devinney, T.M.; Midgley, D.F.; Venaik, S. Formative versus reflective measurement models: Two applications of formative measurement. J. Bus. Res. 2008, 61, 1250–1262. [Google Scholar] [CrossRef]
- Garson, D. Partial Least Squares (PLS-SEM): Regression & Structural Equation Models; Statistical Associates Publishing, North Carolina State University: Chapel Hill, NC, USA, 2016. [Google Scholar]
- Jarvis, C.B.; Mackenzie, S.B.; Podsakoff, P.M. A critical review of construct indicators and measurement model misspecification in marketing and consumer research. J. Consum. Res. 2003, 30, 199–218. [Google Scholar] [CrossRef]
- Rossiter, J.R. The C-OAR-SE procedure for scale development in marketing. Int. J. Res. Mark 2002, 19, 1–31. [Google Scholar] [CrossRef]
- Hair, J.F.; Hult, G.T.M.; Ringle, C.M.; Sarstedt, M. A Primer on Partial Least Squares Structural Equation Modeling (PLS-SEM); Sage: Thousand Oaks, CA, USA, 2017. [Google Scholar]
- Hayes, A.F. Introduction to Mediation, Moderation, and Conditional Process Analysis: A Regression-Based Approach; Guilford Press: New York, NY, USA, 2013. [Google Scholar]
- Chin, W.W.; Cheah, J.-H.; Liu, Y.; Ting, H.; Lim, X.-J.; Cham, T.H. Demystifying the role of causal-predictive modeling using partial least squares structural equation modeling in information systems research. Ind. Manag. Data Syst. 2020, 120, 2161–2209. [Google Scholar] [CrossRef]
- Hair, J.F.; Hult, G.T.M.; Ringle, C.M.; Sarstedt, M.; Danks, N.P.; Ray, S. An Introduction to Structural Equation Modeling. In Partial Least Squares Structural Equation Modeling (PLS-SEM) Using, R. Classroom Companion: Business; Springer: Cham, Switzerland, 2021. [Google Scholar] [CrossRef]
- Shujahat, M.; Ali, B.; Nawaz, F.; Durst, S.; Kianto, A. Translating the impact of knowledge management into knowledge-based innovation: The neglected and mediating role of knowledge-worker satisfaction. Hum. Factors Ergon. Manuf. 2018, 28, 200–212. [Google Scholar] [CrossRef]
- Valaei, N.; Nikhashemi, S.R.; Javan, N. Organizational factors and process capabilities in a KM strategy: Toward a unified theory. J. Manag. Dev. 2017, 36, 560–580. [Google Scholar] [CrossRef]
- Wang, Z.; Sharma, P.N.; Cao, J. From knowledge sharing to firm performance: A predictive model comparison. J. Bus. Res. 2016, 69, 4650–4658. [Google Scholar] [CrossRef]
- Ringle, C.M.; Sarstedt, M.; Mitchell, R.; Gudergan, S.P. Partial least squares structural equation modeling in HRM research. J. Hum. Resour. Manag. Res. 2020, 31, 1617–1643. [Google Scholar] [CrossRef]
- Mateos-Aparicio, G. Partial least squares (PLS) methods: Origins, evolution, and application to social sciences. Commun. Stat. 2011, 40, 2305–2317. [Google Scholar] [CrossRef]
- Schlägel, C.; Sarstedt, M. Assessing the measurement invariance of the four-dimensional cultural intelligence scale across countries: A composite model approach. Eur. Manag. J. 2016, 34, 633–649. [Google Scholar] [CrossRef]
- Ali, F.; Rasoolimanesh, S.M.; Sarstedt, M.; Ringle, C.M.; Ryu, K. An assessment of the use of partial least squares structural equation modeling (PLS-SEM) in hospitality research. Int. J. Contemp. Hosp. 2018, 30, 514–538. [Google Scholar] [CrossRef]
- Baluch, A.M.; Salge, T.O.; Piening, E.P. Untangling the relationship between HRM and hospital performance: The mediating role of attitudinal and behavioural HR outcomes. Int. Hum. Resour. Manag. J. 2013, 24, 3038–3061. [Google Scholar] [CrossRef]
- Banks, G.C.; Kepes, S. The influence of internal HRM activity fit on the dynamics within the “black box”. Hum. Resour. Manag. Rev. 2015, 25, 352–367. [Google Scholar] [CrossRef]
- Chowhan, J. Unpacking the black box: Understanding the relationship between strategy, HRM practices, innovation and organizational performance. Hum. Resour. Manag. J. 2016, 26, 112–133. [Google Scholar] [CrossRef]
- Fernandes, V. (Re)discovering the PLS approach in management science. Management 2012, 15, 101–123. [Google Scholar]
- Ringle, C.; Da Silva, D.; Bido, D. Structural equation modeling with the Smart PLS. Braz. J. Mark. 2015, 13. [Google Scholar]
- Hair, J.F.; Risher, J.J.; Sarstedt, M.; Ringle, C.M. When to use and how to report the results of PLS-SEM. Eur. Bus. Rev. 2019, 31, 2–24. [Google Scholar] [CrossRef]
- Sarstedt, M.; Ringle, C.M.; Hair, J.F. Partial Least Squares Structural Equation Modelling. In Handbook of Market Research; Homburg, C., Klarmann, M., Vomberg, A., Eds.; Springer: Berlin/Heidelberg, Germany, 2017. [Google Scholar]
- Rahi, S. Structural Equation Modeling Using SmartPLS. Independent Publishing Platform, 2017. Available online: https://www.researchgate.net/publication/328560499_Structural_Equation_Modeling_Using_SmartPLS (accessed on 12 January 2022).
- Henseler, J.; Ringle, C.M.; Sinkovics, R.R. The use of partial least squares path modeling in international marketing. In New Challenges to International Marketing (Advances in International Marketing, Vol. 20); Emerald Group Publishing Limited: Bingley, UK, 2009; pp. 277–319. [Google Scholar] [CrossRef]
- Sarstedt, M.; Mooi, E.A. A Concise Guide to Market Research: The Process, Data, and Methods Using IBM SPSS Statistics; Springer: Berlin/Heidelberg, Germany, 2014; Chapter 7. [Google Scholar]
- Chin, W.W. The partial least squares approach for structural equation modeling. In Modern Methods for Business Research; Macoulides, G.A., Ed.; Lawrence Erlbaum Associates: Mahwah, NJ, USA, 1998; pp. 295–336. [Google Scholar]
- Höck, M.; Ringle, C.M. Strategic Networks in the Software Industry: An Empirical Analysis of the Value Continuum; IFSAM VIIIth World Congress: Berlin, Germany, 2006. [Google Scholar]
- Daskalakis, S.; Mantas, J. Evaluating the impact of a service-oriented framework for healthcare interoperability. In eHealth Beyond the Horizon; Anderson, S.K., Klein, G.O., Schulz, S., Aarts, J., Mazzoleni, M.C., Eds.; IOS Press: Amsterdam, The Netherlands, 2008; pp. 285–290. [Google Scholar]
- Wong, K.K.K. Mastering Partial Least Squares Structural Equation Modeling (PLS_SEM) with Smartpls in 38 Hours; iUniverse: Bloomington, IN, USA, 2019. [Google Scholar]
- Henseler, J.; Ringle, C.M.; Sarstedt, M. A new criterion for assessing discriminant validity in variance-based structural equation modeling. J. Acad. Mark. Sci. 2015, 43, 115–135. [Google Scholar] [CrossRef]
- Albers, S. PLS and success factor studies in marketing. In Handbook of Partial Least Squares; Springer: Berlin/Heidelberg, Germany, 2010; pp. 409–425. [Google Scholar]
- Vinzi, V.E.; Chin, W.W.; Henseler, J.; Wang, H. Perspectives on partial least squares. In Handbook of Partial Least Squares; Springer: Berlin/Heidelberg, Germany, 2010; pp. 1–20. [Google Scholar]
- Sanmukhiya, C. A PLS–SEM Approach to the UTAUT Model: The Case of Mauritius. Ann. Soc. Sci. Manag. Stud. ASM 2020, 6, 8–16. [Google Scholar] [CrossRef]
- Cohen, J. Statistical Power Analysis for the Behavioral Sciences; Lawrence Erlbaum: Mahwah, NJ, USA, 1988. [Google Scholar]
- Hair, J.F.; Hult, G.T.M.; Ringle, C.M.; Sarstedt, M. A Primer on Partial Least Squares Structural Equation Modeling; Sage: Thousand Oaks, CA, USA, 2014. [Google Scholar]
- Hair, J.F., Jr.; Sarstedt, M.; Hopkins, L.; Kuppelwieser, V.G. Partial least squares structural equation modeling (PLS-SEM): An emerging tool in business research. Eur. Bus. Rev. 2014, 26(2), 106–121. [Google Scholar] [CrossRef]
- Hussain, S.; Fangwei, Z.; Siddiqi, A.F.; Ali, Z.; Shabbir, M.S. Structural Equation Model for Evaluating Factors Affecting Quality of Social Infrastructure Projects. Sustainability 2018, 10, 1415. [Google Scholar] [CrossRef]
- Karim, R.; Latip, N.A.; Marzuki, A.; Haider, S.; Nelofar, M.; Muhammad, F. The Impact of 4Ps Marketing Mix in Tourism Development in the Mountain Areas: A Case Study. Int. J. Econ. Bus. Adm. IJEBA 2021, 9, 231–245. [Google Scholar] [CrossRef]
- Popova, Y.; Strelchonock, V. Interdependence of Factors within the Complex Evolutionary System “Social Model”. In Proceedings of the International Conference Transformation of Regional Economies: Sustainable Development and Competitiveness, Riga, Latvia, 9–11 May 2016. [Google Scholar]
- Balsalobre-Lorente, D.; Shahbaz, M.; Roubaud, D.; Farhani, S. How economic growth, renewable electricity and natural resources contribute to CO2 emissions? Energy Pol. 2018, 113, 356–367. [Google Scholar] [CrossRef]
- Ulucak, R.; Khan, S.U. Determinants of the ecological footprint: Role of renewable energy, natural resources, and urbanization. Sustain. Cities Soc. 2019, 54, 101996. [Google Scholar] [CrossRef]
- Zafar, M.W.; Zaidi, S.A.H.; Khan, N.R.; Mirza, F.M.; Hou, F.; Kirmani, S.A.A. The impact of natural resources, human capital, and foreign direct investment on the ecological footprint: The case of the United States. Resour. Pol. 2019, 63, 101428. [Google Scholar] [CrossRef]
- Ahmed, Z.; Wang, Z.; Mahmood, F.; Hafeez, M.; Ali, N. Does globalization increase the ecological footprint? Empirical evidence from Malaysia. Environ. Sci. Pollut. Res. 2019, 26, 18565–18582. [Google Scholar] [CrossRef] [PubMed]
- Charfeddine, L. The impact of energy consumption and economic development on ecological footprint and CO2 emissions: Evidence from a markov switching equilibrium correction model. Energy Econ. 2017, 65, 355–374. [Google Scholar] [CrossRef]
- Destek, M.A.; Ulucak, R.; Dogan, E. Analyzing the environmental Kuznets curve for the EU countries: The role of ecological footprint. Environ. Sci. Pollut. Res. 2018, 25, 29387–29396. [Google Scholar] [CrossRef]
- Baloch, M.A.; Mahmood, N.; Zhang, J.W. Effect of natural resources, renewable energy and economic development on CO2 emissions in BRICS countries. Sci. Total Environ. 2019, 678, 632–638. [Google Scholar] [CrossRef]
- Hassan, S.T.; Xia, E.; Khan, N.H.; Mohsin, S.; Shah, A. Economic growth, natural resources, and ecological footprints: Evidence from Pakistan. Environ. Sci. Pollut. Res. 2018, 26, 2929–2938. [Google Scholar] [CrossRef] [PubMed]
- Sarkodie, S.A. The invisible hand and EKC hypothesis: What are the drivers of environmental degradation and pollution in Africa? Environ. Sci. Pollut. Res. 2018, 25, 21993–22022. [Google Scholar] [CrossRef] [PubMed]
- Dean, R.T.; Dunsmuir, W. Dangers and uses of cross-correlation in analyzing time series in perception, performance, movement, and neuroscience: The importance of constructing transfer function autoregressive models. Behav. Res. Methods 2016, 48, 783–802. [Google Scholar] [CrossRef] [PubMed]
Publisher’s Note: MDPI stays neutral with regard to jurisdictional claims in published maps and institutional affiliations. |
© 2022 by the authors. Licensee MDPI, Basel, Switzerland. This article is an open access article distributed under the terms and conditions of the Creative Commons Attribution (CC BY) license (https://creativecommons.org/licenses/by/4.0/).