Abstract
The effects of climate change are growing more and more evident, and this is caused by the increase in CO2 emissions. Fossil fuel exhaustion and the need for electricity in remote areas have encouraged researchers to advance and develop the renewable energy sector. One type of clean energy technology is vertical water turbines that have low efficiency. This paper aims to design and simulate a novel close-ended, guided deflector to improve the efficiency of vertical turbines. This research used the dynamic mesh technique to evaluate the concept after the deflector was designed, and a grid independence study, a boundary sensitivity study, and a timestep sensitivity study were implemented to ensure the accuracy of the results. Then, we used the sliding mesh model to determine the performance of four rotors. The results from the dynamic mesh model showed that the straight rotor with the proposed deflector was not suitable for operating in the deflector, and the concept is static and does not rotate. However, the others showed a valid concept in the proposed deflector. For the sliding mesh technique, the results indicated a common trend: all the rotors’ performances increased when tip speed ratio (TSR) increased, and the highest amount of the power coefficient (Cp) was found at higher TSRs, such as 1.3 and 1.4, with around 0.45 in the cross flow type. A three-dimensional simulation was conducted of the cross flow type with the proposed deflector, and a similar trend was found. Nevertheless, around a 5% difference was found between the 3D and 2D results for cross flow. The deflector can significantly improve the performance after 0.7 TSR to reach over 0.42 Cp at 1.3 TSR, whereas, without the deflector, the performance reduces to approximately 0.1 Cp at the same TSR.
1. Introduction
Social and economic growth is strongly related to improvements in the energy sector [1]. There are many methods for generating electricity. The primary way to produce electricity is by burning fossil fuels because their cost is relatively reasonable, and they can be exploited easily. Nevertheless, over the last decade, the rapid increase of fossil fuel usage has caused a global fossil fuel crisis and many environmental issues [2,3]. Using environmentally friendly energy sources is an effective technique for mitigating fossil fuel exploitation and carbon emissions [4,5]. Small-scale hydropower turbines can help to provide electricity to rural areas in developing countries since 10% of the global population lived without electricity according to 2019 data [6]. In addition, many areas in Malaysia, especially East Malaysia, suffer from a lack of electricity due to their distant location from cities [7]. These rural areas depend on fossil fuel generators. Pulau Perhentian, for example, one of the minor Malaysian islands, is powered by approximately 200 kW generators [7,8]. Other significant examples of islands in Malaysia that do not have enough electricity are Pulau Tioman, Pulau Redang, and Pulau Layang-Layang [9]. Moreover, there are a lot of off-grid areas on the mainland, like Kemar in Perak [10], Kalabakan in Sabah [11], and Kampung Opar in Sarawak [12]. On top of that, operation and maintenance (O&M) costs over the long-term are expensive [7], and it is worth mentioning that the fuel cost could be around four times more expensive in these areas due to the transportation cost [13,14,15].
Water turbines produce electricity from the moving water of the sea, river, or canal by changing the kinetic power in the stream into electrical energy [16]. Hydropower turbines can be divided into two categories: horizontal turbines (HAWT) and vertical turbines (VAWT) [17]. Vertical water turbines are preferable in small-scale water turbines because they can respond to the water stream from any direction, and their maintenance cost is relatively low [18]. The vertical turbine has many rotors, such as the in-plane axis, Darrieus, Gorlov, and Savonius.
1.1. The State of the Art
The two common methods of developing and enhancing turbines are to improve the turbines’ fluid efficiency or increase the incoming velocity by using a nozzle, establishing man-made channels, locating the turbine after a slope, or using a duct to make the turbine rotate faster. For these two methods, researchers have performed numerous experimental and computational studies to improve vertical turbines. On one hand, researchers like Hassanzadeh and Mohammed Nejad studied the overlap ratio of a typical Savonius turbine, with overlap values of −0.1, −0.2, −0.3, 0.1, 0.2, and 0.3, and they found that the 0.2 inward overlap ratio accounts for the best efficiency, while −0.3 offers the lowest efficiency [19]. Others studied the aerofoil for the Darrieus turbine, which has a significant impact on the performance of vertical turbines. The main objective was to evaluate the effect of twelve aerofoil-controlling parameters by implementing an orthogonal algorithm and computational fluid dynamic (CFD), and the result showed the best aerofoil power of coefficient (Cp) to be 13.6, which is higher than the NACA 0015 aerofoil [20]. In another study, numerous variations were used to optimize the Gorlov type of turbine by using laminar flow analysis by Ansys Fluent, and variables, with an error of 10%,of a pitch angle at 30° and 40°, a dimension ratio of 450 in diameter, a hydrofoil type of S1210, and the number of blades being 2, 3, 4, 5, or 6. The simulation result for the study found that the highest turbine performance is acquired by the NACA 0012 hydrofoil, with a 40° pitch angle [21]. On the other hand, Elbartran et al. studied the use of a duct nozzle on a Savonius turbine, at a Reynolds number of 1.32 × 10⁵. The researchers found that the nozzle could improve the efficiency of the turbine such that it reached 78% [22]. Another researcher investigated an impinging jet duct system on a Savonius turbine and concluded that using such a duct can increase the efficiency such that it reached 0.5 at 0.6 TSR [23]. In the study by Mosbahi et al. [24], an experiment and a CFD analysis were carried out to assess the use of a deflector in an irrigation channel. The authors investigated three different deflector types, and the results found that the peak value of performance with the deflector in use was increased by 17.47%. Other researchers predicted the optimal mean of the tip speed ratio (TSR) due to the effect of TSR on the performance of a vertical turbine with a deflector by implementing the Taguchi method and high-fitting neural network [25]. They found that the Cp value could be improved up to 3.58-fold under the optimal mean of TSR. Researchers like Beaumont et al. investigated the inclusion of the deflector [26]. Their results found that an optimized axisymmetric deflector enhanced the power of coefficient over the whole operating range of the turbine, and they also found that the average starting torque increased by 30%.
The tidal power in Malaysia is not well used or understood due to the complexity of the geographical area [27]. Furthermore, water levels are not deep enough and have low water velocity, which makes it hard to generate a huge amount of electricity from small-scale turbines in Malaysia [14]. Even though there are many studies on improving large-scale turbines, the number of studies on improving small-scale turbines is limited [15,28]. In addition, the majority of designed water turbine deflectors are not directional and only work in the stream direction. Therefore, this study aims to make a CFD analysis for a novel, close-ended, guided deflector to increase the water velocity and improve vertical turbines, like the Savonius, which is widely known for its poor performance [29,30,31].
1.2. Methodology
The primary methodology used in this study was that, after conducting a literature review, the deflector was created with the required parameters and designed by SolidWorks. Then, a CFD simulation using ANSYS Fluent 19.2 was conducted for the deflector. Several rotors—straight, cross flow, H-Darrieus, and Savonius—were used to assess the deflectors’ performance. Before the performance was assessed, a grid independence study, a boundary sensitivity study, and a timestep sensitivity study were implemented to ensure accuracy. The dynamic mesh technique was utilized to verify the concepts of each rotor with 2D and 3D simulation, and then a 2D sliding mesh technique was used to determine the performance. For the comparison of the results, rotors were simulated without the deflector, and 3D simulation was conducted for the highest performance rotor in the proposed deflector.
2. The Design
A typical cross-flow turbine is made of a runner with a horizontal shaft, having a certain number of blades (from 11 up to 37) [32], arranged radially and tangentially. At the core of the turbine, there is a rotor whose blades have a circular cross-section [33]. Cross flow turbines can achieve high efficiency easily, such as 80% or above [31], whereas vertical turbines for freestreams, like Savonius and Darrieus, cannot reach such high efficiency. However, the cross-flow turbine needs special equipment to be installed, a stationary place, high pressure and velocity, and a duct or slot to direct water in a close stream. For this reason, this study adopted the deflector from the cross-flow turbine, as Figure 1 shows, and developed it so as to be suitable for open-stream applications with much lower velocities than the cross-flow stationary turbine. The main idea of the design is to transform the nozzle from the typical cross-flow turbine into a deflector for the proposed deflector, with different inlet points, as Figure 2 shows. The process of the design can be summarized as: First, the nozzle of the typical cross-flow was rotated by 30o to touch the x-axis of the rotor (W1W2 line), and then, the inlet duct of the cross-flow typical turbine was modified to be the close-ended type. After that, the whole new deflector was reflected around the y-axis (RE) within an angle. The duct was reflected for the second time around the W1W2 line to have a symmetrical shape with the first deflector around point F, as shown in Figure 2. When the water comes from the left-hand side to the right-hand side, it enters the deflector from points A and B and follows curves AC and BD. The majority of the water leaves the deflector between points C and D. This symmetrical design and the guided deflector allow the rotor to rotate in the same direction, regardless of the stream direction.
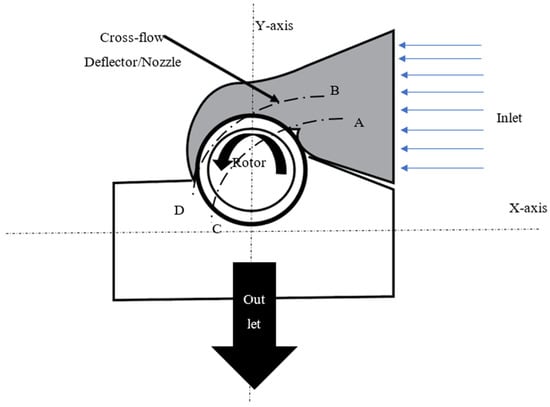
Figure 1.
Typical cross-flow turbine.
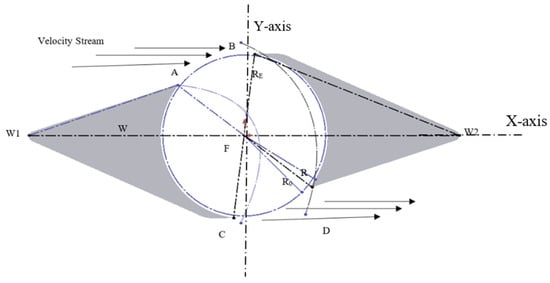
Figure 2.
Close-ended, guided deflector design: horizontal cross-section.
The deflector was then extruded to have three dimensions. The deflector for a small size can be used as a floating turbine, as shown in Figure 3, or it can be ground-fixed in a river or the sea, as illustrated Figure 4.
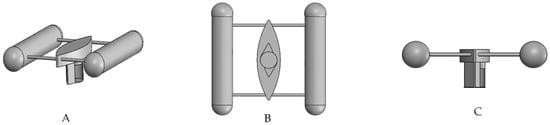
Figure 3.
CAD model: (A) Isometric view; (B) Bottom view; (C) Front view of the floating deflector.
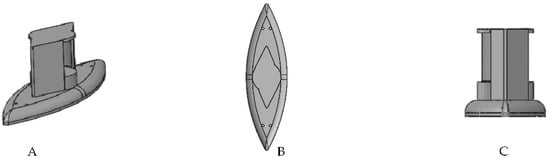
Figure 4.
CAD model: (A) Isometric view; (B) Bottom view; (C) Front view of the ground-fix.
The simulation was performed, taking into consideration the Malaysian environment, with an inlet velocity of 0.56 m/s, the lowest water velocity in Malaysia [32]. The maximum mechanical power in Watts contained in a freestream is given by [33,34,35]:
where is the maximum available power in Watts, in kg/m3 is the medium density, and the velocity of the fluid is defined by v in m/s. The cross-sectional area in this equation is defined by A, which can be defined as the product of diameter (D) and height (H) in meters.
On the other hand, the power extracted from the rotor in Watts, is given by:
where T in N.m is the torque extracted by the turbine, and is the angular velocity of the turbine in rad/s.
From these equations, the performance of the turbine, which is dimensionless, is defined as:
Another measure of the turbine performance is the torque coefficient, which is given by:
The performance coefficient of the turbine depends on the tip speed ratio that is the ratio of the tip velocity to the freestream velocity. The tip speed ratio (TSR) is given:
2.1. The Rotors
For the Savonius rotor, the dimensions and rotor design were taken from Yaakob et al.’s study [36], and for the H-Darrieus rotor type, the designing data were taken from the study of Alaimo et al. [37]. The cross-flow rotor designing data were taken from Du et al. [38], whereas the straight-blade was designed as a typical blade, straight blade rotor, with 17 blades. All the rotors were scaled down to have comparative advantages, and the dimensions were selected to be 0.316 and 0.26 m for the diameter and height, respectively. The scale equation is given by [39]:
where is the ratio scaled version to model in m, L is the length, d is the diameter, H is the height of the turbine, and the subscripts refer to the scaled version and model parameter, respectively.
2.2. Mesh and Computational Domain
After modeling in SolidWorks, the deflector and rotor underwent a meshing process, as displayed in Figure 5. For the mesh generation, an unstructured mesh was constructed because structured mesh requires a sophisticated setup to be applied. In addition, the structured mesh has a rigid connectivity motif, whereas the unconstructed does not have such patterns. The tetra and prism shape of the unconstructed mesh were generated to obtain more flexibility. Moreover, it was crucial to consider a grid-independence comparison study since it had a significant impact on the solution [40,41]. For all the tests of the mesh independence study, the same Ansys solver, velocity inlet, TSR boundary conditions, simulation settings, and timestep were taken to ensure that the mesh size was the only variable. The unstructured 2D mesh was used to mesh the rotating and outer domains. For all the meshes, the TSR was 0.8, the water inlet was 0.56 m/s, and the time was 10 sec for each simulation. In addition, skewness and orthogonality of the mesh were considered. As shown in Figure 6, the number of cells was gradually increased by a factor of two, and the right number of cells was chosen when the performance (Cp) remained stable. For Savonius, 2d cross flow, H-Darrieus, and straight turbines in the proposed deflector, the suitable number of cells was around 6.1 × 10⁵. Moreover, the number of cells for 3D cross flow was around 1.6 × 10⁷, as Figure 7 shows.
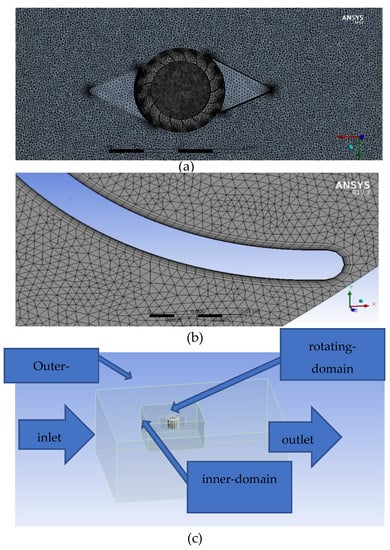
Figure 5.
Mesh images in 3D; (a) cross-sectional image for 3D-meshing; (b) a close image to 2D blade; (c) the boundary conditions.
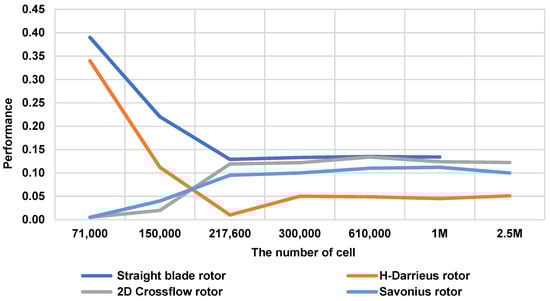
Figure 6.
Grid independence study for the four rotors.
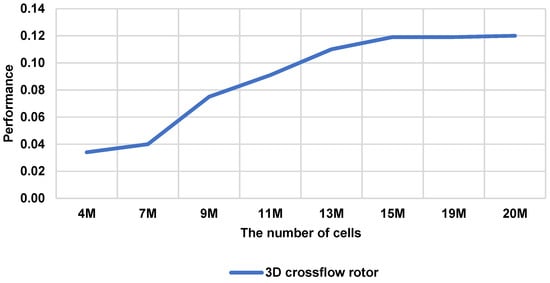
Figure 7.
Grid independence study for the 3D cross flow.
In 2D and 3D simulations, the boundary conditions were divided into three sections: outer domain, inner domain, and rotating domain. The main reason for that was to increase the mesh at the critical points (the turbine blades) and reduce the computational time. The minimum size of the stationary domain used 20 times the rotor radius on each side of the turbine, whereas the outflow boundary should be around 30 times the rotor radius to minimize the effect of backflow that could occur during the simulation [42,43]. Moreover, a boundary condition sensitivity study was conducted to ensure the accuracy of the assumption. For this test, the boundary was enlarged gradually to check the effect of the increase of the boundary on the solution, and it was found after the domains were enlarged that there was no significant change in the results. To allow the fluid to penetrate all domains, the interfaces were defined. In this case, there were two interfaces, which were the rotating-inner interface and the inner-upper.
2.3. Simulation Setting
A dynamic mesh technique was used to check the feasibility of the double-guided deflector in the floating turbine. Six Degrees of Freedom solver (6DOF) was utilized to give the freedom to the turbine to rotate to mimic the actual circumstances in a river or the sea. The Implicit Update option was enabled to update the mesh to avoid any interruption in the solver. Three types of mesh motion were implemented: the Smoothing Method, the Dynamic Layering, and the Remeshing Method. Smoothing was used to modify the mesh, and the interior nodes of the mesh had the ability to move. However, this did not change the number of nodes and their connectivity so that the nodes absorbed the movement of the boundary. For this analysis, diffusion-based smoothing was used. When this type of smoothing is used, the mesh motion is governed by the equation:
where is the mesh displacement velocity in m/s, and is the diffusion coefficient.
The boundary conditions were assigned by users prescribed or 6DOF boundary motion. When the boundaries deform, the mesh is tangent to the boundary. Equation (7) also describes how the boundary motion diffuses into the deforming mesh. can be used to control how the boundary motion has an impact on the interior mesh movement. If the coefficient is constant, the boundary motion diffuses uniformly in the mesh, but the mesh tends to move together if it is a nonuniform diffusion coefficient.
Dynamic layering is used to add or remove layers of cells adjacent to the moving boundary, and this depends on the layer’s adjacent height to the moving surface. A height-based option was used for this analysis because the cells were split to create a layer of cells with a constant height and a layer of cells of height. To implement the dynamic layering, the split factor and collapse factor were specified, which are the factors that determine when a layer of cells near a moving boundary is split or merged with the adjacent cell layer. The split factor and collapse values factor were reduced to enhance the layering, with 0.2 and 0.15, respectively. The cells can deteriorate if the boundary displacement is larger than the local cell sizes. This can lead to deforming the mesh and convergence problems when the next timestep is initiated, so the remeshing option was activated to avoid this problem.
The choice of turbulence model is based on many factors, like the physics of the flow, the established practice for a specific class of problem, the level of accuracy required, the available computational resources, and the amount of time available for the simulation. For this study, the model K-omega was selected. This model has two helping closures built into it, which are share-stress transport (SST) and baseline (BSL). The SST model was chosen for this research because it has extra features that make it more accurate and reliable for many cases, such as aerofoils, transonic shock waves, and turbines, than the standard BSL model [44,45]. The choice of this model helped the turbulence damping, inclusion of curvature correction, inclusion of compressibility effects, and inclusion of production limiters. In addition, this model can accurately capture shear stress distribution in the boundary layer and predict adverse pressure gradient flows [46].
The primary method used for this study was pressure-implicit with splitting of operators (PISO), which is based on the higher degree of the approximate relation between the corrections for pressure and velocity. PISO offers extra corrections to the problem, and these corrections are neighbor correction and skewness correction. In addition, this method is proven to be a lot more suitable for all transient cases, especially when a large timestep is needed [47].
For this study, the initialization method was the hybrid initialization method because it consists of a collection of ways and boundary interpolation methods, which are solved by Laplace’s equations to find the velocity, temperature, turbulence, pressure, species fractions, etc. These were automatically patched, depending on the domain averaged values or a specific interpolation collection.
To find the suitable timestep size and the number of timesteps, a timestep sensitivity study was conducted. The simulation was initiated by a very large number of timesteps, and the output was observed until the solution became stable so that further iterations would not alter the solution. It was found that, after reaching approximately 1000 timesteps, the solution was stable, and a further increase in the number of timesteps would not have an effect on the average of the output solution, as shown in Figure 8. According to the number of timesteps acquired from the simulation, the effect of changing timestep size was calculated by Ansys, and it was found that 0.005 is the optimum size for timesteps for all the rotors in 2D and 3D simulations, concerning the simulation time.
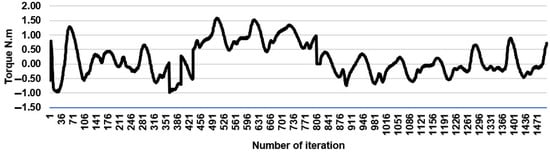
Figure 8.
Torque for timestep sensitivity study.
3. Results and Discussion
3.1. Deflector Simulation
As presented in Figure 9, the first simulation was for the deflector itself, and it can be seen that the core of the deflector is divided into two parts, low- and high-velocity regions. That is the same prediction made while designing the deflector, as illustrated in Figure 2. The high-velocity arc follows AC and BD designing curves, and this can be seen in Figure 10, where the streamlines follow AC and BD designing curves. The primary behavior of the water in the core of the deflector can be seen in Figure 11. The water was directed to behave as a vortex to rotate the turbine, which could positively affect the overall performance because the water velocity significantly increased inside the deflector.
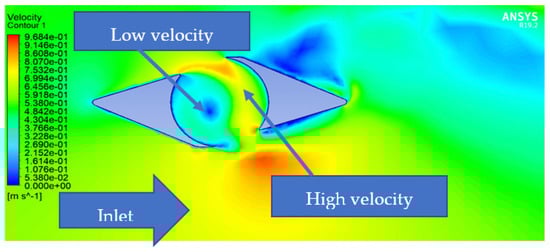
Figure 9.
Velocity contour of the deflector.
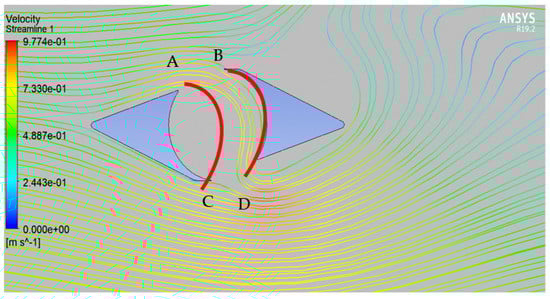
Figure 10.
Streamline for the deflector.
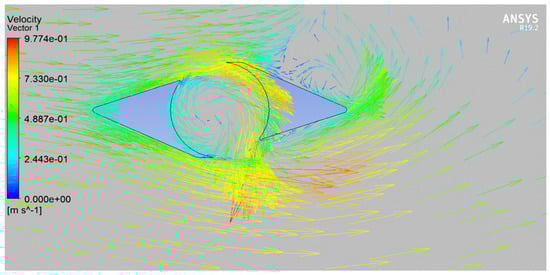
Figure 11.
Vector diagram of the deflector.
3.2. The Rotors Simulation
All four of the rotors in the deflector were tested by the dynamic mesh technique to prove the concept. The dynamic mesh model moved the boundary of a cell zone in sync with other boundaries of the zone to modify the mesh accordingly. The nodes of the cells were updated in the unsteady mode, and the volume mesh was automatically updated by Ansys Fluent at each point of the timesteps, depending on the updated positions of the boundaries. The angular velocity of the rotor was calculated from the force balance on the turbine rotor, which is established by the 6DOF solver. For the straight blade rotor, the result of the dynamic mesh showed that the concept was not valid, the rotor was static, and it did not rotate. In addition, this turbine experienced negative and positive torque, so that it stopped rotating, and it can be seen in Figure 12 that the velocity around the rotor was almost zero, or very low. For the rest, all of them were proven to be valid by using the dynamic mesh technique. After that, as shown in Figure 13, Figure 14 and Figure 15, they underwent the sliding mesh technique to assess the performance. The nodes in the sliding mesh rigidly moved in a specified mesh region, and multiple cell zones were bonded with one another by non-conformal interfaces. For this model, the mesh motion was prescribed so that the zones stayed connected through the non-conformal interfaces. As can be seen from the velocity contour figures, the velocity at the deflector was at its highest point. From the vector contour figures, the water behavior can be seen. In addition, there was a high-velocity area at the entrance of the deflector, while a low-velocity area was at the damping area. This can reduce the torque on the returning blade and increase the torque on the advancing blade. That can significantly improve the performance. Figure 16 shows the performance of the rotors with the deflector in action. It can be seen that all the rotors had the same trend, and this is to say, the higher the TSR is, the higher the performance will be. The cross flow rotor with the deflector in action accounted for the highest tested performance among the three turbines.
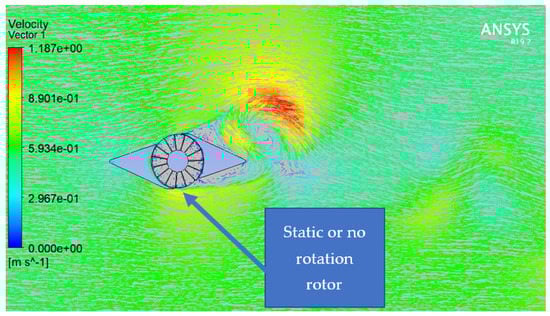
Figure 12.
Straight blade rotor in the double guiding deflector.
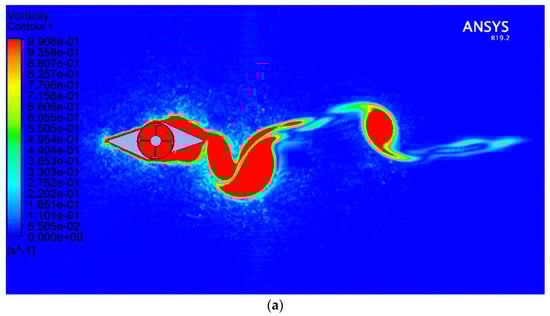
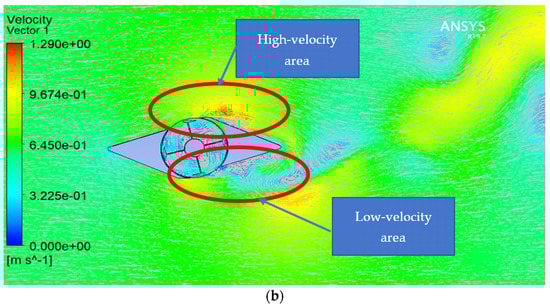
Figure 13.
H-Darrieus 2D simulation: (a) velocity contour; (b) vector contour.
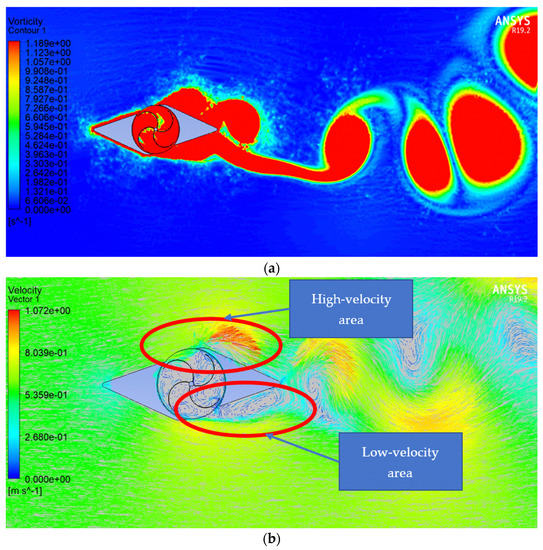
Figure 14.
Savonius 2D simulation: (a) velocity contour; (b) vector contour.
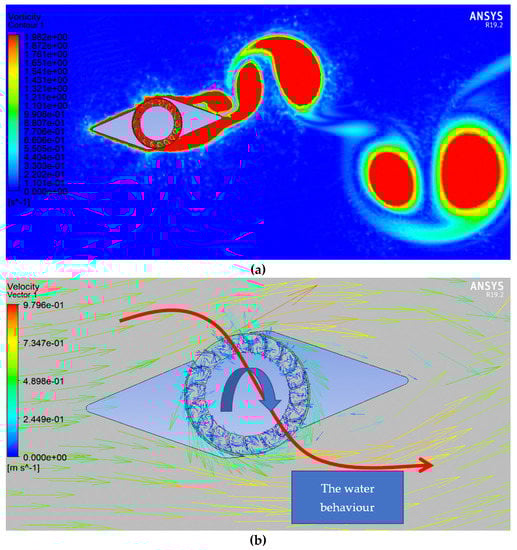
Figure 15.
Cross flow 2D simulation: (a) velocity contour; (b)vector contour.
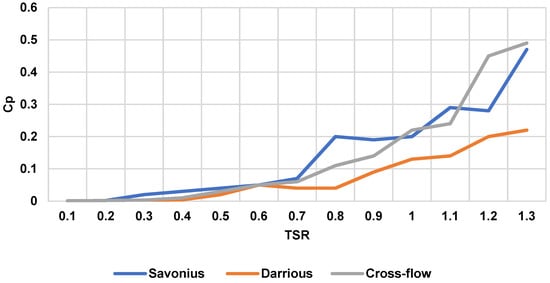
Figure 16.
The performance curves in three different turbines.
3.3. The Effect of the Deflector
The Savonius rotor was used to simulate the turbine with and without the deflector to assess the effectiveness of the deflector. Figure 17 shows the difference in performance between the Savonius turbine with and without the deflector. Without the deflector, the performance of the turbine decreased after approximately 0.8 TSR and reached its lowest performance at around 1.2 TSR, as shown in Figure 17, while, with the use of the deflector, the turbine performance rose dramatically from 0.2 Cp at 0.8 TSR to reach 0.45 Cp at 1.3 TSR.
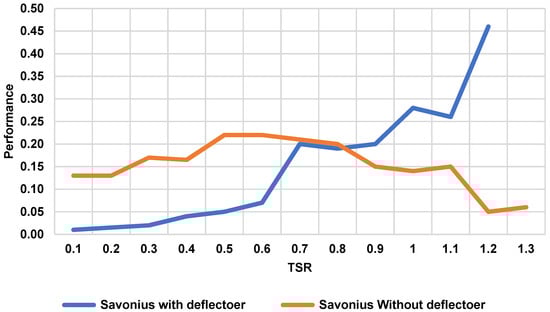
Figure 17.
Savonius performance with and without the deflector.
To understand the reason for the performance increase after 0.8 TSR, the concept of negative torque acting on a vertical turbine should be considered. A typical Savonius turbine has two blades fixed into a central shaft, creating an S-shape. A blade with a concave surface facing the coming inlet is known to be the advancing blade, while another with a convex surface is called the returning blade. As presented in Figure 18, the working principle of a vertical turbine is that there is a force difference between the two blades [48]. When the turbine rotates, the advancing blade collects water from the inlet, while another deflects the water. As a result, the drag force acting on the advancing blade is more than that on the returning blade [49]. These drag forces create a positive torque on the advancing blade (taking the counter-clockwise direction as positive) and a negative torque on the returning blade that hinders turbine rotational motion [50]. Since there is a difference between the forces, a net positive torque can be acquired. For the proposed deflector, there is a double-guided deflector so that the negative torque will be reduced. This is the reason that the performance in the turbine is higher after 0.8TSR compared to the others. In other words, the rotating turbine will not need much force to deflect the incoming water, and this is considered an advantage and a possible way to improve the vertical turbines, especially those turbines that have a high negative torque, as do Savonius turbines.
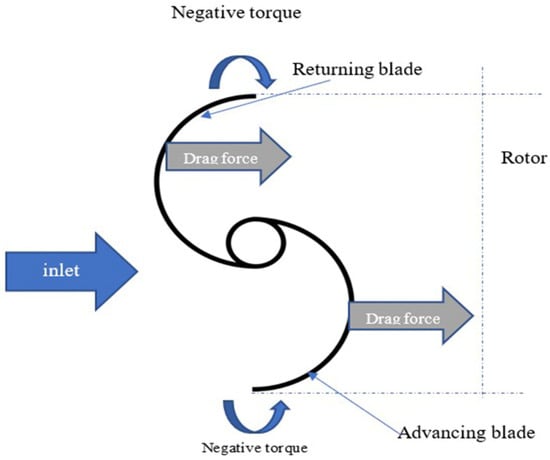
Figure 18.
Drag forces and torques on the blades.
3.4. 3D Simulation
A 3D simulation was also conducted to validate the 2D results. Figure 19 in wireframe mode shows the fluid flow, and Figure 20 in solid mode shows the velocity contour. The performance of the 3D cross flow rotor with the deflector, as shown in Figure 21, was almost the same as the 2D cross flow rotor with the deflector. The difference between the 2D and 3D was approximately 6%, which is considered insignificant and negligible. The same trend can be obtained from the 3D simulation. When the TSR increases, the performance increases as well. The sudden increase at point 0.8 TSR can be justified as simulation noise, which is a common by-product of CFD [51].
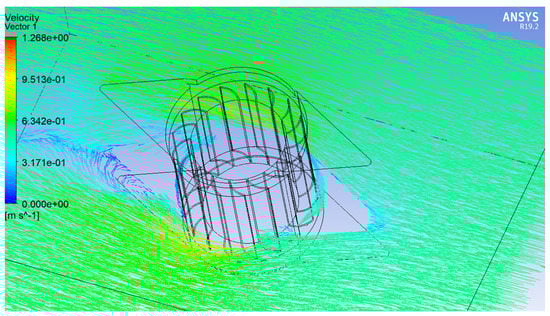
Figure 19.
Vector for 3D simulation.
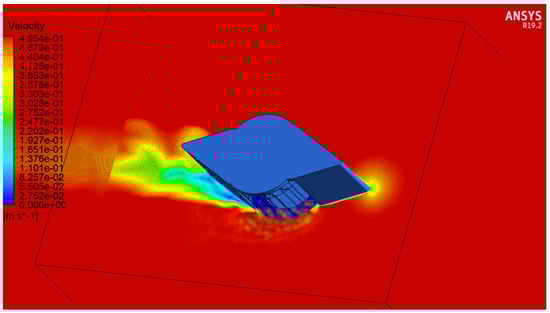
Figure 20.
Velocity contour for 3D simulation.
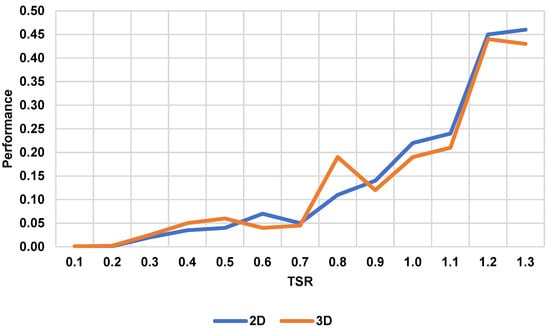
Figure 21.
2D and 3D comparison performance curve.
4. Conclusions and Recommendation
This study started with finding the parameters from the literature review, such as water speed and depth in Malaysia, and designing the deflector, inspired by the typical stationary cross flow turbine. For the concept evaluation, four different rotors (straight, cross flow, H-Darrieus, and Savonius) were used after simulating the flow behavior of the deflector. Then, a 2D simulation by dynamic mesh approach was implemented to verify the concept. Before that, a grid independence study, a boundary sensitivity study, and a timestep sensitivity study were conducted to ensure that these parameters would not affect the solution. From the dynamic mesh analysis, it was found that a straight blade turbine is not suitable for the deflector, and the concept is not valid. However, all the rest were unmistakably valid concepts in the proposed deflector. A sliding mesh technique was utilized to assess the performance from 0.2 to 1.4 TSR, and each test was repeated four times. There was a common trend that all rotors’ performances increased when TSR increased. Then, to validate the 2D, a 3D simulation was conducted on the cross flow type, and a similar trend was found. Nevertheless, around a 5% difference was found between the 3D and 2D results for cross flow. The highest Cp was obtained at higher TSRs, such as 1.3 and 1.4, with around 0.45 in the cross flow type. Therefore, it can be concluded that the studied deflector is suitable for high TSR. The deflector can boost the performance when used after 0.7 TSR and reach over 0.44 Cp in Savonius rotors, while, without the deflector, it cannot reach more than 0.25.
To explore the full potential of the deflector, this research recommends the following: it is recommended to use a DOE (design of experiment) approach to conduct a parametric study of the deflector. This could be done by using a full factorial design or the Taguchi method. It is also recommended to explore the full range of performance over 1.4 TSR to observe the peak point of the performance, including small- and large-scale deflectors. Further research should be done on investigating the negative torque on the blades because it plays an important role in determining the performance. More dynamic-mesh analysis should be conducted for the floating deflector type to improve the stability of the turbine, with different types of waves and turbulence. Finally, an experimental approach should be considered to verify the simulation results.
Author Contributions
Conceptualization, M.B.Z.Y.A.-q. and S.S.; methodology, M.B.Z.Y.A.-q. and S.S.; software, S.S.; validation, S.S. and H.M.K.; formal analysis, M.B.Z.Y.A.-q.; investigation, M.B.Z.Y.A.-q.; resources, S.S.; data curation, M.B.Z.Y.A.-q.; writing—original draft preparation, M.B.Z.Y.A.-q.; writing—review and editing, M.B.Z.Y.A.-q., S.S., H.M.K., J.A.A.-R. and F.M.-S.; visualization, M.B.Z.Y.A.-q. and F.M.-S.; supervision, S.S. and H.M.K.; project administration, S.S.; funding acquisition, S.S., H.M.K., J.A.A.-R. and F.M.-S. All authors have read and agreed to the published version of the manuscript.
Funding
This work is supported by the Universiti Teknologi Malaysia (UTM) under Research University Grants Q.K130000.3601.03M09, which rendered the financial support provided for this study. This work is partially supported by the Ministry of Higher Education Fundamental Research Grant Scheme R.K130000. 7801.5F490 and Q.K130000. 7856. 5F276. F.M-S. acknowledged the contribution from Edinburgh Napier University through Starter Research and Innovation Grants (Reference No REG2021/22). The Article Processing Charges (APC) were funded by Agencia Nacional de Investigación y Desarrollo (ANID) through the projects Fondecyt regular 1200055 and Fondef ID19I10165 and by the Universidad Técnica Federico Santa María (UTFSM) through the project PI_m_19_01.
Data Availability Statement
Not applicable.
Conflicts of Interest
The authors declare no conflict of interest. The funders had no role in the design of the study; in the collection, analyses, or interpretation of data; in the writing of the manuscript; or in the decision to publish the results.
References
- Ivanovski, K.; Hailemariam, A.; Smyth, R. The effect of renewable and non-renewable energy consumption on economic growth: Non-parametric evidence. J. Clean. Prod. 2021, 286, 124956. [Google Scholar] [CrossRef]
- Elkadeem, M.; Wang, S.; Sharshir, S.W.; Atia, E.G. Feasibility analysis and techno-economic design of grid-isolated hybrid renewable energy system for electrification of agriculture and irrigation area: A case study in Dongola, Sudan. Energy Convers. Manag. 2019, 196, 1453–1478. [Google Scholar] [CrossRef]
- Masdari, M.; Tahani, M.; Naderi, M.H.; Babayan, N. Optimization of airfoil Based Savonius wind turbine using coupled discrete vortex method and salp swarm algorithm. J. Clean. Prod. 2019, 222, 47–56. [Google Scholar] [CrossRef]
- Samarakoon, M.; Ranjith, P.; Rathnaweera, T.; Perera, M. Recent advances in alkaline cement binders: A review. J. Clean. Prod. 2019, 227, 70–87. [Google Scholar] [CrossRef]
- Zeren, F.; Akkuş, H.T. The relationship between renewable energy consumption and trade openness: New evidence from emerging economies. Renew. Energy 2020, 147, 322–329. [Google Scholar] [CrossRef]
- Bank, T.W. Access to Electricity. Available online: https://data.worldbank.org/indicator/EG.ELC.ACCS.ZS (accessed on 7 July 2021).
- Chok, E.-T.; Lim, Y.S.; Chua, K.H. Novel fuzzy-based control strategy for standalone power systems for minimum cost of electricity in rural areas. Sustain. Energy Technol. Assess. 2019, 31, 199–211. [Google Scholar] [CrossRef]
- Ashourian, M.H.; Cherati, S.M.; Zin, A.M.; Niknam, N.; Mokhtar, A.S.; Anwari, M. Optimal green energy management for island resorts in Malaysia. Renew. Energy 2013, 51, 36–45. [Google Scholar] [CrossRef]
- Lau, K.Y.; Tan, C.W.; Yatim, A.H.M. Photovoltaic systems for Malaysian islands: Effects of interest rates, diesel prices and load sizes. Energy 2015, 83, 204–216. [Google Scholar] [CrossRef]
- Aziz, K.; Shamsudin, K. TNB Experience in Developing Solar Hybrid Station at RPS Kemar, Gerik, Perak Darul Ridzuan. In IOP Conference Series: Earth and Environmental Science; IOP Publishing: Bristol, UK, 2013; Volume 16, p. 012145. [Google Scholar]
- Rural Electrification in East Malaysia—Achieving Optimal Power Generation System and Sustainability of Rural Electrification Projects. Available online: https://www.diva-portal.org/smash/get/diva2:967355/FULLTEXT01.pdf (accessed on 24 April 2021).
- Chua, K.H.; Lim, Y.S.; Morris, S. A novel fuzzy control algorithm for reducing the peak demands using energy storage system. Energy 2017, 122, 265–273. [Google Scholar] [CrossRef]
- Lau, K.Y.; Yousof, M.; Arshad, S.; Anwari, M.; Yatim, A. Performance analysis of hybrid photovoltaic/diesel energy system under Malaysian conditions. Energy 2010, 35, 3245–3255. [Google Scholar] [CrossRef]
- Kai, L.Y.; Sarip, S.; Kaidi, H.M.; Ardila-Rey, J.A.; Samsuddin, N.M.; Muhtazaruddin, M.N.; Muhammad-Sukki, F.; Aziz, S.A. Current Status and Possible Future Applications of Marine Current Energy Devices in Malaysia: A Review. IEEE Access 2021, 9, 86869–86888. [Google Scholar] [CrossRef]
- Abdullah, C.; Mad Kaidi, H.; Sarip, S.; Shafie, N. Small Scale Standalone Solar and Tidal Hybrid Power System in Isolated Area. Renew. Energy Focus 2021, 39, 59–71. [Google Scholar] [CrossRef]
- Nunes, M.M.; Mendes, R.C.; Oliveira, T.F.; Junior, A.C.B. An experimental study on the diffuser-enhanced propeller hydrokinetic turbines. Renew. Energy 2019, 133, 840–848. [Google Scholar] [CrossRef]
- Ayodele, T.; Ogunjuyigbe, A.; Amusan, T. Wind power utilization assessment and economic analysis of wind turbines across fifteen locations in the six geographical zones of Nigeria. J. Clean. Prod. 2016, 129, 341–349. [Google Scholar] [CrossRef]
- Mosbahi, M.; Ayadi, A.; Chouaibi, Y.; Driss, Z.; Tucciarelli, T. Performance improvement of a novel combined water turbine. Energy Convers. Manag. 2020, 205, 112473. [Google Scholar] [CrossRef]
- Hassanzadeh, R.; Mohammadnejad, M. Effects of inward and outward overlap ratios on the two-blade Savonius type of vertical axis wind turbine performance. Int. J. Green Energy 2019, 16, 1485–1496. [Google Scholar] [CrossRef]
- Chen, J.; Pan, X.; Wang, C.; Hu, G.; Xu, H.; Liu, P. Airfoil parameterization evaluation based on a modified PARASEC method for a H-Darrious rotor. Energy 2019, 187, 115910. [Google Scholar] [CrossRef]
- Wardhana, W.; Keniraras, N.; Pratama, R.; Rahmawati, S. Hydrodynamics Performance Analysis of Vertical Axis Water Turbine (VAWT) Gorlov Type Using Computational Fluid Dynamics (CFD) Approach. In IOP Conference Series: Earth and Environmental Science; IOP Publishing: Bristol, UK, 2021; Volume 698, p. 012022. [Google Scholar]
- Elbatran, A.; Ahmed, Y.M.; Shehata, A.S. Performance study of ducted nozzle Savonius water turbine, comparison with conventional Savonius turbine. Energy 2017, 134, 566–584. [Google Scholar] [CrossRef]
- Thakur, N.; Biswas, A.; Kumar, Y.; Basumatary, M. CFD analysis of performance improvement of the Savonius water turbine by using an impinging jet duct design. Chin. J. Chem. Eng. 2019, 27, 794–801. [Google Scholar] [CrossRef]
- Mosbahi, M.; Elgasri, S.; Lajnef, M.; Mosbahi, B.; Driss, Z. Performance enhancement of a twisted Savonius hydrokinetic turbine with an upstream deflector. Int. J. Green Energy 2021, 18, 51–65. [Google Scholar] [CrossRef]
- Chen, W.-H.; Wang, J.-S.; Chang, M.-H.; Hoang, A.T.; Lam, S.S.; Kwon, E.E.; Ashokkumar, V. Optimization of a vertical axis wind turbine with a deflector under unsteady wind conditions via Taguchi and neural network applications. Energy Convers. Manag. 2022, 254, 115209. [Google Scholar] [CrossRef]
- Aboujaoude, H.; Beaumont, F.; Murer, S.; Polidori, G.; Bogard, F. Aerodynamic performance enhancement of a Savonius wind turbine using an axisymmetric deflector. J. Wind Eng. Ind. Aerodyn. 2022, 220, 104882. [Google Scholar] [CrossRef]
- Goh, H.-B.; Lai, S.-H.; Jameel, M.; Teh, H.-M.; Chin, R.-J. Feasibility assessment of tidal energy extraction at the Tg Tuan coastal headland: A numerical simulation study. Sustain. Energy Technol. Assess. 2020, 38, 100633. [Google Scholar] [CrossRef]
- Muratoglu, A.; Yuce, M.I. Design of a river hydrokinetic turbine using optimization and CFD simulations. J. Energy Eng. 2017, 143, 04017009. [Google Scholar] [CrossRef]
- Yahya, W.; Ziming, K.; Juan, W.; Qurashi, M.S.; Al-Nehari, M.; Salim, E. Influence of tilt angle and the number of guide vane blades towards the Savonius rotor performance. Energy Rep. 2021, 7, 3317–3327. [Google Scholar] [CrossRef]
- Alom, N. Influence of curtain plates on the aerodynamic performance of an elliptical bladed Savonius rotor (S-rotor). Energy Syst. 2021, 13, 265–280. [Google Scholar] [CrossRef]
- Mosbahi, M.; Lajnef, M.; Derbel, M.; Mosbahi, B.; Driss, Z.; Aricò, C.; Tucciarelli, T. Performance improvement of a Savonius water rotor with novel blade shapes. Ocean Eng. 2021, 237, 109611. [Google Scholar] [CrossRef]
- Behrouzi, F.; Nakisa, M.; Maimun, A.; Ahmed, Y.M. Global renewable energy and its potential in Malaysia: A review of Hydrokinetic turbine technology. Renew. Sustain. Energy Rev. 2016, 62, 1270–1281. [Google Scholar] [CrossRef]
- Rehman, W.; Rehman, F.; Malik, M.Z. A Review of Darrieus Water Turbines. In ASME Power Conference; American Society of Mechanical Engineers: New York, NY, USA, 2018; Volume 51401, p. V002T012A015. [Google Scholar]
- Behrouzi, F.; Maimun, A.; Nakisa, M. Review of various designs and development in hydropower turbines. Int. J. Mech. Mechatron. Eng. 2014, 8, 293–297. [Google Scholar]
- Demircan, E. Design and Analysis of a Vertical Axis Water Turbine for River Applications Using Computational Fluid Dynamics; Middle East Technical University: Ankara, Turkey, 2014. [Google Scholar]
- Yaakob, O.; Ismail, M.A.; Ahmed, Y.M. Parametric study for Savonius vertical axis marine current turbine using CFD simulation. In Proceedings of the 7th International Conference on Renewable Energy Sources (RES’13), Kuala Lumpur, Malaysia, 2–4 April 2013; Asia-Pacific Workshop on Marine Hydrodynamics. pp. 200–205. [Google Scholar]
- Alaimo, A.; Esposito, A.; Messineo, A.; Orlando, C.; Tumino, D. 3D CFD analysis of a vertical axis wind turbine. Energies 2015, 8, 3013–3033. [Google Scholar] [CrossRef] [Green Version]
- Du, J.; Shen, Z.; Yang, H. Study on the effects of runner geometries on the performance of inline cross-flow turbine used in water pipelines. Sustain. Energy Technol. Assess. 2020, 40, 100762. [Google Scholar] [CrossRef]
- Chanson, H. 14-Physical modelling of hydraulics. In Hydraulics of Open Channel Flow, 2nd ed.; Chanson, H., Ed.; Butterworth-Heinemann: Oxford, UK, 2004; pp. 253–274. [Google Scholar] [CrossRef]
- Abuan, B.; Howell, R. Effect of Idealised Unsteady Flow to the Performance of Horizontal Axis Tidal Turbine. In Proceedings of the 2nd Asian Wave and Tidal Conference, Marina Bay Sands, Singapore, 24–28 October 2016. [Google Scholar]
- Ashwindran, S.; Azizuddin, A.; Oumer, A. Computational fluid dynamic (CFD) of vertical-axis wind turbine: Mesh and time-step sensitivity study. J. Mech. Eng. Sci. 2019, 13, 5604–5624. [Google Scholar] [CrossRef]
- Mohamed, M.; Janiga, G.; Pap, E.; Thévenin, D. Optimal blade shape of a modified Savonius turbine using an obstacle shielding the returning blade. Energy Convers. Manag. 2011, 52, 236–242. [Google Scholar] [CrossRef]
- Akwa, J.V.; da Silva Júnior, G.A.; Petry, A.P. Discussion on the verification of the overlap ratio influence on performance coefficients of a Savonius wind rotor using computational fluid dynamics. Renew. Energy 2012, 38, 141–149. [Google Scholar] [CrossRef]
- Menter, F.R. Two-equation eddy-viscosity turbulence models for engineering applications. AIAA J. 1994, 32, 1598–1605. [Google Scholar] [CrossRef] [Green Version]
- Guide, F.U.s. Turbulence Model. 2019. Available online: https://ansyshelp.ansys.com/account/secured?returnurl=/Views/Secured/corp/v221/en/flu_ug/flu_ug_sec_turb_choosing.html?q=Turbulence%20Model (accessed on 3 March 2021).
- Hellsten, A. Some improvements in Menter’s k-omega SST turbulence model. In Proceedings of the 29th AIAA, Fluid Dynamics Conference, Albuquerque, NM, USA, 15–18 June 1998; p. 2554. [Google Scholar] [CrossRef]
- Guide, F.U.s. Solution Model. 2019. Available online: https://ansyshelp.ansys.com/account/secured?returnurl=/Views/Secured/corp/v221/en/flu_ug/flu_beta_aero_solve.html?q=.%20Solution%20Model (accessed on 24 March 2020).
- Akwa, J.V.; Vielmo, H.A.; Petry, A.P. A review on the performance of Savonius wind turbines. Renew. Sustain. Energy Rev. 2012, 16, 3054–3064. [Google Scholar] [CrossRef]
- Kamoji, M.; Kedare, S.; Prabhu, S. Experimental investigations on single stage, two stage and three stage conventional Savonius rotor. Int. J. Energy Res. 2008, 32, 877–895. [Google Scholar] [CrossRef]
- Salleh, M.B.; Kamaruddin, N.M.; Mohamed-Kassim, Z. Savonius hydrokinetic turbines for a sustainable river-based energy extraction: A review of the technology and potential applications in Malaysia. Sustain. Energy Technol. Assess. 2019, 36, 100554. [Google Scholar]
- Gilkeson, C.; Toropov, V.; Thompson, H.; Wilson, M.; Foxley, N.; Gaskell, P. Dealing with numerical noise in CFD-based design optimization. Comput. Fluids 2014, 94, 84–97. [Google Scholar] [CrossRef] [Green Version]
Publisher’s Note: MDPI stays neutral with regard to jurisdictional claims in published maps and institutional affiliations. |
© 2022 by the authors. Licensee MDPI, Basel, Switzerland. This article is an open access article distributed under the terms and conditions of the Creative Commons Attribution (CC BY) license (https://creativecommons.org/licenses/by/4.0/).