Article

The Outbreak of COVID-19 Pandemic in Relation to Sense of Safety and Mobility Changes in Public Transport Using the Example of Warsaw

by
Zuzanna Kłos-Adamkiewicz
and
Piotr Gutowski
*
Institute of Management, University of Szczecin, 8 Cukrowa Street, 71-004 Szczecin, Poland
*
Author to whom correspondence should be addressed.
Sustainability 2022, 14(3), 1780; https://doi.org/10.3390/su14031780
Submission received: 16 December 2021 / Revised: 7 January 2022 / Accepted: 22 January 2022 / Published: 4 February 2022

Abstract

:
Worldwide, many different actions have been taken by local and national governments to control the spread of COVID-19. The impact of these measures can be seen in different areas, especially in passenger transport and travel behaviour. This study examines the changes that have occurred in travel behaviour, using the example of the capital city of Warsaw, Poland, in relation to measures undertaken to control the spread of COVID-19 and the sense of safety among passengers that was supposed to be provided by public transport organisers. Data were collected through an online survey questionnaire that included questions about past (before COVID-19) and present (during COVID-19) travel behaviour, mode choice and the frequency of trips by public transport users in Warsaw. The results showed significant changes in mobility and travel behaviour along with most common threats seen by public transport users. There was a major shift from public to individual modes of transport in the city area. The outcomes of this study could play a significant role in transport planning in the case of any other situation that affects public transport on such a level as the COVID-19 pandemic has. In particular, local and national authorities could use this knowledge for better planning for any type of lockdowns.

1. Introduction

The outbreak of the COVID-19 pandemic showed that, at times of a higher risk of infection (also during the time of seasonal influenza), people are less secure about their health and sense of safety when using public transport.
Since the start of the pandemic in 2020, much work and research has been conducted to understand its impact on different aspects of life. This paper presents a small but very important insight into an aspect of everyday life and daily mobility, and concentrates, in detail, on public transport users. It also addresses the sense of health and safety, also described as personal security (these phrases will be used alternately), which relates to the possibility of becoming infected in mass transit vehicles.
The article firstly presents an in-depth literature overview, which concentrates on existing findings about changes in mobility, and provides a description of selected European cities that have faced major decreases in public transport usage along with changes in daily mobility. The next part describes phases of the pandemic’s spread and the restrictions enforced by the Polish government. The fourth part shows the definition of perceived safety in public transport during the time of the pandemic. The case study of this article is the capital city of Warsaw, Poland, and basic statistics concerning public transport in this city during pandemics are presented in this section. Then, the methodology of the research and research results are presented. The research is followed by correlation statistics, the conclusion and discussion.
The novelty of this research is based on the description of the effects of the pandemic on public transport usage when subjective attitudes and personal safety became the main factor for choosing the mode of transport. It will show, in the case of Poland, Warsaw, what the travel options were during the pandemic period. Nevertheless, those studies did not analyse passengers’ feelings in terms of travel safety, which can be understood as the assessment of measures undertaken by public transport operators to prevent the spread of the virus.

2. Literature Review

The existing literature provides plenty of analyses of travel behaviour, where such behaviour has been shaped by economic factors and physical infrastructure, as well as social and cultural forces [1,2,3,4,5,6]. Social norms significantly impact individual and group behaviour [7]. Therefore, economic and physical interventions alone are inadequate to deliver behavioural change and bring in forms of sustainable mobility, such as public transport [8,9,10,11]. Social norms, along with pro-environmental attitudes, are important when delivering sustainable behaviour change and, in particular, travel behaviour change [12,13,14]. In relation to this, it is important to look for incentives for travel behaviour in the time of the COVID-19 pandemic [15].
The case of the COVID-19 pandemic is unprecedented, and it is having an exceptional impact worldwide, including on most transport modes. The effects of the pandemic on mobility behaviour are not surprising, as in this type of case, societies respond similarly. In previous years, outbreaks of most known influenza viruses, such as SARS (2003), “swine flu” (2009) [16] and “bird flu”(2013) [17], had a huge impact on transportation, but mainly on selected areas where it occurred, and it did not spread as widely as COVID-19 has [18,19,20]. In cases of pandemics, people avoid crowded places, delay or cancel their travel plans and, in particular, use public transport less, as it is a key preventive measure [17,21,22].
It is worth noting that the scale of the previous flu epidemics was not as large as COVID-19, and the safety measures undertaken at national and local levels were less restrictive. Most of the behavioural adaptations were the result of the individual decisions of people trying to avoid the risk of transmission. Mostly, they were free to move where and how they preferred [23].
The spread of COVID-19 caused multiple restrictions that affected daily routines and mobility, in most cases including restrictions on travel, movement and activity participation in many countries around the world. Some countries (e.g., China, Spain, Poland) have implemented lockdowns on different scales, which covered the whole country or selected regions, whereas other countries (e.g., The Netherlands, Sweden) have been less strict with social distancing measures [24,25]. In most of the cases, lockdown policies reduced daily mobility (like in most European countries), but research also shows that in many United States counties, in which mobility restrictions were only recommended but not imposed, mobility did not decrease significantly [24]. On the other hand, in the case of international travel restrictions, these types of restrictions can reduce the rate of the spread of the virus; however, for the local level (public transport in the cities), mobility restriction measures are counterproductive for low-income urban sectors [25].
It is obvious, and confirmed by numerous studies from India [26,27], the Netherlands [28], Japan [29], Switzerland [30], Sweden [31,32], the USA [33], Germany [21], Australia, [34], Italy [35], globally [36,37,38,39] and more, that travel patterns have changed during the pandemic.
As the article concentrates on a European city, it is also important to show changes in mobility in other European countries that struggled through the different waves of the pandemic. The main research findings are presented in Table 1.
The pandemic, as mentioned before, had a huge impact on mobility, as some people started to work/study/learn from home, and most of out-of-home activities, cultural events and centres (gyms, cinemas, etc.) were closed. As a result, travel demand decreased, which could be observed mainly on car traffic (with a positive effect, such as a decrease in air pollution and congestion) and in public transport (which resulted in a lower number of services) [48,49,50]. People were also more interested in home food and goods deliveries purchased online, which also resulted in a smaller number of trips [22].

3. Restrictions during COVID-19 Pandemic in Poland

The degree of restrictions depends on the government policy (and additional regional or local restrictions), and particularly on different campaigns that affect the perception of the pandemic [51]. As the pandemic of COVID-19 grew, along with WHO recommendations, the Polish government began implementing restrictions and limitations to stop the spread of the virus. Table 2 shows the timeline of restrictions implemented in Poland and the time scope of the survey [52,53,54].
Warsaw is the capital city of Poland, which is one of the developing countries in Europe. The public transport organiser is Zarząd Transportu Miejskiego w Warszawie (ZTM, Eng.: Public Transport Authority in Warsaw). It has implemented additional restrictions for the public transport, including (information provided from Zarząd Transportu Miejskiego w Warszawie (ZTM)):
  • All public transport stops became permanent, and there were no longer “on demand” stops. This was implemented to help people avoid touching elements (such as handrails, buttons and validators, etc.) in the vehicles (16 March 2020);
  • Drivers in public transport vehicles were obliged to open doors at every stop (which gave them the opportunity to change the air in the vehicle);
  • People who started working from home could suspend their long-term public transport ticket (from 16 March 2020);
  • When the number of passengers started to drop, the public transport organizer (ZTM) introduced Saturday timetables, but on the lines that were still overcrowded in rush hours, additional vehicles were directed (from 23 March 2020);
  • Due to government restrictions, which put limits on public transport vehicles, when only half of the available seats could be used, the normal timetable was restored (25 March 2020);
  • Airport rail lines operated on shorter distance, as there was no longer any need to carry people to the airport, as flights were shut (from 29 March 2020);
  • ZTM put information about the limitations to the number of passengers on the entrance doors to public transport vehicles;
  • ZTM assigned people to make observations to ensure that the public transport vehicles were not overcrowded, and to assess if there was a necessity to implement additional lines to meet the restriction limits;
  • ZTM prepared a list of procedures aimed at minimizing the risk of the spread of the virus among drivers and passengers including:
    Procedures for dealing with passengers and employees who could have been suspected of having the COVID-19 disease;
    Transport operators were recommended to disinfect daily the vertical/horizontal handrails, buttons and validators installed in the vehicles;
    A protection zone near the first door of the vehicle has been designated as an excluded space for passengers in order to minimize the contact between passengers and drivers;
    Cooperation with police officers was established in order to jointly control the obligation to wear a protective mask;
    Information campaigns were carried out in the form of posters and short movies on vehicle screens, informing about present restrictions and the rules of safe travel in public transport, etc.
  • Since the 14th of May 2021, ZTM provided an additional bus line that transports people to a municipal vaccination point located at the football stadium.

4. The Perceived Safety of Public Transport in the Time of Pandemic

It is understandable that during any time of higher risk of infection (i.e., seasonal influenza), not mentioning during the pandemic, people feel less secure about their health. Existing research does not prove whether mass transportation systems should be closed during pandemics. There is always a risk of the transmission of influenza in mass transportation systems [53] and, indisputably, social distancing measures have clear, direct positive effects on health, as they are implemented to help people avoid becoming infected [24,54,55,56]. There is often confusion between the potential public health effects of closing public transport during pandemics (which, in theory, should delay the spread of the virus through the population), versus the individual benefit of avoiding public transport (which may lower the risk of infection) [57,58,59,60].
Several factors contribute to making public transport a place of high risk for further spread of the virus:
  • People huddle in confined spaces, so the possibility of infection increases with the level of passenger occupancy in the vehicles and stations;
  • It might be difficult to identify and control people who may be sick, as a person infected with the COVID-19 virus is contagious before showing any symptoms;
  • The existence of multiple surfaces (e.g., seats, handrails, doors, and ticket machines) that easily transfer germs.
As there is no specific definition about the perceived risk of becoming infected in public spaces, both the terms personal safety and health security are being used alternately. Safety is one of the most significant factors to have an impact on influencing public transport satisfaction [61]. On the one hand, travel restrictions have significantly affected people’s mobility behaviour [60]; on the other, people’s sense of health security has also been shaken. It is believed that perceptions of personal safety have a significant influence on public transport ridership [61]. This paper mainly relates to the sense of safety in terms of health and avoiding the possible infection of different types of disease, rather than personal safety related to crime risk. Passenger proximity presents a COVID-19 transmission risk, which may reduce perceived safety and, as many studies about the pandemic show, the number of people travelling on public transport [62]. At the beginning of the COVID-19 pandemic, very little was known about the route of virus transmission and the infection itself [63,64]. The lack of information caused situational uncertainty, and then psychological distress, such as increased anxiety.

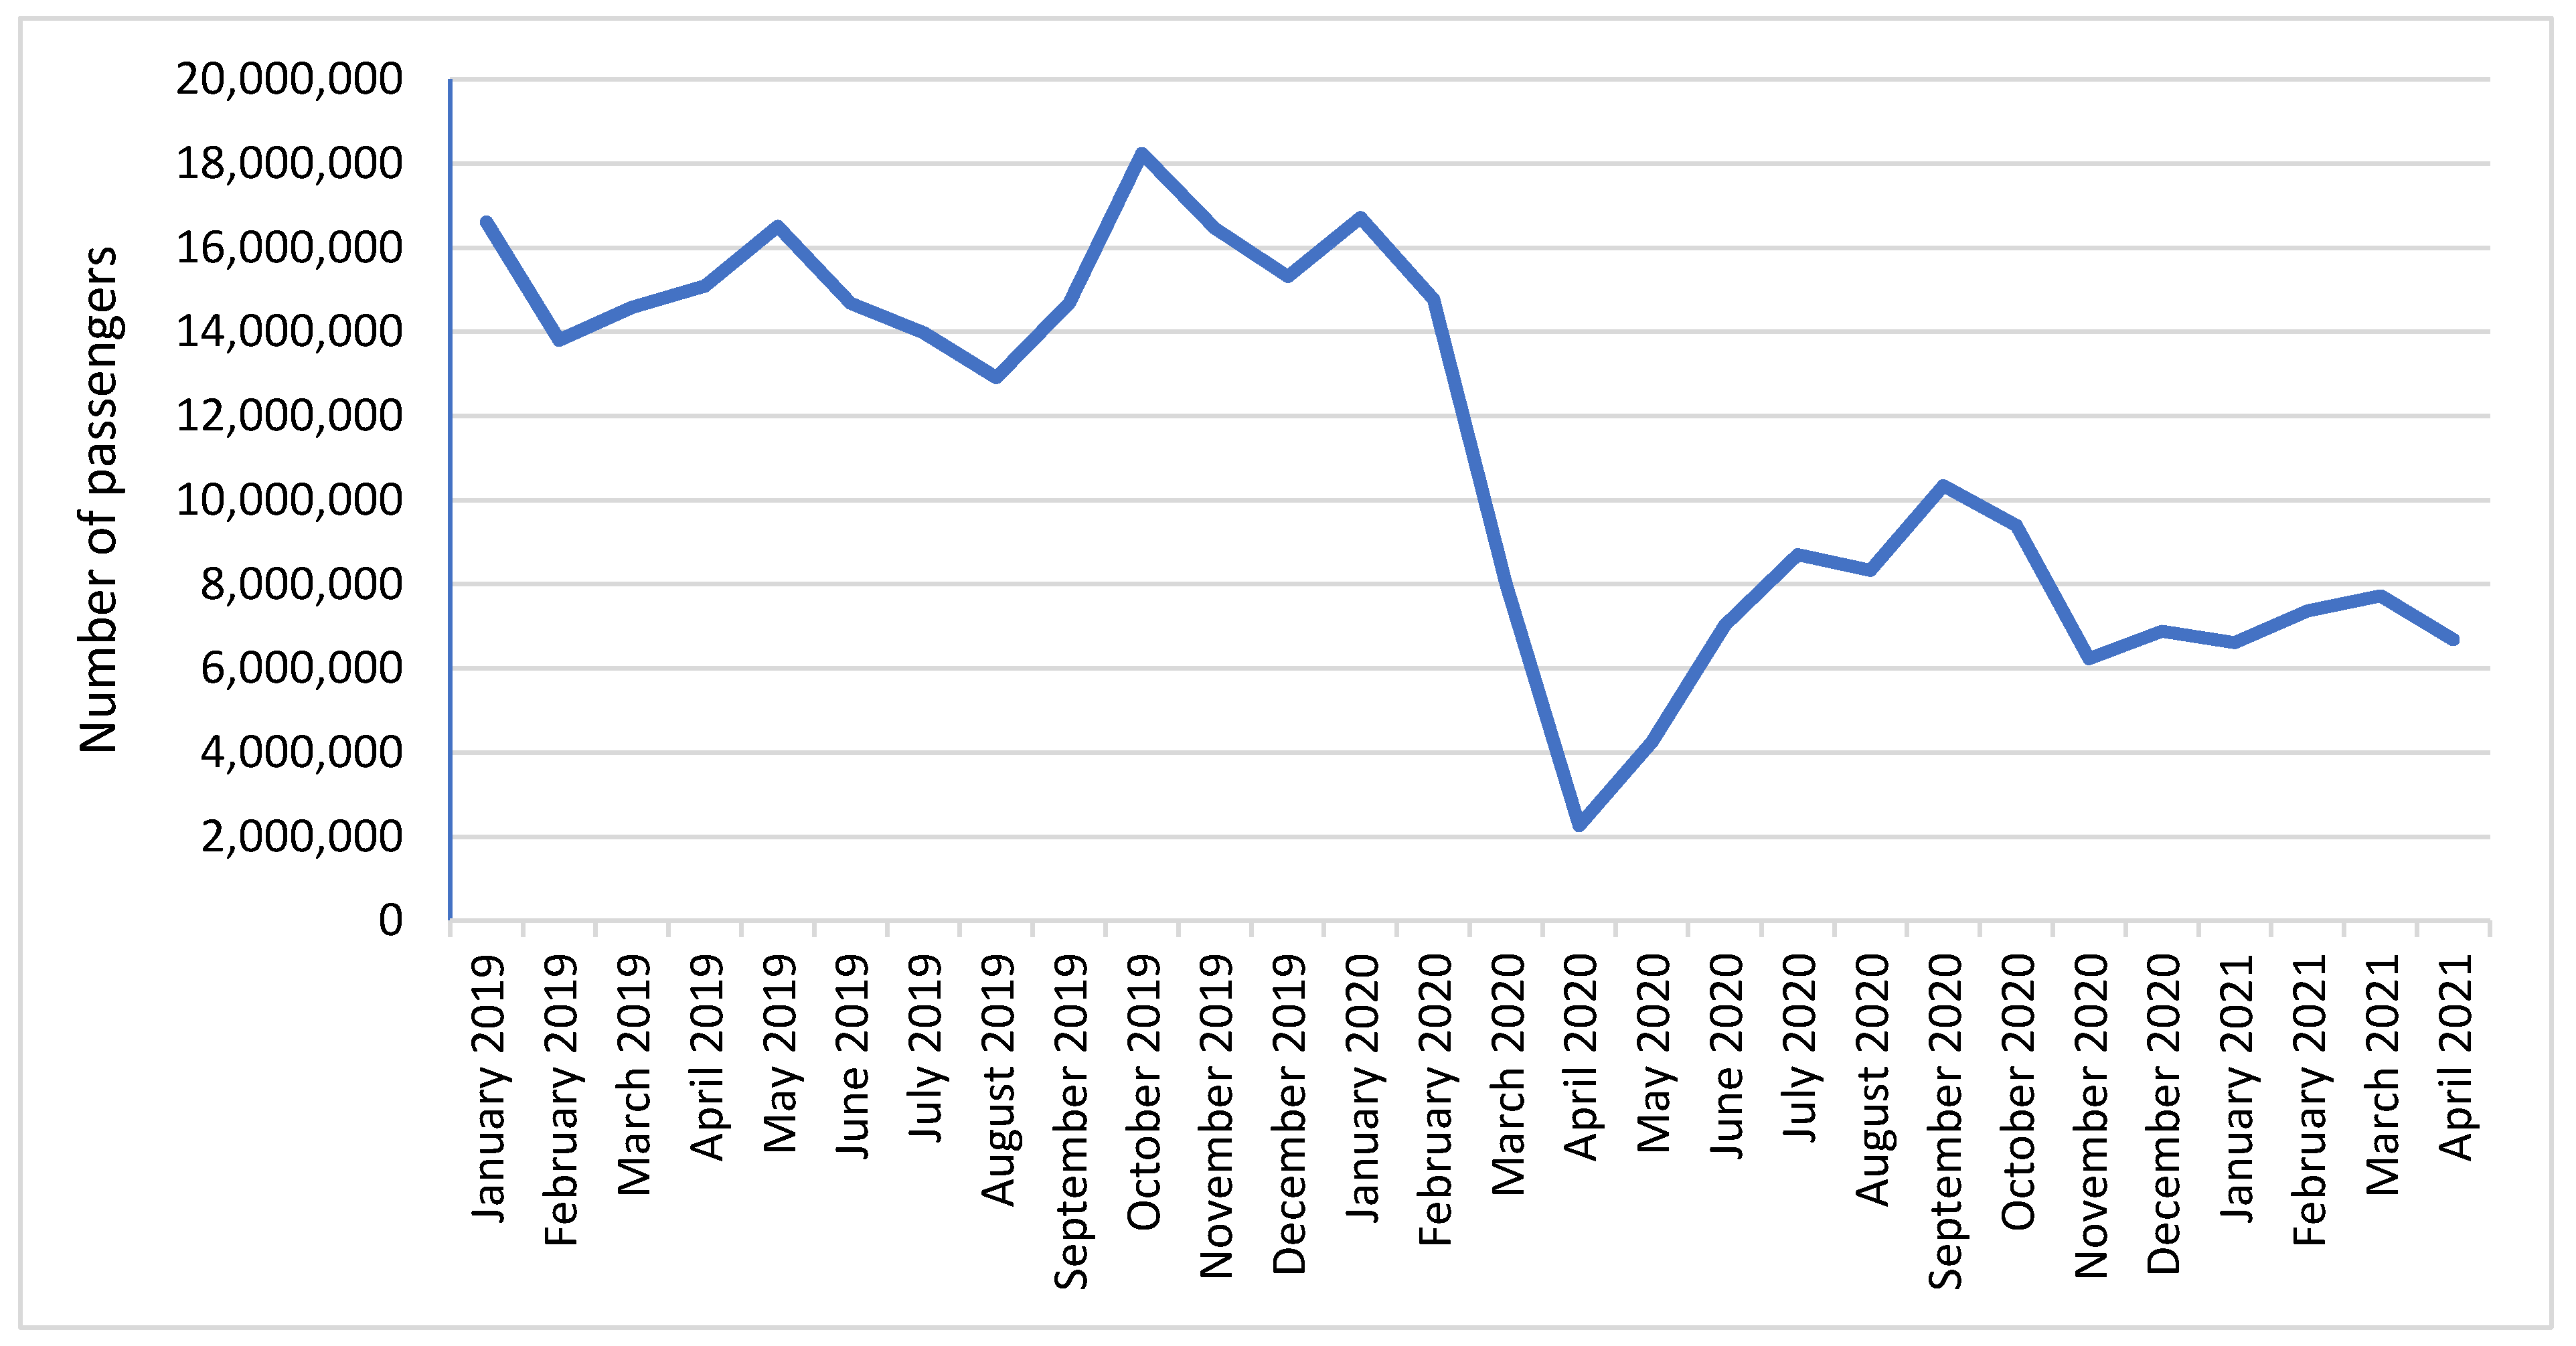
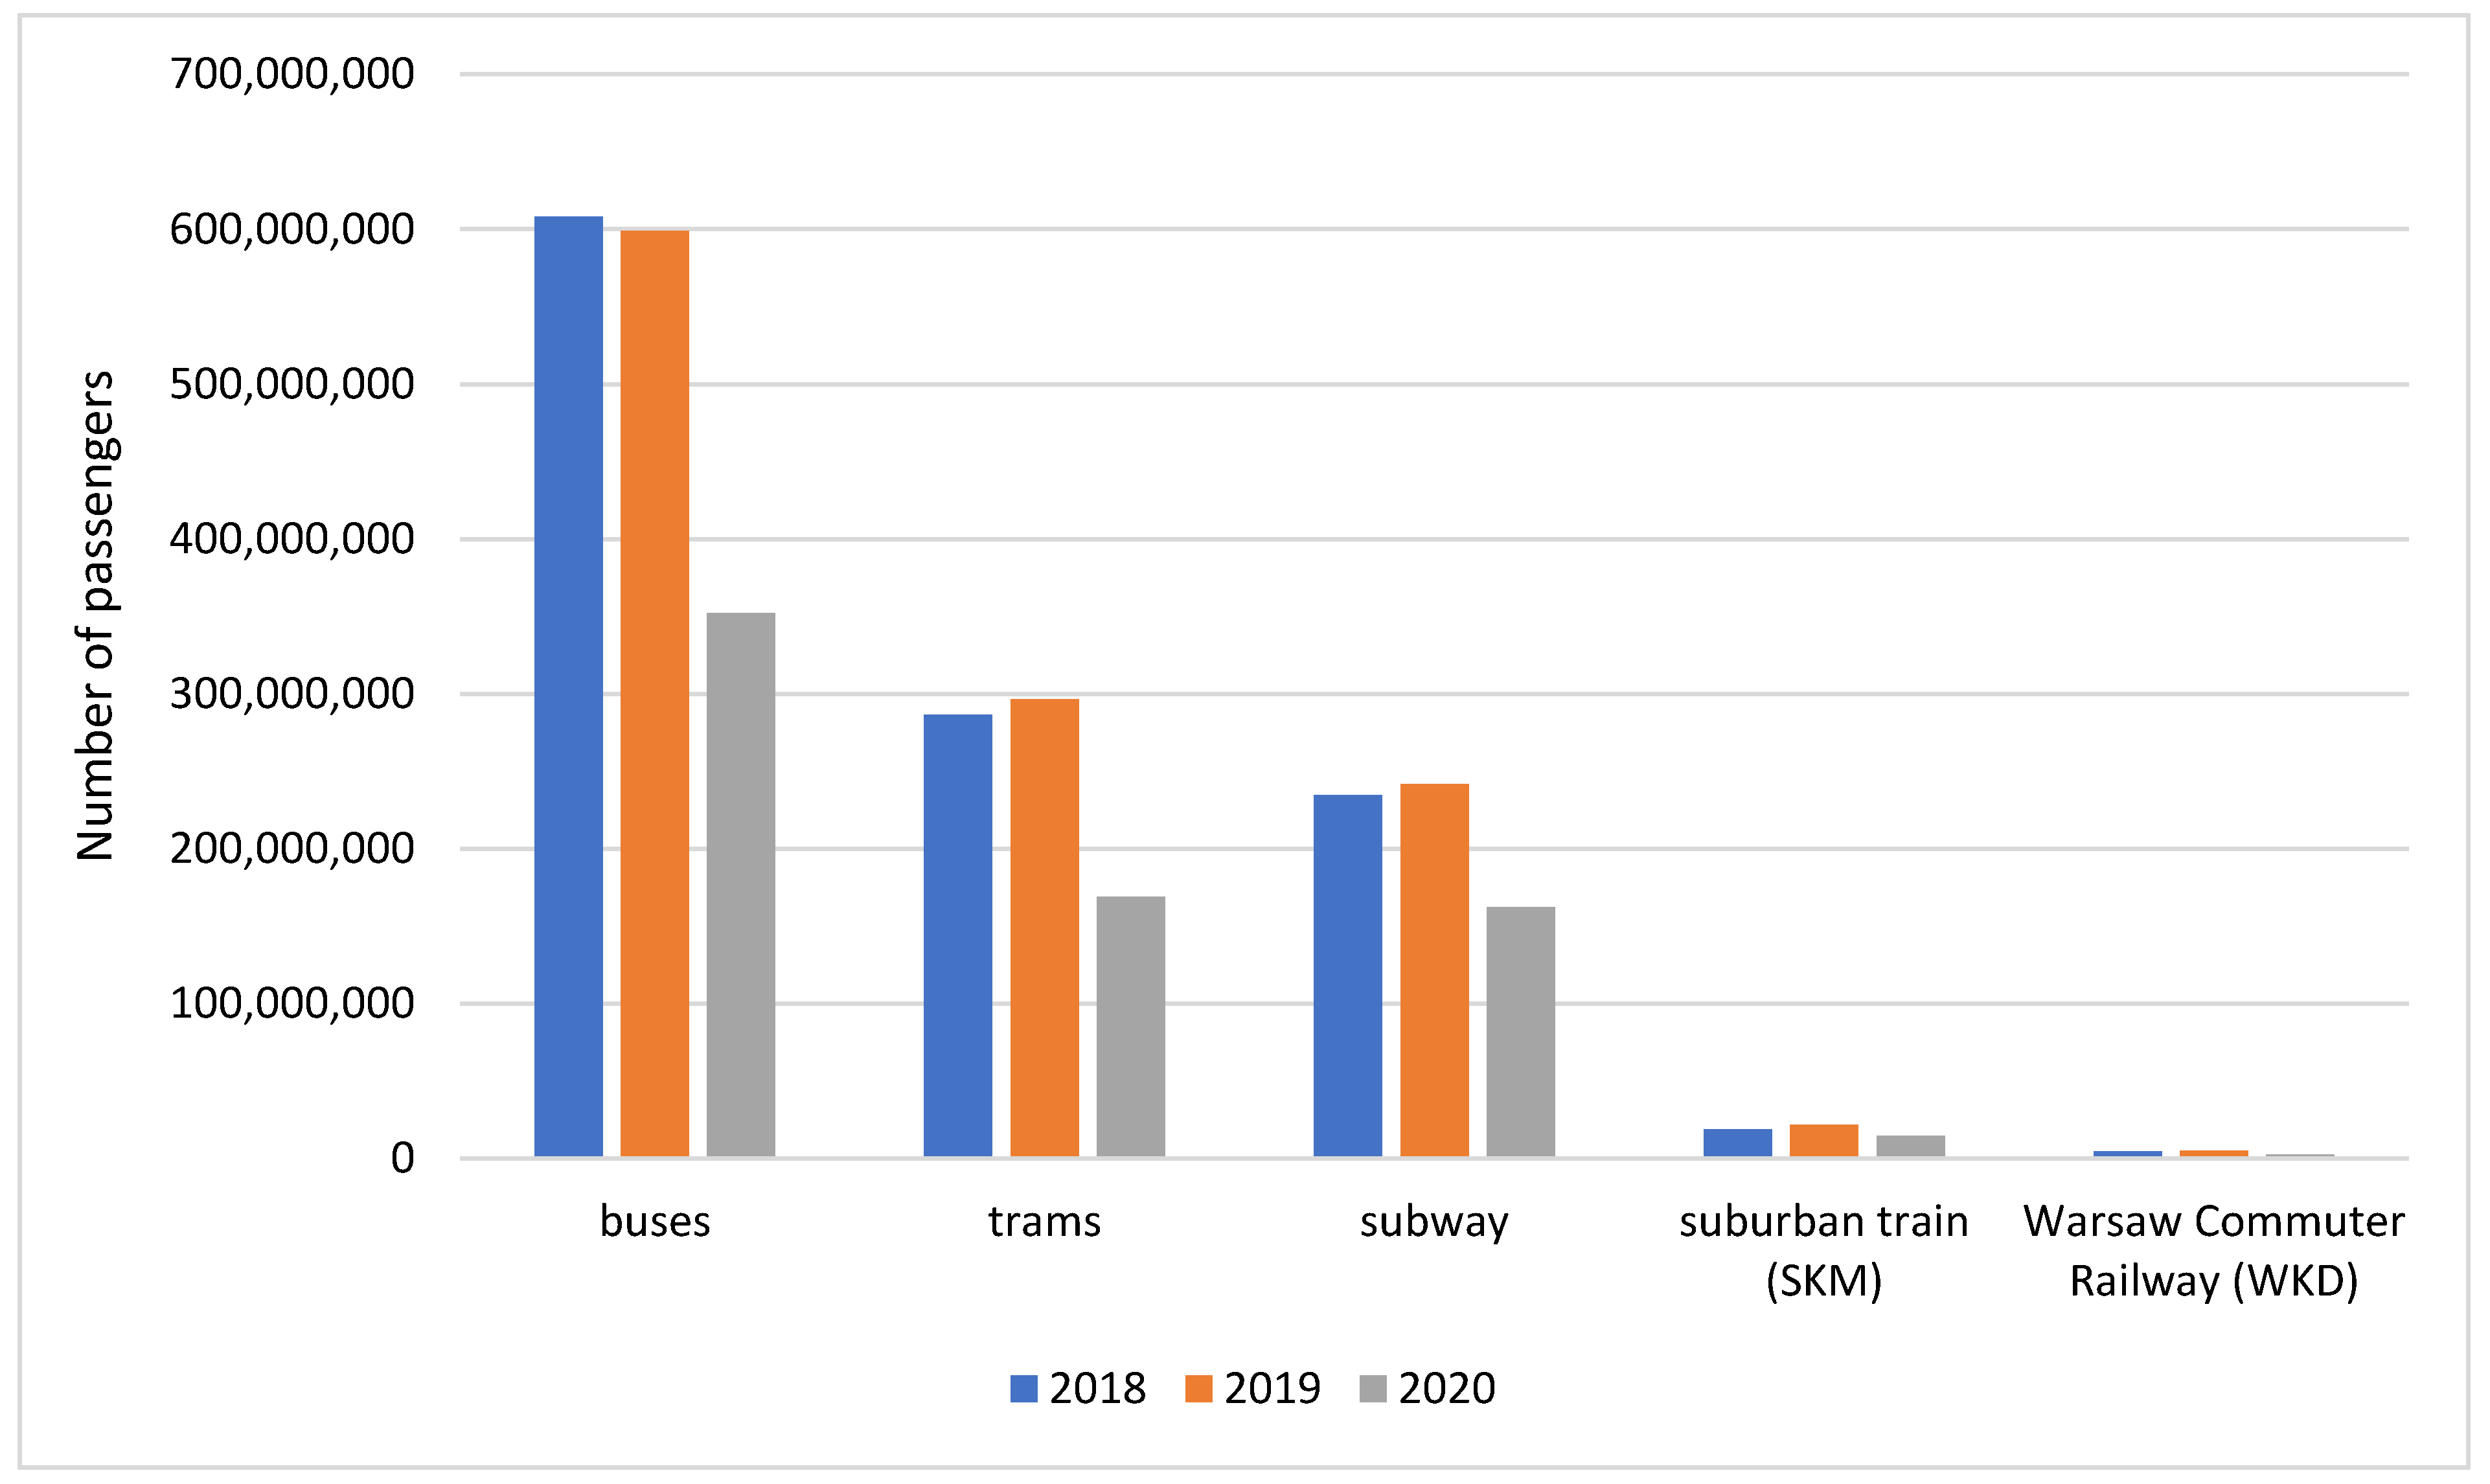
5. Public Transport in Warsaw during COVID-19 Pandemic: Statistics

During the COVID-19 pandemic, there was a notable drop in the number of passengers in most of the countries affected by the spread of the virus. Most of them were presented in multiple articles, including [39,43,65].
Warsaw was also one of the cities affected by a sharp decline in the number of public transport passengers. The most reliable data about the number of passengers are only available for the subway, as its vehicles are equipped with an automatic system for counting the passengers that enter the station (Figure 1) [66].
The biggest decrease in the number of passengers has been noticed for April 2020. In relation to the previous year (2019), it has dropped from 15,092,887 entries to 2,259,205, which was a drop of 85%, and for 2021 it was 6,679,973 passengers, which, in relation to 2019, was a drop to the level of 56%, and in relation to 2020, a growth of 296%. Therefore, the reaction of passengers and the implemented restrictions had a similar impact in Warsaw as it had on other European cities described in other pieces of research.
Changes in the estimated number of passengers, broken down into mode and year, show the overall impact which COVID-19 had on mobility (Figure 2) [66].
As for now, it is impossible to give accurate data, as only the subway has the automatic system for counting passengers. ZTM is working on equipping all vehicles with this kind of system. To estimate the number of transported passengers, the following data are being analysed: ticket sales, adopted so-called transfer coefficients or the number of journeys per day and the number of journeys made [67]. All of the public transport modes have experienced a decline in number of passengers.

6. Methodology of the Research

6.1. Case Study

Warsaw is the capital city of Poland. As of the end of 2020, it had a population of 1,794,166 people. The population rate was 3469 people per 1 km2 and it was spatially diverse. The area of the city is 517.2 km2 [68].
Warsaw is one of the cities in Poland with very extensive and efficient public transport systems, and the only one with an existing subway system (underground). Private cars constitute 31.7% of the modal share. Public transport (metro, buses and trams) makes up around 46.8% of the modal share. Walking constitutes 17.9%, cycling 3.1% and other modes 0.5% [69].

6.2. Research Sample and Respondents

The study was the first of the planned series, which are supposed to cover all voivodeship cities in Poland. The authors assume that the process of collecting data from other cities will be initiated at the end of the first quarter of 2022, and will last at least until the end of the third quarter of 2022. The target population includes the inhabitants of sixteen agglomerations that are voivodeship capitals in Poland. An additional condition is the age threshold: respondents must be at least 18 years of age (the age criterion was introduced as a guarantee of having a driving license).
This article presents the results of a study conducted among adult residents of Warsaw, which is a preliminary, pilot study. In the case of noticing any inaccuracies or defects, the entire research process will be corrected and used in a new form in further stages.
The statistical group, and thus the number of adult residents of Warsaw, amounts to 1,462,900 people [70]. To calculate the minimum size of the research sample, the following formula was used:
N m i n = N p   ( α 2 · f ( 1 f ) ) N p · e 2 + α 2 · f ( 1 f )
where:
Nmin is the minimum size of the research sample,
NP is the size of the studied population,
α is the confidence level for the results obtained,
f is the fraction size,
e is the assumed maximum error.
The following assumptions were made:
  • The level of respondents’ credibility was set at 95%, which means that in accordance with the normal distribution, the value of 1.96 was used in the formula,
  • The size of the fraction was estimated at 0.5,
  • The value of the maximum error was set at 5%.
After performing the calculations, it turned out that the minimum value of the research sample is 384.
The survey was very positively received in the community, so the authors finally managed to collect almost three times the required minimum of the number of questionnaires (1056). After the preliminary elimination of the answers that did not meet the survey goal (respondents from cities and regions other than Warsaw) and uncompleted forms, 984 valid data points were retained. The questionnaire took place from November 2020 to March 2021, which covered the time of the second and third waves of COVID-19 in Poland.

6.3. Questionnaire Design

Due to the limitations of the COVID-19 pandemic, an online tool was used. The questionnaire was designed using Google Forms to collect data concerning modal choice and the level of personal security among passengers and their changes in travel behaviour through the second and third waves of COVID-19 pandemic in Poland (which took place from September 2020 to June 2021). The questionnaire survey was circulated through various electronic means, such as social media sites, electronic mail, electronic newsletters and public transport operator webpages.
The first section of the questionnaire captured respondents’ past (before COVID) and present (during COVID) travel behaviour, examining the mode of the transport they used on a daily basis and whether it changed when the pandemic started. The second section concentrated on changes in using public transport, examining how often respondents used it and if the frequency changed (and if so, what caused it). The third section provided answers on a 1 to 5 scale to questions about preparation and the actions taken by public transport operators to ensure safety the of travelling. The fourth section was devoted to questions in which respondents gave an answer about new ways of travelling and if anything has changed in their daily travel routines. The fifth part was an open question, in which respondents were asked to describe the actions that should be undertaken by public transport operators to ensure safety in the era of pandemic. The sixth part included questions about changes in the usage of private cars. The seventh and final section included questions related to the demographic and social characteristics of the respondents, such as gender, age and education level.
All in all, the questionnaire included 18 questions, and some of them were not compulsory or were not applicable in some cases.

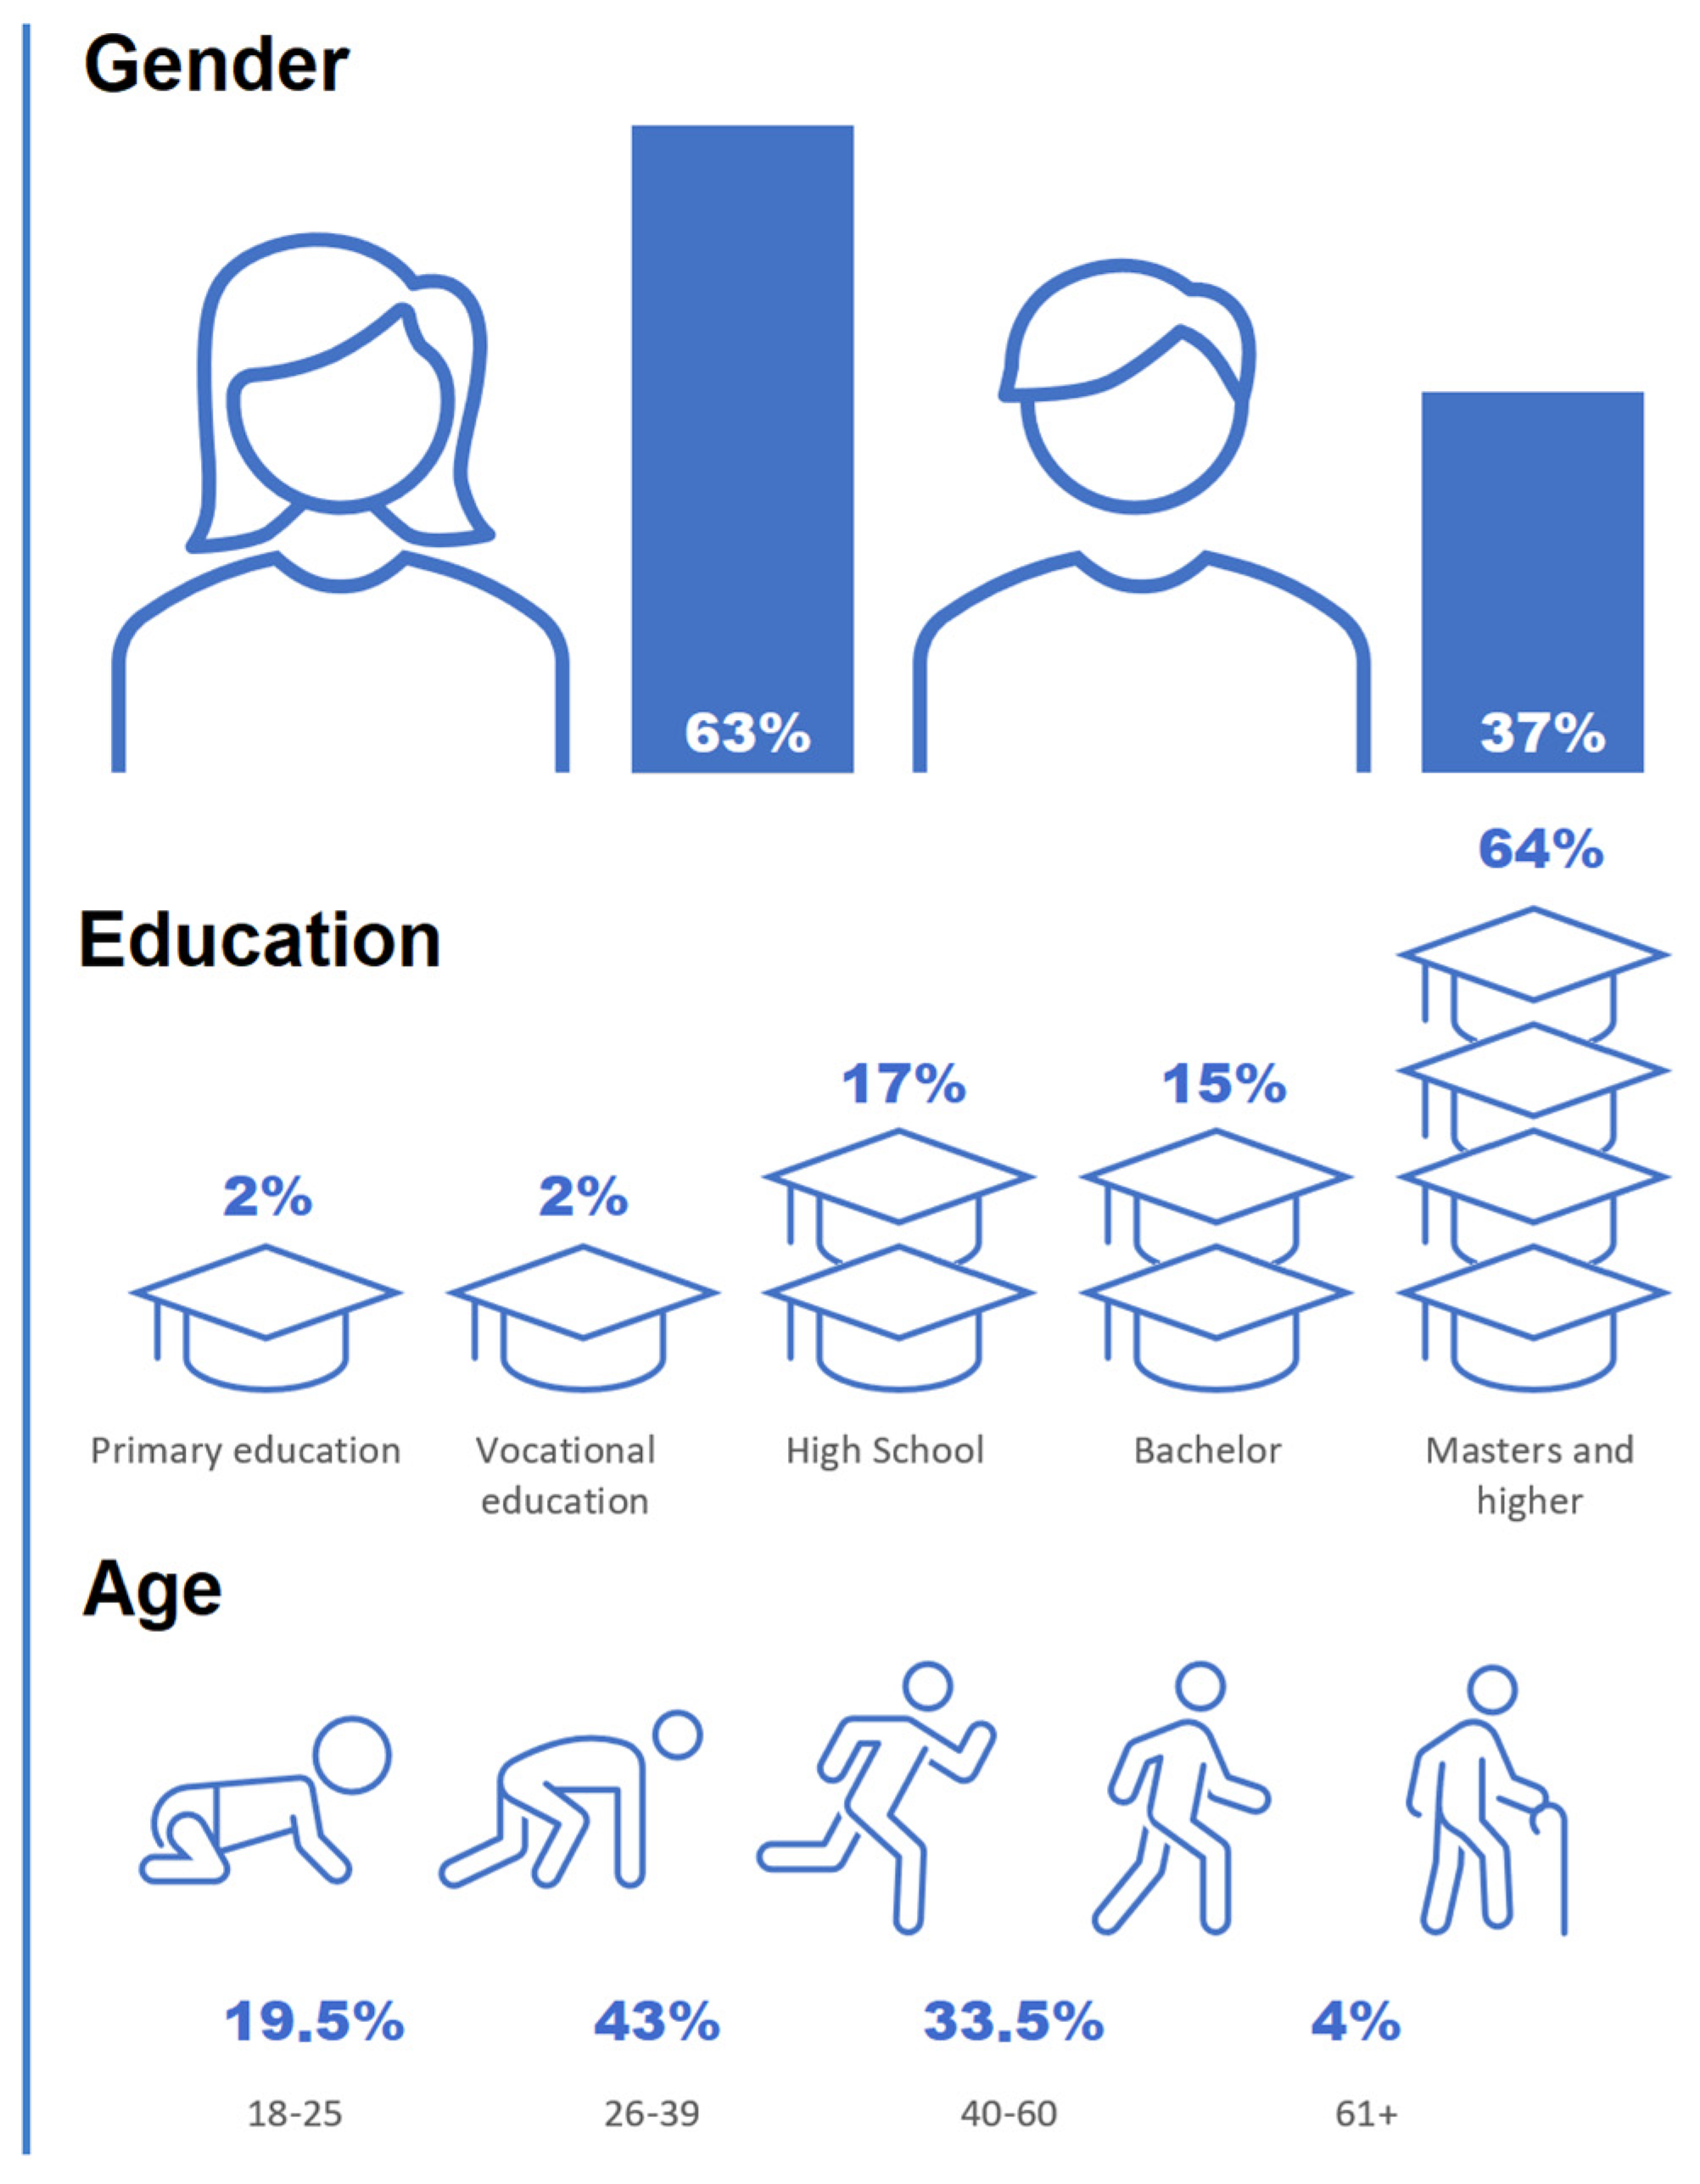
6.4. Socio-Demographic Description
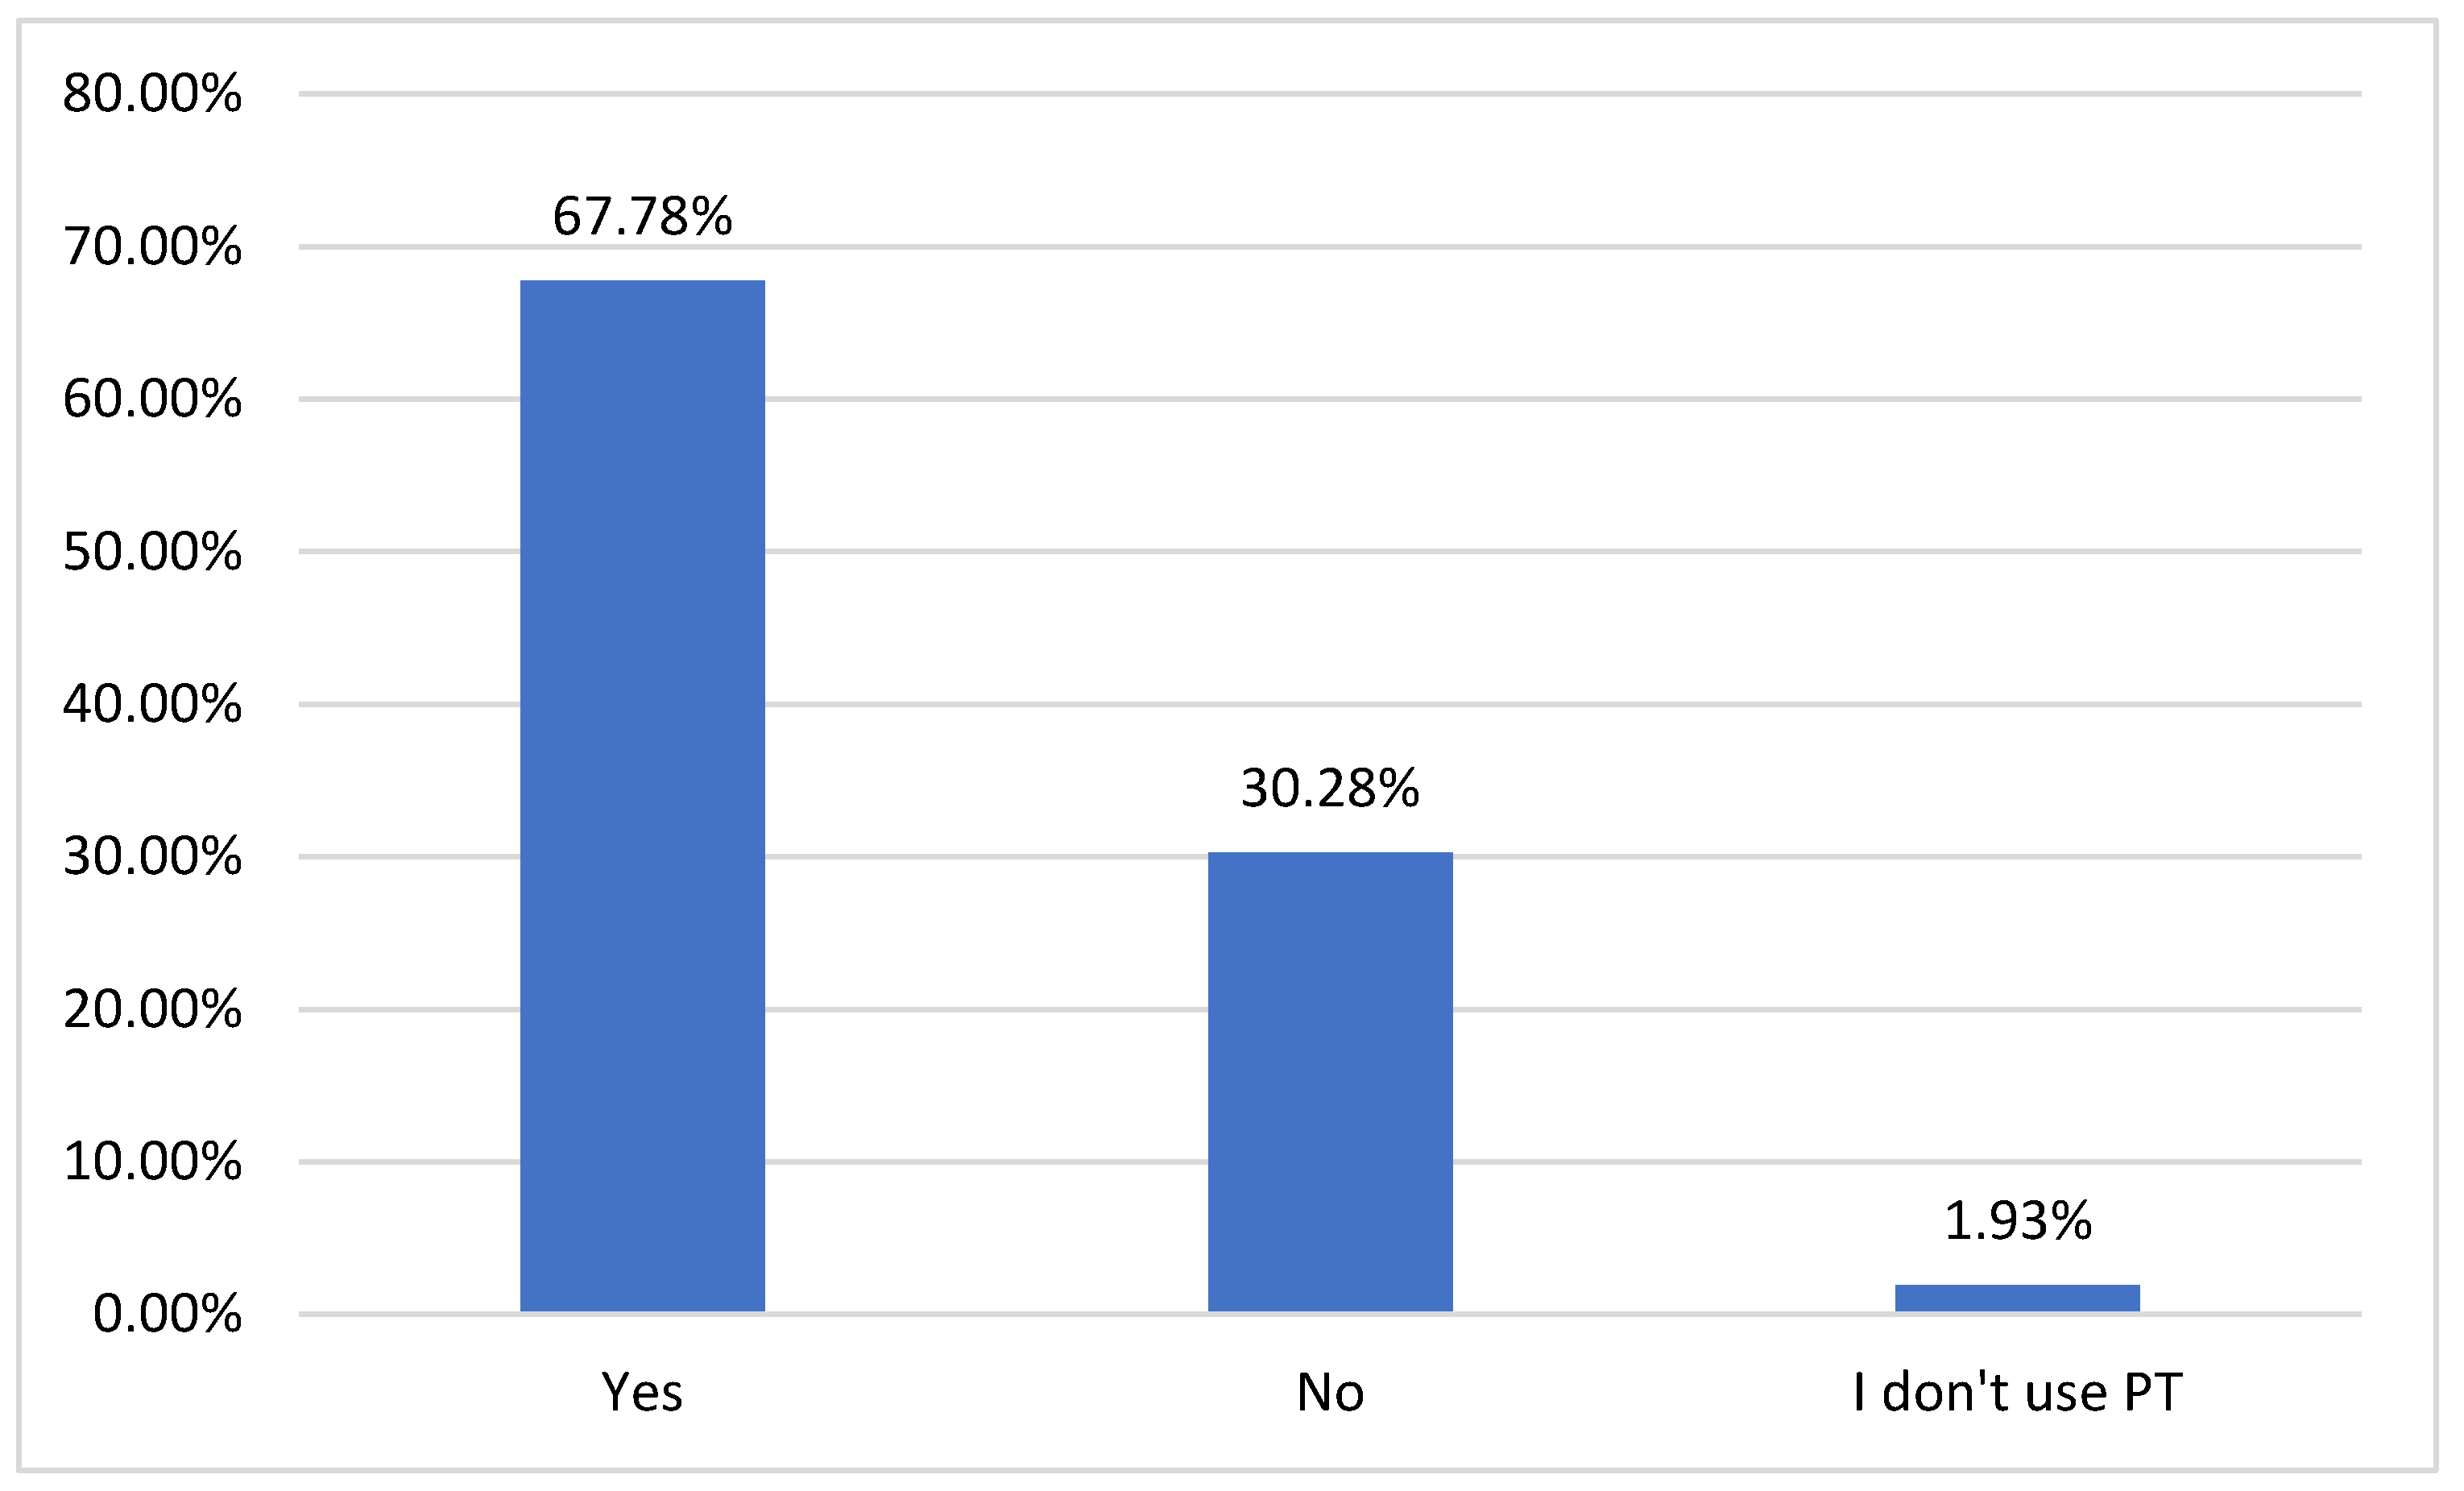
The questionnaire was designed to collect data on socio-demographics and transport characteristics in terms of changes in mobility, along with assessment of the sense of safety in public transport during the time of the pandemic.
Figure 3 presents the characteristics of the study population.
There are fewer males (37.09%) than females (62.91%). Herein, 64.19% of respondents have a masters or higher degree, and 42.78% have an age of 26–39, which is the largest group. It is worth noting that the selection of the sample was deliberate and was based on the users of public transport in Warsaw and the surrounding boroughs, which are supported by the public transport organiser, ZTM Warszawa.

7. Research Results

The pandemic had a great impact on passenger transport. The major decrease in the number of passengers caused changes to those services but, on the other hand, as the upturn in economic activity came back, the demand for mobility started growing. Still, public transport was essential to provide and guarantee access and continuity of basic services [71].
The time of the pandemic revealed many concerns about public transport safety, which was one of the most significant concerns in terms of public transport satisfaction [58].
The results of the survey conducted in Warsaw show that, since the outbreak of the pandemic, 36.18% of respondents changed their decisions regarding the choice of means of transport for everyday travel (Figure 4).
Most of the respondents indicate that they have changed their use of public transport—67.78% say that they ceased or reduced their usage of public transport (PT) (Figure 5).
The change to the means of transport for daily trips before and during the pandemic has been shown in Table 3 and Figure 6. It shows a major decrease in the number of people who used public transport for daily trips, and an increase in the use of individual cars. It is worth noting that this change is shown for the group of respondents who have used PT for daily trips.
The data shown in the table are also presented as a chart (Figure 6).
The data above show the big difference between the usage of public and individual transport during and before the pandemic in the group of PT users. It only confirms the worldwide trend in the drop in the usage of public transport during the pandemic (from the level of 90.16% to the level of 33.15%) and the increase in the usage of individual cars (from 4.78% before the pandemics to the level of 39.61%). However, it also shows the rise in the usage of bicycles (from 1.69 to 9.27%), walking (from 0.84 to 9.27%) and other forms of transport (from 2.53 to 8.71%), which included remote work (3.5% during the pandemics) and the usage of taxis and related services, such as Uber, as well as motorcycles and scooters (3.11%).
Figure 7 compares the change in daily mobility for the usage of public transport between the pre-pandemic period and the pandemic period. There is a huge drop in everyday trips towards less frequent use and not using PT at all.
The main reason for the respondents to make fewer trips by public transport was remote work, which limited daily mobility. Among the major factors also included less sense of personal security due to crowding (28%) and the failure to respect the obligation to wear face masks by other passengers (21%). Among “others”, respondents mentioned that they would pick most of the answers or a couple of them, such as the failure to respect wearing a face masks by other passengers and crowded vehicles (Figure 8).
Moreover, 36.59% of respondents mentioned that during the pandemic they used cars more often than before. One fourth (25.1%) use cars as often as before the pandemic.
Respondents were also asked to rate (on a scale from 1 to 5, where 1 means poorly prepared and 5 means very well prepared) the overall preparation of public transport in the city of Warsaw to the requirements of the pandemic in terms of passenger safety (Figure 9).
The highest rate applied to information about basic safety rules during the pandemic in public transport vehicles (4.17), and the cleanliness of the vehicles (3.57). However, direct pandemic precaution measures, such as disinfectants in PT vehicles, the verification of the obligation to wear a face mask, along with the noticeable disinfection of the vehicles, were poorly rated, in all cases with less than 2.5 points. This also affects the overall rate of how public transport was assessed during the pandemic.
Respondents were also asked to give an open answer about actions that might be taken by public transport operators that will have a positive impact on using public transport more often during the pandemic. As it was an open question, we only selected the most frequently mentioned answers to present:
  • Making public transport vehicles less crowded;
  • Regular disinfection of PT vehicles;
  • Enforcement of the obligation to wear face masks;
  • Increasing the frequency of public transport.
Unfortunately, the majority of studies that relate to declines in the mobility and changes in travel patterns caused by COVID-19 has been conducted mainly in advanced countries, and did not include the role of subjective/perceived sense of safety [61] while travelling from the point of view of public transport passengers. Existing research [42,43] from Spain shows that the main actions demanded by public transport users before they use this mode are increasing supply to avoid crowding (70.6%) and increasing cleanliness and sanitising (52.1%). This research was conducted along with analyses of willingness to pay extra if public transport operators implemented additional supply and sanitising options. The second known research [72] was conducted in a Polish city, Gdańsk, and analysed the factors affecting the feeling of safety in public transport during the pandemic, including the fear of becoming infected, the fear of insufficient disinfection and the fear of other passengers not following the hygienic regime. The second important article describes the change in mobility and its analysis with the use of Google LCC [73], which directly showed a significant decline in mobility, also as a response to introduced restrictions. The article presents data showing the biggest drop in mobility in the retail and recreation (−78%) category and the smallest in the workplaces category (−36%).
This research gap has motivated authors to investigate the trend in travel behaviour in relation to the subjective sense of safety for the capital city of one of Europe’s developing countries during the pandemic.
The primary objective is to investigate whether precaution actions taken by public transport organisers in Warsaw during the COVID-19 pandemic had an impact on the transport mode choice of passengers. A correlation analysis was performed to measure the relationship between personal safety and actions taken to prevent the spread of the virus in public transport vehicles. The research methodology might also be applicable in other areas of health threat, as well as in other cities which would like to undertake the survey to assess changes in mobility in the time of pandemic.
In order to achieve the main aim of the study, the following hypothesis was built: Perceived health and safety can positively affect public transport satisfaction during the time of pandemic.
The usage of public transport during the pandemic shows, not only in the case of Warsaw, a major decrease in its number of users. In many cases, it was due to remote work, which did not require daily travel. However, the questionnaire has shown that public transport users are afraid of contagion and reports a need for more safety precaution measures, such as the use of disinfectants and improving the cleanliness of vehicles, along with the enforcement of wearing face masks. The pandemic preparation assessment also showed weak points on the side of PT organisers, mentioning personal safety (less crowded vehicles, the necessity of wearing face masks and the regular cleaning and disinfection of vehicles).

8. Correlation Statistics

The authors of the article decided to perform a statistical detection of regularities to test the correlation of the phenomena. The study of polyatomic features is based on parameters related to statistics. On its basis, convergence coefficients, such as Txy Czuprow, V-Cramer, C-Pearson, or Ø Yule, were calculated. Due to the positive experiences in previous studies, the authors decided to use the V-Cramer and C-Pearson methods. Despite the fact that all the above-mentioned methods are similar to each other, the circumstances and details of the research conducted resulted in the fact that the selected pair of coefficients turned out to be the most appropriate and factually correct tools. In addition, they are independent of the number of columns and rows in the association table, which significantly increases their application spectrum.
The selected coefficients enable the measurement of the relationship between the variables whose values are expressed on nominal scales. The results are in the range [0, 1]. In the case where the obtained result approaches one, it means the existence of very strong relations between the qualitative variables. If it is zero or close to zero, it reveals the independence of the analysed features.
For C-Pearson and V-Cramer, similar assumptions were made: the significance level for the chi test was set at ≤0.05. The following thresholds determining the strength of the dependence were adopted for the V-Cramer coefficient: 0–0.25 no connection, 0.251–0.35 weak connection, 0.351–0.45 medium connection, 0.451–0.55 strong connection and 0.551–1 very strong connection.
The C-Pearson coefficient is “a measure of the assessment of the relationship between two qualitative (non-measurable) features X and Y when the data are presented in the form of a contingency table. This coefficient has values in the range [0; 1]. Its value equal to 0 means that the features are independent and, consequently, are uncorrelated. A value of 1 indicates a functional relationship. The coefficient does not indicate the direction of the relationship. The value of the C-Pearson contingency coefficient depends on the size of the independence table, therefore, to be able to compare the coefficients from tables of different sizes, they must be normalized” [74].
The established thresholds are subjective, and have been set by the authors based on the comparisons of the obtained results with the assumed correlations resulting from the substantive and logical analysis, as well as from research experience and general statistical knowledge (Table 4).
The results obtained should not be interpreted as a difference but as a sum. This means that, if in any statistical procedure aimed at detecting a correlation the result was positive, it should be assumed that there is indeed a correlation between the variables, even though other tools did not detect it.
Both techniques used the V-Cramer coefficient and the C-Pearson coefficient, which are used in qualitative (descriptive) statistics. With their help, it is not possible to determine the directivity of interactions, but only to determine the strength of the statistical relationships that occur. Ultimately, eight correlations were revealed, including five very strong, one strong and two weak. All correlations were discovered using the C-Pearson coefficient.
It turned out that very strong correlations exist between:
  • The frequency of choosing a specific means of transport during a pandemic and the age and level of education of the respondents,
  • Using public means of transport and the age of respondents,
  • The frequency of using the car during the pandemic and the age and level of education of the respondents.
A strong correlation was found between the change of means of transport for everyday travel during the pandemic and the education of the respondents. In this case, there was also a weak relationship, but in combination with age.
The last, low relationship was revealed in the context of the frequency of car journeys during the pandemic and gender.

9. Discussion

A subjective sense of personal security has always been an issue for the quality of public transport services. Regardless of the pandemic, passengers have expressed different needs towards public transport operators, including comfort, frequency, distance and safety. From the studies described in this article (mainly in Table 1), major decreases in the number of passengers have been observed, not only as a result of restrictions, but also because of the threat of becoming infected. Even before the pandemics, the development of public transport and the growth of its modal share was a huge challenge for public transport operators and municipal authorities. Now, after the start of vaccination programme, as the main threat seems to be over, people are still afraid to use mass transport.
The article and research that has been prepared clearly show that people moved towards cars, other individual vehicles or active mobility forms. At the same time, the main reasons for choosing different modes of transport for daily trips is a lower sense of personal security due to vehicle crowding and the failure to respect the obligation to cover the mouth and nose by fellow passengers, which are connected to basic safety needs.
The results confirm the hypothesis stating that perceived health safety can positively affect public transport satisfaction during the pandemic. Social distancing is a simple and effective measure that has direct and positive effects on health during the pandemic. However, it is really hard to maintain distance in public transport. That is why public transport operators should focus on making their services safer, especially to the group of people who are disabled, have mobility problems or do not have a car.
As it was mentioned before, the sample does not represent the whole population of the city of Warsaw, as in its origins, it was directed to public transport users. That was also an intentional limitation of the research. Other limitations concerned the remote way of collecting data, given that, as it was mentioned, it was much safer and easier, during the pandemic, to conduct it remotely. Therefore, at this phase of research, it is not possible to use the results of the whole population. Furthermore, it is not possible, due to the very unpredictable scenarios of the pandemic, to say if any reported changes in modal shift, which might be only short-term, ad hoc adaptations in behaviour, will become more permanent changes. It all remains a matter of speculation, rather than possible scenarios. Further advancement in this research would involve preparing this type of information in relation to other Polish cities or other European capitals with the usage of identical research tools.
Follow-up studies during the pandemic and post-pandemic will give more accurate answers. Nevertheless, it is important to track and observe all the changes in transport patterns. They might also give answers to some of the questions that are raised for public transport in terms of mobility behaviour. It would be good to ask important questions about the future of public transport:
  • How do we regain confidence in personal safety among passengers in public transport?
  • What kind of measures can be implemented to make up for losses in the number of passengers in public transport?
  • What kind of conclusions can we draw from the pandemic period, and how do we use them?
  • How has the demand for public transport changed?
  • What will be the impact of the vaccination programme for the public—will it lead to any change in the usage of public transport?
  • How will the next waves affect public transport?
Those questions open a door to further research in this area.

10. Conclusions

The aim of this paper was to obtain some more detailed information on mobility behaviour change, in terms of personal safety, in the era of pandemics. We can see the direct changes in mobility during the pandemic but, at the same time, it is impossible to assess long-run socioeconomic side effects on human capital and wellbeing [75]. Until the COVID-19 crisis, there had been only a relatively small amount of research concentrated on the effects of such pandemics, including their impact on mobility. Many of the studies that have been prepared since, showing the impact of the pandemic in different fields—economics, psychological health, wellbeing and transport—give a glimpse into what can be predicted if this type of threat occurs again. In transport, there are specific procedures that have been prepared and implemented, and that also gives operators a chance to be well prepared. The COVID-19 pandemic presents an opportunity to reconfigure future transport policy and practice to meet the goals regarding the environment [74] and individual citizens [76,77,78,79].
The overall risk of infection in everyday life may have played an important role in the considerations regarding mode choice. This is the biggest challenge for public transport operators: to meet the needs that have changed during the pandemic. Additionally, they may also seek to undo the decrease in the number of passengers. This needs new measures, changes in management and the development of solutions that might be useful should this kind of situation reappear.

Author Contributions

All the authors have equally contributed to this paper. Conceptualization, Z.K.-A. and P.G.; methodology, Z.K.-A. and P.G.; validation, Z.K.-A. and P.G.; analysis, Z.K.-A. and P.G.; investigation, Z.K.-A. and P.G.; resources, Z.K.-A. and P.G.; writing—original draft preparation, Z.K.-A. and P.G.; visualization, Z.K.-A. and P.G.; supervision, Z.K.-A. and P.G.; project administration, Z.K.-A. and P.G.; funding acquisition, Z.K.-A. and P.G. All authors have read and agreed to the published version of the manuscript.

Funding

The project was financed within the framework of the program of the Minister of Science and Higher Education under the name ‘Regional Excellence Initiative’ in the years 2019–2022; project number RID/IZ/2021/1/44.

Institutional Review Board Statement

Not applicable.

Informed Consent Statement

Not applicable.

Data Availability Statement

Data are contained within the article.

Conflicts of Interest

The authors declare no conflict of interest.

Abbreviations

PTpublic transport
COVID-19coronavirus disease 2019
SARSsevere acute respiratory syndrome
WHOWorld Health Organization
ZTMZarząd Transportu Miejskiego w Warszawie (Eng.: Public Transport Authority in Warsaw)

References

  1. Ben-Akiva, M.; Bierlaire, M. Discrete Choice Methods and Their Applications to Short Term Travel Decisions; Springer: Boston, MA, USA, 1999; pp. 5–33. [Google Scholar] [CrossRef] [Green Version]
  2. Liu, C.; Vlaev, I.; Fang, C.; Denrell, J.; Chater, N. Strategizing with Biases: Making Better Decisions Using the Mindspace Approach. Calif. Manag. Rev. 2017, 59, 135–161. [Google Scholar] [CrossRef] [Green Version]
  3. Metcalfe, R.; Dolan, P. Behavioural economics and its implications for transport. J. Transp. Geogr. 2012, 24, 503–511. [Google Scholar] [CrossRef]
  4. Abou-Zeid, M.; Ben-Akiva, M. Travel mode switching: Comparison of findings from two public transportation experiments. Transp. Policy 2012, 24, 48–59. [Google Scholar] [CrossRef]
  5. Ajzen, I. The theory of planned behavior. Organ. Behav. Hum. Decis. Process. 1991, 50, 179–211. [Google Scholar] [CrossRef]
  6. Kłos-Adamkiewicz, Z.; Załoga, E. Miejski Transport Zbiorowy. Kształtowanie Wartości Usług dla Pasażera w Świetle Wyzwań Nowej Kultury Mobilności; Bel Studio: Warszawa, Poland, 2017. [Google Scholar]
  7. Briand, A.S.; Côme, E.; Trépanier, M.; Oukhellou, L. Analyzing year-to-year changes in public transport passenger behaviour using smart card data. Transp. Res. Part C Emerg. Technol. 2017, 79, 274–289. [Google Scholar] [CrossRef]
  8. Riggs, W. Testing Social Norms As an Incentive to Active Transportation Behavior. J. Transp. Health 2016, 3, S30. [Google Scholar] [CrossRef]
  9. Hiselius, L.W.; Rosqvist, L.S. Mobility Management campaigns as part of the transition towards changing social norms on sustainable travel behavior. J. Clean. Prod. 2016, 123, 34–41. [Google Scholar] [CrossRef]
  10. Aditjandra, P.T. The impact of urban development patterns on travel behaviour: Lessons learned from a British metropolitan region using macro-analysis and micro-analysis in addressing the sustainability agenda. Res. Transp. Bus. Manag. 2013, 7, 69–80. [Google Scholar] [CrossRef] [Green Version]
  11. Bates, J.; Polak, J.; Jones, P.; Cook, A. The valuation of reliability for personal travel. Transp. Res. Part E Logist. Transp. Rev. 2001, 37, 191–229. [Google Scholar] [CrossRef]
  12. Bamberg, S.; Hunecke, M.; Blöbaum, A. Social context, personal norms and the use of public transportation: Two field studies. J. Environ. Psychol. 2007, 27, 190–203. [Google Scholar] [CrossRef]
  13. Ababio-Donkor, A.; Saleh, W.; Fonzone, A. The role of personal norms in the choice of mode for commuting. Res. Transp. Econ. 2020, 83, 100966. [Google Scholar] [CrossRef]
  14. Allahviranloo, M.; Aissaoui, L. A comparison of time-use behavior in metropolitan areas using pattern recognition techniques. Transp. Res. Part A Policy Pract. 2019, 129, 271–287. [Google Scholar] [CrossRef]
  15. Basbas, S.; Georgiadis, G.; Campisi, T.; Tesoriere, G. Factors Influencing Public Transport Demand in Sicily During COVID-19 Era: A Study of Commuters’ Travel and Mode Choice Behaviors. In International Conference on Computational Science and Its Applications; 12954 LNCS; Springer: Cham, Switzerland, 2021; pp. 339–353. [Google Scholar] [CrossRef]
  16. Jones, J.H.; Salathé, M. Early assessment of anxiety and behavioral response to novel swine-origin influenza a(H1N1). PLoS ONE 2009, 4, e8032. [Google Scholar] [CrossRef] [PubMed]
  17. Liao, Q.; Cowling, B.J.; Wu, P.; Leung, G.M.; Fielding, R.; Lam, W.W.T. Population Behavior Patterns in Response to the Risk of Influenza A(H7N9) in Hong Kong, December 2013–February 2014. Int. J. Behav. Med. 2015, 22, 672–682. [Google Scholar] [CrossRef]
  18. Abu-Rayash, A.; Dincer, I. Analysis of mobility trends during the COVID-19 coronavirus pandemic: Exploring the impacts on global aviation and travel in selected cities. Energy Res. Soc. Sci. 2020, 68, 101693. [Google Scholar] [CrossRef] [PubMed]
  19. Beutels, P.; Jia, N.; Zhou, Q.Y.; Smith, R.; Cao, W.C.; De Vlas, S.J. The economic impact of SARS in Beijing, China. Trop. Med. Int. Health 2009, 14 (Suppl. S1), 85–91. [Google Scholar] [CrossRef] [PubMed]
  20. Cowling, B.J.; Ng, D.M.; Ip, D.K.; Liao, Q.; Lam, W.W.; Wu, J.T.; Lau, J.T.; Griffiths, S.M.; Fielding, R. Community psychological and behavioral responses through the first wave of the 2009 influenza A(H1N1) pandemic in Hong Kong. J. Infect. Dis. 2010, 202, 867–876. [Google Scholar] [CrossRef] [PubMed] [Green Version]
  21. Goodwin, R.; Gaines, S.O.; Myers, L.; Neto, F. Initial psychological responses to swine flu. Int. J. Behav. Med. 2011, 18, 88–92. [Google Scholar] [CrossRef] [PubMed]
  22. Abdullah, M.; Ali, N.; Dias, C.; Campisi, T.; Javid, M.A. Exploring the traveler’s intentions to use public transport during the covid-19 pandemic while complying with precautionary measures. Appl. Sci. 2021, 11, 3630. [Google Scholar] [CrossRef]
  23. Anke, J.; Francke, A.; Schaefer, L.M.; Petzoldt, T. Impact of SARS-CoV-2 on the mobility behaviour in Germany. Eur. Transp. Res. Rev. 2021, 13, 10. [Google Scholar] [CrossRef]
  24. De Vos, J. The effect of COVID-19 and subsequent social distancing on travel behavior. Transp. Res. Interdiscip. Perspect. 2020, 5, 100121. [Google Scholar] [CrossRef] [PubMed]
  25. Abdullah, M.; Ali, N.; Javid, M.A.; Dias, C.; Campisi, T. Public transport versus solo travel mode choices during the COVID-19 pandemic: Self-reported evidence from a developing country. Transp. Eng. 2021, 5, 100078. [Google Scholar] [CrossRef]
  26. Askitas, N.; Tatsiramos, K.; Verheyden, B. Lockdown Strategies, Mobility Patterns and COVID-19. SSRN Electron. J. 2021. [Google Scholar] [CrossRef]
  27. Herrera, M.; Godoy-Faúndez, A. Exploring the roles of local mobility patterns, socioeconomic conditions, and lockdown policies in shaping the patterns of COVID-19 spread. Future Internet 2021, 13, 112. [Google Scholar] [CrossRef]
  28. Anwari, N.; Tawkir Ahmed, M.; Rakibul Islam, M.; Hadiuzzaman, M.; Amin, S. Exploring the travel behavior changes caused by the COVID-19 crisis: A case study for a developing country. Transp. Res. Interdiscip. Perspect. 2021, 9, 100334. [Google Scholar] [CrossRef]
  29. Bhaduri, E.; Manoj, B.S.; Wadud, Z.; Goswami, A.K.; Choudhury, C.F. Modelling the effects of COVID-19 on travel mode choice behaviour in India. Transp. Res. Interdiscip. Perspect. 2020, 8, 100273. [Google Scholar] [CrossRef]
  30. van der Drift, S.; Wismans, L.; Olde Kalter, M.J. Changing mobility patterns in the Netherlands during COVID-19 outbreak. J. Locat. Based Serv. 2021, 1–24. [Google Scholar] [CrossRef]
  31. Parady, G.; Taniguchi, A.; Takami, K. Travel behavior changes during the COVID-19 pandemic in Japan: Analyzing the effects of risk perception and social influence on going-out self-restriction. Transp. Res. Interdiscip. Perspect. 2020, 7, 100181. [Google Scholar] [CrossRef]
  32. Molloy, J.; Schatzmann, T.; Schoeman, B.; Tchervenkov, C.; Hintermann, B.; Axhausen, K.W. Observed impacts of the COVID-19 first wave on travel behaviour in Switzerland based on a large GPS panel. Transp. Policy 2021, 104, 43–51. [Google Scholar] [CrossRef]
  33. Bohman, H.; Ryan, J.; Stjernborg, V.; Nilsson, D. A study of changes in everyday mobility during the COVID-19 pandemic: As perceived by people living in Malmö, Sweden. Transp. Policy 2021, 106, 109–119. [Google Scholar] [CrossRef]
  34. Jenelius, E.; Cebecauer, M. Impacts of COVID-19 on public transport ridership in Sweden: Analysis of ticket validations, sales and passenger counts. Transp. Res. Interdiscip. Perspect. 2020, 8, 100242. [Google Scholar] [CrossRef] [PubMed]
  35. Badr, H.S.; Du, H.; Marshall, M.; Dong, E.; Squire, M.M.; Gardner, L.M. Association between mobility patterns and COVID-19 transmission in the USA: A mathematical modelling study. Lancet Infect. Dis. 2020, 20, 1247–1254. [Google Scholar] [CrossRef]
  36. Beck, M.J.; Hensher, D.A. Insights into the impact of COVID-19 on household travel and activities in Australia–The early days of easing restrictions. Transp. Policy 2020, 99, 95–119. [Google Scholar] [CrossRef]
  37. Cartenì, A.; Di Francesco, L.; Martino, M. How mobility habits influenced the spread of the COVID-19 pandemic: Results from the Italian case study. Sci. Total Environ. 2020, 741, 140489. [Google Scholar] [CrossRef]
  38. Dingil, A.E.; Esztergár-Kiss, D. The Influence of the COVID-19 Pandemic on Mobility Patterns: The First Wave’s Results. Transp. Lett. 2021, 13, 434–446. [Google Scholar] [CrossRef]
  39. Abdullah, M.; Dias, C.; Muley, D.; Shahin, M. Exploring the impacts of COVID-19 on travel behavior and mode preferences. Transp. Res. Interdiscip. Perspect. 2020, 8, 100255. [Google Scholar] [CrossRef]
  40. Tirachini, A.; Cats, O. COVID-19 and public transportation: Current assessment, prospects, and research needs. J. Public Transp. 2020, 22, 1–34. [Google Scholar] [CrossRef]
  41. Shibayama, T.; Sandholzer, F.; Laa, B.; Brezina, T. Impact of covid-19 lockdown on commuting: A multi-country perspective. Eur. J. Transp. Infrastruct. Res. 2021, 21, 70–93. [Google Scholar] [CrossRef]
  42. Awad-Núñez, S.; Julio, R.; Moya-Gómez, B.; Gomez, J.; Sastre González, J. Acceptability of sustainable mobility policies under a post-COVID-19 scenario. Evidence from Spain. Transp. Policy 2021, 106, 205–214. [Google Scholar] [CrossRef]
  43. Awad-Núñez, S.; Julio, R.; Gomez, J.; Moya-Gómez, B.; González, J.S. Post-COVID-19 travel behaviour patterns: Impact on the willingness to pay of users of public transport and shared mobility services in Spain. Eur. Transp. Res. Rev. 2021, 13, 20. [Google Scholar] [CrossRef]
  44. Eisenmann, C.; Nobis, C.; Kolarova, V.; Lenz, B.; Winkler, C. Transport mode use during the COVID-19 lockdown period in Germany: The car became more important, public transport lost ground. Transp. Policy 2021, 103, 60–67. [Google Scholar] [CrossRef]
  45. Molloy, J. MOBIS Covid19 Mobility Report. [WWW Document]. 2020. Available online: https://ivtmobis.ethz.ch/mobis/covid19/reports/latest (accessed on 9 July 2021).
  46. Politis, I.; Georgiadis, G.; Papadopoulos, E.; Fyrogenis, I.; Nikolaidou, A.; Kopsacheilis, A.; Sdoukopoulos, A.; Verani, E. COVID-19 lockdown measures and travel behavior: The case of Thessaloniki, Greece. Transp. Res. Interdiscip. Perspect. 2021, 10, 100345. [Google Scholar] [CrossRef]
  47. Kopsidas, A.; Milioti, C.; Kepaptsoglou, K.; Vlachogianni, E.I. How did the COVID-19 pandemic impact traveler behavior toward public transport? The case of Athens, Greece. Transp. Lett. 2021, 13, 344–352. [Google Scholar] [CrossRef]
  48. de Haas, M.; Faber, R.; Hamersma, M. How COVID-19 and the Dutch “intelligent lockdown” change activities, work and travel behaviour: Evidence from longitudinal data in the Netherlands. Transp. Res. Interdiscip. Perspect. 2020, 6, 100150. [Google Scholar] [CrossRef]
  49. Bucsky, P. Modal share changes due to COVID-19: The case of Budapest. Transp. Res. Interdiscip. Perspect. 2020, 8, 100141. [Google Scholar] [CrossRef] [PubMed]
  50. Donzelli, G.; Cioni, L.; Cancellieri, M.; Morales, A.L.; Suárez-Varela, M.M.M. The Effect of the COVID-19 Lockdown on Air Quality in Three Italian Medium-Sized Cities. Atmosphere 2020, 11, 1118. [Google Scholar] [CrossRef]
  51. Dobson, R.; Semple, S. Changes in outdoor air pollution due to COVID-19 lockdowns differ by pollutant: Evidence from Scotland. Occup. Environ. Med. 2020, 77, 798–800. [Google Scholar] [CrossRef]
  52. Wielechowski, M.; Czech, K.; Grzȩda, Ł. Decline in mobility: Public transport in Poland in the time of the COVID-19 pandemic. Economies 2020, 8, 78. [Google Scholar] [CrossRef]
  53. COVID-Informacje-Ministerstwo Zdrowia-Portal Gov.pl. Available online: https://www.gov.pl/web/zdrowie/covid (accessed on 2 November 2021).
  54. WHO/Europe|Coronavirus Disease (COVID-19) Outbreak-Country Overviews. Available online: https://www.euro.who.int/en/health-topics/health-emergencies/coronavirus-covid-19/country-overviews (accessed on 2 November 2021).
  55. Hadjidemetriou, G.M.; Sasidharan, M.; Kouyialis, G.; Parlikad, A.K. The impact of government measures and human mobility trend on COVID-19 related deaths in the UK. Transp. Res. Interdiscip. Perspect. 2020, 6, 100167. [Google Scholar] [CrossRef]
  56. Troko, J.; Myles, P.; Gibson, J.; Hashim, A.; Enstone, J.; Kingdon, S.; Packham, C.; Amin, S.; Hayward, A.; Van-Tam, J.N. Is public transport a risk factor for acute respiratory infection? BMC Infect. Dis. 2011, 11, 16. [Google Scholar] [CrossRef] [Green Version]
  57. Moser, M.R.; Bender, T.R.; Margolis, H.S.; Noble, G.R.; Kendal, A.P.; Ritter, D.G. An outbreak of influenza aboard a commercial airliner. Am. J. Epidemiol. 1979, 110, 1–6. [Google Scholar] [CrossRef] [PubMed]
  58. Daly, P.; Gustafson, R.; Kendall, P. Introduction to pandemic influenza, B.C. Med. J. 2007, 49, 240–244. [Google Scholar] [CrossRef]
  59. Böhmer, M.M.; Buchholz, U.; Corman, V.M.; Hoch, M.; Katz, K.; Marosevic, D.V.; Böhm, S.; Woudenberg, T.; Ackermann, N.; Konrad, R.; et al. Investigation of a COVID-19 outbreak in Germany resulting from a single travel-associated primary case: A case series. Lancet Infect. Dis. 2020, 20, 920–928. [Google Scholar] [CrossRef]
  60. Stradling, S.; Carreno, M.; Rye, T.; Noble, A. Passenger perceptions and the ideal urban bus journey experience. Transp. Policy 2007, 14, 283–292. [Google Scholar] [CrossRef]
  61. Fatmi, M.R. COVID-19 impact on urban mobility. J. Urban Manag. 2020, 9, 270–275. [Google Scholar] [CrossRef]
  62. Delbosc, A.; Currie, G. Modelling the causes and impacts of personal safety perceptions on public transport ridership. Transp. Policy 2012, 24, 302–309. [Google Scholar] [CrossRef]
  63. Dong, H.; Ma, S.; Jia, N.; Tian, J. Understanding public transport satisfaction in post COVID-19 pandemic. Transp. Policy 2021, 101, 81–88. [Google Scholar] [CrossRef]
  64. Chlond, B.; Eisenmann, C. Workshop Synthesis: Behavioral changes in travel-Challenges and implications for their identification and measurement. Transp. Res. Procedia 2018, 32, 563–572. [Google Scholar] [CrossRef]
  65. Brashers, D.E.; Neidig, J.L.; Haas, S.M.; Dobbs, L.K.; Cardillo, L.W.; Russell, J.A. Communication in the management of uncertainty: The case of persons Living with HIV or AIDS. Commun. Monogr. 2000, 67, 63–84. [Google Scholar] [CrossRef]
  66. Informator Statystyczny–ZTM Warszawa. Available online: https://www.ztm.waw.pl/statystyki/ (accessed on 8 July 2021).
  67. Statistics of Warsaw, Statistical Office in Warszawa/Warsaw. 2021. Available online: http://warszawa.stat.gov.pl/en/warsaw/ (accessed on 8 July 2021).
  68. ZTM w Warszawie, Zarząd Transportu Miejskiego w Warszawie. Raport 2020. 2021. Available online: www.ztm.waw.pl (accessed on 8 July 2021).
  69. Kostelecka, A.; Kulpa, T. Warszawskie Badanie Ruchu 2015 Wraz z Opracowaniem Modelu Ruchu. 2016. Available online: https://transport.um.warszawa.pl/documents/62470/8560273/WBR_2015_SYNTEZA_POL.pdf/e845cef6-5f42-76a6-d2b8-50b83e486f2c?t=1634498737045 (accessed on 15 December 2021).
  70. Urząd Statystyczny w Warszawie/Dane o Województwie/Stolica Województwa/Ludnosc. Available online: https://warszawa.stat.gov.pl/dane-o-wojewodztwie/stolica-wojewodztwa/ludnosc/ (accessed on 15 December 2021).
  71. Anthony, D.L.; Appari, A.; Johnson, M.E. Policy Brief. J. Health Soc. Behav. 2020, 55, 107. [Google Scholar] [CrossRef]
  72. Przybylowski, A.; Stelmak, S.; Suchanek, M. Mobility behaviour in view of the impact of the COVID-19 pandemic-public transport users in gdansk case study. Sustainability 2021, 13, 364. [Google Scholar] [CrossRef]
  73. Tarkowski, M.; Puzdrakiewicz, K.; Jaczewska, J.; Połom, M. COVID-19 lockdown in Poland–changes in regional and local mobility patterns based on Google Maps data. Pr. Kom. Geogr. Komun. PTG 2020, 23, 46–55. [Google Scholar] [CrossRef]
  74. Domański, C. Metody Statystyczne Teoria i Zadania—Czesław Domański; Wydawnictwo Uniwersytetu Łódzkiego: Łódź, Poland, 2001. [Google Scholar]
  75. Arthi, V.; Parman, J. Disease, downturns, and wellbeing: Economic history and the long-run impacts of COVID-19. Explor. Econ. Hist. 2021, 79, 101381. [Google Scholar] [CrossRef] [PubMed]
  76. Le Quéré, C.; Jackson, R.B.; Jones, M.W.; Smith, A.J.; Abernethy, S.; Andrew, R.M.; De-Gol, A.J.; Willis, D.R.; Shan, Y.; Canadell, J.G.; et al. Temporary reduction in daily global CO2 emissions during the COVID-19 forced confinement. Nat. Clim. Chang. 2020, 10, 647–653. [Google Scholar] [CrossRef]
  77. Budd, L.; Ison, S. Responsible Transport: A post-COVID agenda for transport policy and practice. Transp. Res. Interdiscip. Perspect. 2020, 6, 100151. [Google Scholar] [CrossRef]
  78. Combs, T.S.; Pardo, C.F. Shifting streets COVID-19 mobility data: Findings from a global dataset and a research agenda for transport planning and policy. Transp. Res. Interdiscip. Perspect. 2021, 9, 100322. [Google Scholar] [CrossRef]
  79. Dai, J.; Liu, Z.; Li, R. Improving the subway attraction for the post-COVID-19 era: The role of fare-free public transport policy. Transp. Policy 2021, 103, 21–30. [Google Scholar] [CrossRef]
Figure 1. Number of passenger entries to the subway in Warsaw from 19 January to 21 April.
Sustainability 14 01780 g001
Figure 2. Estimated number of passengers using public transport in Warsaw for years 2018–2020.
Sustainability 14 01780 g002
Figure 3. Characteristics of the respondents (in %). Source: own elaboration.
Sustainability 14 01780 g003
Figure 4. Since the outbreak of the pandemic, have you changed your decisions regarding the choice of means of transport for everyday travel (to work, school, etc.)?
Sustainability 14 01780 g004
Figure 5. Did the pandemic directly contribute to the reduction in the number of trips made by public transport (PT)?
Sustainability 14 01780 g005
Figure 6. Means of transport for daily trips before and during pandemic. (* Other includes: scooters, and services such as Uber, taxis, etc. In ‘other’, part of the answers included remote work, without any need for travelling).
Sustainability 14 01780 g006
Figure 7. Frequency of use of public transport before and during the pandemic.
Sustainability 14 01780 g007
Figure 8. The reason for reducing the frequency of use of public transport.
Sustainability 14 01780 g008
Figure 9. Assessment of the overall preparedness of collective public transport to the requirements of the pandemic in terms of passenger safety.
Sustainability 14 01780 g009
Table 1. Research review in the field of COVID-19 and its impact on mobility.
AuthorAreaMain Research Findings
[40,41,42,43]Spain
  • Approximately 38% of respondents reported that they would telework, 38% that they would work in person, and 24% did not know which mode of transport they would choose;
  • Travelling daily for commuting reasons, including going to work/education centres, decreased by 30.3%;
  • Trips related to shopping/grocery and leisure activities, which in most cases took place once a week, reduced their percentage by 15.5% and 13.1%, respectively;
  • The mode of transport mostly expected to be reduced is public transport. Its use was reduced for all travel purposes, especially for “work/study” (−11.6%), “leisure” (−8.8%) and “shopping/grocery” (−5.4%).
[23,42,44]Germany
  • More than two thirds of respondents reported the elimination of trips as a result of working from home (68.8%) and the cancellation of appointments (67.8%);
  • More than half (58.8%) of the respondents confirmed that their use of different modes of transport had changed since the outbreak of the pandemic;
  • The number of rail passengers went down by roughly 40%, and the number of people using public transport (short distance) decreased by 11% for the first quarter of 2020;
  • Weekday movements were reduced by as much as 38%;
  • Before the spread of COVID-19 in Germany, 68% of the adult population was restricted to one mode of transport. During the strictest period of lockdown, this share increased to 83%;
  • The overall share of people who used bicycles decreased from 32% to 24% during the particularly restricted period of lockdown;
  • Only 13% of the adult population used public transport during the lockdown, compared to 23% before COVID-19;
  • We see the steepest drop of public transport users amongst inhabitants of metropolitan areas (from 47% to 32%) and major cities (from 35% to 21%) during the strictest period of lockdown.
[45]Switzerland
  • Particularly evident is the large increase in cycling observed during the lockdown, which was sustained throughout the summer of 2020;
  • Public transport usage collapsed during the lockdown, and recovered much slower than other modes. It is still around only 50% of pre-pandemic levels;
  • Walking trips during the lockdown were much longer, but this behaviour was not sustained afterwards. Bus trips have become shorter since the start of the pandemic, potentially driven by the home-office trend.
[46,47]Greece
  • In general, a considerable reduction of 50% in the total number of daily trips per person during the pandemic was observed, regardless of the trip purpose;
  • There was a moderate drop in car usage (37.9% pre-pandemic compared to 29.5% during the pandemic period);
  • Public transport trips were severely limited during the pandemic period (22% during the pre-pandemic period compared to 0.2% during the pandemic period);
  • The modal share of trips on foot more than doubled (30.2% during the pre-pandemic and 64.7% during the pandemic period);
  • There was also a substantial increase in bicycle trips (1.1% during the pre-pandemic and 2.0% during the pandemic);
  • Travelers who mostly use a private car are 33.6% less likely to use public transport soon;
  • Travelers who are self-employed or have an age between 46 and 65 years old are 41.8% and 24.9% less likely to use public transport again, compared to the other professions and age groups, respectively;
  • One out of seven participants stated that at least six months would have to pass until they would again use public transport.
[30,48]The Netherlands
  • In September 2019, about 20% of the people stayed home on an average day. The survey showed that in March and early April 2020, respondents reported no trips on 50% of the days;
  • The average amount of trips dropped from 8.0 to 3.6 trips;
  • All travel modes were affected by this decrease in overall mobility. However, with only a 14% decrease, walking trips were affected the least;
  • The total travelled distance dropped from 94 km to 30 km. The average distance travelled per trip has dropped as well from around 12 to 8 km per trip;
  • Relatively speaking, the use of public transport and cars as a passenger show the largest decrease. For public transport, >90% fewer trips are reported, whereas almost 80% fewer car trips as a passenger are reported;
  • The average distance of a cycling trip has increased by 30%, from 3.3 to 4.3 km per trip. The length of walking trips increased even more by 83%, from 1.2 to 2.2 km per trip;
  • Cycling remained relatively constant in terms of distance: however, the number of trips decreased by almost 50%.
[49]Hungary
  • Demand for public transport decreased by 80% during the pandemic period, which led to a dramatic decrease in public transport’s modal share (from 43% to 18%);
  • The car modal share increased from 43% to 65%, while bicycle usage experienced the greatest growth rate, more than doubling its share (from 2% to 4%);
  • Of all the modes of transport, it was public transport on which the COVID-19 pandemic had the most direct effect. There was a 90% drop in number of passengers: instead of 4.3 million passengers daily, there were only 430 thousand;
  • There was a significant decrease in time spent away from home, dropping from 6.63 h on the 23 March to 2.92 on the 31 March;
  • Mobility was severely reduced, at least by 51% and maximally by 64%, and the middle estimate suggests a reduction of 57% in Budapest for the second half of March.
Table 2. Timeline of introduction of COVID-19 main restrictions in Poland taking into account transport restrictions.
4 March 2020First wave of COVID-19 pandemic in Poland 1 First case of a person infected with coronavirus (“patient zero”) in Poland
16 March 2020Introduction of the state of epidemic threat (the state of the pandemic announced by WHO was on 11 March 2020). Main restrictions:
  • Controls at the international borders along with 14-day quarantine;
  • Suspension of international flights;
  • Closure of shops in shopping malls, bars, restaurants (food only for take-away).
25 March 2020
  • Introduction of remote learning;
  • Limits in public transport vehicles: only half of the available seats can be used;
  • No gathering in parks and playgrounds;
  • Leaving the house kept to absolute minimum.
31 March 2020
  • Minimum 2 m distance between people outside;
  • Limits to the number of people in the shops;
  • Closure of hotels, beauty salons and hairdressers;
  • Closure of urban bike rental systems.
9 April 2020
  • Obligation to wear a protective mask in public places (inside buildings).
16 April 2020
  • Obligation to wear a protective mask in public places (inside and outside buildings and in open spaces).
20 April 2020
until 6 August
Loosening the restrictions in three stages, and for restrictions including transport:
  • Lifting restrictions at the borders (13 June 2020);
  • From 16 June 2020, international flights resume;
  • Changes to the limit to the number of passengers in public transport (50% of seats may be used or 30% of all seats and standing places) (18 May 2020).
6 August 2020Second waveGrowth in the number of infections caused introduction of new limits at district level: creation of “green”, “yellow” and “red” zones, with different types of restrictions.
10 October 2020Whole of Poland was a “yellow” zone as the number of infections still grew.
16 October 2020New limits on districts in “yellow” and “red” zones:
  • Limits to the number of passengers in public transport (50% of seats may be used or 30% of all seats and standing places) for both zones.
23 October 2020Whole of Poland was a “red” zone, and previous restrictions came back, including:
  • Remote learning and work if possible;
  • Closure of gyms, aquaparks and swimming pools;
  • Restaurants are closed, and work only for take-away;
  • Maintaining the restrictions on the number of passengers in public transport.
7 November 2020The period of conducting the surveyMaintaining the main restrictions, and additionally:
  • Closure of shops in shopping malls;
  • Closure of cultural institutions.
8 December 2020National COVID-19 immunization program design.
17 December 2020National quarantine introduced on 28 December 2020 until 17 January 2021.
1 February 2021 Loosening some restrictions, including remote learning and opening shops in shopping malls
26 February 2021
and 11 March 2021
Third waveReturn to restrictions in selected regions in Poland including:
  • Remote learning;
  • Closure of shops in shopping malls;
  • Closure of cultural institutions.
20 March 2021Partial lockdown in whole country.
27 March 2021Stricter safety rules during Easter, including closed kindergartens, shopping malls and beauty salons.
14 April 2021
until 26 June 2021
Loosening restrictions in subsequent stages in selected sectors:
  • Opening of kindergartens and amateur outdoor sports;
  • Hybrid school learning;
  • Opening of the shops in shopping malls;
  • Opening of gyms and beauty salons;
  • Limits in public transport (100% of seats may be used or 50% of all seats and standing places) (12 May 2021) and then full loosening (13 June 2021);
  • Sustained social distancing and necessity of wearing protective masks in the public buildings and partial limits to number of guests at cultural and sport events.
1 It has been accepted that the coronavirus pandemic in Poland has had three waves so far. The first one started in spring 2020, the second one in the autumn, and the third one took place in spring 2021. It can be differentiated from other countries and parts of the world due to multiple and different conditions of the spread of the virus.
Table 3. Means of transport for daily trips before and during pandemics.
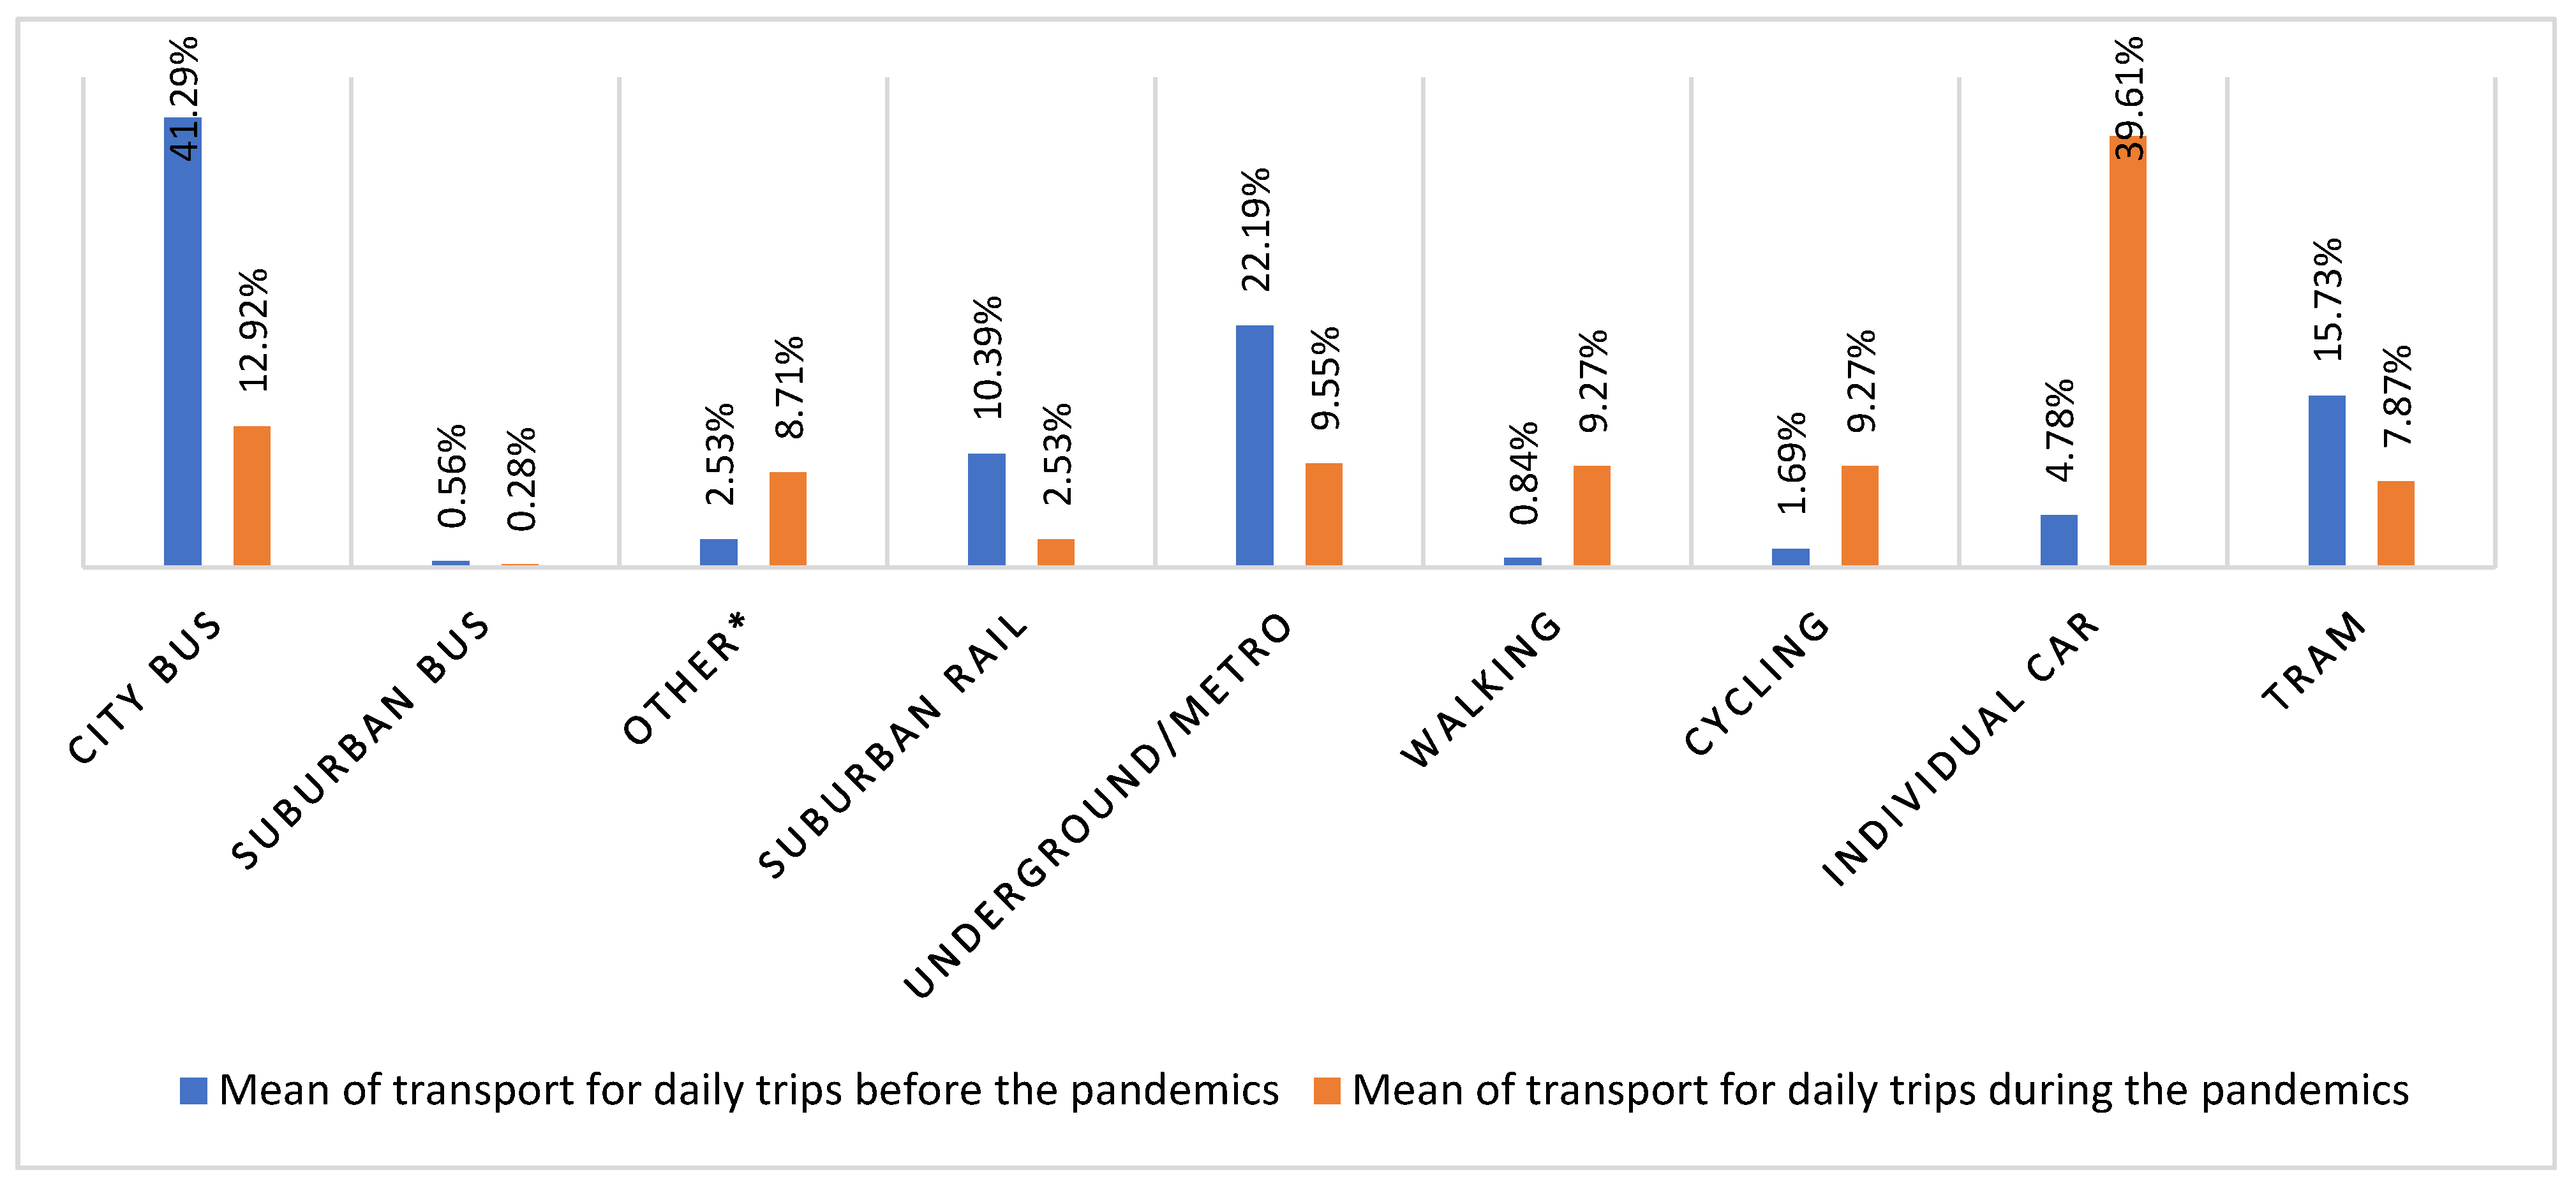
Means of Transport for Daily Trips before the Pandemic (in %)Means of Transport for Daily Trips during the Pandemic
City bus41.29%12.92%
Suburban bus0.56%0.28%
Other *2.53%8.71%
Suburban rail10.39%2.53%
Underground/metro22.19%9.55%
Walking0.84%9.27%
Cycling1.69%9.27%
Individual car4.78%39.61%
Tram15.73%7.87%
* Other includes: scooters, and services such as Uber, taxis, etc. In ‘other’, part of the answers included remote work, without any need for travelling (3.5% of all answers for this question).
Table 4. Results of correlation statistics.
QuestionGenderAgeEducation
How do you most frequently (taking into account the longest distance of travel) travel to work and/or school/university during the pandemic?chi square
14.01678274
chi test
0.05088366 ≤ 0.05
false
chi square
52.42294762
chi test
0.000166276 ≤ 0.05
true
V-Cramer
0.089068821
0–0.25 no connection
C-Pearson
0.86274184
very strong connection
chi square
83.1059645
chi test
0.004952268 ≤ 0.05
true
V-Cramer
0.112145301
0–0.25 no connection
C-Pearson
0.937952256
very strong connection
Since the outbreak of the pandemic, have you changed your decisions regarding the choice of transport modes for everyday travel (to work, school, etc.)?chi square
0.910345084
chi test
0.340022874 ≤ 0.05
false
chi square
11.53119512
chi test
0.009174426 ≤ 0.05
true
V-Cramer
0.108252918
0–0.25 no connection
C-Pearson
0.345027623
weak connection
chi square
17.32865975
chi test
0.008148318 ≤ 0.05
true
V-Cramer
0.132771765
0–0.25 no connection
C-Pearson
0.483730919
strong connection
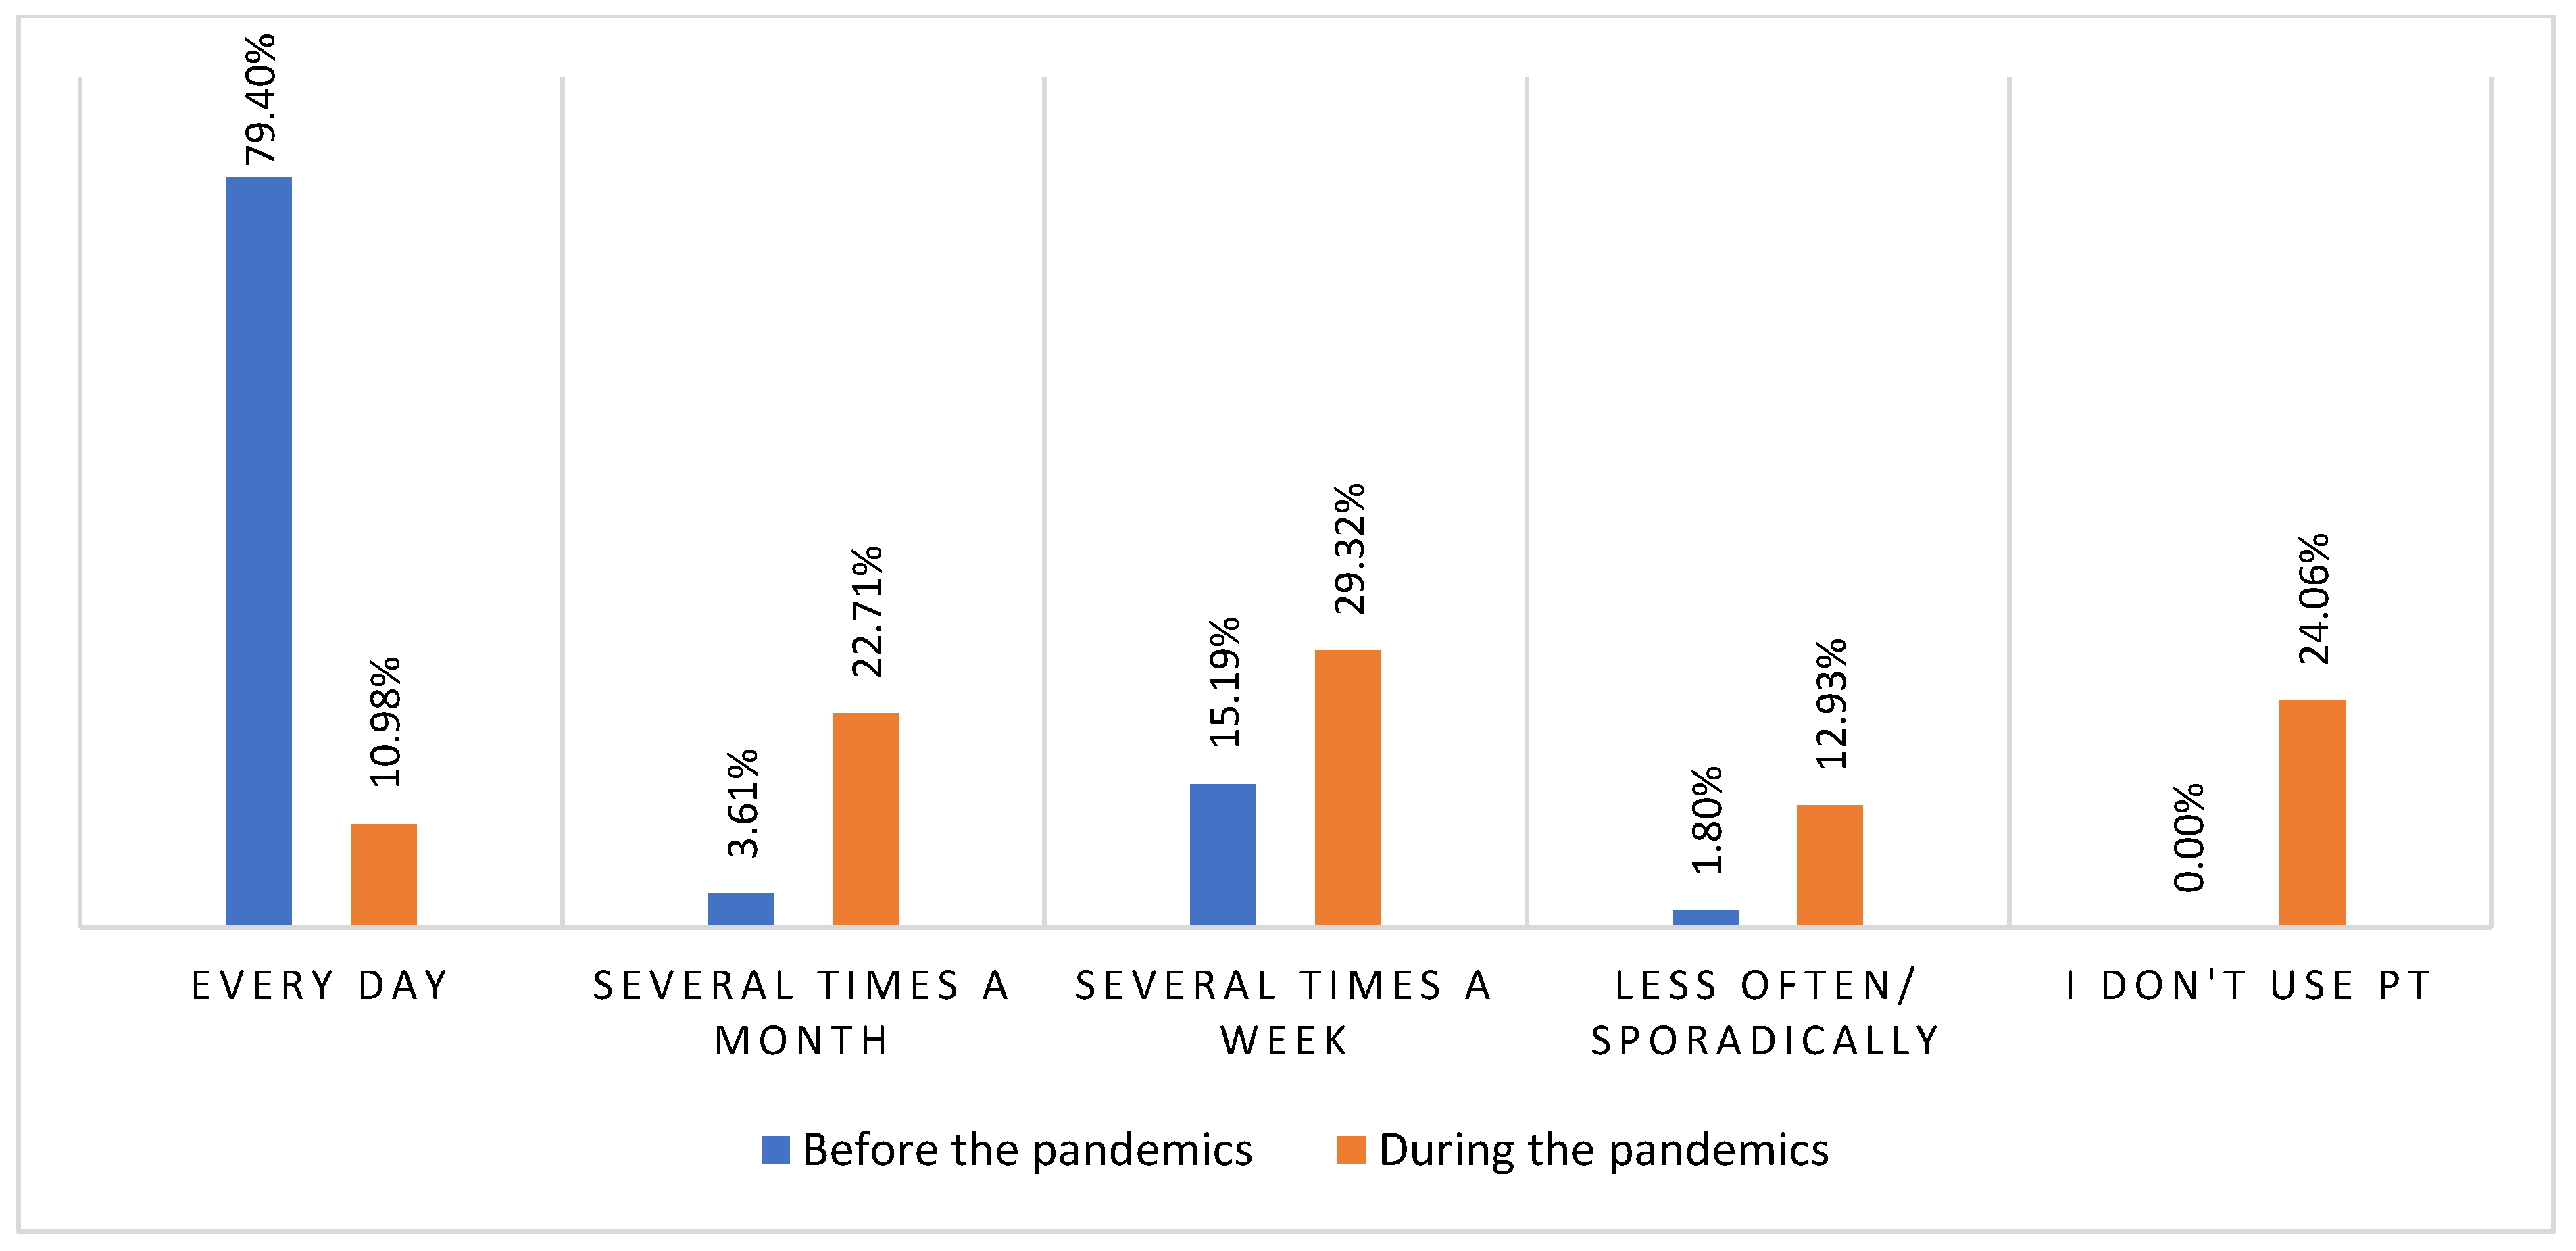
How often (before the outbreak of the pandemic) did you use public transport (buses, trams, metro)?chi square
9.431584295
chi test
0.05117218 ≤ 0.05
false
chi square
18.00688481
chi test
0.254000642 ≤ 0.05
false
chi square
23.59451912
chi test
0.701211802 ≤ 0.05
false
How often do you use public transport (buses, metro trams, etc.) during the pandemic?chi square
4.082501092
chi test
0.394955669 ≤ 0.05
false
chi square
35.49216016
chi test
0.000390817 ≤ 0.05
true
V-Cramer
0.115338236
0–0.25 no connection
C-Pearson
0.808585826
very strong connection
chi square
34.84449519
chi test
0.129755602 ≤ 0.05
false
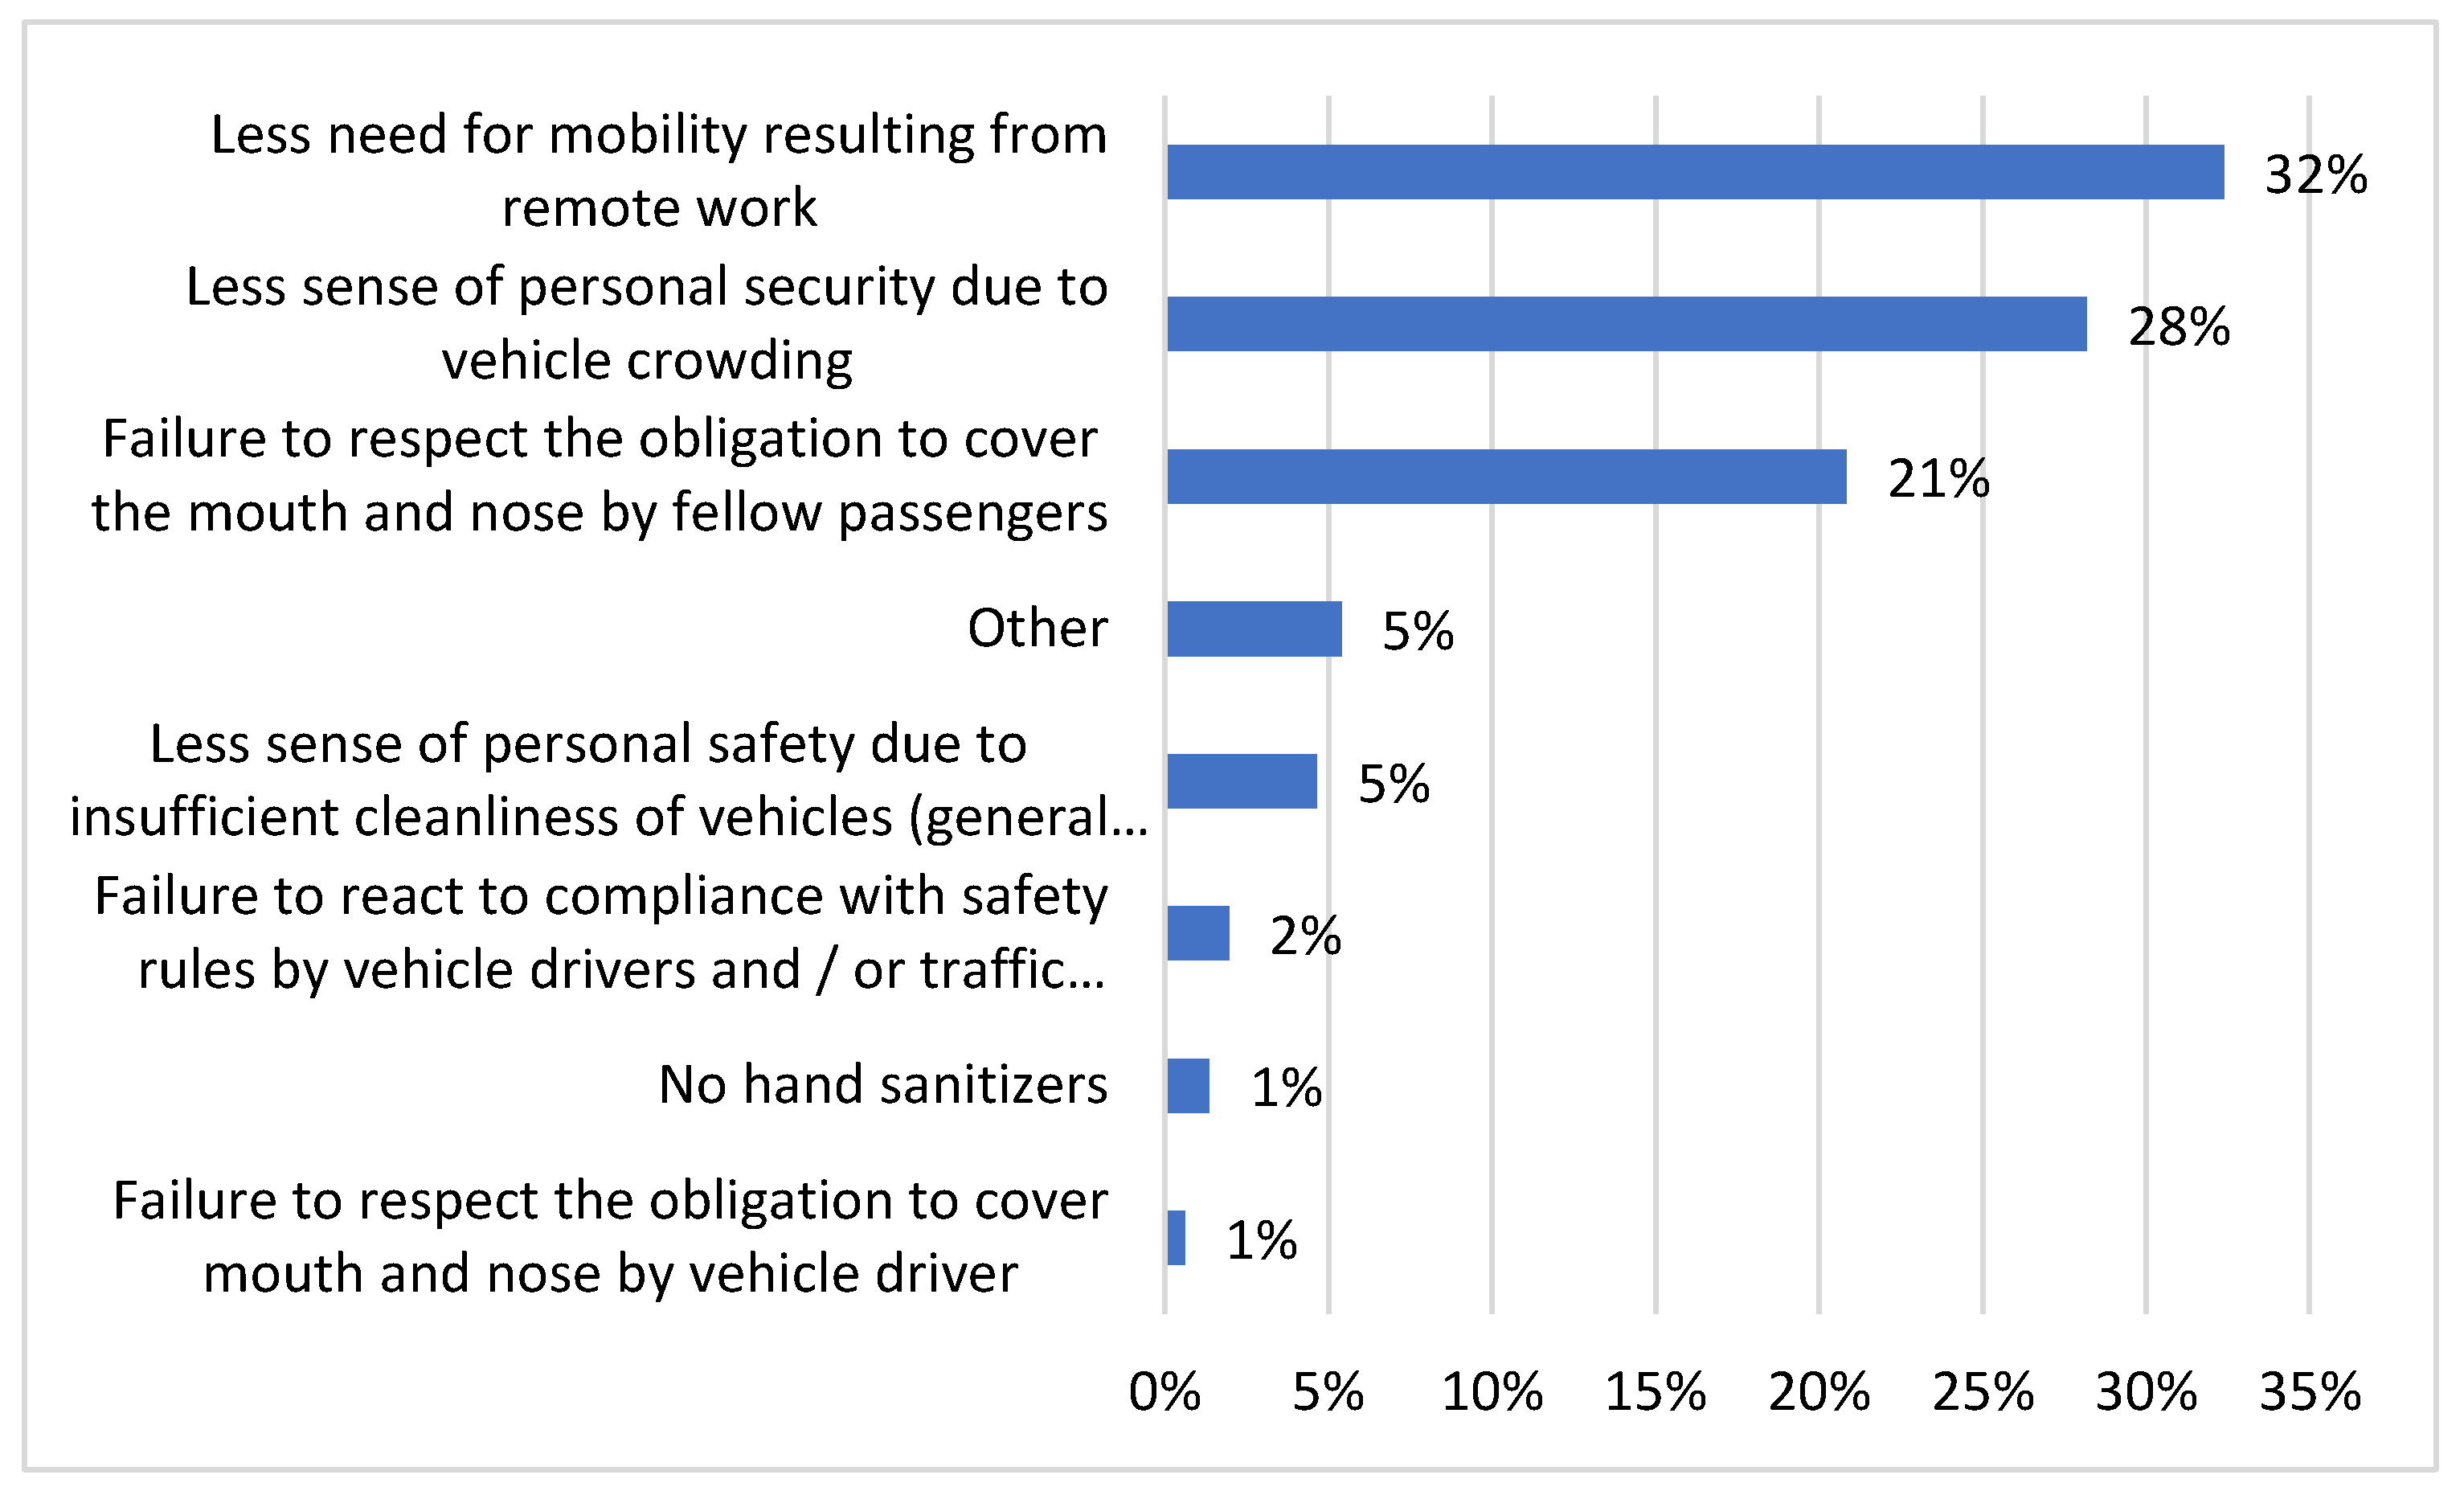
If your use of public transport has decreased, what is the reason for the reduction in the number of those trips?chi square
0.691223736
chi test
0.994678512 ≤ 0.05
false
chi square
24.87535962
chi test
0.154198714 ≤ 0.05
false
chi square
51.67333943
chi test
0.12075402 ≤ 0.05
false
How often have you used the car since the outbreak of the pandemic?chi square
8.920082251
chi test
0.030372525 ≤ 0.05
true
V-Cramer
0.054970065
0–0.25 no connection
C-Pearson
0.273518216
weak connection
chi square
18.84315366
chi test
0.026560049 ≤ 0.05
true
V-Cramer
0.079894819
0–0.25 no connection
C-Pearson
0.514935521
very strong connection
chi square
37.35345595
chi test
0.004711995 ≤ 0.05
true
V-Cramer
0.112545467
0–0.25 no connection
C-Pearson
0.765947911
very strong connection
What is your frequency of passenger car use during the pandemic?chi square
7.225359965
chi test
0.124447548 ≤ 0.05
chi square
20.43489673
chi test
0.059293583 ≤ 0.05
chi square
29.38654782
chi test
0.205921795 ≤ 0.05
Publisher’s Note: MDPI stays neutral with regard to jurisdictional claims in published maps and institutional affiliations.

