You are currently viewing a new version of our website. To view the old version click .
Sustainability
  • Article
  • Open Access

19 January 2022

Life Cycle Assessment (LCA) of Two Pneumatic Urban Waste Collection Systems Compared to Traditional Truck Collection in an Airport

,
,
,
and
1
URD—Urban Refuse Development, S.A., PCITAL Gardeny-Edificio H2, Planta 2a, 25003 Lleida, Spain
2
GREiA Research Group, University of Lleida, Pere de Cabrera s/n, 25001 Lleida, Spain
*
Author to whom correspondence should be addressed.
This article belongs to the Special Issue Environmental Sustainability, Planning and Energy Efficiency in Energy Communities

Abstract

Due to the increasing need for a more sustainable environment, the study of waste management strategies is increasing worldwide. Pneumatic urban waste collection is an alternative to the conventional truck collection, especially in urban areas, where there is a need of reducing traffic and its pollution. LCA is a methodology that can help in the evaluation of the environmental impact of any process or product; therefore, this study, based on the methodologies ISO 14040 and from the cradle to the grave, compares different waste collection systems in an airport. The results show that the pneumatic collection system with the innovative AutoWaste compact central unit can reduce the annual flow of greenhouse gases into the atmosphere (kilograms of carbon dioxide equivalent for 30 years and per ton) up to 25% compared to a pneumatic collection system with a conventional central.

1. Introduction

Automatic waste collection (AWC) technology plays a big role in the waste management systems shaping and maintaining smart and sustainable cities, leading the way to create smarter cities, improve quality of life today and secure a greener planet for future generations. The system makes urban environments cleaner and healthier, and reducing waste helps them become greener and more sustainable [1].
AWC is a modern and efficient waste collection system that improves the urban image, optimizes the selective collection at source, reduces the environmental impact, decreases the cost per ton collected compared to conventional systems, and offers a smart service 24 h a day, 365 days a year, and achieves citizen satisfaction. This solution has more impact in densely populated areas, especially urban areas and cities [2,3].
Today pneumatic waste collection systems are increasing their popularity, even if they have been around for decades, mostly due to the increasing environmental awareness of cities and their managers and policymakers. The benefits of these systems for the city are reducing personnel costs, truck and fuel costs, reducing CO2 emissions, traffic, and, of course, achieving a more pleasant and safe environment for people living in the area where the system is in use.
Benefits of the pneumatic system for the European and global objectives in terms of recycling levels, circular economy and the sustainable development goals should also be highlighted [4]. Other benefits of this waste collection system are the use of a pipeline instead of manual or truck operation, creating high-level sanitary conditions, realizing completely closed garbage collection and transportation, and eliminating cross-pollution [5].
An LCA life cycle assessment is considered an effective methodology to assess any product or systems environmental impact. This approach allows quantifying and evaluating the environmental impact generated by a product during the entire production and operation stage, and even by the activity that takes place during the entire life cycle of the product, from the extraction of the material premium to the final disposal [6]. Moreover, applying a life cycle perspective allows comparative assessments of processes and identification of benefits [7]. LCA studies also allow to carry out sensitivity analyses when technological pathways are involved in helping in the identification of key points where future optimization and innovation efforts must focus [8].
Different authors have performed different LCA in different locations with different systems, as summarized below. Punkkinen et al. [9] evaluated the life cycle inventory (LCI) in terms of atmospheric emissions of a hypothetical stationary pneumatic waste collection system within an existing, densely populated city infrastructure in Helsinki, Finland, compared with a conventional door-to-door alternative. According to these authors, a pneumatic waste system would generate more air emissions due to its high electricity consumption and the manufacture of system components. On the other hand, at the local level, in the waste collection area, emissions would decrease as collection traffic would be reduced. If the case area is increased, the total NOx emissions would be 24% lower, whereas SO2 emissions would be 17 times higher.
Uson et al. [10] carried out a comparative LCA between a pneumatic waste collection system with a truck collection system in a neighborhood of Zaragoza, Spain. Results showed that, when operating at loads close to 100%, the pneumatic collection system had better environmental performance compared to the conventional system.
Perez et al. [11] compared the environmental performance of different municipal waste collection and transport systems using the LCA methodology. They concluded that the environmental impact from pneumatic systems is higher than from conventional systems. Furthermore, within the conventional systems, underground installations have a higher impact than surface containerization systems.
Chàfer et al. [2] studied the influence of the electricity consumption when evaluating six different waste collection systems (trucks—electric, gas, diesel, diesel–electric, gas–electric—and stationary pneumatic waste collection) in terms of LCA in the city of Barcelona, Spain. Their results showed that the energy source might trigger variations up to 80%.
This study presents, for the first time, a comparative life cycle analysis of three different urban waste collection systems: a traditional pneumatic collection with a conventional central, a pneumatic system with an AutoWaste Collect Compact System, and a truck collection. This LCA includes the collection of four waste fractions (organic, rest, paper and cardboard, and packaging) in an AWC Airport. This study is based on the international standards ISO 14040 and 14044. A cradle-to-grave life cycle analysis has been carried out, which includes the production, use and end of life of the systems. A lifetime of 30 years has been considered, although the results can be extrapolated over time.
The environmental impact was calculated following the life cycle analysis methodology with the ReCiPe indicators, giving impact points by categories of damage, and IPCC 2013 GWP100a, giving equivalent kilograms of CO2 emitted into the atmosphere. In addition to comparing different systems and scenarios, the results also provide valuable information to know which equipment or element has a more significant impact on the environment and, thus, to redesign, modify, and optimize the system towards a more sustainable system.

2. Methodology

2.1. Considered Waste Collection Systems

An AWC airport was studied. Three different waste collection systems were considered, the traditional pneumatic system, the pneumatic AutoWaste Compact Collect system and truck system.

2.1.1. The Traditional Pneumatic System

The traditional pneumatic collection system uses waste collection points (outside or inside a building), where the waste is dumped, and it is moved through a pipes-based transport network to a collection center (Figure 1). The waste is pressed by fractions in the collection site to reduce the volume before its final transport to the endpoint, which is usually a municipal waste treatment plant.
Figure 1. Pneumatic waste collection system [2].
During the process of pneumatic collection, fans, cyclones, compactors, and more industrial machinery type equipment that consume electricity should be considered. Through a control system, the collection process is initiated by creating an airflow that sucks the waste from its waste collection point to the collection center. Once the waste reaches the collection center, it is separated according to the fraction to which it corresponds (organic, packaging, paper and cardboard, or unsorted), and it is pressed by the fraction in the container that will be used for its subsequent transport to a treatment plant by trucks.
Moreover, the building has a biofilter that allows filtering the air, which is collected in the collection central, by its passage through a base of poplar bark, which only requires minimum consumption of water to maintain humidity and that it is a sustainable environmental option to purify the air of particles or odors before being poured into the atmosphere.

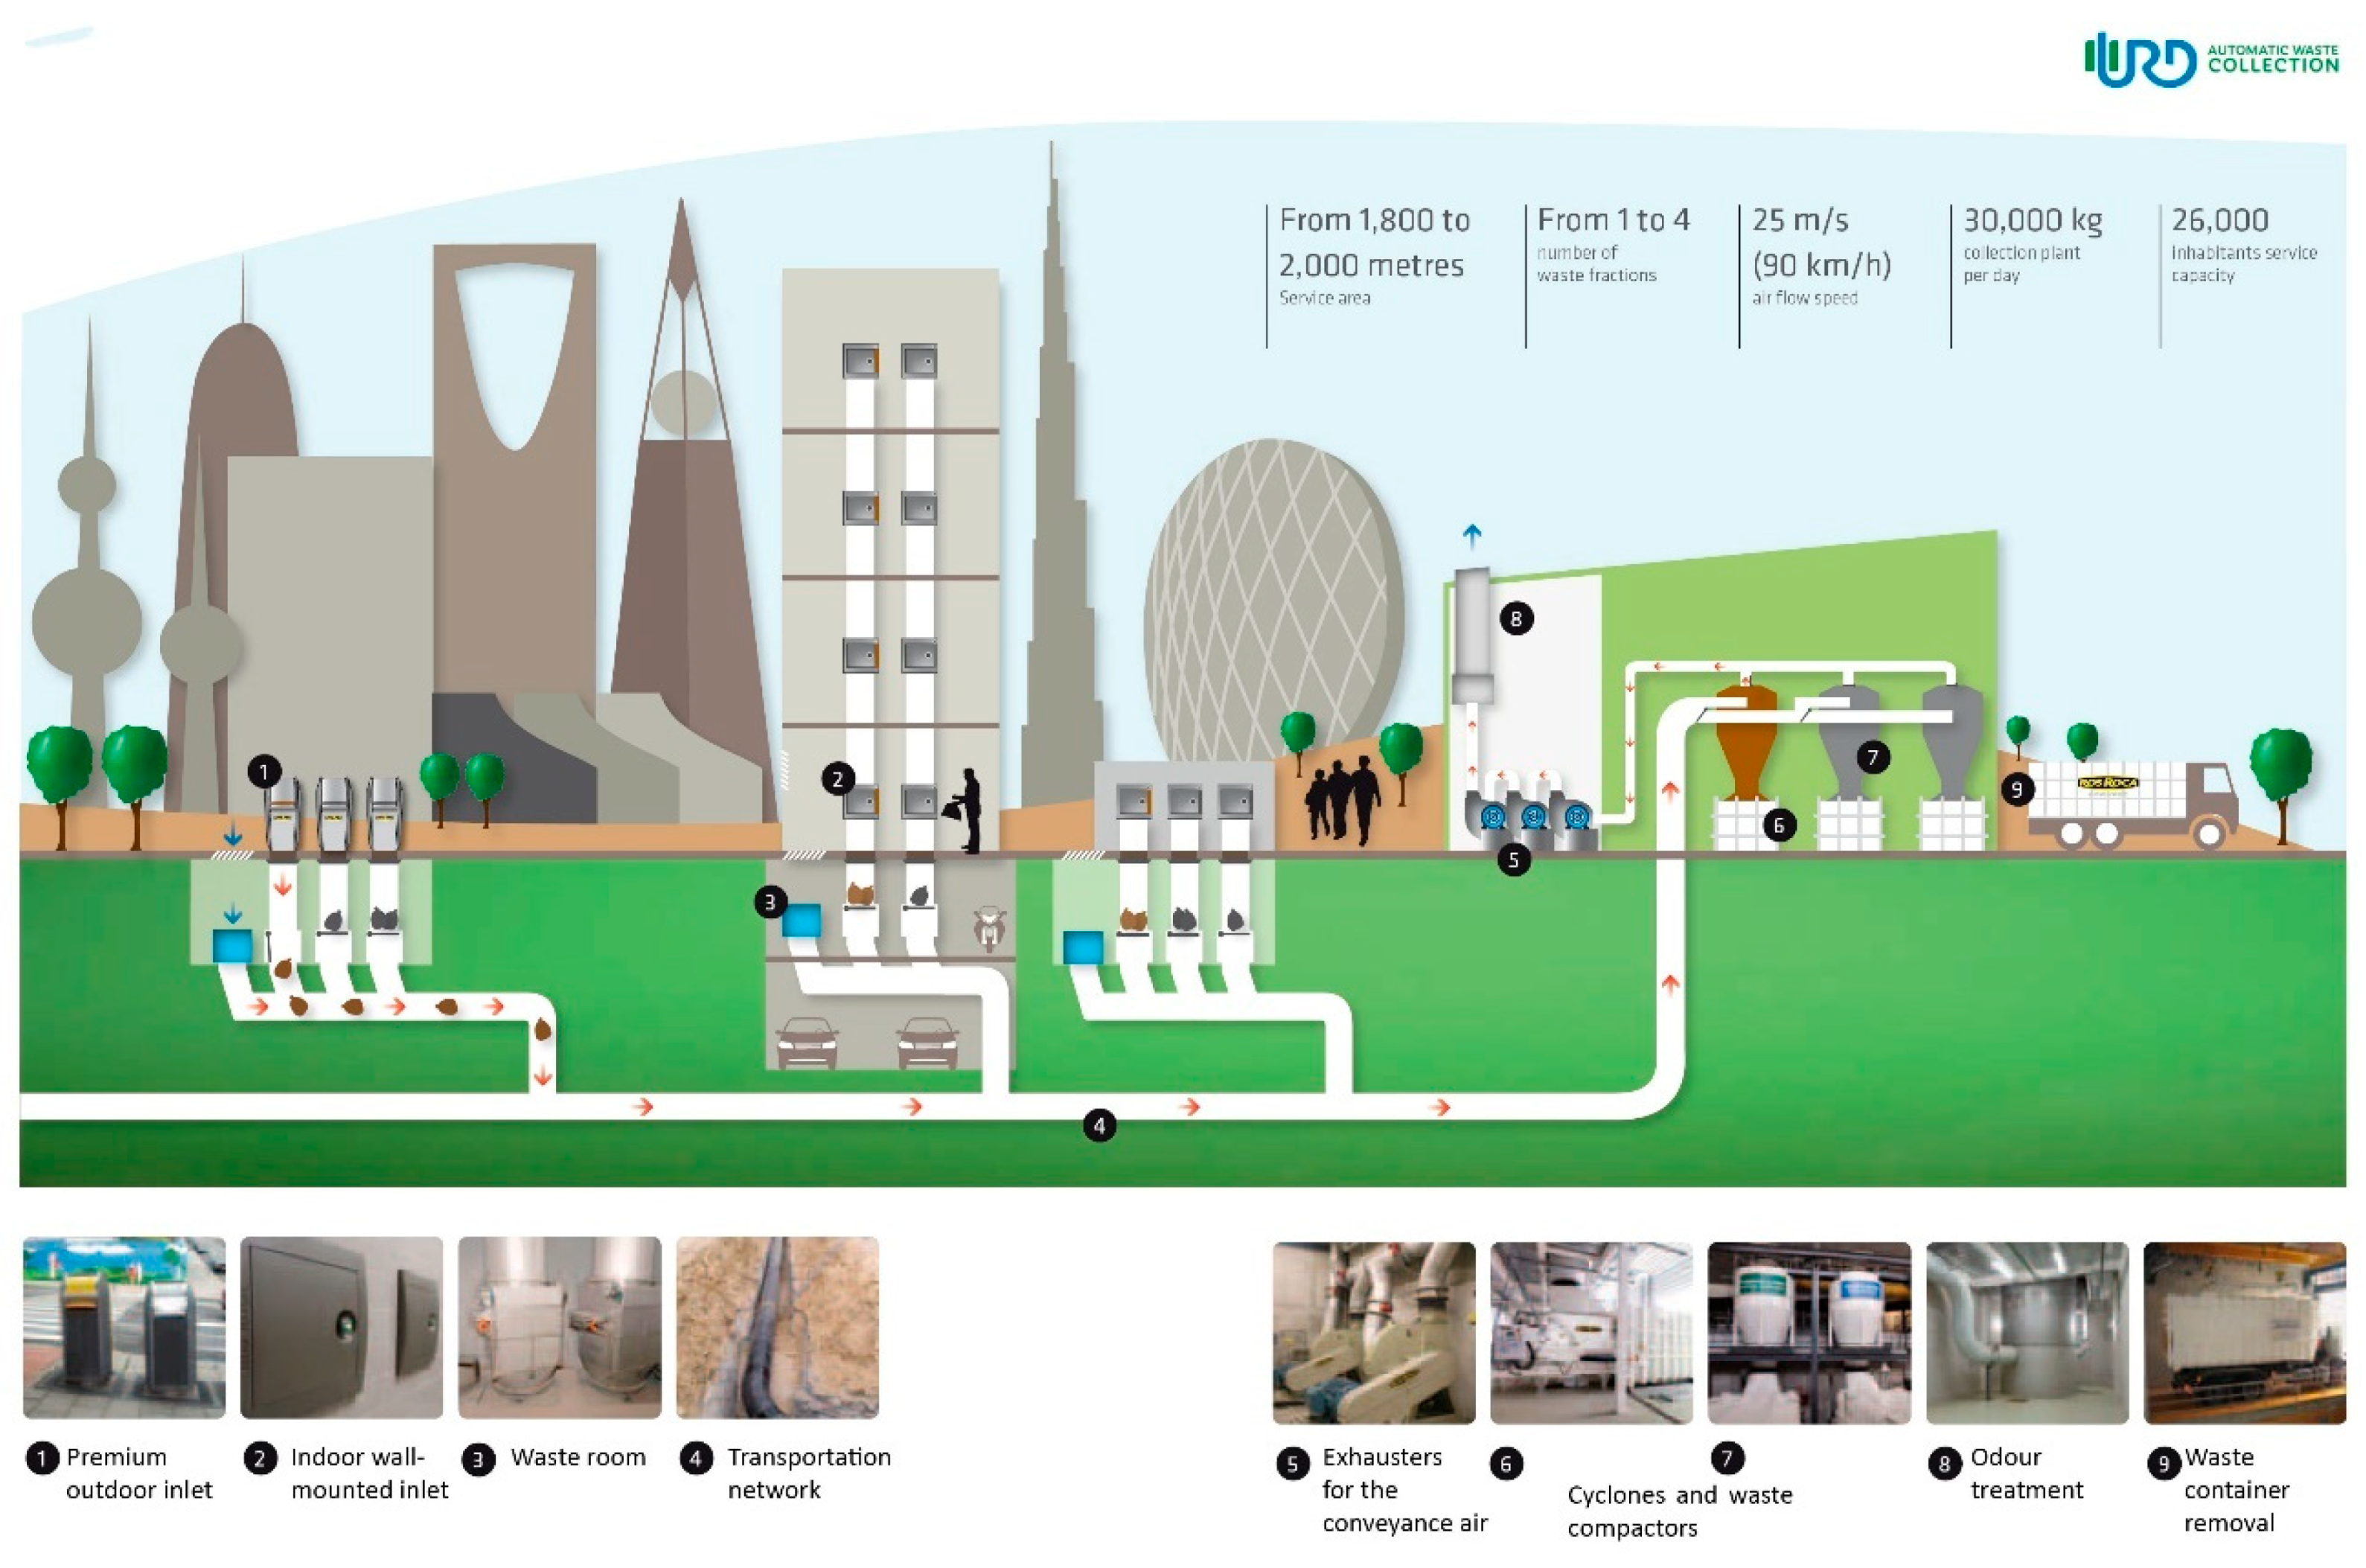
2.1.2. The Pneumatic AutoWaste Compact Collect System

The AutoWaste Compact Collect pneumatic system (from now on named “AutoWaste system”) is based on bi-compartmentalised containers that reduce the volume of the terminal compared to a traditional pneumatic waste collection system. This compact plant occupies minimum space and does not need civil works to be installed. Moreover, it collects up to 5 tons/day of waste generated, providing a solution to users’ needs. It has a watertight transport system with hermetic closure, and through a network of pipes, the waste is transported by aspiration from the point of discharge to the central where the waste is automatically disposed of and compacted in bi-compartmentalised containers to be transported to the treatment plant. This compact plant is also called a modular plant since it has three main modules: suction module, compaction module, and container module (Figure 2 and Figure 3). The container module is the one that is finally transported by the truck to the urban waste treatment plant. The AutoWaste system has a better performance in low productions (0–5 ton/day).
Figure 2. AutoWaste Compact Collect system.
Figure 3. Real detail of the AutoWaste Compact Collect system.

2.1.3. Truck System

The traditional urban waste collection system is based on trucks that make an urban route collecting each fraction of waste that is then transported to an urban waste treatment plant. Only diesel trucks were considered in this system. In addition, the total number of containers of each fraction of the area under study was also quantified.
In this pick-up scenario, the trucks leave from the airport terminal. It is considered that they travel to the same waste treatment plant in a parallel scenario to that considered in pneumatics. It carries out the necessary postage (going to containers and back to waste treatment plant) that are necessary to empty all the containers of the same fraction and finally returns to the truck park. To carry out the collection, two trucks are used for each fraction. The transport rates of the trucks by type of fraction were estimated by URD.

2.1.4. Assumptions on Both Pneumatic Systems

The assumptions considered of both systems are the following: The worst-case scenario is chosen when the required information is not available in the database. The construction of pneumatic pipes has been considered as perforations 0.5 m deep. After 30 years, pipes, manholes, valves, and mailboxes will not be removed. A lifetime of 50 years of the building of the collection center is considered. The equipment of the plant is considered to be recycled at the end of their lifetime and replaced throughout the 30-year operation considered. Real data were used for electricity and water consumption. Moreover, both systems collect the waste at the same starting at the airport terminal and arriving at the same endpoint.

2.2. Description of the Scenarios

Given the high impact that the used electricity has in the operation phase and in the overall LCA [2], two scenarios were considered. In the first one, Scenario 1, the energy mix available in the Ecoinvent database was used. However, this is an energy mix that does not reflect the strong efforts performed in Spain and Europe to decarbonize its energy system [12,13]. Therefore, a theoretical green energy mix was designed and used to evaluate these waste collecting systems in a more realistic and environmental framework.

2.2.1. Scenario 1: Spanish National Energy Mix (2014)

Ecoinvent v3.6 database uses the Spanish national energy mix, as shown in Figure 4. However, the one used by the database is from the year 2014. It is important then to take into consideration that the energy mix used in this study includes fewer renewable energy sources than the reality, and thus, in this scenario, the environmental impact is overestimated.
Figure 4. National energy mix 2014.

2.2.2. Scenario 2: Renewable Energy Mix

A hypothetical future energy mix is designed in this study by considering a contribution of 20% hydroelectricity, 30% PV, and 50% wind. According to [14], in the future energy mix in Spain, the contribution of hydroelectricity is not expected to grow much more than that of today, since the resources are mostly used. Therefore, 20% hydro is considered. Solar and wind are expected to grow, but the wind contribution should be higher than the solar one, following the literature studied [2]. Therefore, 30% PV and 50% wind are considered.

2.3. LCA Methodology

The LCA methodology was used to quantify and compare the potential environmental impacts of the different municipal waste management scenarios. This study was based on ISO 14040 and ISO 14044 standards (ISO 14040, 2006; ISO 14044, 2006) [15]. According to these standards, an LCA includes four main steps: goal and scope, analysis inventory, life cycle impact analysis, and interpretation of the results.

2.3.1. Objectives and Scope

This study aims to evaluate the environmental impact of the three urban waste collection systems at an airport for 30 years of lifespan. The present LCA study covers all phases, from the construction of the system, the operation, maintenance, equipment replacement, and up to their final disposal.

2.3.2. Functional Unit

The functional unit provides a common basis for the comparison of results [15]. The most commonly used functional unit in LCA for waste collection is 1 ton of waste per year [16]. Thus, the functional unit of this study was 1 ton of generated MSW per year with a lifetime of 30 years, in order to compare the different systems and furthermore, in order to compare with other authors from the literature.

2.3.3. Impact Analysis

The Ecoinvent v3.6 [17] database was used to obtain the environmental impacts of the materials, transport and energy employed in the study. The quantitative indicators used were the ReCiPe [18] and the IPCC2003 GWP [19]. The primary objective of the ReCiPe method is to transform the long list of life cycle inventory results into a limited number of indicator scores. These indicator scores express the relative severity of an environmental impact category. Endpoint indicators show the environmental impact on three higher aggregation levels: effect on human health, ecosystem quality, and resources.
On the other hand, the IPCC 2013 Indicators, proposed by the Intergovernmental Panel on Climate Change (IPCC), were used, quantifying the climate change impacts of greenhouse gas emissions due to human activities by aggregating them into a standard unit, in kg CO2-equivalent.

2.3.4. Analysis Inventory

The inventory is a list of all substances involved in the process. Each system was evaluated separately. Table 1 and Table 2 show the inventory of the traditional pneumatic system, and Table 3 and Table 4 the inventory of the waste collection systems studied. The inventories of both systems were obtained from the company Urban Refuse Development. Finally, Table 5 and Table 6 include the inventory of the truck collection system.
Table 1. Inventory of the infrastructure of the traditional pneumatic system—manufacturing phase.
Table 2. Inventory of the traditional pneumatic system—operational phase.
Table 3. Inventory of the automated waste collection system—manufacturing phase.
Table 4. Inventory of the automated waste collection system—operational phase.
Table 5. Inventory of the infrastructure of the truck system—manufacturing phase.
Table 6. Inventory of the truck system—operational phase.

3. Results and Discussion

Considering the infrastructure of each system and what they consume during its 30 years of operation, together with the hypotheses detailed above, the results of the LCA of three urban waste collection systems were analyzed: two of them are pneumatic collection systems, one with a conventional collection center and the other with an AutoWasteCollect compact collection system, and the third is the traditional collection system with trucks.
The results are presented grouped by indicators, ReCiPe (impact points) and the IPCC2013 GWP (kg CO2 equivalent), in addition to carrying out the study using two different energy mixes: the 2014 energy mix, chosen from the Ecoinvent database, and an energy mix that includes the incorporation of renewable energies in the production of electricity in our country (20% hydroelectric production, 30% solar production, and 50% wind production), which we will call hypothetical since it is not found in the Ecoinvent database.

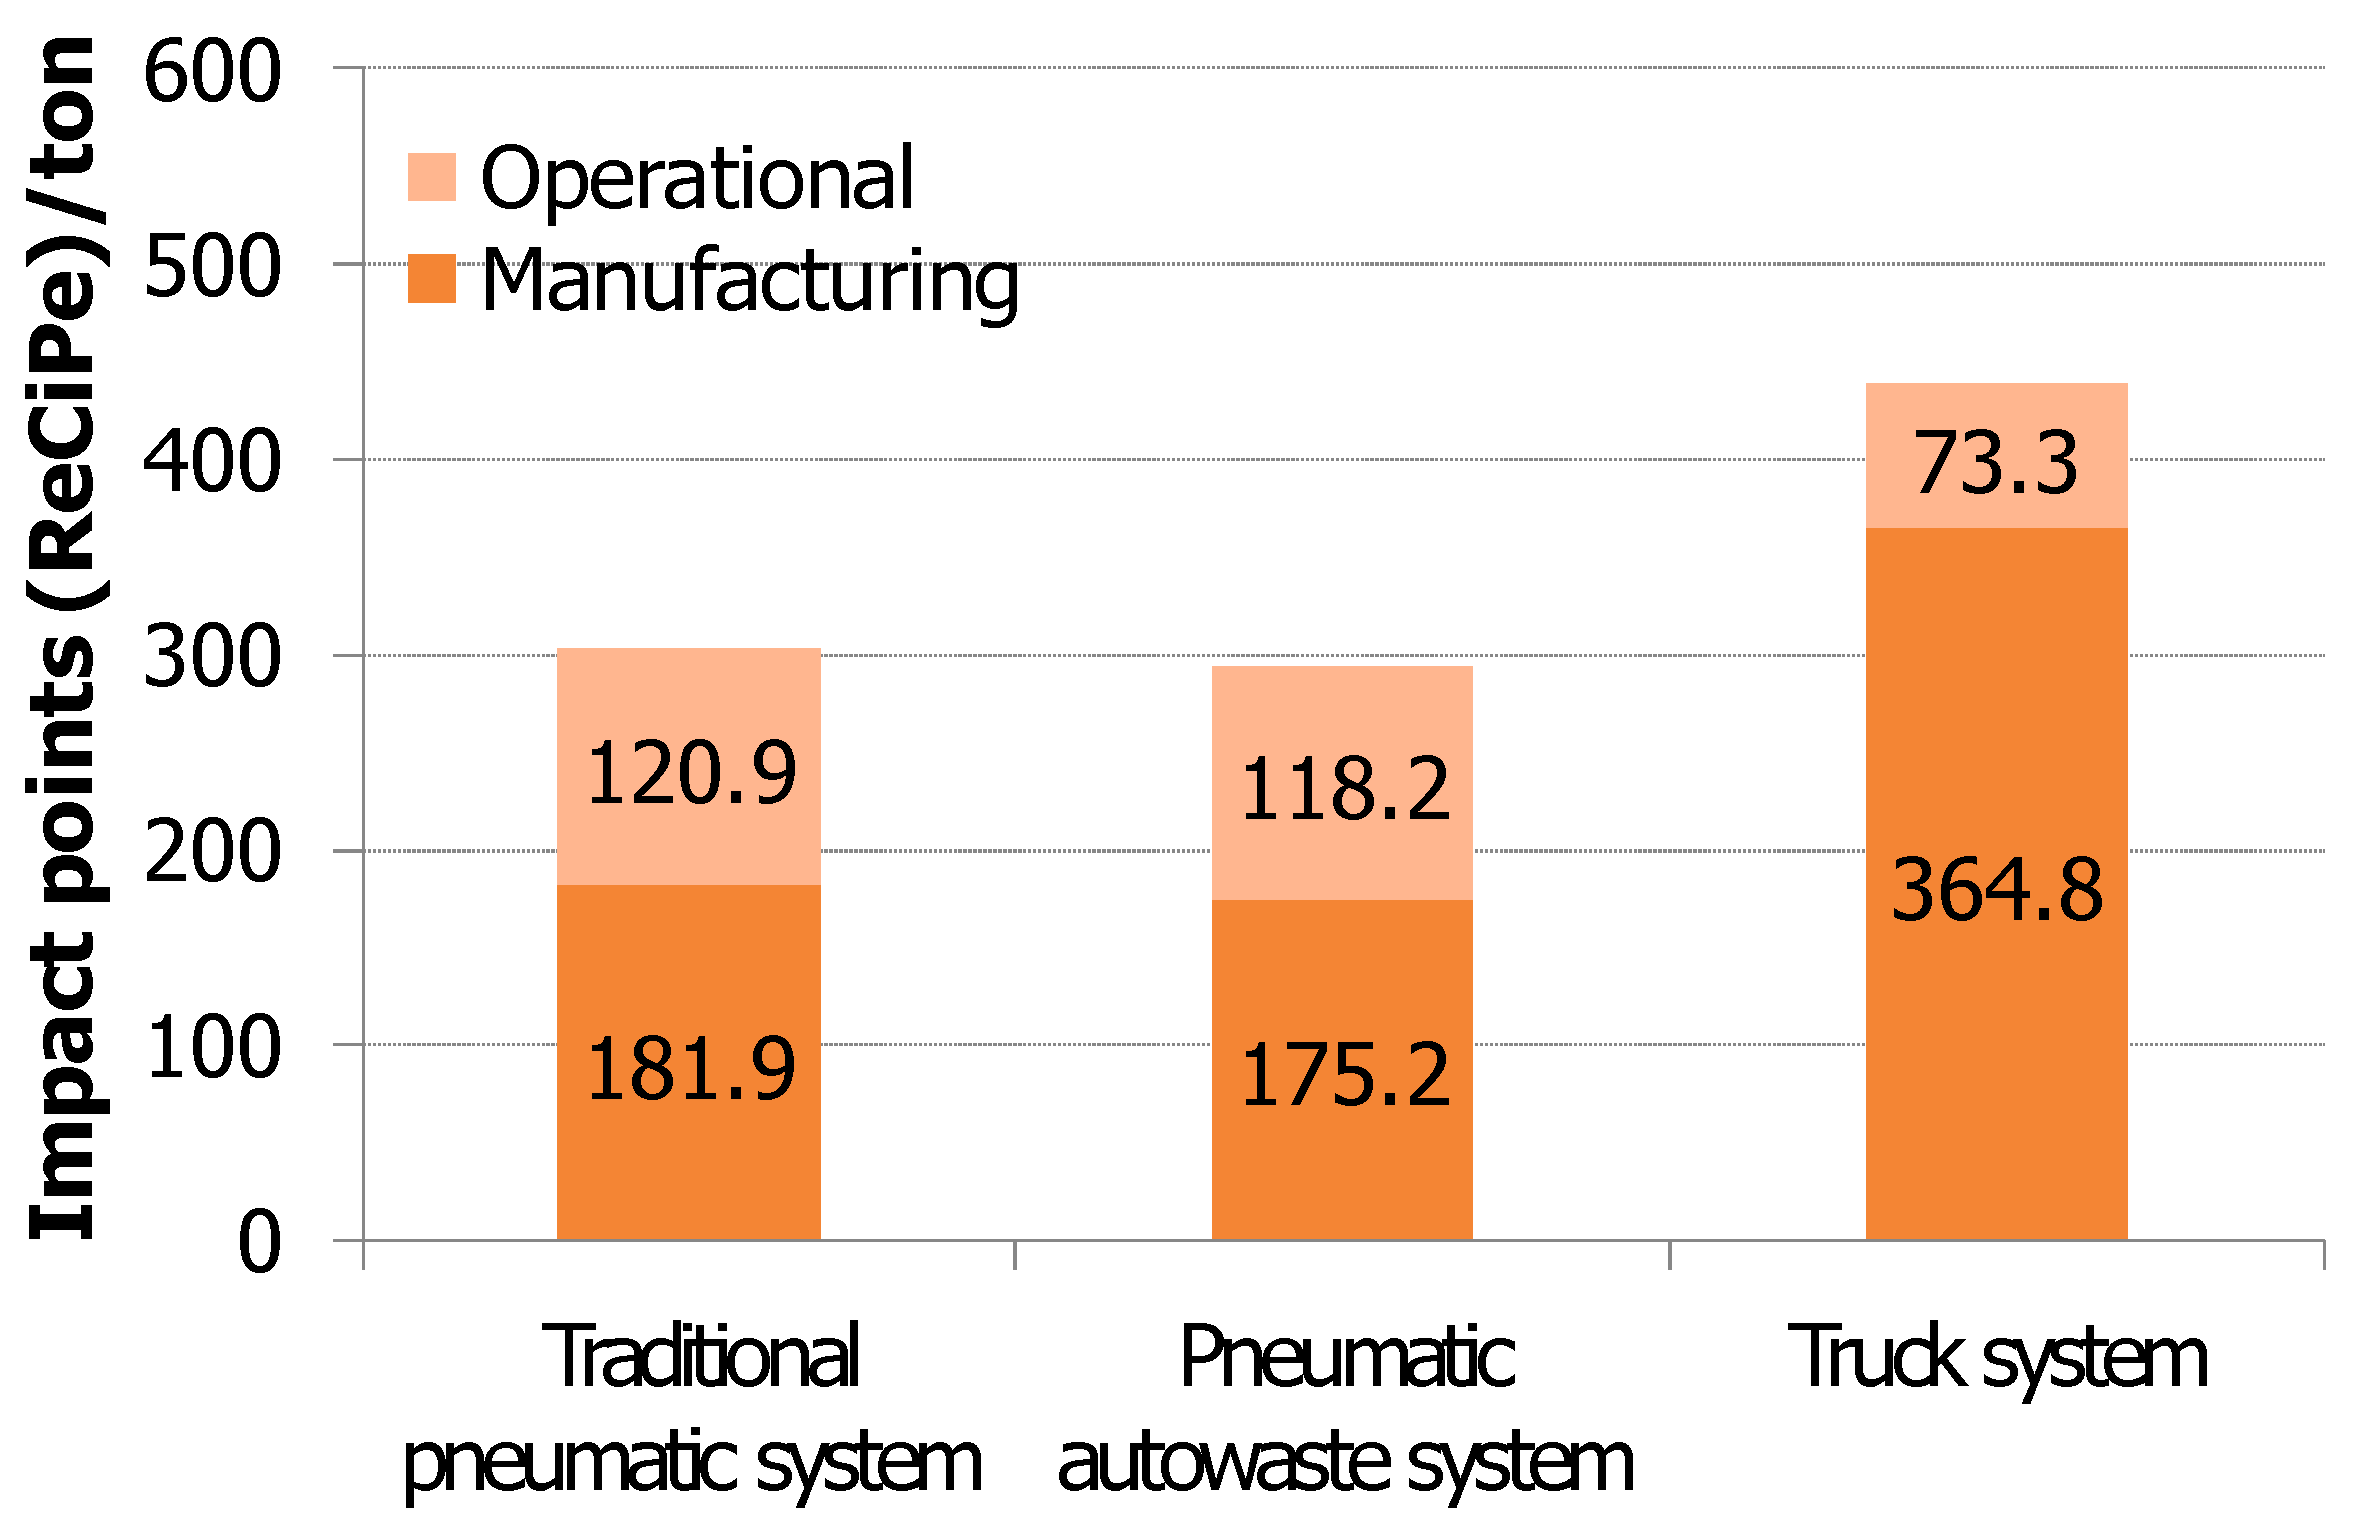
3.1. Results Obtained Using the ReCiPe Indicator

Figure 5 shows that the traditional collection system with trucks is the collection system that has the fewest impact points, with 484 points per ton of waste per year. On the other hand, of the pneumatic collection systems, the compact AutoWaste system has fewer impact points than the conventional collection center (629 and 748 impact points, respectively). As far as pneumatic collection systems are concerned, the compact AutoWaste system unit reduces the environmental impact by 19% compared to a system with a conventional collection unit.
Figure 5. Impact points for manufacturing and operational phases per ton of waste of each system using the ReCiPe indicator and energy mix 2014.
Regarding the contribution of each of the life cycle phases to the environmental impact, the contribution is different if the system is a pneumatic collection or if it is a conventional system with trucks. In the case of a traditional collection with trucks, the construction phase is the one that provides the highest contribution to the environmental impact, while in the pneumatic collection, the environmental impact is mainly due to the operational phase.
For the collection with trucks, the construction phase considers both the construction of the truck station and the construction of all trucks, hence a greater impact than that generated by the operational phase that only includes the few kilometers between the airport and the final destination of the waste.
In the case of pneumatic systems, the construction phase, with low impact, corresponds to the construction of the collection station and the pipes and manholes, which have carbon steel as their main material. In the operation phase, the greatest contribution to the impact is due to the operation of the fans. Of the two pneumatic collection systems, the operational phase with the lowest environmental impact is that of the AutoWaste compact system, with 454 impact points, compared to 566 impact points for the conventional pneumatic central. Therefore, the system with a compact central allows a 25% reduction in the environmental impacts of the operational phase compared to the conventional pneumatic central.
For the traditional collection system with trucks, the environmental impacts in the construction phase are three times higher than those in the operation phase. In the case of the compact pneumatic system, the environmental impacts in the operation phase are 2.6 times higher than in the construction phase. In contrast, the environmental impact of the pneumatic system with a conventional collection center in its operation phase is three times higher than in its construction phase.
The impact on the ecosystem of the three urban waste collection systems is shown in Figure 6. In the case of the two pneumatic systems, this impact is due to the electrical consumption of the fans that drive the waste through the pipes and the diesel consumption of the truck that collects the container from the power plant to the waste treatment plant. In the case of the traditional truck collection system, it is due to the diesel consumption of the trucks that manage the collected waste.
Figure 6. Total impact points per ton of waste of each system using the ReCiPe indicator and energy mix 2014.
Results are different when the analysis is carried out considering an energy mix that includes renewable energies in the production of electricity (Figure 7). The collection station that has fewer impact points is the compact AutoWaste system with 293 impact points per ton of waste per year, although slightly lower than the conventional type collection station that has 303 impact points. The traditional collection system with trucks is the system that generates the most environmental impact, with 438 impact points.
Figure 7. Impact points for manufacturing and operational phases per ton of waste of each system using the ReCiPe indicator and renewable scenario.
Therefore, pneumatic systems reduce 45% of the environmental impact generated by traditional truck collection. Regarding pneumatic systems, the compact AutoWaste plant reduces the environmental impact by 3.5% compared to the system with a conventional collection plant.
Regarding the contribution of each of the life cycle phases to the environmental impact, in the three systems, the construction phase is the one that provides the highest contribution to the environmental impact. In the case of the two pneumatic systems, the contribution of the construction phase is 1.5% higher than the impacts generated during the entire operation phase. However, in the case of the traditional truck collection system, the construction phase is 5% higher than the impacts generated during the operational phase. In the comparison between systems, the same conclusions can be withdrawn as when the other energy mix was considered (Figure 8).
Figure 8. Total impact points per ton of waste of each system using the ReCiPe indicator and renewable scenario.

3.2. IPCC 2013 GWP Indicator Results

The results of the life cycle analysis of the different urban waste collection systems with the environmental impact assessment method IPCC2013 100a show, according to Figure 9a, that the traditional truck collection system is the one with the lowest impact, with 1293 kg CO2 equiv./ton emitted to the atmosphere. In the case of the pneumatic systems, the compact AutoWaste central collection system, with 2322 kg CO2 equiv./ton emitted to the atmosphere is the one with the lowest impact compared to the 2913 kg CO2 equiv./ton emitted in the case of a conventional pneumatic collection. This is the quantitative value expected at 100 years, while at 20 years, as shown in Figure 9b, the traditional collection system with trucks emits 1446 kg CO2 equiv./ton, followed by the compact AutoWaste pneumatic collection system, with 2584 kg and, finally, the conventional pneumatic system emits 3237 kg CO2 equiv./ton.
Figure 9. Total kgCO2 eq. per ton of waste of each system using the IPCC 2013 indicator and energy mix 2014: (a) GWP 100 years; (b) GWP 20 years.
In both perspectives, the same trend of environmental impact is fulfilled. The system with the least impact is that of the traditional collection with trucks and of the pneumatic systems. The system with a compact central allows a 25% reduction in environmental impacts compared to the conventional pneumatic central.
The results of the life cycle analysis of the different urban waste collection systems with the IPCC2013 20a environmental impact assessment method show, according to Figure 10b, that the system with the lowest impact is the central wastewater station system. The AutoWaste compact type collection with 613 kg CO2 equiv./ton emitted to the atmosphere, followed by the other pneumatic collection system, the conventional one, with 620 kg CO2 equiv./ton emitted to the atmosphere. Therefore, the system that emits the most CO2 kg is the traditional system with trucks, with 1174 kg CO2 equiv./ton. This is the quantitative value that is expected in 20 years, while at 100 years, it is 533 kg CO2 equiv./ton emitted into the atmosphere for the AutoWaste compact pneumatic system, 537 kg CO2 equiv./ton emitted into the atmosphere for the conventional pneumatic system, and the one that generates the most emissions is the traditional system with trucks with 1046 kg CO2 equiv./ton emitted into the atmosphere. In both perspectives, the same trend of environmental impact is fulfilled. The system with the least impact is the pneumatic system with an AutoWaste compact control unit.
Figure 10. Total kgCO2 eq. per ton of waste of each system using the IPCC 2013 indicator and renewable scenario: (a) GWP 100 years; (b) GWP 20 years.
Looking at the results of the 100-year perspective (Figure 10a), which is the most recommended for studying the impact on global warming of a system, the two pneumatic systems considered in this study allow a 95% reduction in the environmental impact generated compared to the traditional truck system. In the case of the two pneumatic systems, the AutoWaste compact collection centre system reduces the impact by almost 1% compared to the conventional collection centre.

3.3. Environmental Payback

The environmental payback in time provides very useful information since it allows obtaining the impact of each system from year to year. At time zero, the impact corresponds to the value of the construction phase of each system and year after year, and it is linearly increased by the impact of the operation phase. From there, information is derived, on the one hand, of the total impact at the desired time and, on the other hand, when the systems will have similar impacts. It is worth mentioning that the results shown correspond to an operating time set at a lifetime of 30 years.
According to the 2014 energy mix, the life cycle analysis based on the ReCiPe indicator (Figure 11a) and IPCC2013 (Figure 11b) show that for the traditional truck collection system, although initially, the impacts are higher than pneumatic systems, over the years of operation, a growing trend of impacts is generated, but with a much lower slope than in the case of pneumatic systems. In the case of pneumatic systems, the AutoWaste system presents a smaller slope than the conventional pneumatic plant.
Figure 11. Environmental payback of the considered systems: (a) Using the ReCiPe indicator for energy mix 2014; (b) using the IPCC 2013 GWP100a indicator for energy mix 2014; (c) using the ReCiPe indicator for renewable scenario (d) using the IPCC 2013 GWP100a indicator for renewable scenario.
According to the hypothetical energy mix that includes renewable energies, the life cycle analysis based on the ReCiPe indicator (Figure 11c) and IPCC2013 (Figure 11d) shows that the compact-type plant and the conventional plant show an increasing trend of impacts, but the compact type system has a lower slope than the conventional type plant. In the case of the traditional collection system with trucks, at the beginning, when only the construction phase is considered, its value is considerably higher than in the case of pneumatic systems. Over the years, when the operation phase is present, the trend increases, although its slope is slightly lower than in the case of pneumatic systems. Even so, after 100 years of analysis, the environmental impact continues to be higher than in the case of pneumatic systems.
Although the environmental payback period shows the same trend when evaluated based on ReCiPe (Figure 11c) and based on IPCC 2013 (Figure 11d), a bigger difference is observed between the traditional system with trucks and pneumatic systems when the environmental depreciation is based on the IPCC 2013. For this case, it is observed that, at 100 years, the environmental impacts generated by the traditional system with trucks would be 17% higher than that generated by pneumatic systems.

4. Conclusions

This LCA study shows that the energy mix used is decisive in the results obtained. For an LCA obtained using the 2014 energy mix in Spain that is included in the Ecoinvent database, the traditional collection system with trucks is the system that generates the lowest environmental impact. In relation to the two pneumatic collection systems analyzed, the pneumatic collection system with the AutoWaste compact central unit, the annual flow of greenhouse gases into the atmosphere (kilograms of carbon dioxide equivalent for 30 years and per ton) can be reduced up to 25% compared to a pneumatic collection system with a conventional central.
For an LCA obtained using an energy mix that allows a better representation of today’s reality and its trend, which includes the use of renewable energies in the production of electricity (i.e., 20% hydroelectric production, 30% solar production and 50% wind energy production), the AutoWaste compact central pneumatic collection system is the system that generates the lowest environmental impact, and that of trucks is the one that generates the highest impact. Among the two pneumatic collection systems analyzed, the compact AutoWaste plant allows the annual flow of greenhouse gases to be reduced by 1% compared to a pneumatic collection system with a conventional plant.
These evaluated and quantified values show that of the two analyzed pneumatic systems, the gases emitted by the AutoWaste compact central pneumatic collection system are clearly reduced compared to a conventional pneumatic collection system with a conventional central unit for a lifetime of 30 years. Therefore, it is a system that is recommended to be implemented in cities where optimal air quality and mitigation of climate change are key objectives.

Author Contributions

Conceptualization, J.A.F. and L.F.C.; methodology, M.C. and L.F.C.; formal analysis, N.L. and G.G.; investigation, J.A.F. and N.L.; resources, L.F.C.; data curation, L.F.C.; writing—original draft preparation, J.A.F., N.L. and G.G.; writing—review and editing, M.C. and L.F.C.; visualization, N.L.; supervision, L.F.C.; project administration, L.F.C.; funding acquisition, L.F.C. All authors have read and agreed to the published version of the manuscript.

Funding

This work received the financial support of the Doctorat Industrial grant (2020 DI 5) from the AGAUR of the Secretaria de Universitats i Recerca del Departament d’Empresa i Coneixement of the Generalitat de Catalunya. This work is partially supported by ICREA under the ICREA Academia programme.

Institutional Review Board Statement

Not applicable.

Data Availability Statement

Data are available upon request to the correspondence author.

Acknowledgments

The authors would like to thank the Catalan Government for the quality accreditation given to their research group (2017 SGR 1537). GREiA is certified agent TECNIO in the category of technology developers from the Government of Catalonia. The authors would like to thank the following companies for providing the real data used in this study: Urban Refuse Development, S.A.

Conflicts of Interest

The authors declare no conflict of interest.

References

  1. Yankova, T.; Grigorova, I. Automated waste collection systems—possibilities, trends and application. In Proceedings of the 20th International Multidisciplinary Scientific Geoconference SGEM 2020 (Energy and Clean Technologies), Albena, Bulgaria, 18–24 August 2020; Volume 20, pp. 219–226. [Google Scholar] [CrossRef]
  2. Chàfer, M.; Sole-Mauri, F.; Solé, A.; Boer, D.; Cabeza, L.F. Life cycle assessment (LCA) of a pneumatic municipal waste collection system compared to traditional truck collection. Sensitivity study of the influence of the energy source. J. Clean. Prod. 2019, 231, 1122–1135. [Google Scholar] [CrossRef]
  3. ADEME. Etude de Benchmark de Projets Internationaux de Collecte Pneumatique et D’analyse de Leurs Coûts. 2017. Available online: https://librairie.ademe.fr/dechets-economie-circulaire/3038-etude-de-benchmark-de-projets-internationaux-de-collecte-pneumatique-et-d-analyse-de-leurs-couts.html (accessed on 16 January 2022).
  4. United Nations. UNESCO Science Report: Towards 2030; UNESCO: Paris, France, 2016. [Google Scholar]
  5. Jun, D.; Ruonan, L.; Xin, W.; Hang, Z. Modelling and optimisation of vacuum collection system for cruise ship kitchen garbage. Pol. Marit. Res. 2020, 27, 152–161. [Google Scholar] [CrossRef]
  6. Rebitzer, G.; Ekvall, T.; Frischknecht, R.; Hunkeler, D.; Norris, G.; Rydberg, T.; Schmidt, W.-P.; Suh, S.; Weidema, B.; Pennington, D.W. Life Cycle Assessment Part 1: Framework, Goal and Scope Definition, Inventory Analysis, and Applications. Environ. Int. 2004, 30, 701–720. [Google Scholar] [CrossRef] [PubMed]
  7. McManus, M.C.; Taylor, C.M. The changing nature of life cycle assessment. Biomass Bioenergy 2015, 82, 13–26. [Google Scholar] [CrossRef] [PubMed] [Green Version]
  8. Sevigné-Itoiz, E.; Mwabonje, O.; Panoutsou, C.; Woods, J. Life cycle assessment (LCA): Informing the development of a sustainable circular bioeconomy? Philos. Trans. R. Soc. A 2021, 379, 20200352. [Google Scholar] [CrossRef] [PubMed]
  9. Punkkinen, H.; Merta, E.; Teerioja, N.; Moliis, K.; Kuvaja, E. Environmental sustainability comparison of a hypothetical pneumatic waste collection system and a door-to-door system. Waste Manag. 2012, 32, 1775–1781. [Google Scholar] [CrossRef] [PubMed]
  10. Aranda Usón, A.; Ferreira, G.; Zambrana Vásquez, D.; Zabalza Bribián, I.; Llera Sastresa, E. Environmental-benefit analysis of two urban waste collection systems. Sci. Total Environ. 2013, 463–464, 72–77. [Google Scholar] [CrossRef] [PubMed]
  11. Pérez, J.; Lumbreras, J.; Rodriguez, E. Life cycle assessment as a decision-making tool for the design of urban solid waste pre-collection and collection/transport Systems. Resour. Conserv. Recycl. 2020, 161, 104988. [Google Scholar] [CrossRef]
  12. Zhu, Q.; Leibowicz, B.D.; Busby, J.W.; Shidore, S.; Adelman, D.E.; Olmstead, S.M. Enhancing policy realism in energy system optimization models: Politically feasible decarbonization pathways for the United States. Energy Policy 2022, 161, 112754. [Google Scholar] [CrossRef]
  13. Bonilla, J.; Blanco, J.; Zarza, E.; Alarcón-Padilla, D.C. Feasibility and practical limits of full decarbonization of the electricity market with renewable energy: Application to the Spanish power sector. Energy 2022, 239, 122437. [Google Scholar] [CrossRef]
  14. Instituto para la Diversificación y Ahorro de Energía (IDAE). Resumen del Plan de Energías Renovables; IDAE: Madrid, Spain, 2011; p. 64.
  15. ISO 14044; Gestión Ambiental Análisis del Ciclo de Vida. Requisitos y Directrices. International Standards Organisation: Geneva, Switzerland, 2006.
  16. Khandelwal, H.; Dhar, H.; Thalla, A.K.; Kumar, S. Application of life cycle assessment in municipal solid waste management: A worldwide critical review. J. Clean. Prod. 2019, 209, 630–654. [Google Scholar] [CrossRef]
  17. Frischknecht, R.; Jungbluth, N.; Althaus, H.J.; Doka, G.; Dones, R.; Heck, T.; Hellweg, S.; Hischier, R.; Nemecek, T.; Rebitzer, G.; et al. The ecoinvent database: Overview and methodological framework. Int. J. Life Cycle Assess. 2005, 10, 3–9. [Google Scholar] [CrossRef]
  18. Huijbregts, M.A.J.; Steinmann, Z.J.N.; Elshout, P.M.F.; Stam, G.; Verones, F.; Vieira, M.; Zijp, M.; Hollander, A.; van Zelm, R. ReCiPe2016: A harmonised life cycle impact assessment method at midpoint and endpoint level. Int. J. Life Cycle Assess. 2017, 22, 138–147. [Google Scholar] [CrossRef]
  19. Sabine, C. The IPCC fifth assessment report. Carbon Manag. 2014, 5, 17–25. [Google Scholar] [CrossRef]
Publisher’s Note: MDPI stays neutral with regard to jurisdictional claims in published maps and institutional affiliations.

Article Metrics

Citations

Article Access Statistics

Multiple requests from the same IP address are counted as one view.