Article

Optimization and Operational Analysis of Domestic Greywater Treatment by Electrocoagulation Filtration Using Response Surface Methodology

by
Khalid Ansari
1,2,*,
Avinash Shrikhande
1,
Mohammad Abdul Malik
3,
Ahmad Aziz Alahmadi
4,
Mamdooh Alwetaishi
5,
Ali Nasser Alzaed
6 and
Ahmed Elbeltagi
7
1
Department of Civil Engineering, Kavikulguru Institute of Technology and Science, Ramtek 441106, India
2
Department of Civil Engineering, Yeshwantrao Chavan College of Engineering, Nagpur 441110, India
3
Engineering Management Department, College of Engineering, Prince Sultan University, Riyadh 11586, Saudi Arabia
4
Department of Electrical Engineering, College of Engineering, Taif University, P.O. Box 11099, Taif 21944, Saudi Arabia
5
Department of Civil Engineering, College of Engineering, Taif University, Taif 21944, Saudi Arabia
6
Department of Architecture Engineering, College of Engineering, Taif University, P.O. Box 11099, Taif 21944, Saudi Arabia
7
Agricultural Engineering Department, Faculty of Agriculture, Mansoura University, Mansoura 35516, Egypt
*
Author to whom correspondence should be addressed.
Sustainability 2022, 14(22), 15230; https://doi.org/10.3390/su142215230
Submission received: 6 September 2022 / Revised: 29 October 2022 / Accepted: 10 November 2022 / Published: 16 November 2022

Abstract

:
Greywater is the most sustainable option to address the growing need for fresh water. This study aimed to identify the optimal operation variables of an electro-coagulation filtration (ECF) system for treating domestic greywater, using different conditions (e.g., different electrode combinations (Al-Fe-Al-Fe), initial pH (6.8–8.4), operating time (10–60 min), and voltage (6–24 volts)). A statistical data analysis was performed to evaluate the experimental conditions for modeling the chemical oxygen demand (COD), the total dissolved solids (TDSs), turbidity, and chloride removal effectiveness, almost ranging from (85 to 94%), respectively, with energy consumption using the response surface methodology (RSM) and the ANOVA test. When comparing the experimental and predicted model values, it was proved that the model fairly describes the experimental values with the R2 values determined >0.99 for COD, TDSs, turbidity, chloride, and energy consumption, suggesting a regression sustainability of the model. The sludge properties were characterized using scanning electron microscopy (SEM), energy-dispersive X-ray spectroscopy (EDX), and FTIR spectroscopy, which indicated the removal of organic matter during the ECF, similar in composition, independently of the different applied voltage values used. The results of this study suggest the ECF significantly reduces the pollutants load in greywater, showing the aluminum-iron-based electrodes as a viable option to treat greywater with optimal operational costs ranging from (0.12 to 0.4) US$ m−3 under different voltage conditions and parameters. This study establishes a path for greywater treatment technology that is economical and environmentally responsible for wastewater management that leads to sustainability.

1. Introduction

Growing freshwater stress, caused by the population rising has put attention to simple, cost-effective, and reliable treatment technologies [1] to address the water management challenges. In developing countries, population and economic development demands [2] have led to the search for alternate water resources and strengthening water reuse and recycling. Domestic greywater recycling has been identified with the potential to overcome the consumption pattern and reduce human health risks and environmental pollution [3] because of its lower concentration of pollutants [4] from different sources. Greywater contributes 50–80% of the household wastewater volume [5], depending on lifestyle, age, residential types, consumption patterns, religious traditions, and washing habits [5,6]. Greywater from households includes a high concentration of organic matter, which is primarily caused by using soap or soap products for body washing; its quality varies, according to the source, the geographical region, demographics, and degree of occupancy. Certain types of greywater have low suspended particles, and turbidity levels, indicating that a greater proportion of the pollutants are dissolved [7,8]. Its generation and characteristics show different loads of organic matter, fats and surfactants, salts, solids, nutrients, and pathogens, requiring treatment before reusing [8]. Greywater treatment procedures are primarily determined by their volume, physicochemical and biological properties, the amount of energy required, and the purposes for which treated water will be utilized [9].
Studies from the last five decades have shown different approaches to greywater treatment, including physical, chemical, biological, and hybrid methods [7,10]. Processes, such as soil filters, ultra-filtration (UF) membranes, membranes bioreactors [9], up-flow anaerobic sludge blankets (UASB) [10], rotating biological contractors (RBC) [11], sequencing batch reactors (SBR), ion exchange, and constructed wetlands [12], have been tested for greywater treatment, and all of them require either a large space and/or a highly skilled operation and maintenance. In the last few years, the use of hybrid physicochemical technologies, such as electrocoagulation followed by a sand filtration process, has gained attention as an efficient and effective alternative technology with a simple arrangement, minimum chemical addition, decreased sludge production, and low energy consumption to remove pollutants [13]. Hybrid processes using ECF processes have been tested in the past [14,15] generating significantly less membrane fouling and a greater COD, turbidity, and color removal, compared to the process alone. Based on the researcher’s background, electrocoagulation (EC) proves to be a leading technology for water and wastewater treatment, combining coagulation, flotation, adsorption, and electrochemistry [16,17], as shown in Figure 1, with the dissolution mechanism of anode metals producing metal hydroxides with water molecules, which act as coagulants and in cathodic, the reactions cause the coagulants to rise to the surface by the release of hydrogen gas [16], with the phenomenon of the neutralization of charges, resulting in efficiently filtering out contaminants, such as dyes, metals, solids in suspension, organic matter, etc. [17,18,19,20].
Hence, researchers focused on the numerous advantages of using the electrocoagulation process in large-scale applications, and the ability to handle a wide range of reaction conditions with effluent types, with a better ability to reduce retention time, and rapidly sediment the electrogenerated flocculants during the sedimentation, with a reduction in sludge production, and the reduction in space and capital costs [21,22].
According to Rakhmania et al., [21], the electrode material used is a critical factor influencing the efficiency of the EC process. Aluminium (Al) and iron (Fe) are the most often utilized electrodes in EC experiments, for eliminating pollutants, because they undergo dissolution to form amorphous metal hydroxides, such as Al3+ and Fe2+, respectively, and are easily available at a cheap cost with the multivalent coagulant characteristic. Very few studies related to greywater, have been carried out with the application of EC and the results showed a remarkable increase in the removal efficiencies with Al-Fe-Al-Fe at pH 7.62, 98% turbidity (NTU), 98% COD (mg/L), 92% total phosphorus (mg/L), 84% total nitrogen (mg/L), and 99% total suspended solids (mg/L) [10]. According to Bote M., [13], the Al-Fe combination again showed the 87.5% COD removal at pH (9), with a current density of 45 (A/m2). Several studies [17,18,19,20,21], have reported a high EC efficiency in COD, BOD, and O&G [22] removal, using different electrode arrangements, mainly Al and Fe, with advantages in the low operational cost and a high bubble production [22]. The key reactions that rely on the characteristics of the solution are briefly presented in Equations (1) and (2) (which occur at the anode), Equations (3)–(5) (which occur at the cathode), [15].
Aluminium at anode: Al → Al3+ + 3e
Aluminium in solution: Al3+ + 2OH → Al (OH)3
Iron at cathode: Fe(s) → Fe2+ + 2e
2Fe2+ + 5H2O + 1/2 O2 → 2Fe(OH3) + 4H+
Iron in solution: Fe2+ + 2OH → Fe (OH)2
Based on the reaction analysis, H2 gas and bubbles of O2 gas simultaneously occur at the cathode and anode of the water electrolysis, resulting in a floc formation. Despite the evidence of EC improvement in the treatment efficiency, the major concern is identifying the best treatment conditions (e.g., electrode materials/arrangement, current density, power supply type, and operating time) for the specific applications [21,22]. According to Bote M et al., [15], the optimization techniques for any process, such as the central composite design (CCD) was used to optimize the experimental condition by the response surface method (RSM), which is a reliable way to estimate the analytical statistical links between the independent factors and the response variables [23,24,25,26,27,28,29], helping to identify the optimal conditions and settings with relatively fewer trial experimental results [30,31,32,33,34], reducing the overall cost and time required for the procedure [35,36,37,38].
Furthermore, to the best of the author’s knowledge, no information is available that addresses the hybrid mechanism of the ECF on greywater treatment, and only very few studies [10,11,12,13,14,15,16,17,18,19,20] target the estimation of the operational cost and sludge consumption to ascertain the effectiveness conditions, which helps to understand the novelty of this study. Therefore, the objective of this study is to investigate the treatment feasibility and characteristics of domestic greywater, using a hybrid ECF process, and optimized the process by RSM, to examine the overall efficiencies through the model simulation of the electrocoagulation filtration method, followed by an operational cost-enhancement with the application of recycling and reuse feasibility options for sustainable water management.

2. Materials and Methods

2.1. Samples

Twenty Greywater samples were collected from the bathtub or shower, hand basin, kitchen sinks, and laundry room sinks in residential areas in Nagpur, Maharashtra, India, in plastic buckets. The samples were shipped in polypropylene containers and maintained at 4 °C until characterization, as shown in Table 1 [22].

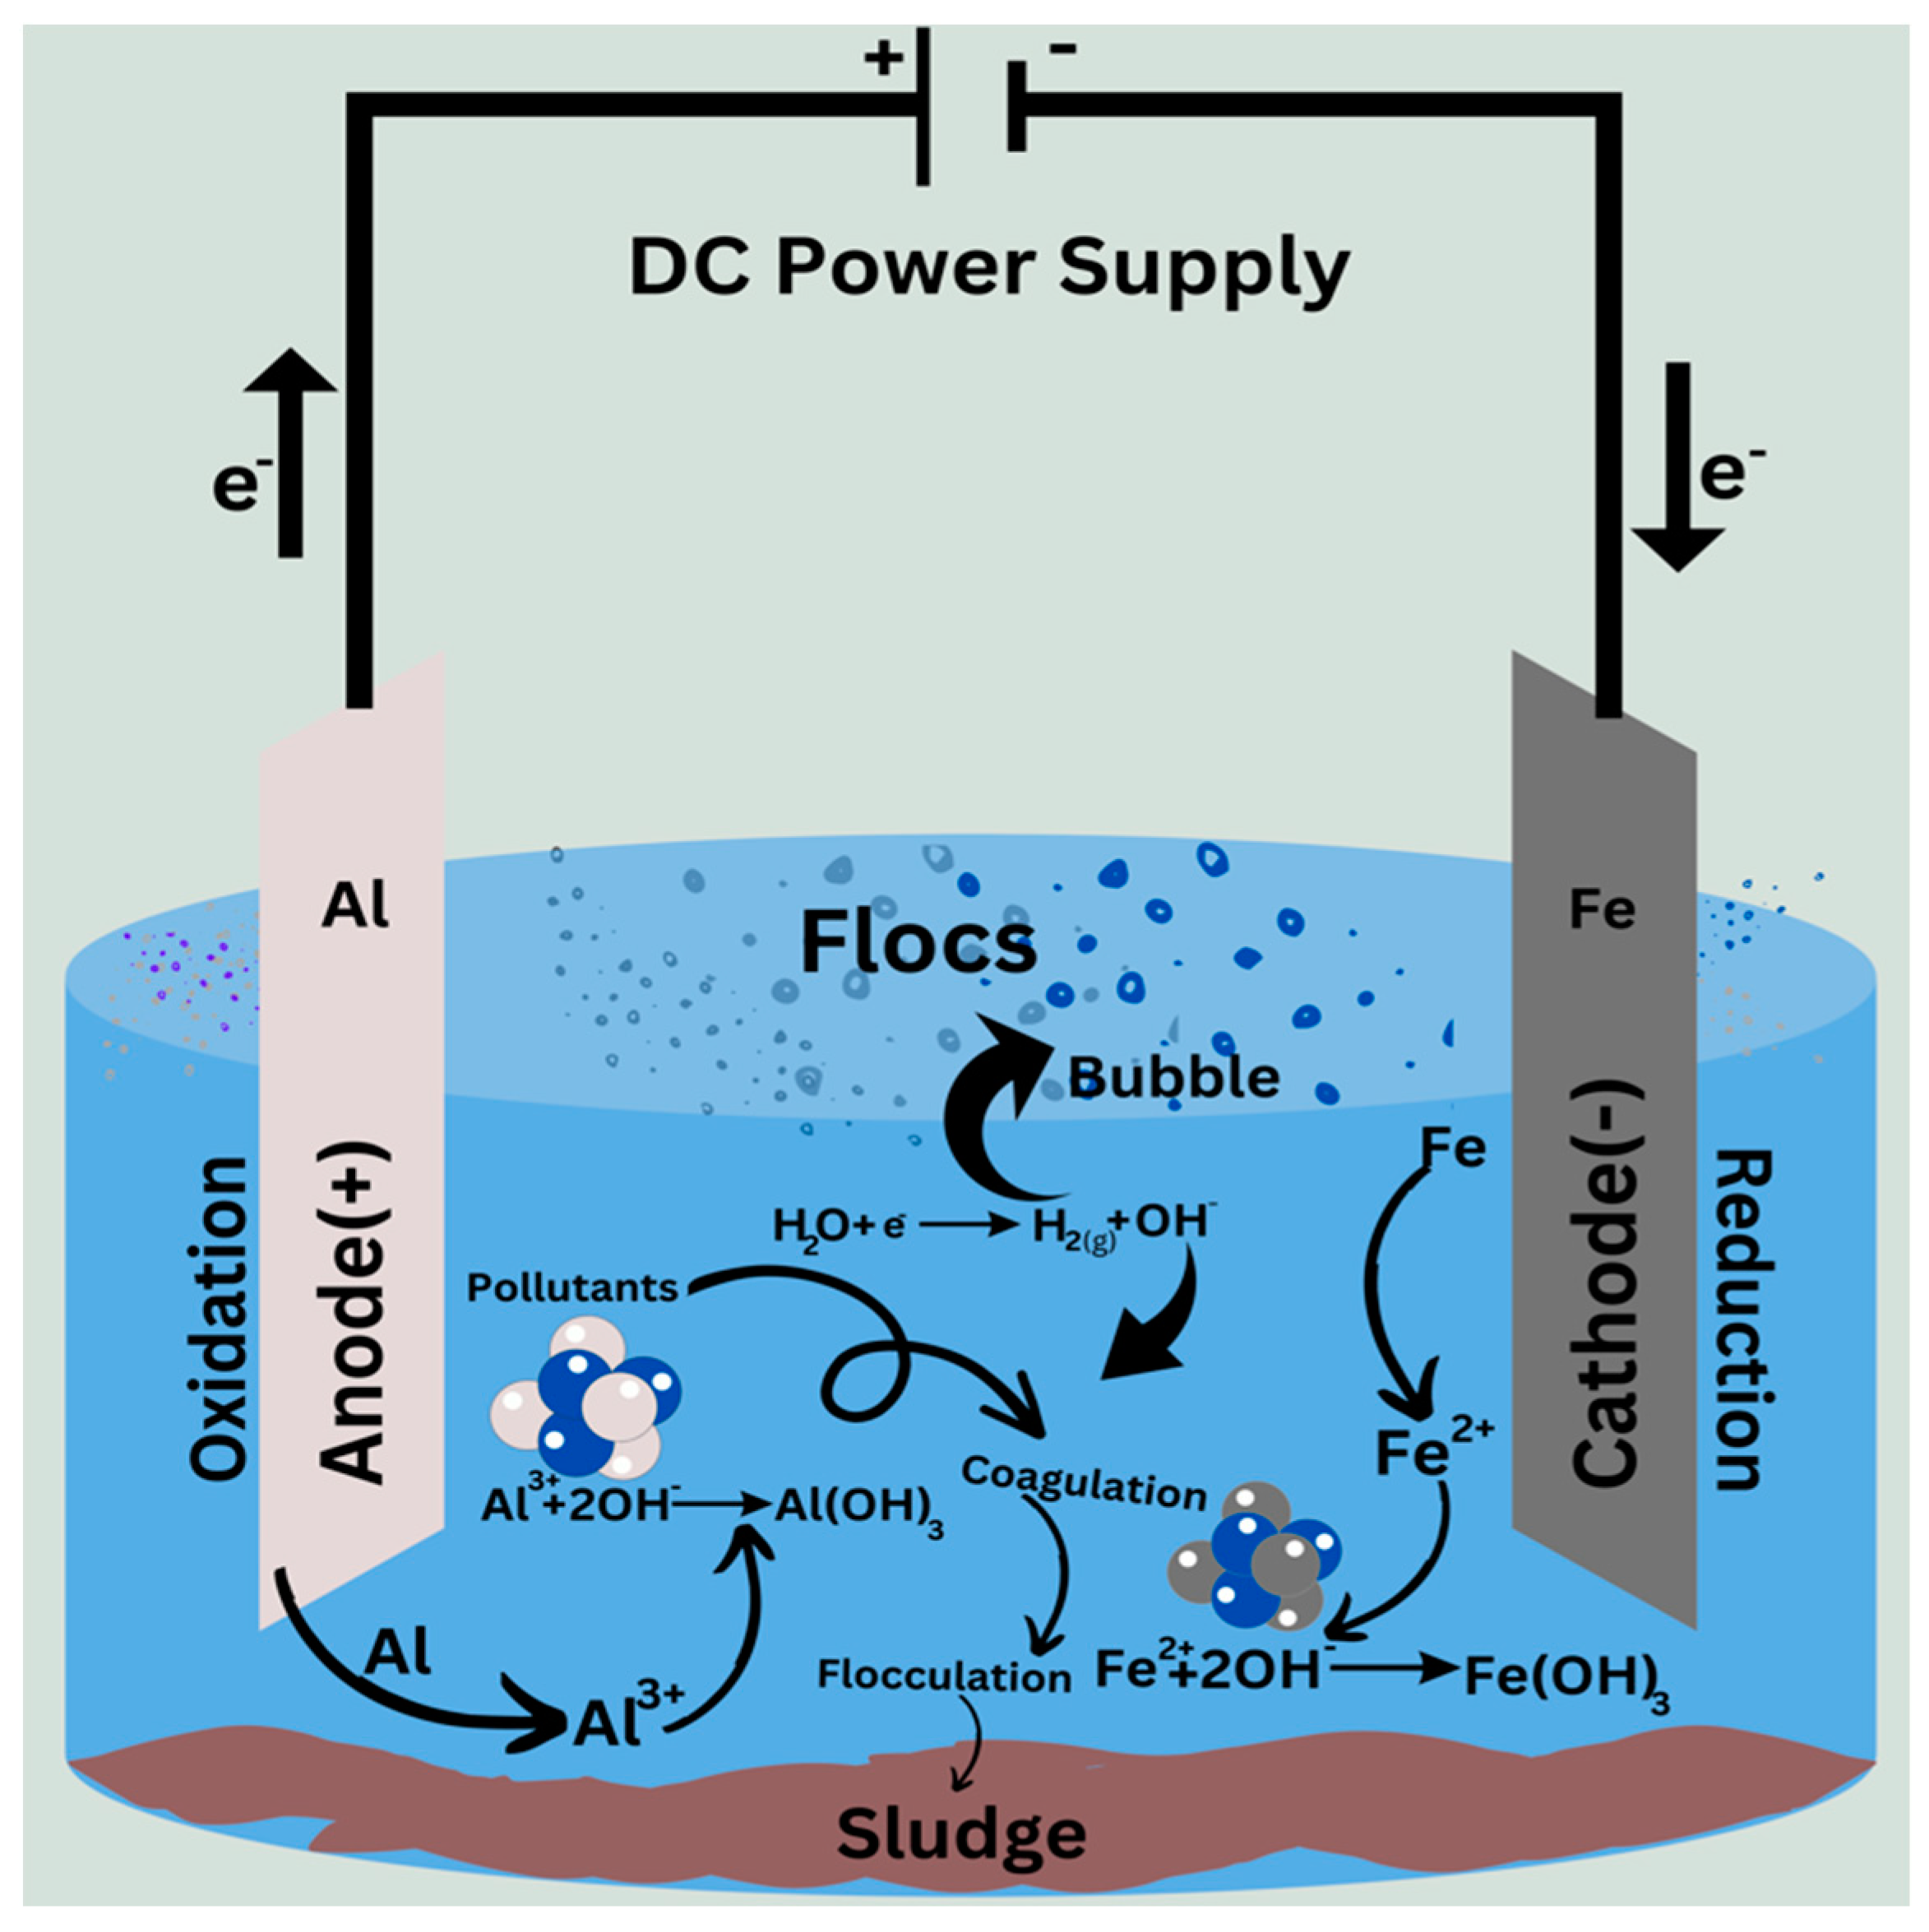
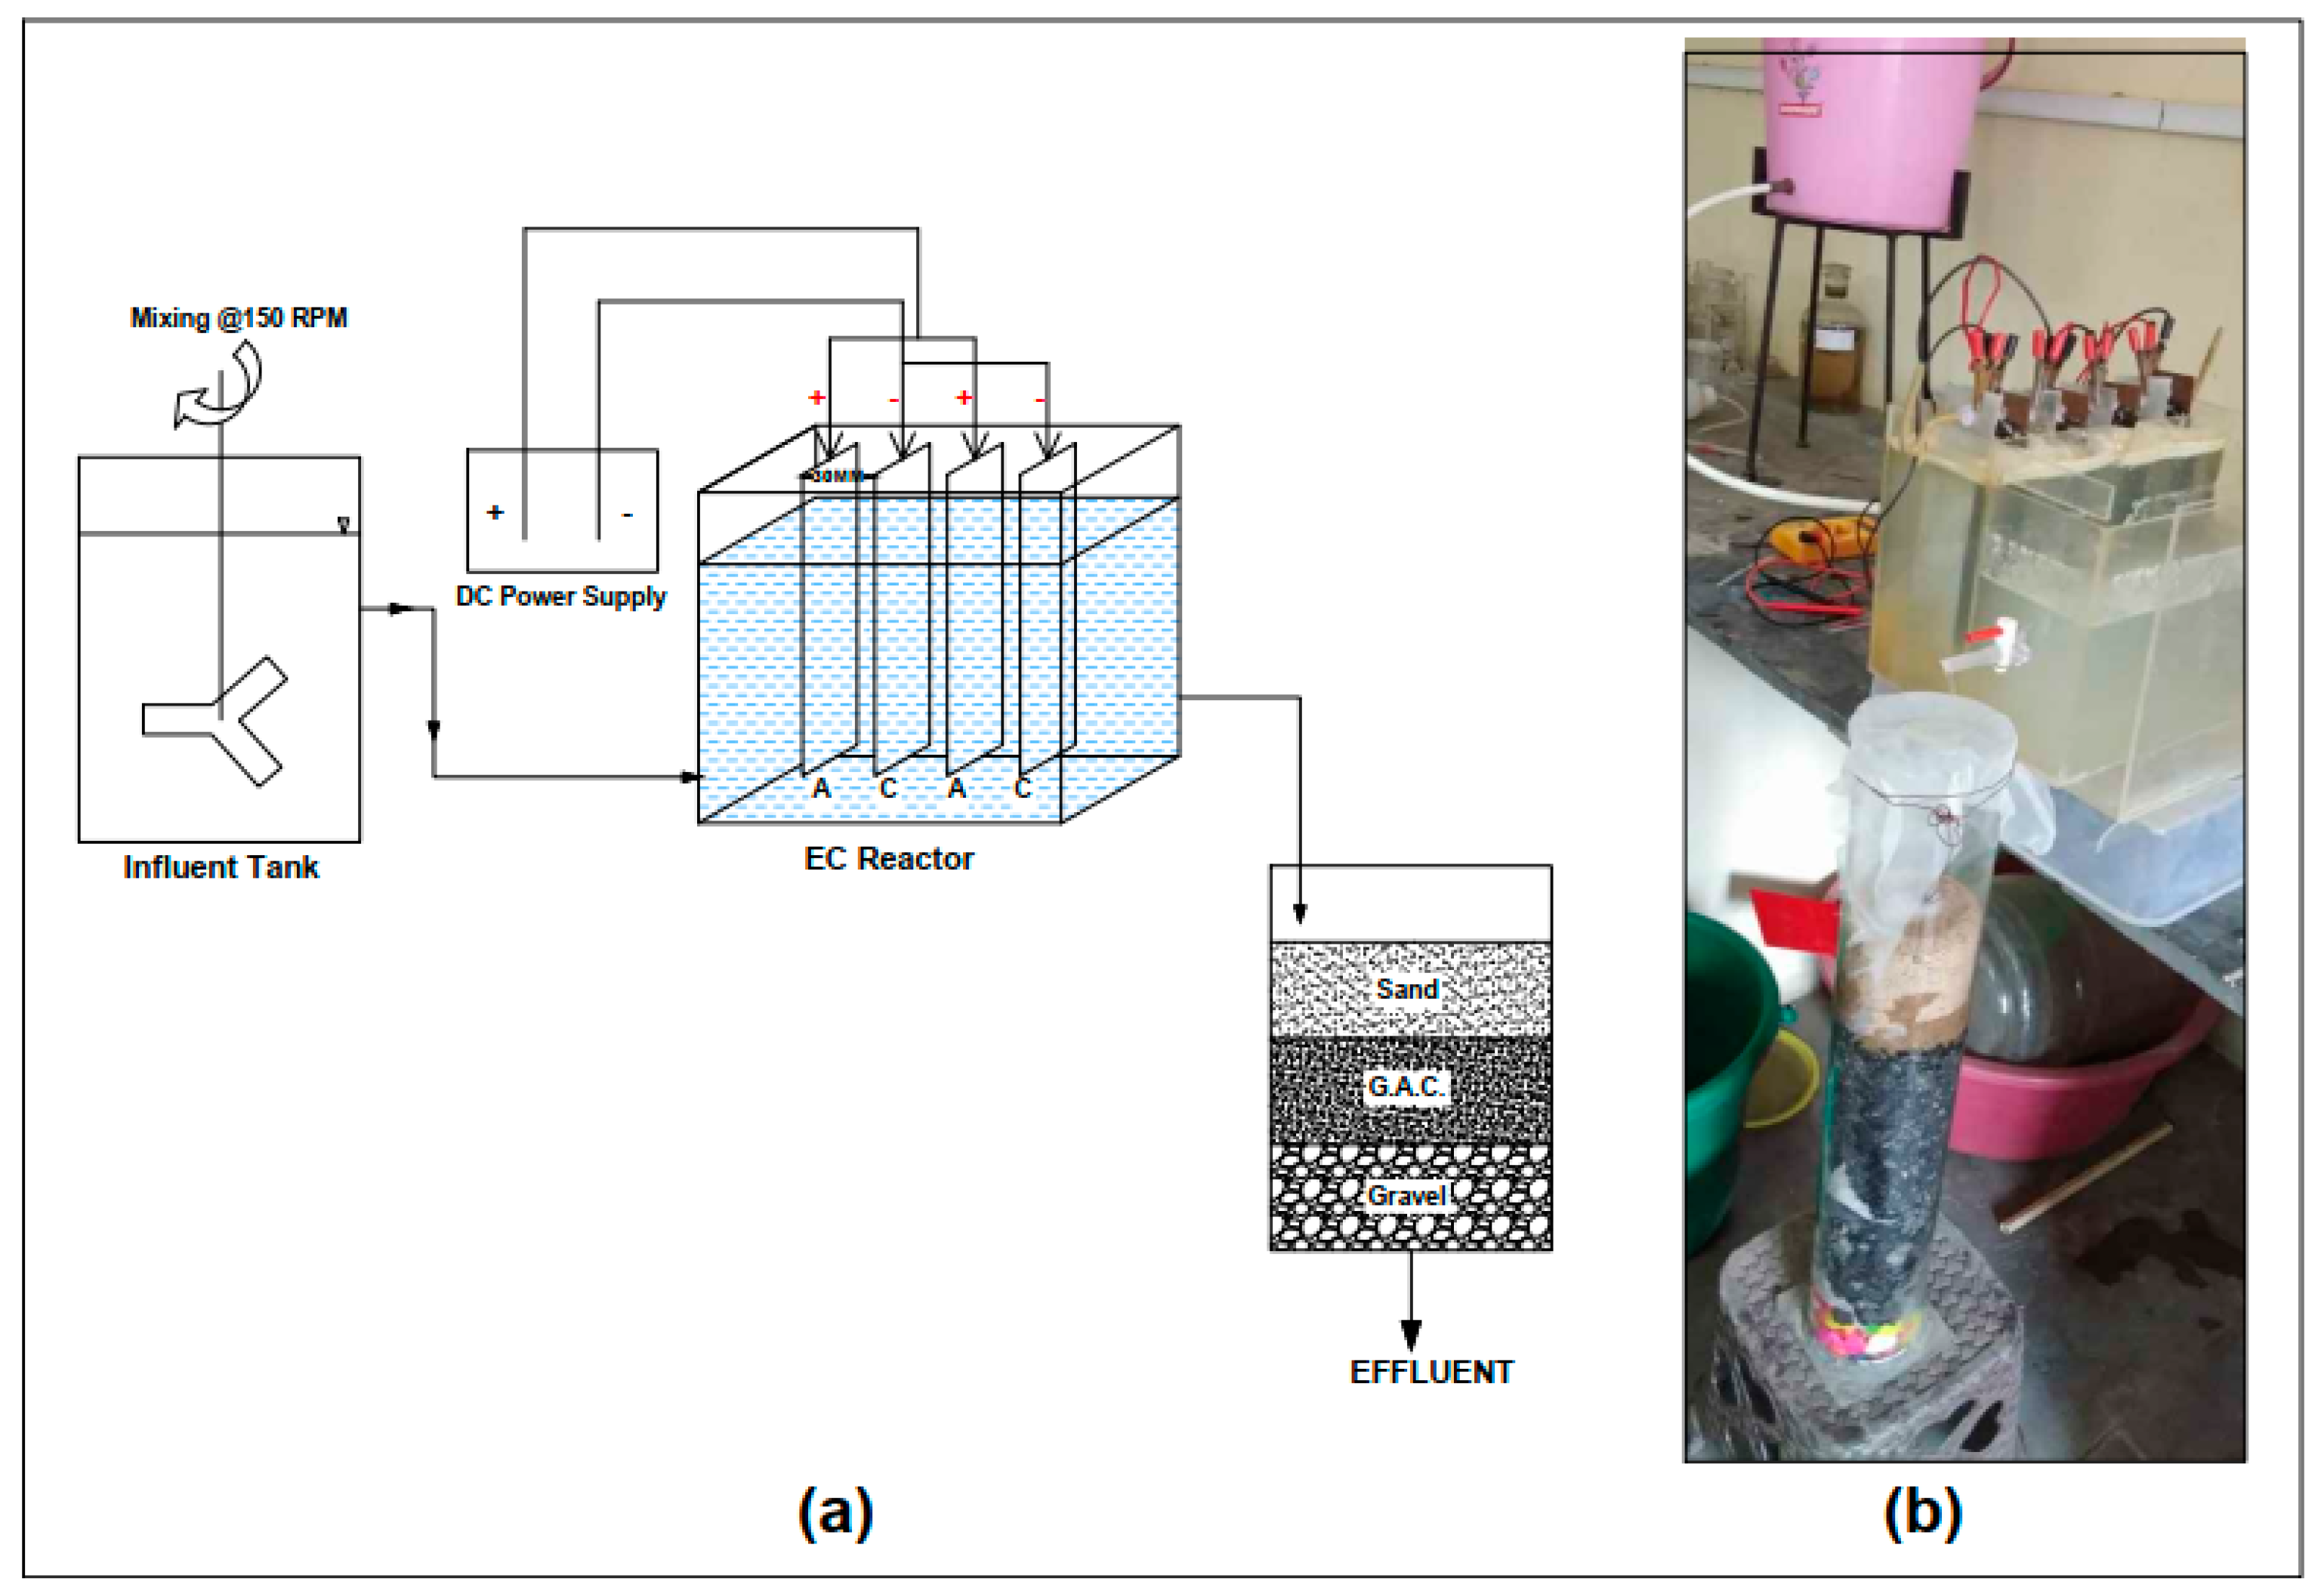
2.2. Experimental Set-Up

Figure 2 shows the laboratory-scale setup used, including the EC reactors and filter media. The EC reactor [24 cm (height) × 20 cm (length) × 10 cm (width)], total volume 5.0 L, was made in 0.4 cm acrylic and used aluminium and iron sheets (18 cm (height) × 4.5 cm (width) × 0.02 cm (thickness)) as the electrode material separated by 3 cm. An auxiliary tank of identical proportions was compiled on either side of the reactors to eliminate the suspended stuff. The electrode configuration was in a monopolar parallel mode using a direct current (DC) power supply (model RPS 3005) with different operating conditions. In each run, 4.5 L of greywater were gently agitated at 130 rpm with four plates arranged vertically, immersed and covering an effective surface area of 82.5 cm2 [22].

2.3. Filtration Media

A sand filter bed (60 cm in height, 10 cm wide, and 1.5 cm diameter) was also built with acrylic. In prior experiments, the sand and coconut shell activated carbon was washed, dried at 105 °C, sieved, and arranged with finer sand (effective size 0.2 to 0.5 mm) at the top, followed by granular activated carbon (effective size 0.2 to 0.6 mm) and gravel support (effective size 5 mm) at the bottom. The tests were carried out at room temperature. The effluents after the EC treatment were sent to filtering media (0.18 L/min) after removing the precipitated flocs from the EC reactors, every 10 min for 60 min. The effluents were taken away so that the EC and filter could be tested while they were in use. The EC reactor and filter were cleaned after each run [22].

2.4. Analytical Studies

The performance of the hybrid EC reactor and filter bed was examined using the initial and final samples to emphasize the physiochemical characteristics of greywater, such as the chemical oxygen demand (COD), according to cuvette tests with a Hach Spectrophotometer (Hach, DR 2000, USA), total suspended solids (TSSs), total dissolved solids (TDSs), pH, turbidity, and chloride, according to the standard methods [23]. In this study, a JSM6380 LV scanning electron microscope (JEOL, Japan) with an accelerating voltage of 30.0 kV was utilized. To undertake the energy dispersive spectroscopy (EDS) study, the materials were gold-plated. The Fourier-transform infrared spectroscopy (FTIR) was used in a Bruker Vertex 70 spectrometer with OPUS 6.5 data handling and statistical analysis software was used to identify FTIR spectra (ATR).

2.5. Experiment Design Using the Response Surface Methodology (RSM)

The RSM was used to examine the connection between the removal efficiency and optimal process conditions [17,18,19]. The Design-Expert (version 13.0.5.0, Stat-Ease) software with the central composite design (CCD) application was used to determine the link between the variables and the response function [19]. Table 2 shows the three independent variables examined. The statistical tools were used to conduct the experimental design: analysis of variance (ANOVA), computational analysis, and three-dimensional response surface [27]. Three essential required input independent variables (a) voltage (6 to 24 volts), (b) reaction time (10–60 min), and (c) pH (6.8–8.4) for the Al-Fe-Al-Fe electrode combinations were tested and analyzed to calculate the most significant COD, TDSs, turbidity, and chloride removal effectiveness as a function of energy consumption. The input variables of the coded and real values for the selected variables were indicated using the RSM technique to operate the characteristics as the statistical significance and better evaluated through the ANOVA test [27].
To express the quality of the fitted models, the residual plots and coefficients of determination (R2, adjusted R2, and predicted R2) were estimated [22,23]. To optimize the experiments, a software-based response surface prototype was used. Different versions (linear, quadratic, third-order polynomials, and two-factor interactions (2FI) were applied to fit the experimental data. The different algorithms obtained were then statistically examined to find the optimal model with the best actual, predicted, and adjusted R2, low-predicted residual sum of squares, and no significant fit. Furthermore, the model’s factors were evaluated using p < 0.05 value (probability) and F for (consistency) values using a 95% confidence level [20,21,22]. The lab tests were undertaken and compared to the model predictions to validate the model’s outcomes, using different RSM conditions, using Equation (6) to express the system response as a percentage of the removal pollutants.
Yi = β0 + ∑βiXi + ∑βiiXii2 + ∑βijXiXj
where Yi is the relative removal efficiency, 0 for the model coefficient, i, ii, and ij for the model coefficients, and Xi and Xj for the independent variables [20,21]. The RSM algorithm determines the coded values for the anticipated processes, such as Y1 (COD), Y2 (TDS), Y3 (chloride), Y4 (turbidity), and Y5 (electrode consumption).
The total number of experimental runs was decided, based on Equation (7)
N = 2a + 2a + C = 20
where N: total number of experimental runs; a: number of variables; C: number replicates to the center points.

3. Result and Discussion

The pH, operational duration, electrode type, and electrode spacing, are among the operational elements that affect the performance of the electrocoagulation filtration in eliminating the contaminants from greywater at different voltages. This enhances the efficacy of the EC, followed by the filtration in certain settings and systems. Using the following Equation (8), the effectiveness of the greywater removal was calculated [22].
{RE (%) = [(Xi − Xf)/Xi] × 100}
where Xi and Xf are the initial and final concentrations.

3.1. Effect of the Applied Voltage

The most crucial operational parameter that enhances the removal efficiency during the EC process is the applied voltage, which controls the reaction rate and the coagulant’s production rate, resulting in the effect on the flocs formation and the operating cost of the electrocoagulation reactors [25,26]. To examine the impact of the voltage and the operating time of 60 min within the ECF process, the investigation was conducted at 6 V, 12 V, and 24 V, with an Al-Fe-Al-Fe electrode combination. It was observed when the voltage was applied, i.e., from 6 to 24 volts, the results highlight the increasing trends in the removal efficiency between 83 to 94%, for the COD, TDSs, chloride, and turbidity characteristics, due to the formation of (OH)n, which directly targets the flocs growth and charge neutralization of the Al3+ and Fe2+ ions during electrolysis [37,38,39,40,41].

3.2. Effect of the pH

Another critical factor in the greywater treatment is the pH, affecting the number of stable hydroxide species formed during the EC processes. Different types and numbers of electrodes and the influents’ pH affect the pH during the treatment process. The pH properties of the hybrid electrodes at different voltages, (i.e., 6 to 24 volts), were examined to demonstrate the extreme elimination of the COD, turbidity, and other parameters, with the least electrode consumption [17]. From the observation, it is seen that the Al-Fe-Al-Fe combination produces a hydroxide sol that may adsorb the negative H2PO4− anions [17,28] and produce monomeric ions, such as Al (OH)2, Al (OH)2, Al (OH)3, Al (OH)4 and Fe (OH)2, Fe (OH)3 ions are capable for the quick assessment of hydrogen gas at the cathode [42] and its impact on the increase in the pollution removal performance at a pH of 6.8 to 8.4, showing the best performance.

3.3. Effect of the Operating Time

The EC also relies on the operating time it takes for dissolving the metal ions, to generate metal hydroxide species at the electrodes, which is a crucial step in the process [19]. The results in Table 3 showed that the COD (91%), TDSs (94.5%), turbidity (94.2%), and other parameters show appreciable removal efficiencies with the increase in the electrolysis reaction time from 10 to 60 min, which is due to an abundant discharge of coagulation metallic ions, such as Al3+ and Fe2+ ions at anode and cathode, were generated to destabilize the colloidal particles in the form of bubble production, based on the Faraday Law [19,20,21]. Hence, more flocs generation occurs, which increased the adsorption strength, resulting in a rise in the energy consumption over the electrolysis time [17], leading to an increase in the removal efficiency level of the pollutant contaminants.

3.4. Effect of the Filter Media

In this ECF process, the physiochemical parameters, such as color, turbidity, heavy metal, pesticides, organic chemicals, TSSs, etc., were eliminated using a sand filter followed by activated carbon with staining and sedimentation capabilities to enhance the electrocoagulation process, based on the capacity of adsorbent surface area, porosity, and functional groups [42,43]. The sand filter is crucial for the solids removal and pH balance maintenance [42] and the activated carbon statute as catalyst media in the chemical reduction of the strong oxidants to innocuous byproducts, The purpose of the filter media is to overall increase the removal efficiency level for a sustainable onsite greywater treatment.

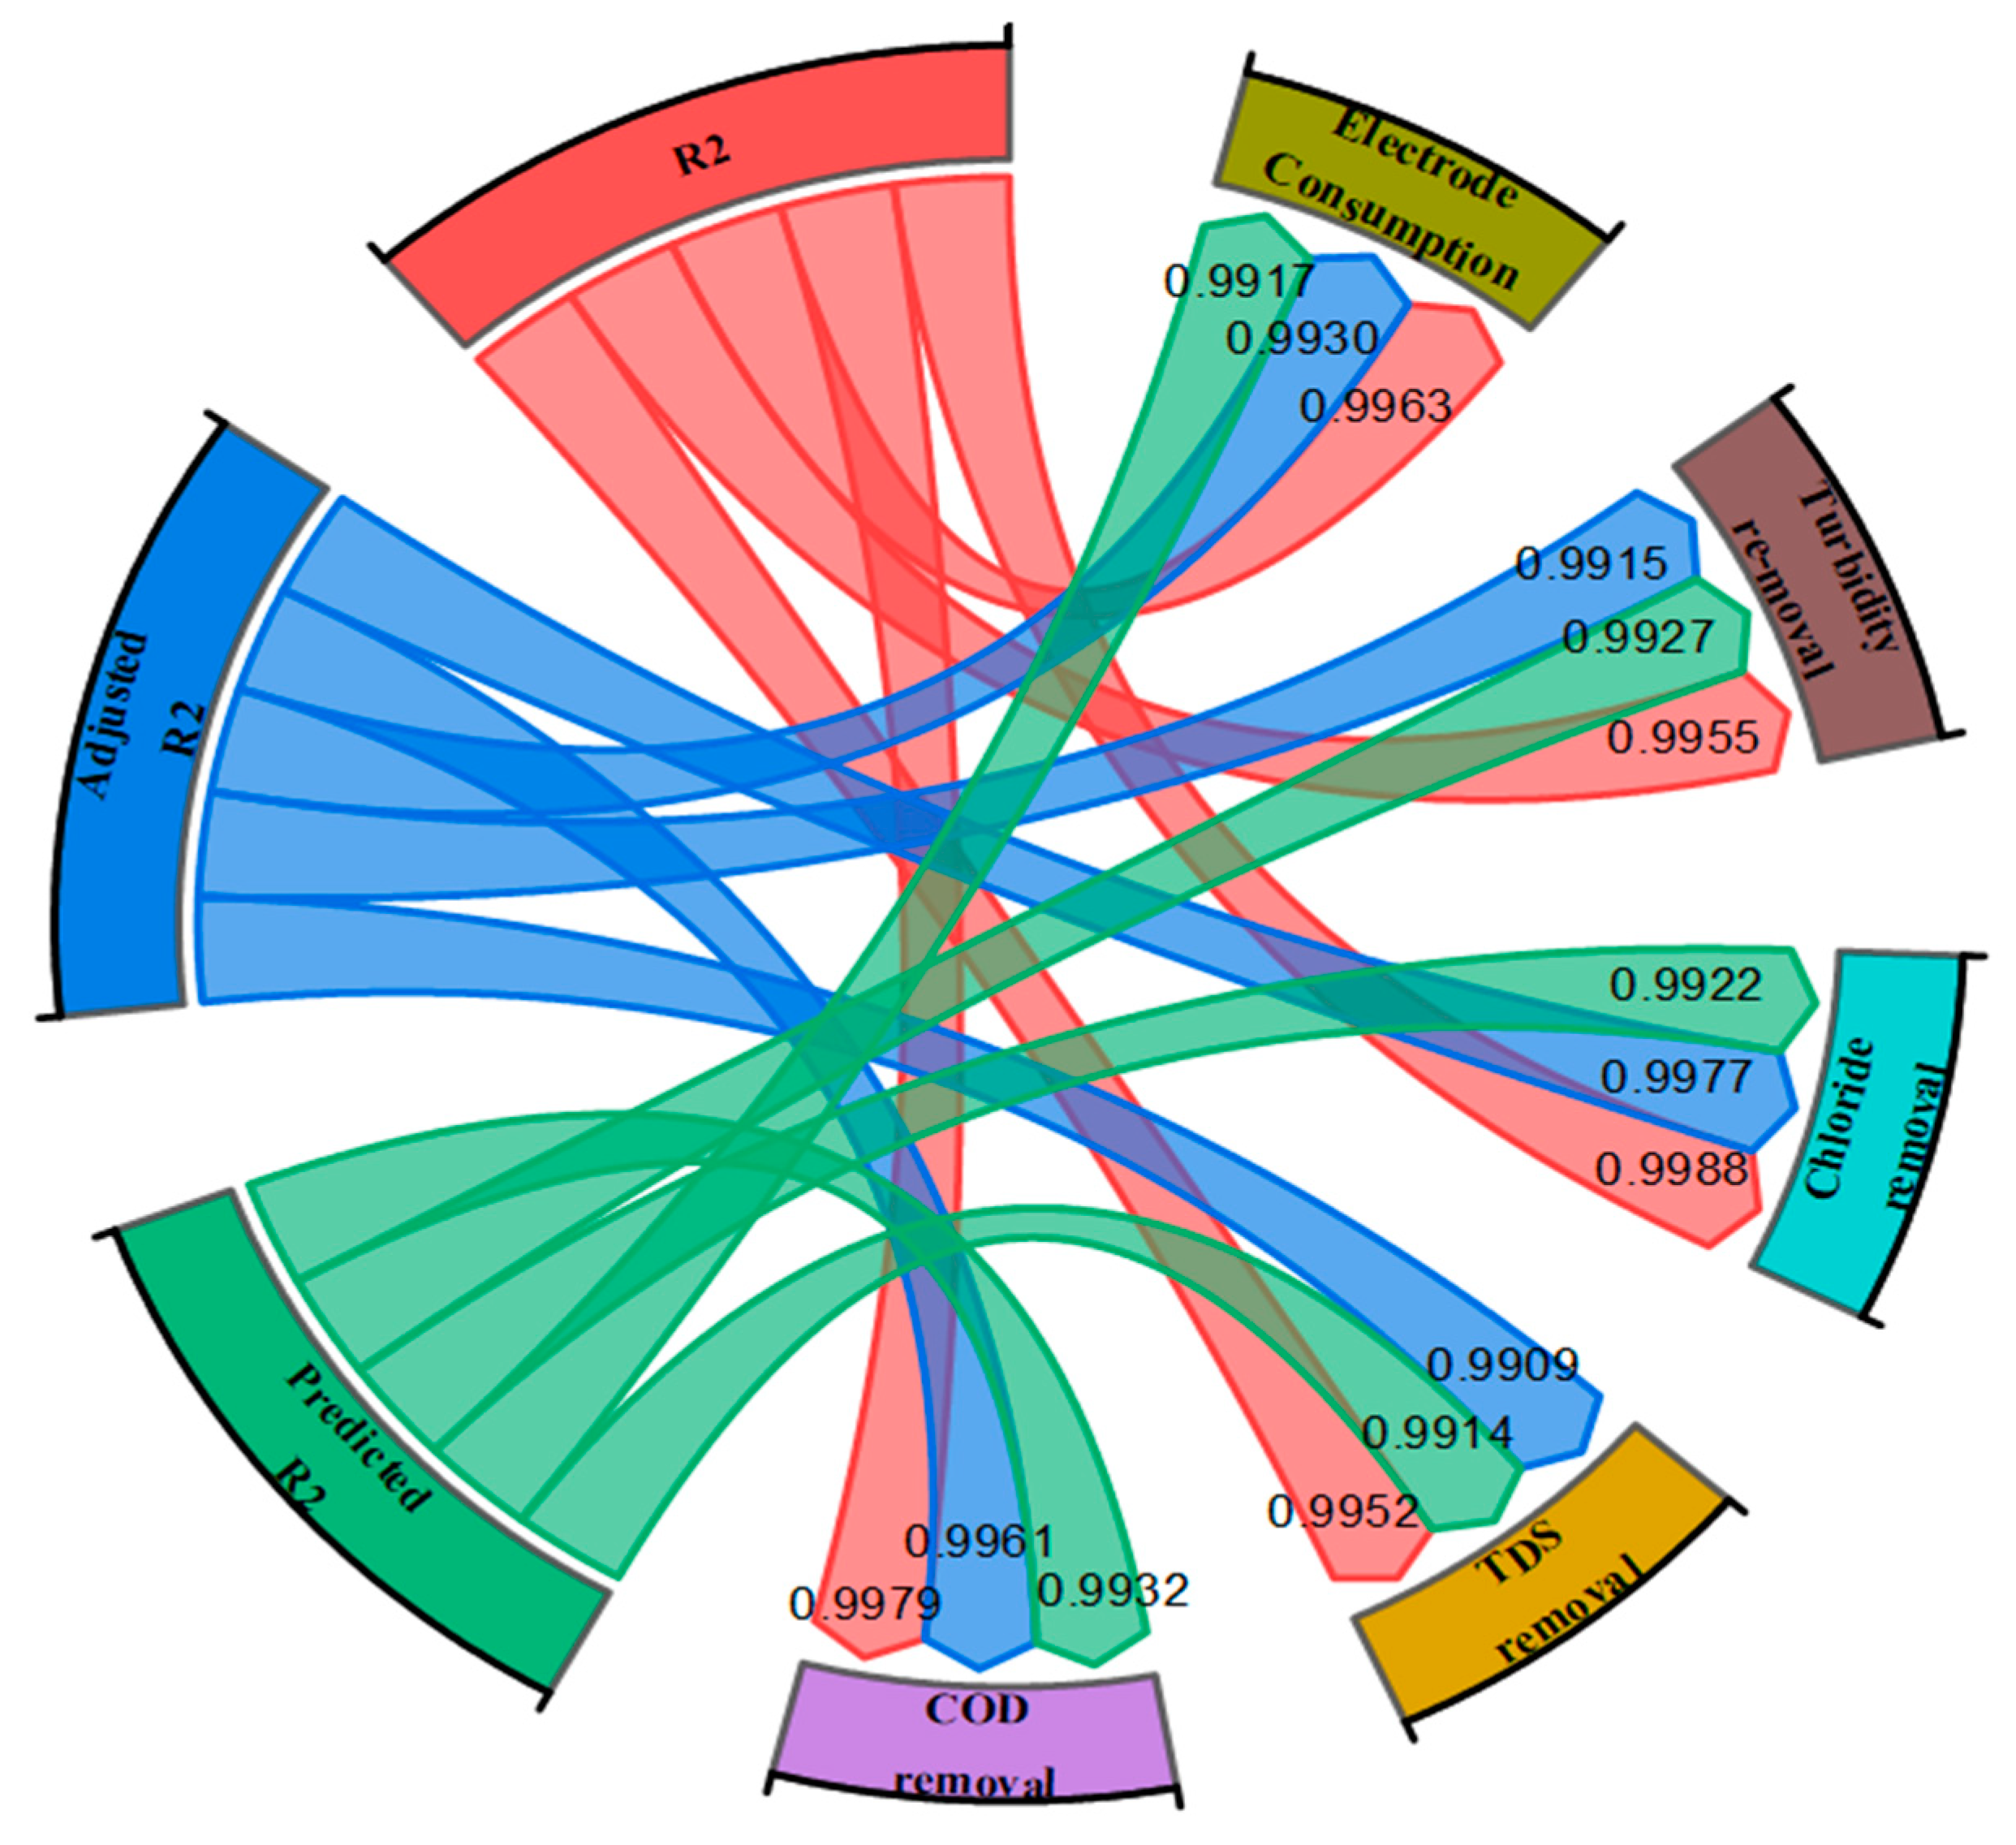
3.5. Experimental Results of the ANOVA Statistics

To summarize the 20 sets of runs, the actual (experimental) responses, and predicted responses, as shown in Figure 3 for the coded central composite design, fused in the greywater treatment by the electrocoagulation- filtration method, the following Table 3, Table 4 and Table 5 have been created. Y1 (COD), Y2 (TDSs), Y3 (chloride), Y4 (turbidity), and Y5 (electrode consumption), are all determined by three variables, as voltage (A), time (B), and pH (C). The Design-Expert software created the model quadratic regression Equations (9)–(13) [27].

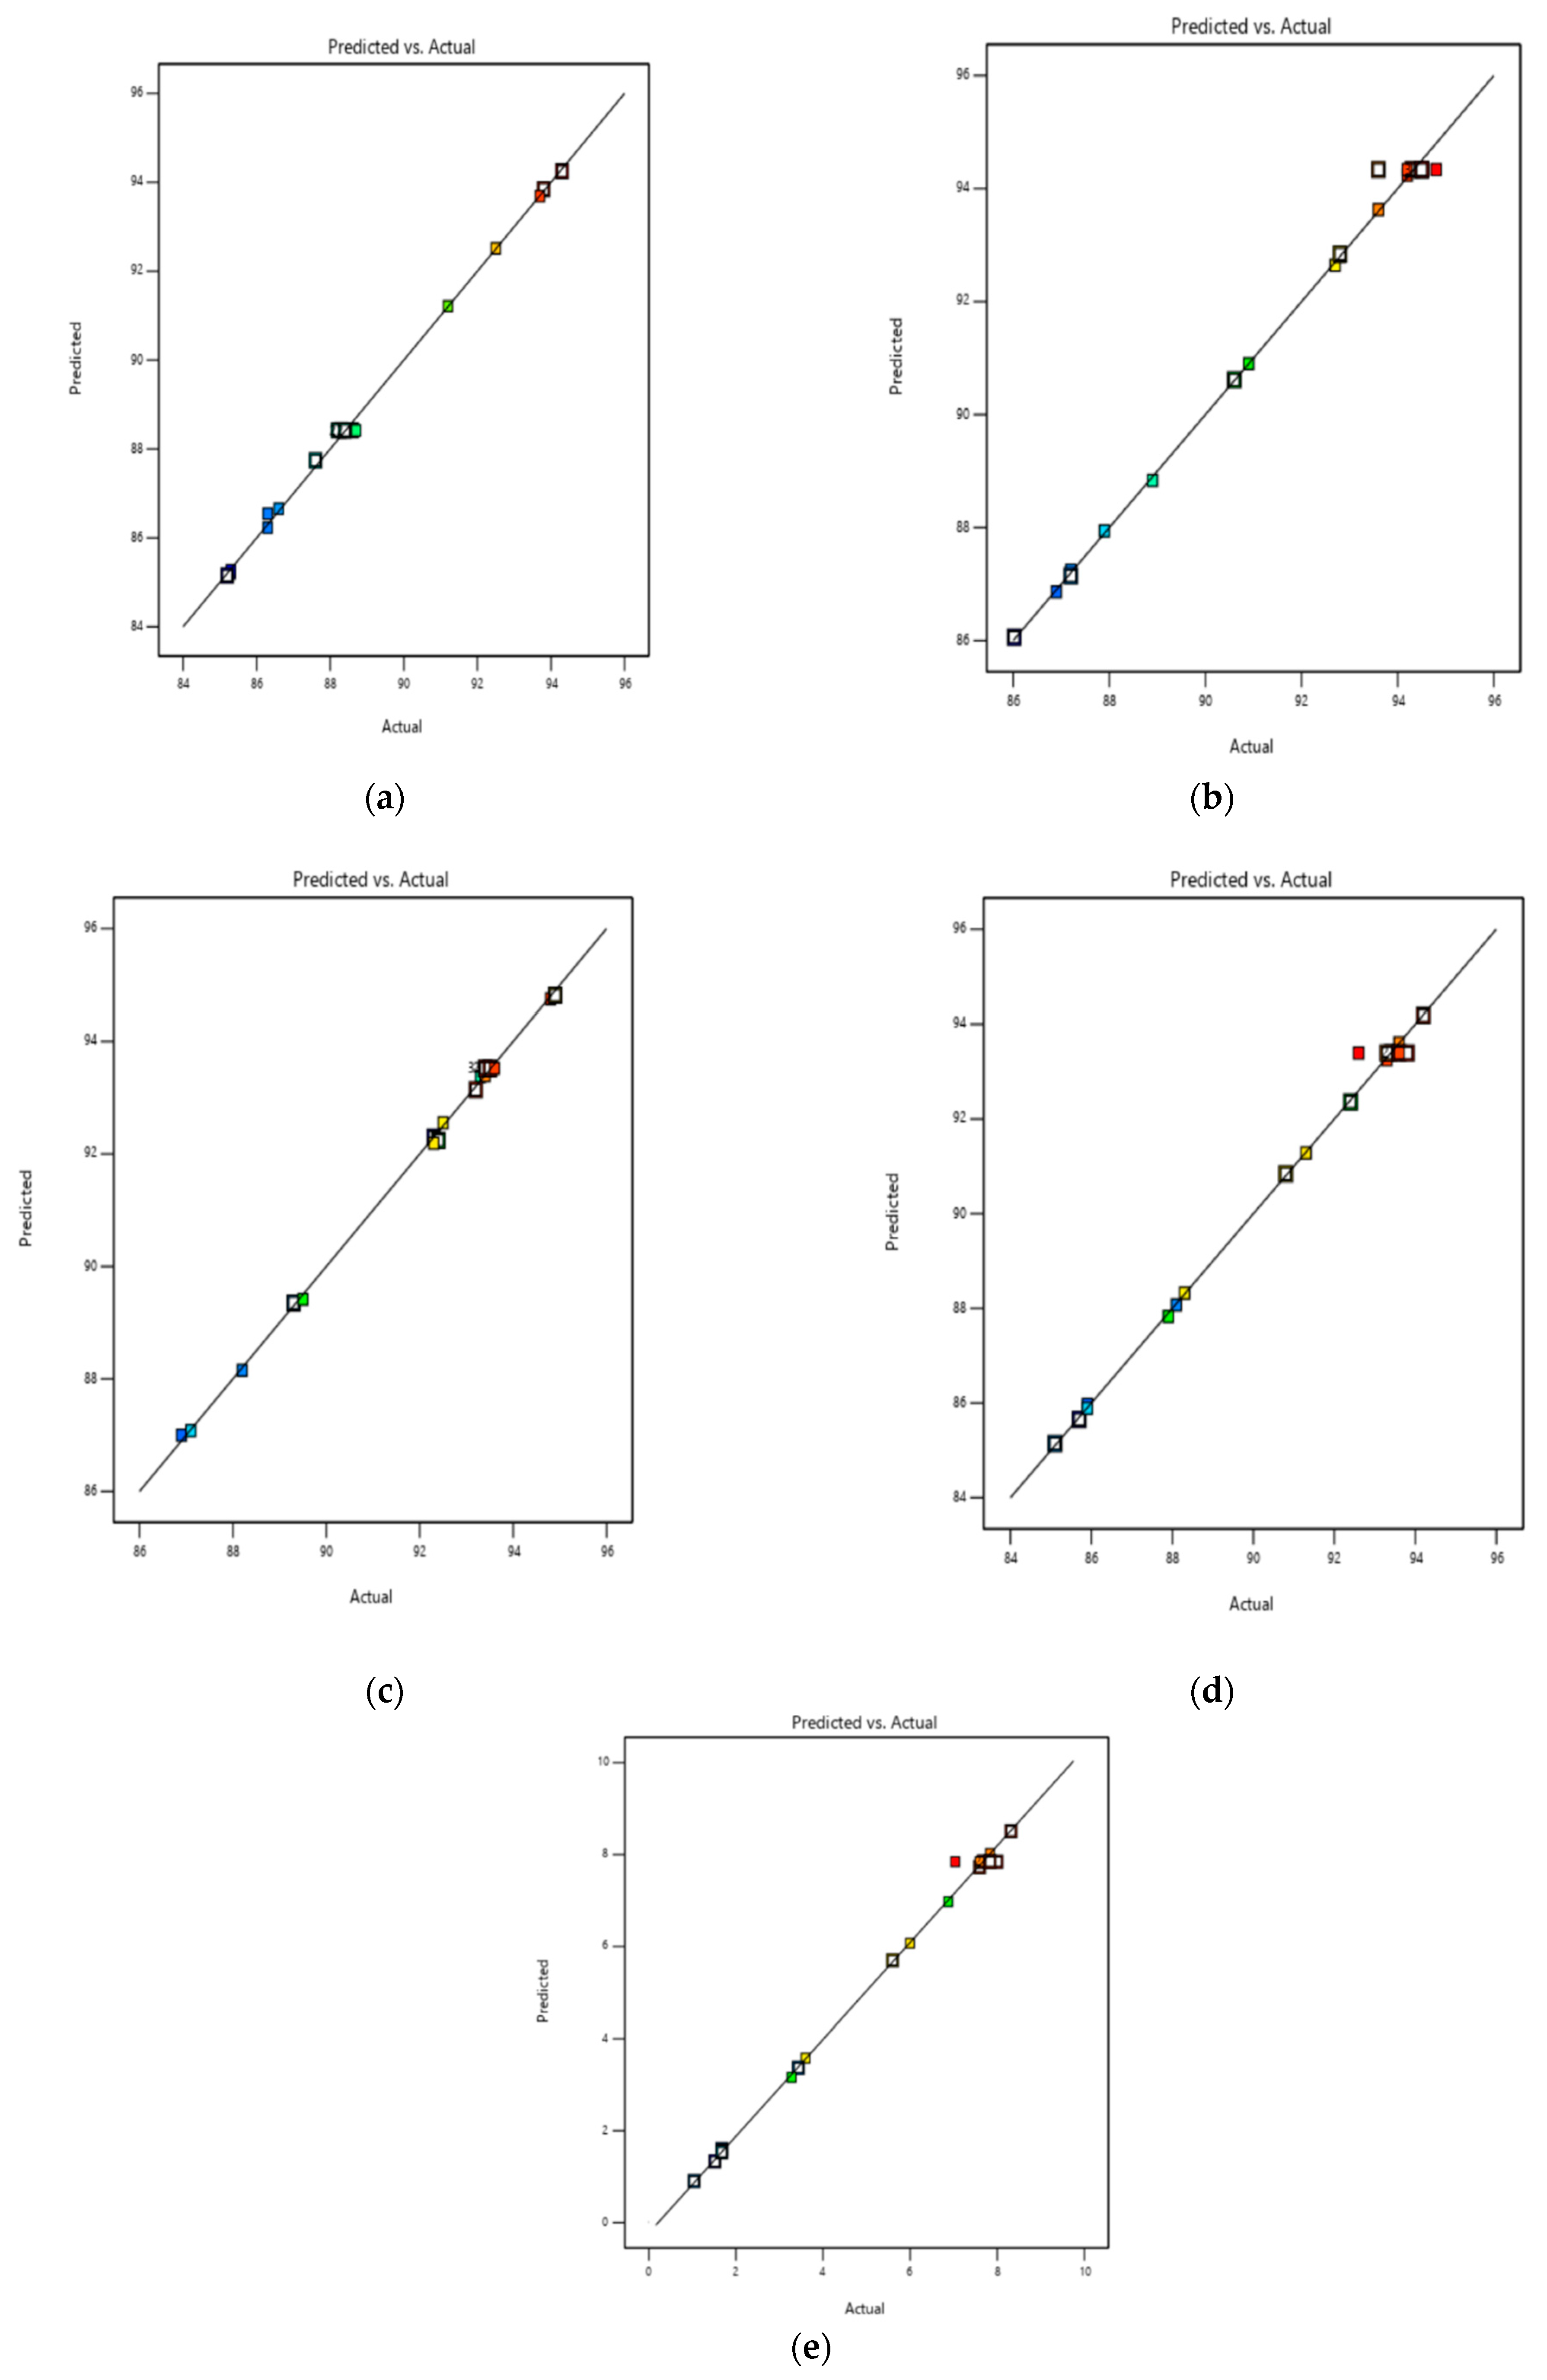
3.6. Validation of the Design

An investigation using the RSM technique was conducted to determine the best fit for the response function, to analyze the results of the EC and filtration processes regarding the error reduction and discover the best fit for the response function. Following the results shown in Table 6, the ANOVA (analysis of variance) was applied to decide the validity of the predicted model, as well as the multiple responses, which were tested for the COD, total dissolved solids (TDSs), turbidity, chloride, energy consumption, and operating cost reduction. The F-test was performed to determine whether the model was statistically significant. To obtain the correct result, the F-value of a model must be more important than the p-value of the model [27]. Statistically significant differences were found between the treatments for the COD, total dissolved solids (TDSs), chloride, turbidity, energy consumption, and operating cost, with the model F-values of 538.86, 229.91, 934, 248.21, 301.35, and 503.27, respectively. It was also found that for all five responses, the p-value was less than 0.0001, pointing out that the model is more correct and highly significant. The estimated lack of fit value for the model was shown to be not significant for all five responses, namely the COD, TDSs, turbidity, chloride, energy consumption, (p-value = 0.9402, 0.9993, 0.1251, 0.9994, and 0.9161, >0.05), indicating that the model is accepted, suitable, and considerable for the pollutant removal via the ECF processes [21,22]. The correlation between R2, adjusted R2, and predicted R2 comes to 0.99, which again proves that the model is acceptable, as shown in Figure 4.

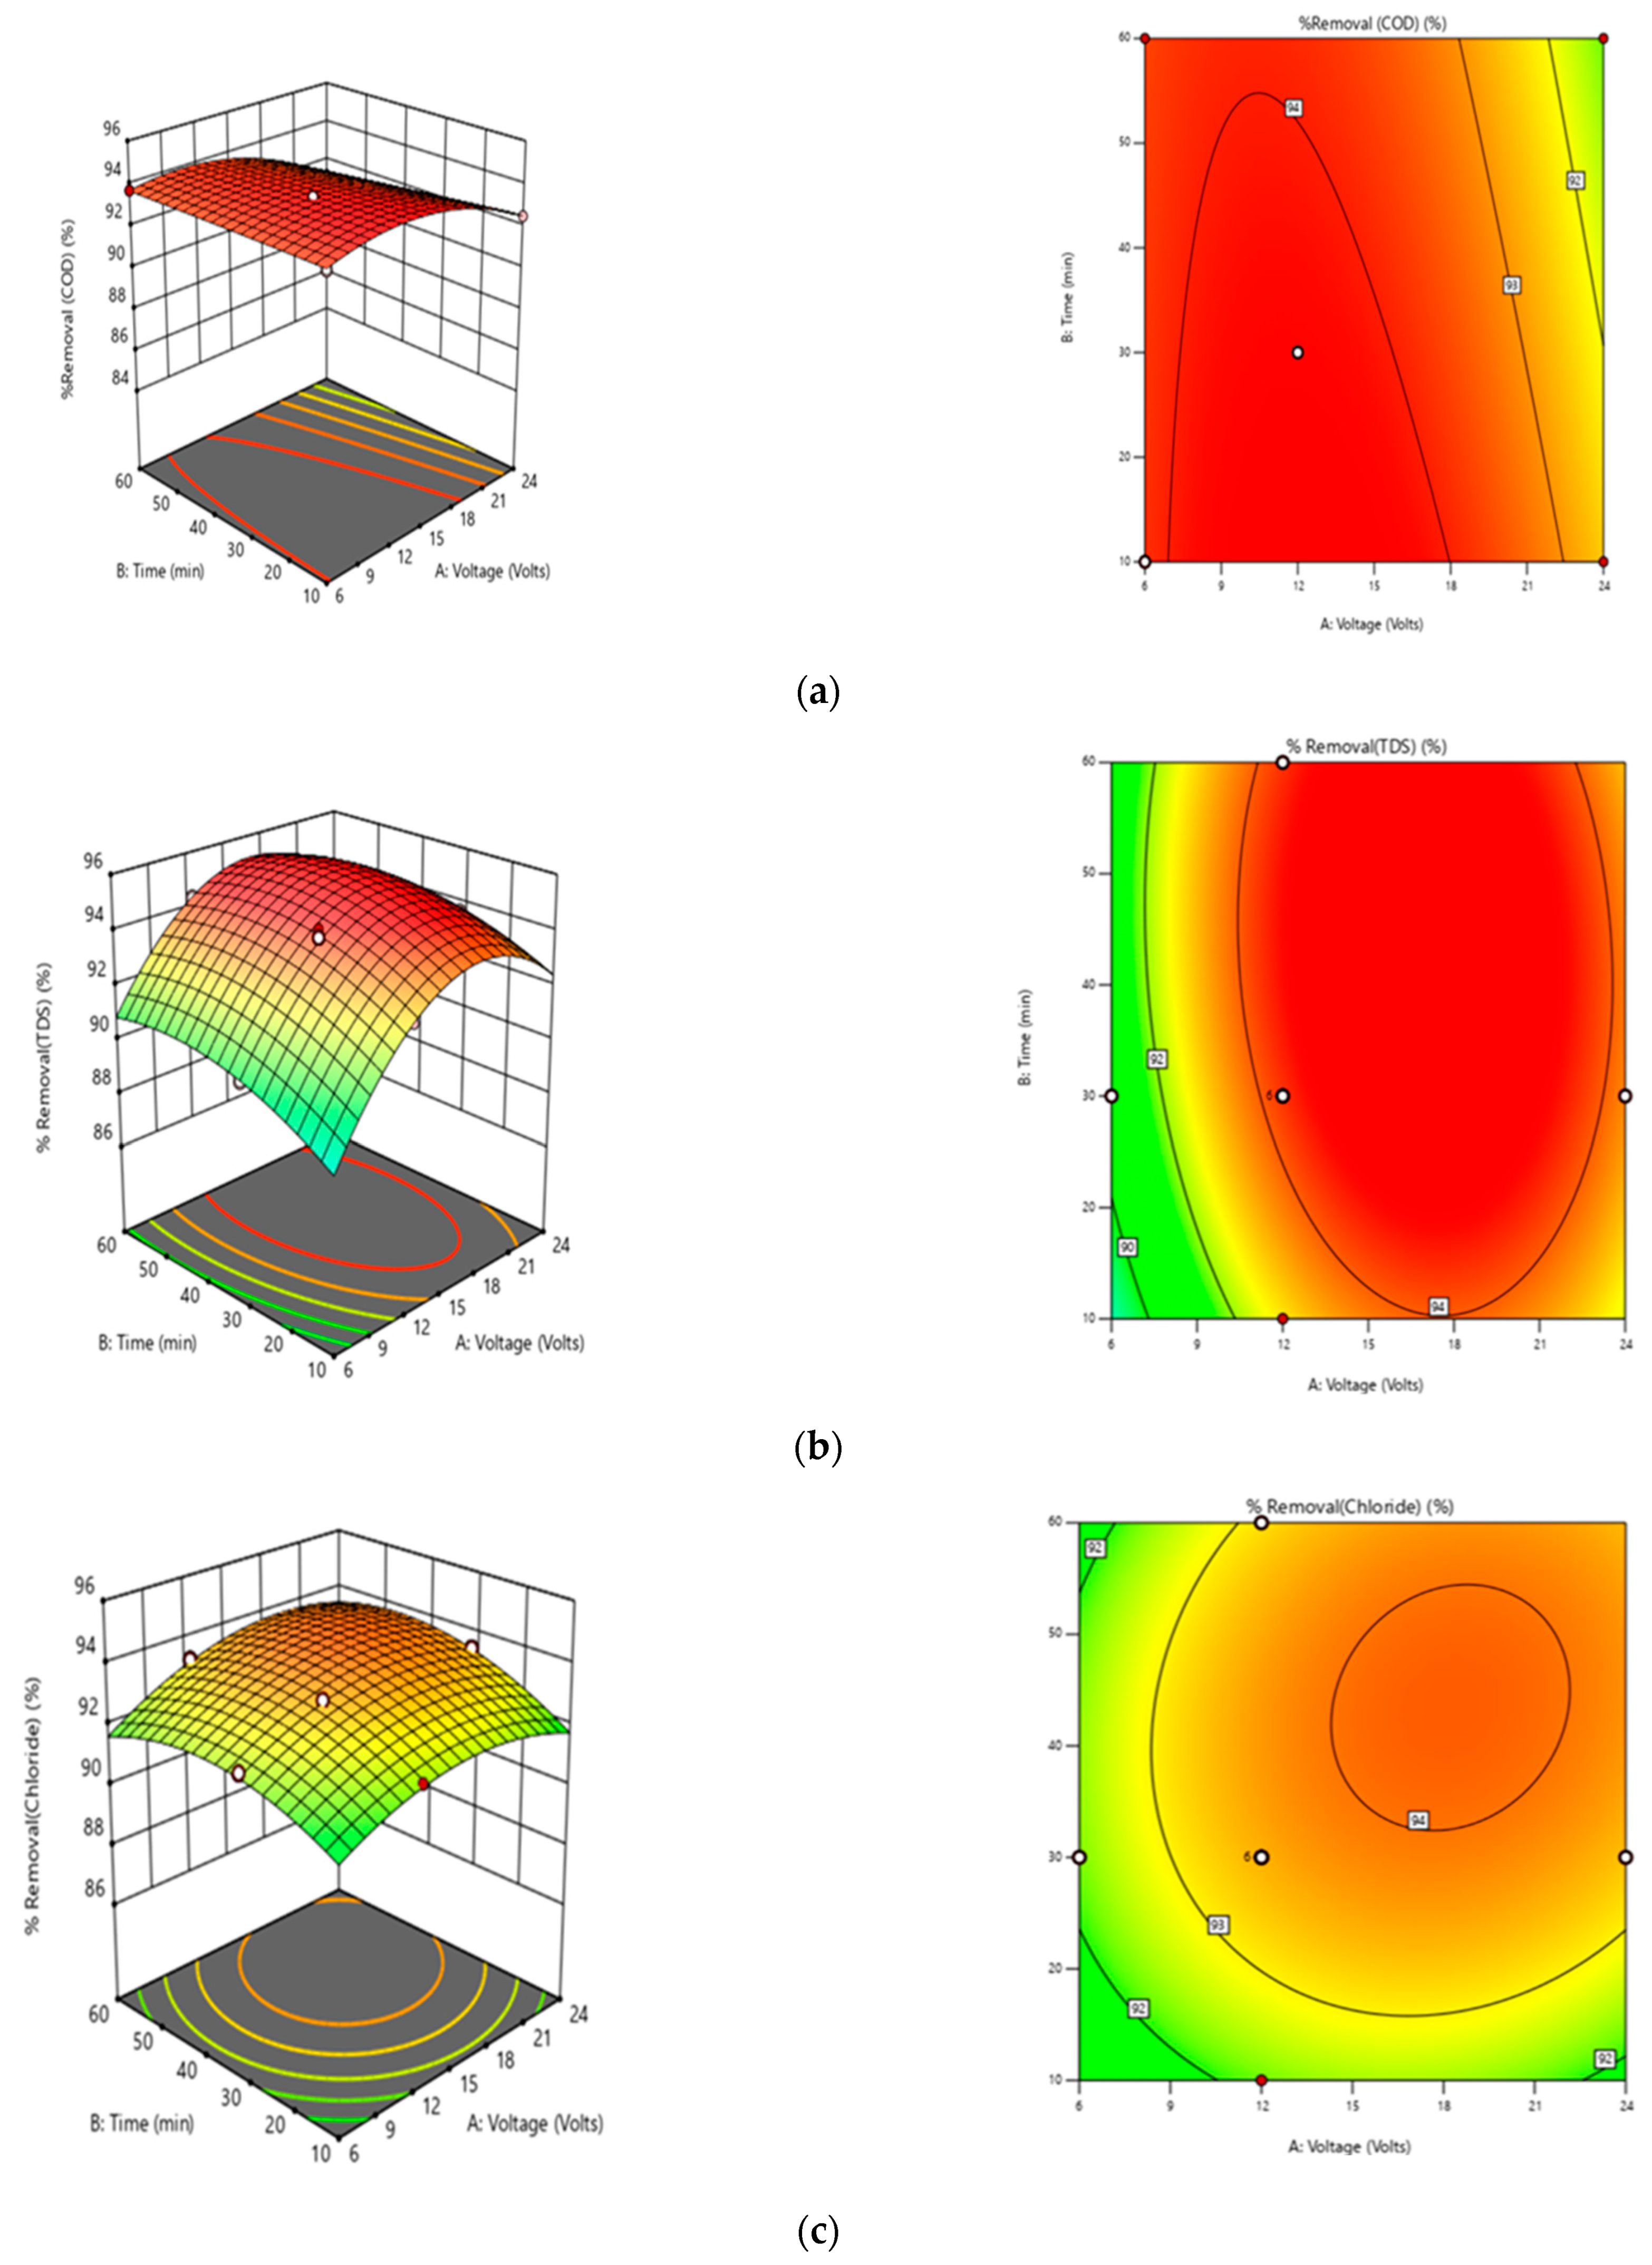
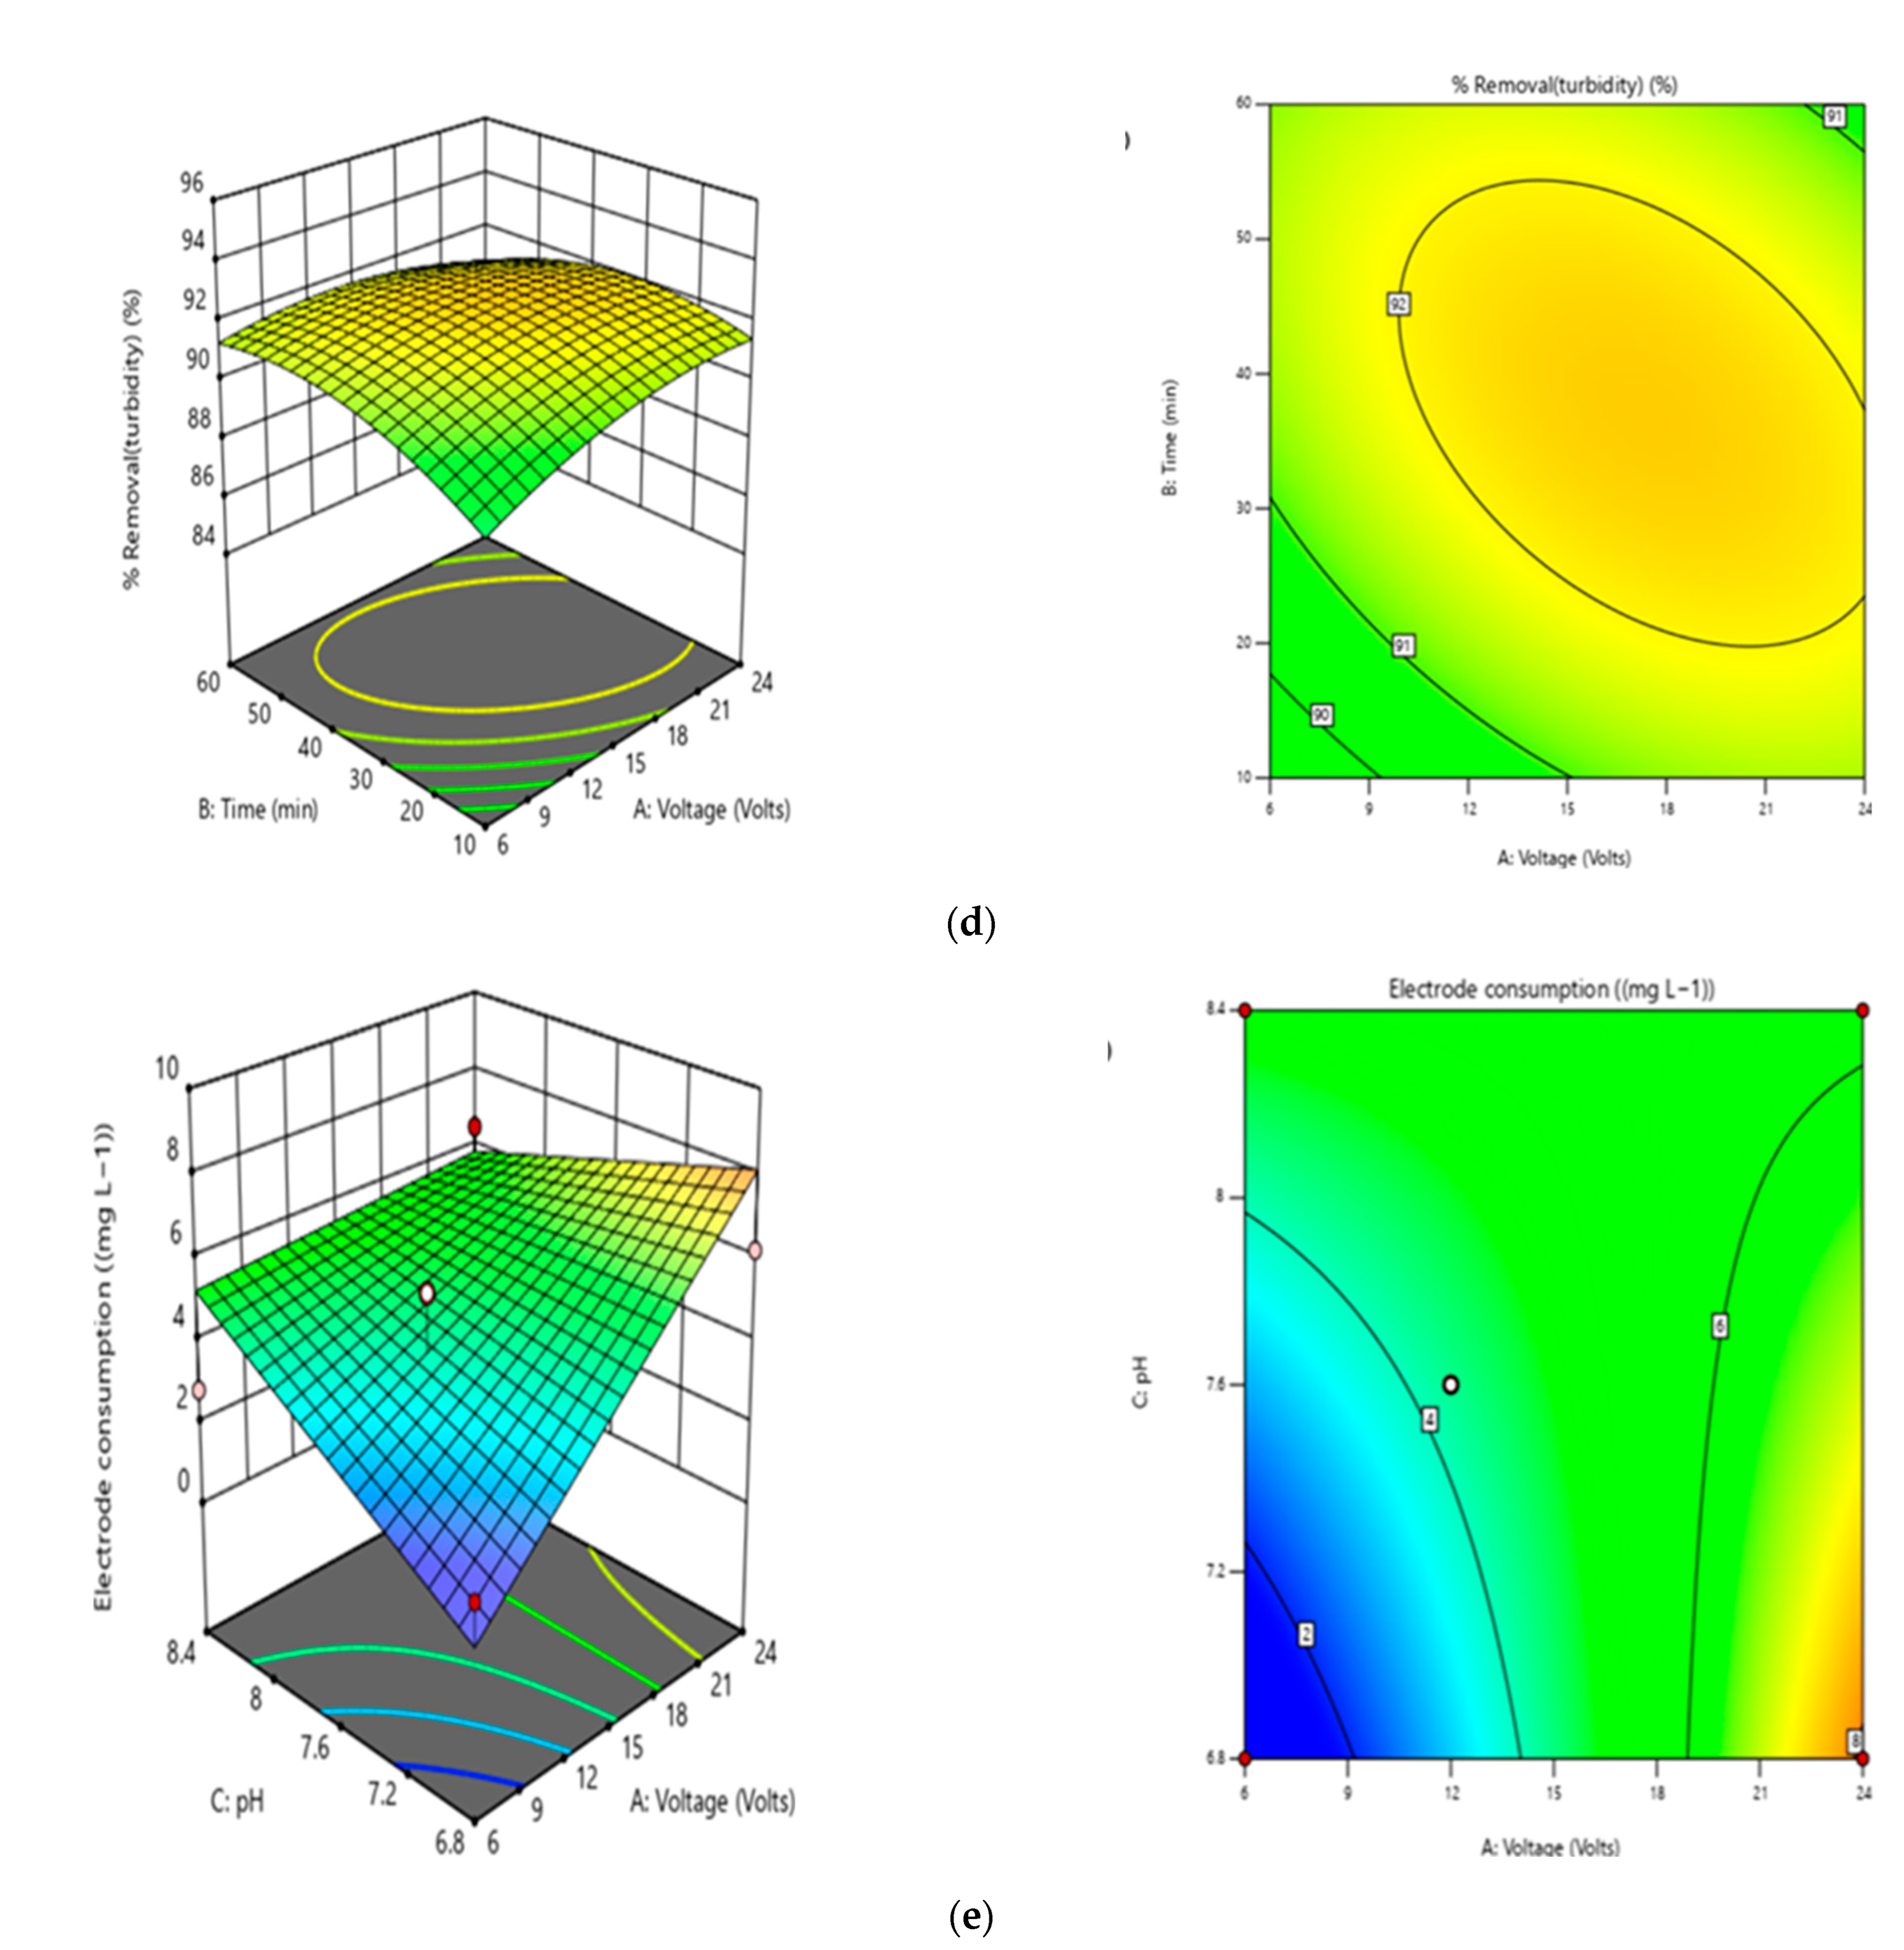
3.7. Three Dimension Surface Plot

Figure 5 depicts, with the help of a three-dimensional surface plot, the matrix of the effect that applied voltage and operating duration have on the removal efficiency of the COD, TDSs, turbidity, chloride, energy consumption, and operating cost. The flag on the graph indicates the highest percentage of pollutants removed (94.3% COD, 94.8% TDSs, 94.9% chloride, and 94.2% turbidity), with an electrode consumption of 6.8 mg/L, is under ideal conditions. The graph’s colour scheme alternates between blue and red, with blue representing the lowest value and red representing the highest [21,27].

3.8. Optimization and Verification of the Model
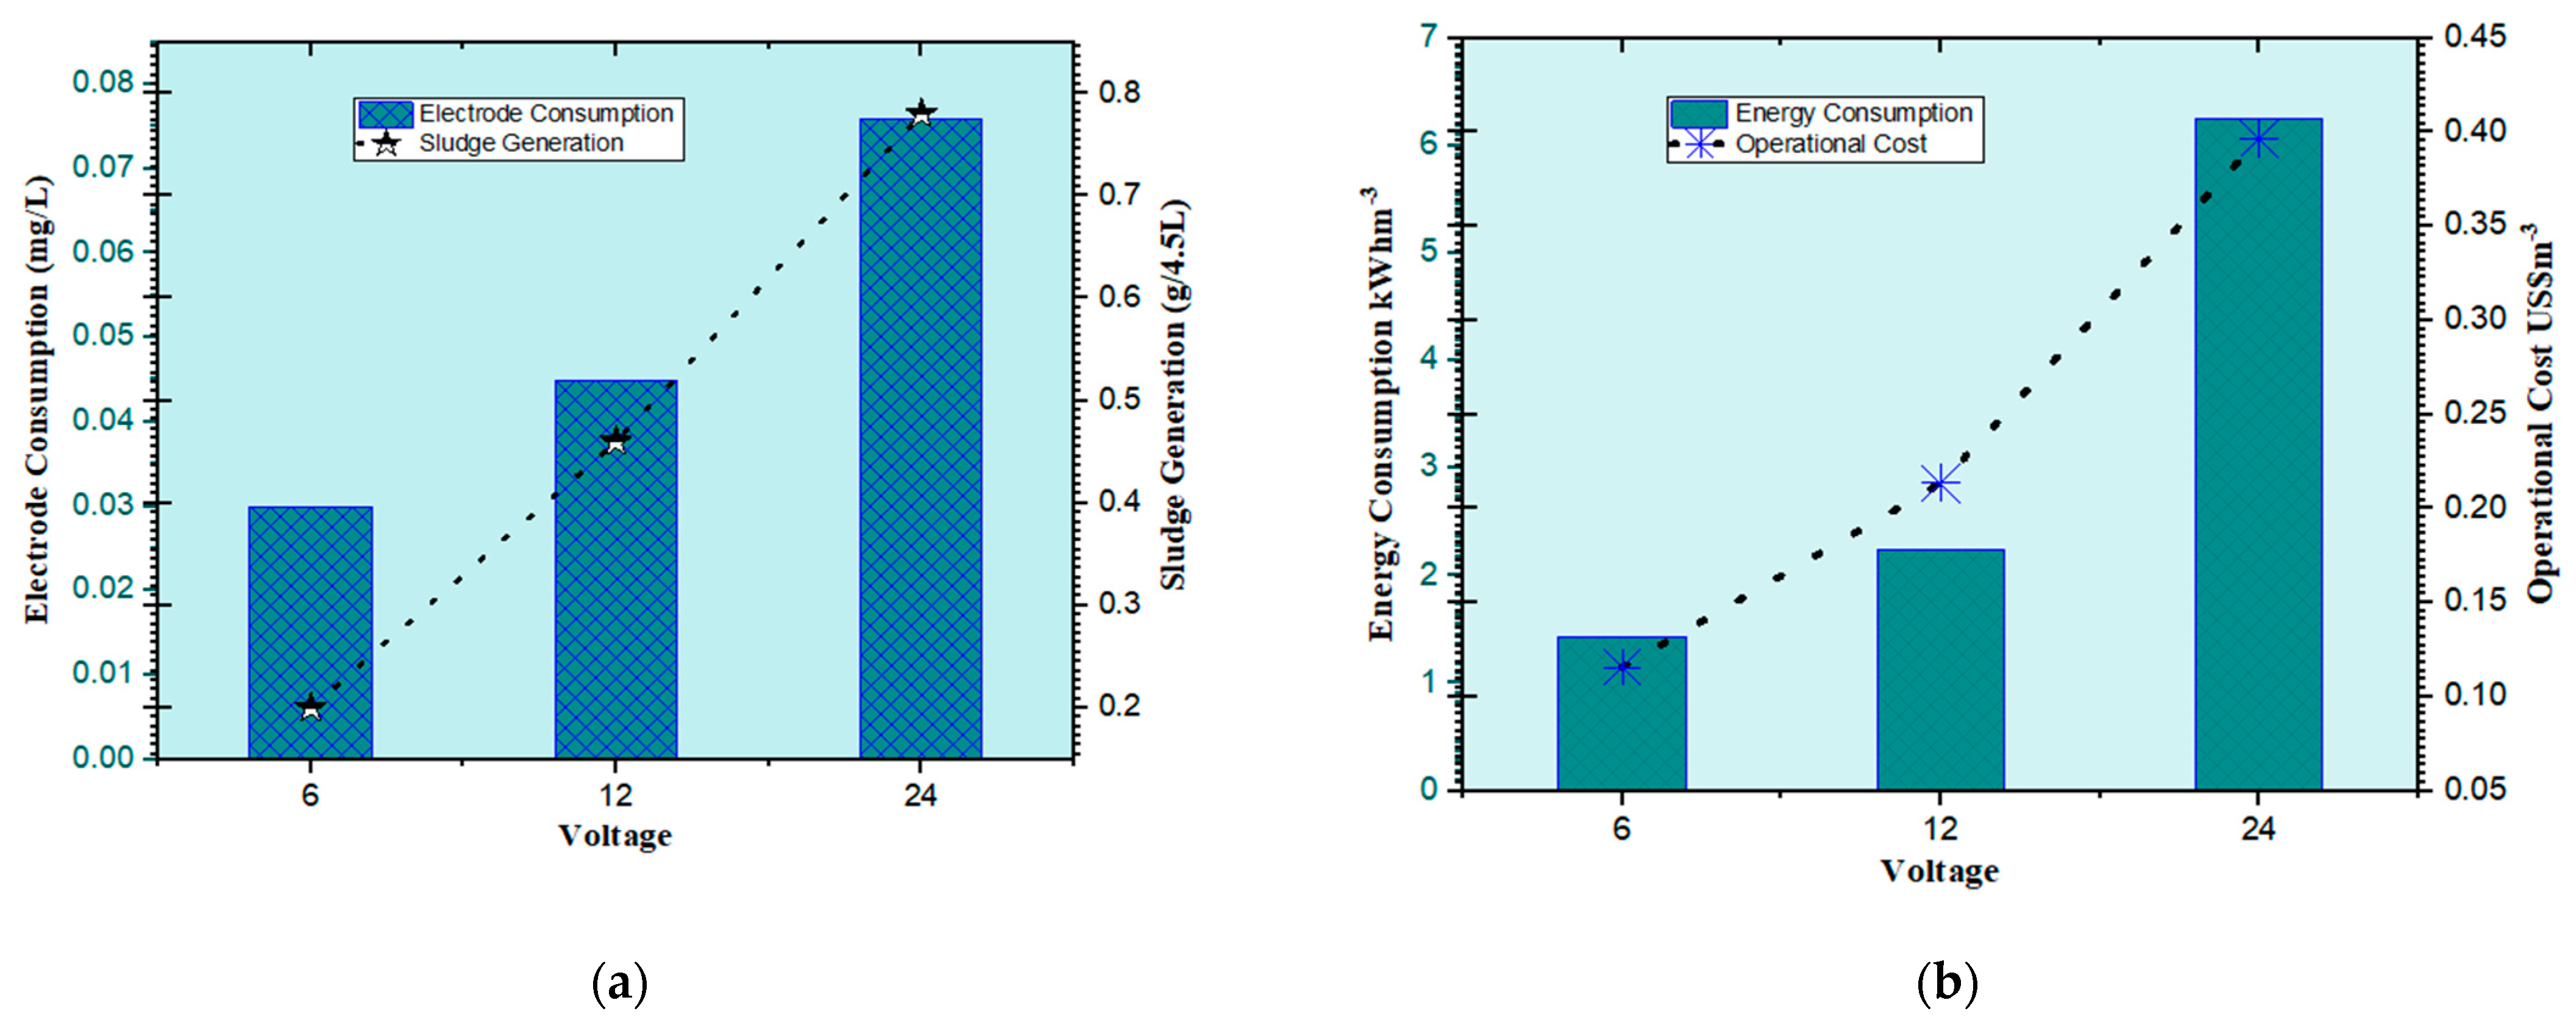
The optimization and validation of the model demonstrated in Table 7, show that the efficiency of the electrocoagulation and the filtration processes using an Al-Fe-Al-Fe electrode combination with a different applied voltage, ranging from 6 to 24 volts, which results in the removal of organic matter and contaminants from greywater, is influenced by several factors, counting with the electrode materials type, applied voltage, pH, electrocoagulation time, and sludge produced in the cathode and anode. Hence, in the optimization process, the effect of applied voltage, electrocoagulation time, and pH were studied using the Al-Fe-Al-Fe electrode combinations.

4. Operational Cost

As per the researchers’ output, the performance of the electrocoagulation filtration process is determined by the operational costs of the treatments, which is a disadvantageous approach, particularly in large-scale industrial applications [10,32]. Despite this, the technology has received little attention, with only a few studies published on the analysis of the operational costs. In the ECF process, the operating rate (OPc) includes the electrical energy consumed, the cost of the electrode uses, and the protectorate cost for the sludge disposal in landfills, filtration medium, and other fixed charges, which are projected to be 0.03 USD kg/m3 on average (USD 1 = INR 78.90) [33]. The cost of the electrical energy and electrode material and the cost of maintenance are used to calculate the operating cost, which is represented by Equations (14) and (15) shown below and expressed in Figure 6 [6,10,34,43]
OPc = Cost Energy + Cost Electrode + Cost Maintenance
Cost of energy, Cost Energy (kWh/m3) = {(U*i*to)/V}
Cost of Electrode, Cost Electrode (kg/m3) = {(i*to*Mw}/(z*F*V)}
where U = cell voltages (V); I = current (Amp); to = operating time (h); V = wetted volume of the reactor (m3); Mw = molecular wt. of Fe/Al (g/mol); z = amount of electrons involved in the EC process (2 for Fe and 3 for Al); F = faradays constant (96,485 C/mol); CD = current density (A), electrical consumption unit pricing for the Nagpur area (India) was set at USD 0.05/kWh, while the price of the electrode material was set at USD 0.51/kg for Fe and 1.39/kg for Al.

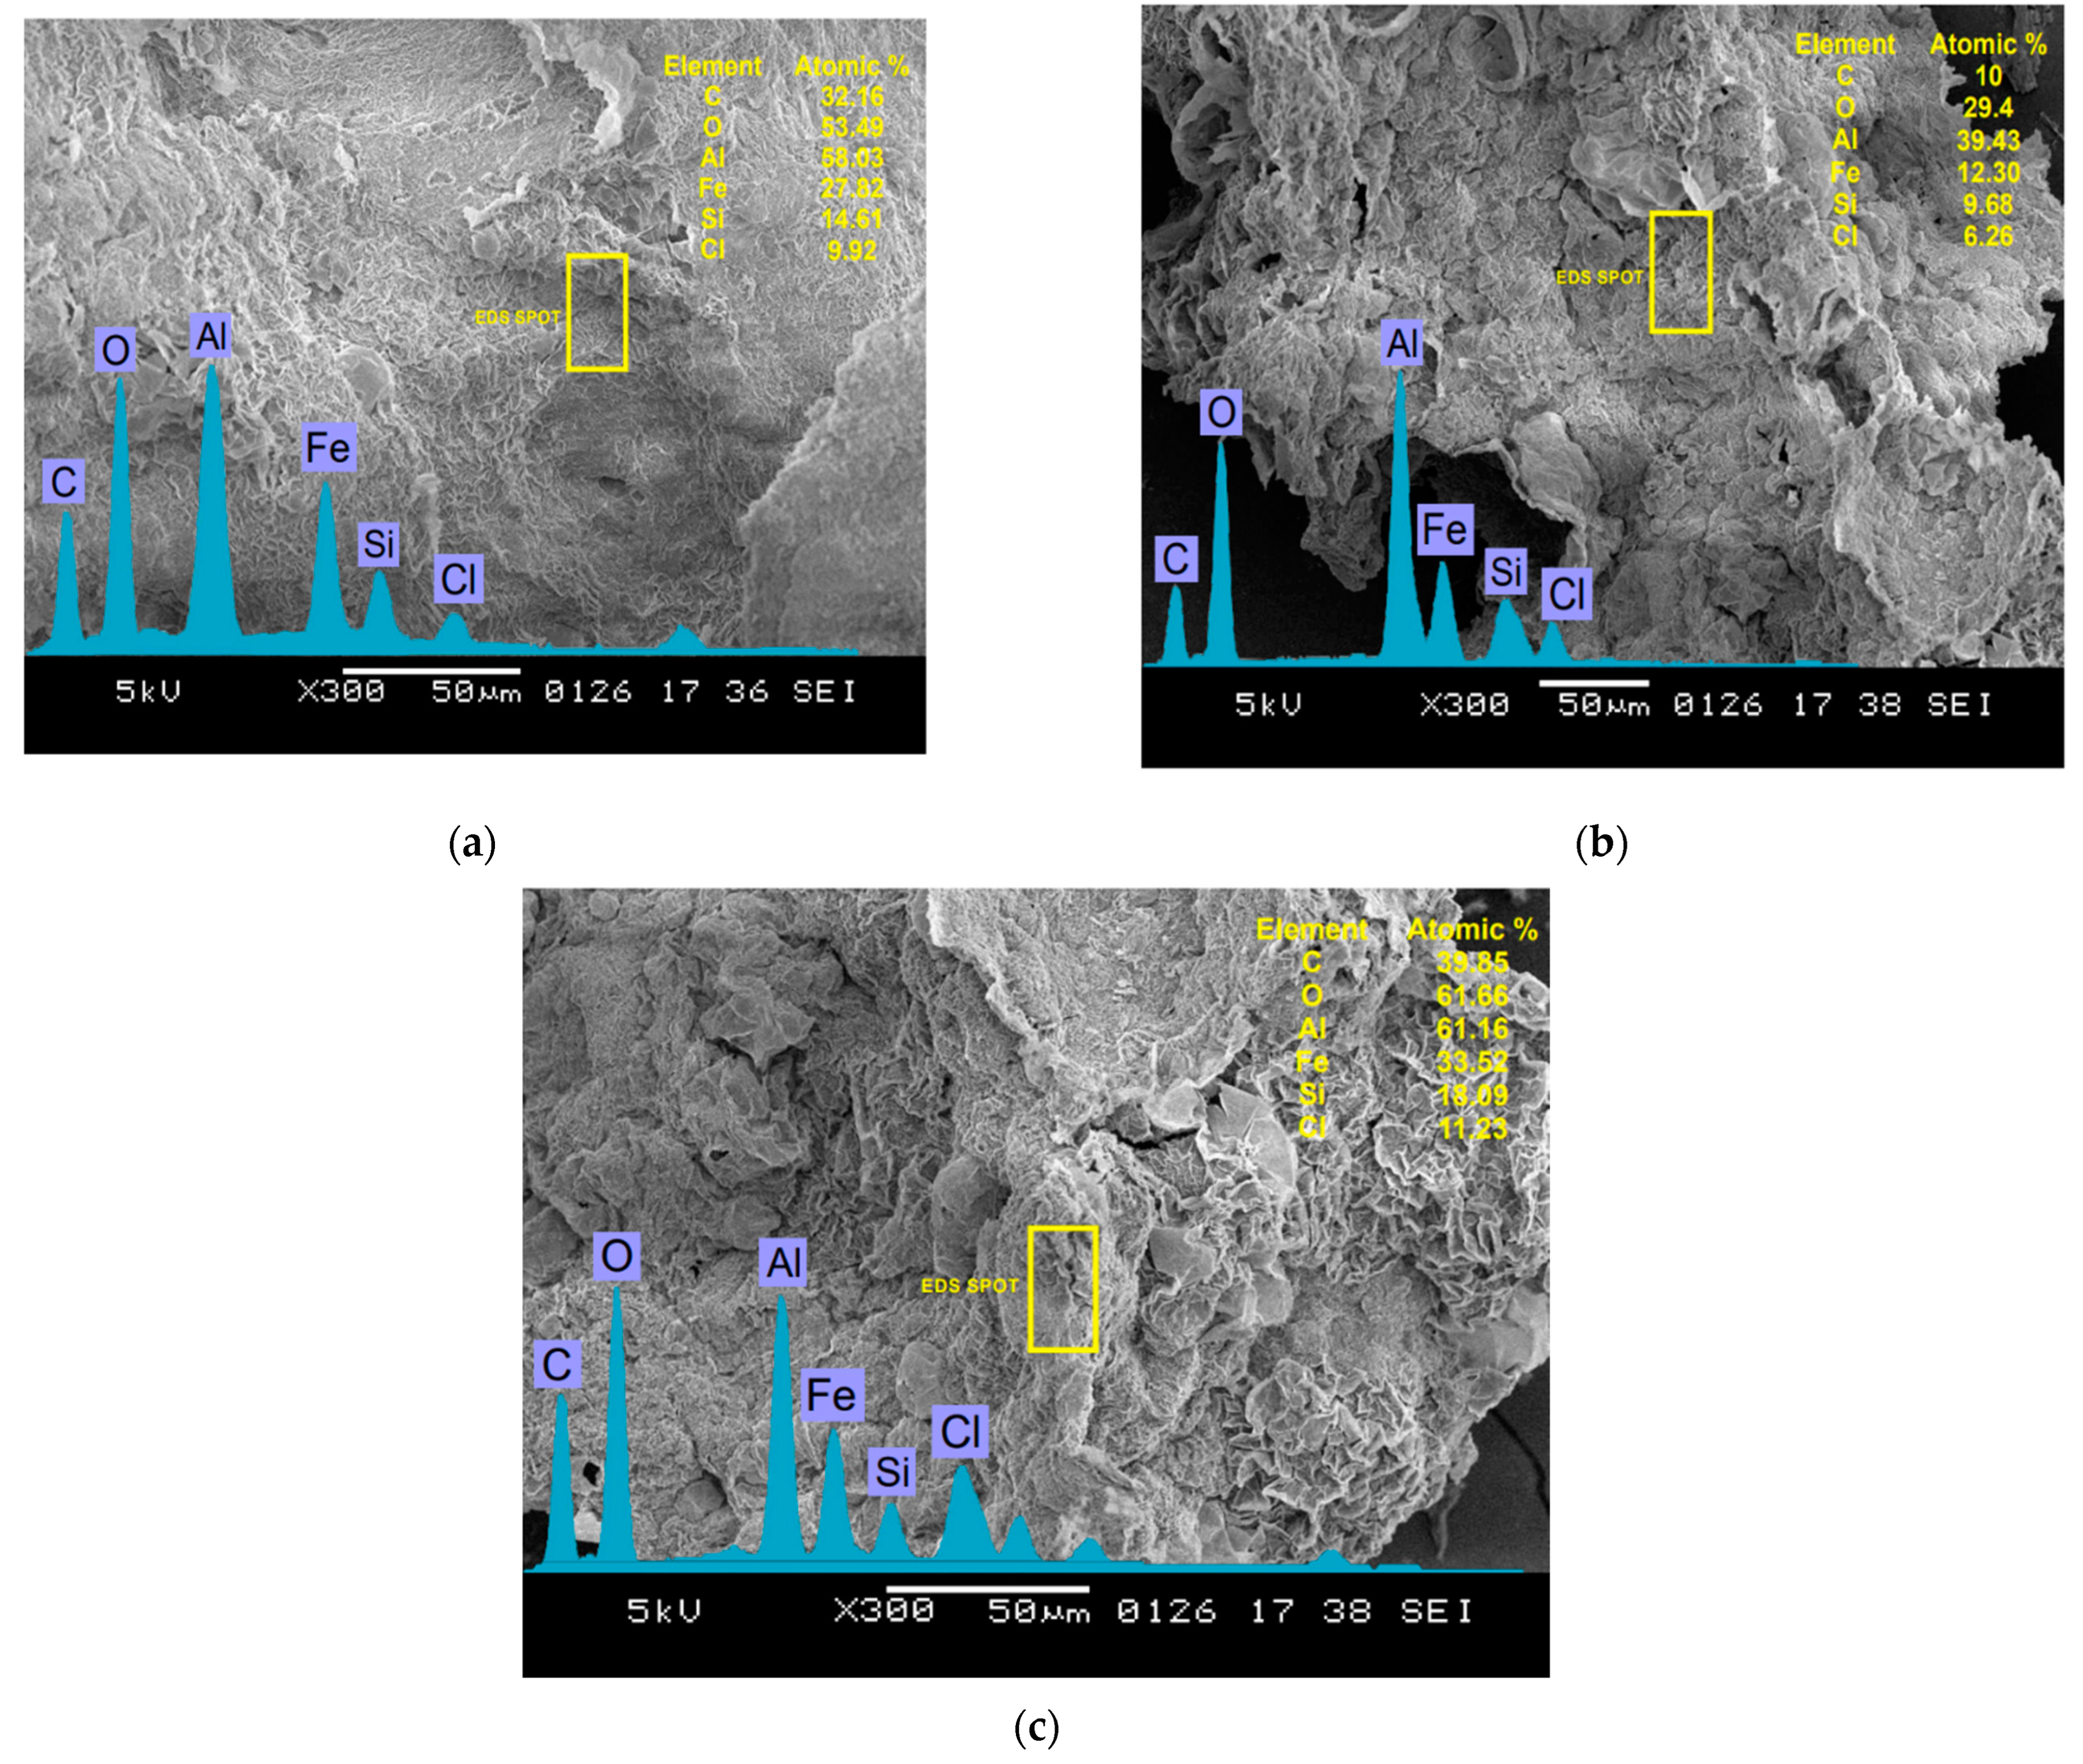
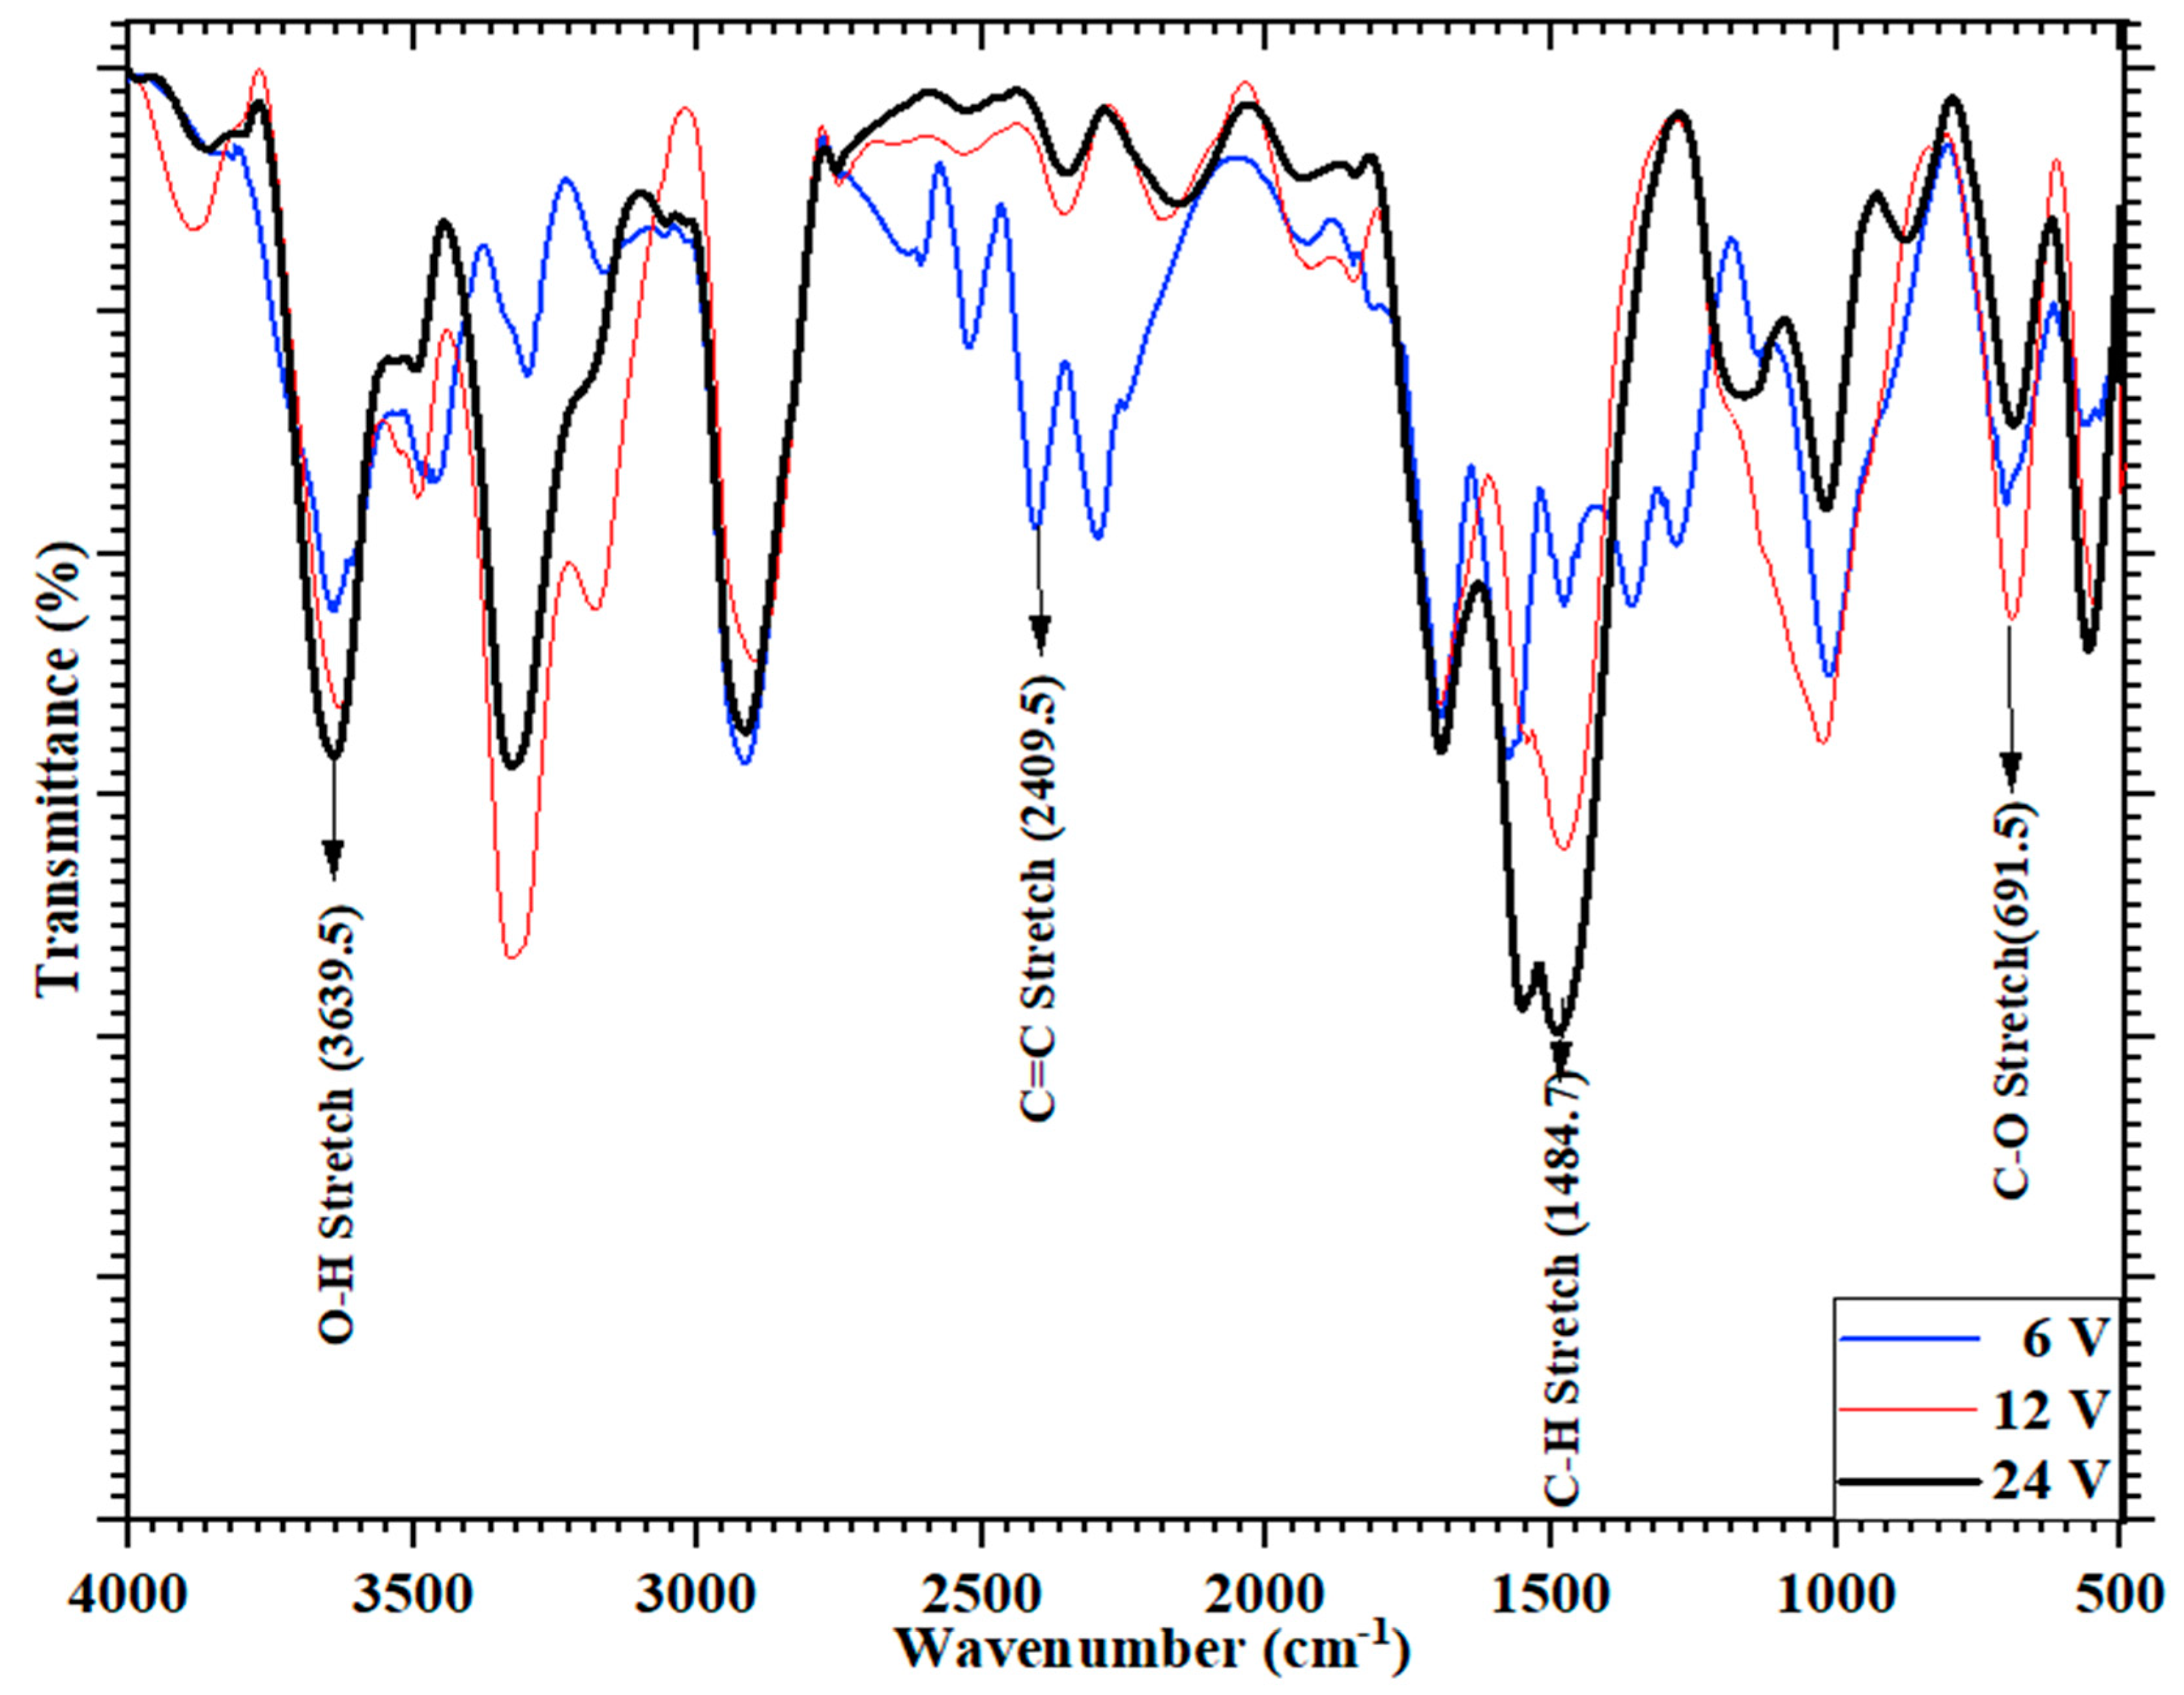
5. Sludge Characterization by the SEM, EDS, and FTIR Analyses

Sludge characterization facilitates the greywater recovery and pollution microstructural abatement, and examines the functional group by the SEM, EDX, and FTIR spectrum, after the obtained electrocoagulation treatment process at 6, 12, and 24 volts, as shown in Figure 7a–c. The sludge produced under various voltage distribution variations demonstrates that the scum particles created are highly agglomerated during the treatment process and the EDX analysis reflects the presence of the various elements with their atomic strength.
The presence of a high level of oxygen (29.4%, 53.49%, and 61.66%) and alumina (39.43%, 58.03%, and 61.16%) in 6, 12, and 24 volts, respectively, indicates the hydroxide contents in greywater during the coagulants and precipitate formation, obtained during the electrocoagulation process. Again, the presence of carbon and iron elements shows the adsorption mechanism which highlights the significant reduction of the organic pollutants from greywater with an increase in the atomic strength with an increase in the applied voltage. The FTIR analysis indicated, as reflected in Figure 8 shows, the changes in the wavenumber position to highlight the major peaks at 3639.6, 2409.5, 1484.7, and 691.5 (cm−1), reflecting the functional group of Hydroxy, due to the O-H stretching, alkenyl C=C stretching, C-H methylene and C-O bending stretching, indicating the elimination of greywater organic pollutants through the process of electrocoagulation [19,36,37,43]. The observed FTIR reflects that some slight changes in the amorphous nature were found with the different applied voltages. The sludge formed by the EC process, increases the operational costs and creates environmental issues with the disposal solutions, such as the electron metal ions, the operating treatment duration, the flow rate, the chemical composition, and so on, which are eliminated during the water purification. There hasn’t been much research on the potential applications of EC sludge, nor has there been much research on its use in specific industries. However, there are a few studies that have been carried out on the use of sludge as fertilizers, pigments, building materials, absorbents, and catalysts, as well as a few studies on EC sludge valorization [44,45,46].

6. Conclusions

The study examines the removal of the pollutant parameters of greywater, using the electrocoagulation filtration ECF technology of Al-Fe-Al-Fe electrode combination, at the varying applied voltages of 6, 12, and 24 volts. The results showed that the experimental removal efficiency, concerning initial pH, current density, and operating time, reaches (85 to 94)%. The statistical data analysis was utilized to check the experimental accuracy by using a central composite design to consider the values of the operating parameters at various factor intervals such as (voltage, time, and pH), on the elimination of the COD, TDSs, turbidity, chloride, with the utility of energy consumption with 20 sets of experimental run values provided by the RSM techniques. The findings show that the R2 value (i.e., R2 > 0.97~0.99) acquired from the ANOVA for all five responses consent that the suggested model is reliable and sustainable with strong evidence that the actual values and predicted values acquired are below 5% of the expected values. It was observed that the operating cost for the different voltages, was between (0.12 to 0.40) USD/m3. This concludes that the response surface method can optimize the greywater’s long-term electrocoagulation filtration treatment. Finally, based on the experimental results and the optimization model, the ECF discharge greywater can be recycled and reused for non-potable consumption, such as gardening, the automobile sector, and lavatory flushing, applicable in rural, urban areas, and industries sectors with proper disinfected arrangements to remove the pollutant contaminants, in order to achieve a sustainable water management.

Author Contributions

Conceptualization, K.A., A.S. and A.A.A.; Data curation, K.A., M.A.M., A.A.A., A.N.A. and A.E.; Formal analysis, K.A., A.S., M.A.M., A.A.A., M.A. and A.N.A.; Funding acquisition, M.A.M., A.A.A., M.A. and A.N.A.; Investigation, K.A., A.S., A.N.A. and A.E; Methodology, K.A., M.A. and A.N.A.; Resources, K.A., A.S., M.A.M., M.A., A.A.A. and A.E.; Software, K.A.; Supervision, A.S. and A.E.; Validation, K.A., A.N.A. and A.E; Writing—original draft, K.A. and A.S.; Writing—review and editing, K.A., A.S. and A.A.A. All authors have read and agreed to the published version of the manuscript.

Funding

The authors acknowledge the support of Prince Sultan University for paying the article processing charges (APC) of this publication.

Institutional Review Board Statement

Not applicable.

Informed Consent Statement

Not applicable.

Data Availability Statement

Not applicable.

Acknowledgments

The authors would also like to acknowledge the support received by Taif University Researchers Supporting Project number (TURSP-2020/240), Taif University, Taif, Saudi Arabia. The authors would like to acknowledge the academic institutions YCCE, Nagpur, and KITS Ramtek for providing resources to carry out the research study.

Conflicts of Interest

The authors declare no conflict of interest.

References

  1. Moussa, D.T.; El-Naas, M.H.; Nasser, M.; Mj, A.-M. A comprehensive review of electro-coagulation for water treatment: Potentials and challenges. J. Environ. Manag. 2016, 186, 24–41. [Google Scholar] [CrossRef] [PubMed]
  2. Melhem, E.S.K. Grey water treatment by a continuous process of an electrocoagulation unit and a submerged membrane bioreactor system. Chem. Eng. J. 2012, 198–199, 201–210. [Google Scholar] [CrossRef]
  3. El-Khateeb, A.-S.H.; Shehata, M.A. Greywater treatment using different designs of sand filters. Desalin. Water Treat. 2014, 52, 5237–5242. [Google Scholar]
  4. Antonopoulou, G.; Kirkou, A.; Stasinakis, A.S. Quantitative and qualitative greywater characterization in Greek households and investigation of their treatment using physicochemical methods. Sci. Total Environ. 2013, 454–455, 426–432. [Google Scholar] [CrossRef]
  5. Eriksson, E.; Auffarth, K.; Eilersen, A.M.; Henze, M.; Ledin, A. Household chemicals and personal care products as sources for xenobiotic organic compounds in grey wastewater. Water SA 2003, 29, 135–181. [Google Scholar] [CrossRef] [Green Version]
  6. Ghaitidak, D.M.; Yadav, K.D. Characteristics and treatment of greywater—A review. Environ. Sci. Pollut. Res. 2013, 20, 2795–2809. [Google Scholar] [CrossRef] [PubMed]
  7. Ansari, K.; Shrikhande, A.N. Feasibility on Grey Water Treatment by Electrocoagulation Process: A Review. Int. J. Emerg. Technol. 2019, 10, 92–99. [Google Scholar]
  8. Pidou, M.; Avery, L.; Stephenson, T.; Jeffrey, P.; Parsons, S.; Liu, S.; Memon, F.; Jeffreson, B. Chemical solutions for greywater recycling. Chemosphere 2008, 71, 147–155. [Google Scholar] [CrossRef]
  9. Bracher, G.H.; Carissimi, E.; Wolff, D.B.; Graepin, C.; Hubner, A.P. Optimization of an electrocoagulation-flotation system for domestic wastewater treatment and reuse. Environ. Technol. 2020, 42, 2669–2679. [Google Scholar] [CrossRef] [PubMed]
  10. Fountoulakis, M.S.; Markakis, N.; Petousi, I.; Manios, T. Science of the total environment single house on-site grey water treatment using a submerged membrane bioreactor for toilet flushing. Sci. Total Environ. 2016, 551–552, 706–711. [Google Scholar] [CrossRef]
  11. Cecconet, D.; Callegari, A.; Hlavínek, P.; Capodaglio, A.G. Membrane bioreactors for sustainable, fit-for-purpose greywater treatment: A critical review. Clean Technol. Environ. Policy 2019, 21, 745–762. [Google Scholar] [CrossRef]
  12. Sibel, B.; Turkay, O. Domestic greywater treatment by electrocoagulation using hybrid electrode combinations. J. Water Process Eng. 2016, 10, 56–66. [Google Scholar]
  13. Bote, M.E. Studies on electrode combination for COD removal from domestic wastewater using electrocoagulation. Heliyon 2021, 7, e08614. [Google Scholar] [CrossRef] [PubMed]
  14. Daghrir, R.; Drogui, P.; Blais, J.-F.; Guy, M. Hybrid process combining electrocoagulation and electro-oxidation processes for the treatment of restaurant wastewaters. J. Environ. Eng. 2012, 138. [Google Scholar] [CrossRef]
  15. Lin, C.J.; Lo, S.L.; Kuo, C.Y.; Wu, C.H. Pilot-scale electrocoagulation with bipolar aluminum electrodes for on-site domestic greywater reuse. J. Environ. Eng. 2005, 131, 3. [Google Scholar] [CrossRef]
  16. Othmani, A.; Kadier, A.; Singh, R.; Igwegb, C.A.; Bouzid, M.; Aquatar, M.O.; Khanday, W.; Bote, M.; Damiri, F.; Gökkuş, O.; et al. A comprehensive review on green perspectives of electrocoagulation integrated with advanced processes for effective pollutants removal from water environment. Environ. Res. 2022, 215, 114294. [Google Scholar] [CrossRef]
  17. Bajpai, M.; Katoch, S. Techno-economical optimization using Box-Behnken (BB) design for COD and Chloride reduction from Hospital wastewater by electro-coagulation. Water Environ. Res. 2020, 92, 2140–2154. [Google Scholar] [CrossRef]
  18. Igwegbe, C.A.; Onukwuli, O.D.; Ighalo, J.O. Comparative analysis on the electrochemical reduction of colour, COD and turbidity from municipal solid waste leachate using aluminium, iron and hybrid electrodes. Sustain. Water Resour. Manag. 2021, 7, 39. [Google Scholar] [CrossRef]
  19. Bote, M.E.; Desta, W.M. Removal of Turbidity from Domestic Wastewater Using Elec-trocoagulation: Optimization with Response Surface Methodology. Chem. Afr. 2022, 5, 123–134. [Google Scholar] [CrossRef]
  20. Esfandyari, Y.; Saeb, K.; Tavana, A.; Rahnavard, A.; Fahimi, F.G. Effective removal of cefazolin from hospital wastewater by the electrocoagulation process. Water Sci. Technol. 2019, 80, 2422–2429. [Google Scholar] [CrossRef]
  21. Rakhmania; Kamyab, H.; Yuzir, M.A.; Al-Qaim, F.F.; Purba, L.D.A.; Riyadi, F.A. Application of Box-Behnken design to mineralization and color removal of palm oil mill effluent by electrocoagulation process. Environ. Sci. Pollut. Res. Int. 2021, 1–13. [Google Scholar] [CrossRef] [PubMed]
  22. Ansari, K.; Shrikhande, A.N. Impact of Different Mode of Electrode Connection on Performance of Hybrid Electrocoagulation Unit Treating Greywater. In Recent Advancements in Civil Engineering; Springer: Singapore, 2022; Volume 172, pp. 527–538. [Google Scholar]
  23. APHA; AWWA. Standard Methods for Examination of Water and Wastewater, 22nd ed.; American Public Health Association: Washington, DC, USA, 2012; 1360p, ISBN 978-087553-013-0. [Google Scholar]
  24. Akula, L.; Oruganti, R.; Bhattacharyya, D.; Kurilla, K.D. Treatment of Marigold Flower Processing Wastewater Using a Sequential Biological-Electrochemical Process. Appl. Sci. Eng. Prog. 2021, 14, 525–542. [Google Scholar] [CrossRef]
  25. Chakawa, S.; Aziz, M. Investigating the Result of Current Density, Temperature, and Electrolyte Concentration on COD: Subtraction of Petroleum Refinery Wastewater Using Response Surface Methodology. Water 2021, 13, 835. [Google Scholar] [CrossRef]
  26. Elazzouzi, M.; Haboubi, K.; El Elyoubi, M.; Kasmi, A. Development of a novel electrocoagulation anode for real urban wastewater treatment: Experimental and modeling study to optimize operative conditions. Arab. J. Chem. 2021, 14, 102912. [Google Scholar] [CrossRef]
  27. Bajpai, M.; Katoch, S.S.; Singh, M. Optimization and economical study of electro-coagulation unit using CCD to treat real graywater and its reuse potential. Environ. Sci. Pollut. Res. 2020, 27, 42040–42050. [Google Scholar] [CrossRef]
  28. Kakoi, B.; Kaluli, J.W.; Ndiba, P.; Thiong, G. Optimization of Maerua Decumbent bio-coagulant in paint industry wastewater treatment with response surface methodology. J. Clean Prod. 2017, 164, 1124–1134. [Google Scholar] [CrossRef]
  29. Naghdali, Z.; Sahebi, S.; Ghanbari, R.; Mousazadeh, M.; Jamali, H.A. Chromium removal and water recycling from electroplating wastewater through direct osmosis: Modeling and optimization by response surface methodology. Environ. Health Eng. Manag. 2019, 6, 113–120. [Google Scholar] [CrossRef]
  30. Aleboyeh, A.; Daneshvar, N.; Kasiri, M.B. Optimization of CI Acid Red 14 azo dye removal by electrocoagulation batch process with response surface methodology. Process Intensif. 2008, 47, 827–832. [Google Scholar] [CrossRef]
  31. Merzouk, B.; Gourich, B.; Sekki, A.; Madani, K.; Chibane, M. Removal turbidity and separation of heavy metals using electrocoagulation-electroflotation technique: A case study. J. Hazard. Mater. 2009, 164, 215–222. [Google Scholar] [CrossRef]
  32. Mansoorian, H.J.; Mahvi, A.H.; Jafari, A.J. Removal of lead and zinc from battery industry wastewater using electrocoagulation process: Influence of direct and alternating current by using iron and stainless steel rod electrodes. Sep. Purif. Technol. 2014, 135, 165–175. [Google Scholar] [CrossRef]
  33. Kuokkanen, V.; Kuokkanen, T.; Rämö, J.; Lassi, U. Electrocoagulation treatment of peat bog drainage water containing humic substances. Water Res. 2015, 79, 79–87. [Google Scholar] [CrossRef] [PubMed]
  34. Eyvaz, M.; Gürbulak, E.; Kara, S.; Yüksel, E. Preventing of cathode passivation/deposition in electrochemical treatment methods—A case study on winery wastewater with electrocoagulation. In Modern Electrochemical Methods in Nano, Surface and Corrosion Science; IntechOpen: London, UK, 2014; Volume 1. [Google Scholar]
  35. Jadhav, M.V.; Mahajan, Y.S. Assessment of feasibility of natural coagulants in turbidity removal and modeling of coagulation process. Desalin. Water Treat. 2014, 52, 5812–5821. [Google Scholar] [CrossRef]
  36. Veli, S.; Arslan, A.; Bingöl, D. Application of response surface methodology to electroco-agulation treatment of hospital wastewater. Clean Soil Air Water 2016, 44, 1516–1522. [Google Scholar] [CrossRef]
  37. Kobya, M.; Akyol, A.; Demirbas, E.; Oncel, M.S. Removal of Arsenic from Drinking Water by Batch and Continuous Electrocoagulation Processes Using Hybrid Al-Fe Plate; Wiley: New York, NY, USA, 2013. [Google Scholar]
  38. Devikar, S.; Ansari, K.; Waghmare, C.; Bhokar, M. Domestic Greywater Treatment by Hybrid Electrocoagulation and Filtration Method in Continuous Mode. In Smart Technologies for Energy; Springer: Berlin/Heidelberg, Germany, 2022; Volume 1, pp. 211–218. [Google Scholar]
  39. Kobya, M.; Gengec, E.; Demirbas, E. Operating parameters and costs assessments of a real dye house wastewater effluent treated by a continuous electrocoagulation process. Chem. Eng. Proc. 2016, 101, 87–100. [Google Scholar] [CrossRef]
  40. Vakil, K.A.; Sharma, M.K.; Bhatia, A.; Kazmi, A.A.; Sarkar, S. Characterization of greywater in an Indian middle-class household and investigation of physicochemical 612 treatment using electrocoagulation. Sep. Purif. Technol. 2014, 130, 160–166. [Google Scholar]
  41. Ansari, K.; Khandeshwar, S.; Waghmare, C.; Mehboob, H.; Gupta, T.; Shrikhande, A.N.; Abbas, M. Experimental Evaluation of Industrial Mushroom Waste Substrate Using Hybrid Mechanism of Vermicomposting and Effective Microorganisms. Materials 2022, 15, 2963. [Google Scholar] [CrossRef]
  42. Jallouli, S.; Chouchene, K.; Ben Hmida, M.; Ksibi, M. Application of Sequential Combination of ElectroCoagulation/Electro-638 Oxidation and Adsorption for the Treatment of Hemodialysis Wastewater for Possible Reuse. Sustainability 2022, 14, 9597. [Google Scholar] [CrossRef]
  43. Villaseñor-Basulto, D.L.; Picos-Benítez, A.; Pacheco-Alvarez, M.; Pérez, T.; Bandala, E.R.; Peralta-Hernández, J.M. Tannery wastewater treatment using combined electrocoagulation and electro-Fenton processes. J. Environ. Chem. Eng. 2022, 10, 107290. [Google Scholar] [CrossRef]
  44. Gupta, T.; Ansari, K.; Lataye, D.; Kadu, M.; Khan, M.; Mubarak, N.; Garg, R.; Karri, R. Adsorption of Indigo Carmine Dye by Acacia nilotica sawdust activated carbon in fixed bed column. Sci. Rep. 2022, 12, 15522. [Google Scholar] [CrossRef]
  45. Rajaniemi, K.; Tuomikoski, S.; Lassi, U. Electrocoagulation Sludge Valorization—A Review. Resources 2021, 10, 127. [Google Scholar] [CrossRef]
  46. Aouni, A.; Fersi, C.; Ali, M.; Dhahbi, M. Treatment of textile wastewater by a hybrid electrocoagulation/nanofiltration process. J. Hazard. Mater. 2009, 168, 868–974. [Google Scholar] [CrossRef] [PubMed]
Figure 1. Systematic representation of the electrocoagulation process (EC).
Sustainability 14 15230 g001
Figure 2. (a) ECF schematics, and (b) Experimental setup.
Sustainability 14 15230 g002
Figure 3. Plot showing the actual versus predicted values of (a) COD, (b) TDSs, (c) chloride, (d) turbidity and (e) electrode consumption.
Sustainability 14 15230 g003
Figure 4. Chord Diagram showing the relation of R2, adjusted R2, and predicted R2 with different responses.
Sustainability 14 15230 g004
Figure 5. Three-dimensional surface and contour plot showing the effect of voltage and time on (a) COD, (b)TDSs, (c) chloride, (d) turbidity, (e) electrode consumption.
Sustainability 14 15230 g005aSustainability 14 15230 g005b
Figure 6. (a) Operational cost and energy consumption with respect to the voltage and (b) electrode consumption and sludge generation with respect to the voltage.
Sustainability 14 15230 g006
Figure 7. SEM and EDX microanalysis structure of the sludge generated during the ECF process at (a) 6 V, (b) 12 V, and (c) 24 V.
Sustainability 14 15230 g007
Figure 8. Sludge Characterization by the FTIR spectra with the different applied voltage.
Sustainability 14 15230 g008
Table 1. Influents of the greywater characteristics.
ParametersMinimumMaximumAverageStandard Deviation
pH6.48.97.71.4
Turbidity (NTU)36883612.6
TDSs (mg/L)200510205125
TSSs (mg/L)391908856
COD (mg/L)120380259126
Chloride (mg/L)10.95632.68.9
Table 2. The levels and range of the independent variables.
SymbolsIndependent VariablesUnits−10+1
AVoltageVolts61224
BTimeMin103060
CpHUnitless6.87.68.4
Table 3. Experimental and the predicted responses for the various parameter levels.
VoltageTimepHExp.Pred.Exp.Pred.Exp.Pred.Exp.Pred.Exp.Pred.
RunVoltsmin COD%TDS%Chloride%Turbidity%Electrode
Consumption mg/Lit
124608.394.293.1594.194.1589.389.3585.185.146.86.8
212307.688.288.4294.594.3493.493.5293.693.396.36.32
324106.892.592.5192.792.6492.592.5588.388.321.81.79
412307.688.688.4294.594.3493.593.5293.493.396.36.32
524606.891.291.2194.294.2494.894.7593.393.251.81.8
612607.688.388.4294.394.3493.293.1494.294.186.36.29
724108.485.385.2787.287.2588.288.1588.188.072.82.8
812307.688.488.4294.594.3493.593.5293.893.396.36.32
96608.486.386.2387.987.9487.187.0885.985.892.82.81
106606.883.783.6988.988.8493.393.3893.493.431.71.7
1112307.688.788.4294.294.3493.693.5293.693.392.46.32
126108.485.385.286.986.8686.98785.985.976.82.81
136307.687.687.7490.690.6292.492.2492.492.362.42.37
146106.893.893.8486.0286.0692.392.385.785.651.71.7
1512107.688.388.3792.892.8092.392.1991.391.286.32.29
1612307.688.488.4293.694.3493.493.5293.393.396.32.32
1712308.486.386.5590.990.9089.589.4287.987.836.82.78
1812307.688.688.4294.894.3493.493.5292.693.392.32.32
1912306.894.394.2592.892.8494.994.8290.890.845.71.7
2024307.686.686.6593.693.6393.493.3993.693.612.46.41
Table 4. Statistical regression equation for the various parameter levels.
ResponsesRegression ModelEquation
% Removal
(COD) (Y1)
+308.52650 + 0.041138 × A − 0.092807 × B − 52.85575 × C − 0.001271(A × B) + 0.048605(A × C) + 0.014749(B × C)
− 0.014429A2 − 0.000043B2 + 3.09322C2
(9)
% Removal
(TDSs) (Y2)
−156.71153 + 2.97382 × A + 0.314483 × B + 60.53911 × C
− 0.001313(A × B) − 0.21517(A × C) − 0.021178(B × C)
− 0.037728A2 − 0.001530B2 − 3.85102C2
(10)
% Removal (Chloride) (Y3)−13.27855 + 0.163546 × A + 0.210164 × B + 30.03592 × C + 0.001242(A × B) + 0.031250(A × C) − 0.012500(B × C)
− 0.012480 × A2 − 0.001586 × B2 − 2.19809 × C2
(11)
% Removal (Turbidity) (Y4)−290.37256 + 0.571890 × A + 0.953617 × B + 97.72627 × C
− 0.003163(A × B) − 0.019764(A × C) − 0.098269(B × C)
− 0.008583 × A2 − 0.001583 × B2 − 6.34378 × C2
(12)
Electrode Consumption (Y5)−10.40679 + 0.003984 × A +0.003903 × B +2.65941 × C + 3.65956(A × B) − 0.003622(A × C) − 0.000032 B × C) + 0.000855 × A2 − 0.000053 × B2 − 0.127872 × C2(13)
Table 5. ANOVA quadratic model on the various parameter levels.
CODTDSsChlorideTurbidityElectrode Consumption
SourceSum of Squaresp-ValueSum of Squaresp-ValueSum of Squaresp-ValueSum of Squaresp-ValueSum of Squaresp-ValueRemark
Model155.89<0.0001181.91<0.0001112.7<0.0001203.71<0.00012.85<0.000Significant
A-Voltage3.61<0.000120.87<0.00013.98<0.00012.310.00050.0040.0795
B-Time0.04740.25234.44<0.00013.22<0.000114.62<0.00013.00 × 10−80.9958
C-pH134.06<0.000124.54<0.000171.04<0.000137.67<0.00012.77<0.0001
AB0.67380.0010.71980.01690.6439<0.00014.17<0.00015.59 × 10−60.9433
AC10.000219.62<0.00010.41390.00020.16560.20760.00560.0443
BC0.70150.00091.450.00230.50390.000131.14<0.00013.38 × 10−60.9559
A22.88<0.000119.68<0.00012.15<0.00011.020.00750.01010.0113
B20.00180.81872.290.00052.46<0.00012.450.00040.00270.137
C210.78<0.000116.7<0.00015.44<0.000145.32<0.00010.01840.0019
Residual0.3214 0.8791 0.1341 0.9119 0.0105
Lack of Fit0.15310.94020.02410.99930.10070.12510.02360.99940.00220.9161Not Significant
Pure Error0.1683 0.855 0.0333 0.8883 0.0083
Cor Total156.21 182.79 112.83 204.62 2.86
Table 6. The model’s fit statistics and the ANOVA findings.
ParameterCOD RemovalTDS RemovalChloride RemovalTurbidity RemovalElectrode Consumption
Model F-value538.86222.91934248.21301.35
Adequate precision71.7539.4795.4542.3348.41
C.V. %0.20190.32370.12580.33251.41
Table 7. Optimization conditions for 6 to 24 volts.
NumberVoltageTimepHRemoval (%COD)Removal (%TDS)Removal (%Chloride)Removal (%Turbidity)Electrode ConsumptionDesirability
16.0055.007.80087.11990.76191.0792.5921.4840.644
212.00057.457.792.00094.26094.79694.6511.8750.859
324.054.507.90094.35194.42194.88893.1184.50.495
Publisher’s Note: MDPI stays neutral with regard to jurisdictional claims in published maps and institutional affiliations.

