Article

Research on the Impacts of Vehicle Type on Car-Following Behavior, Fuel Consumption and Exhaust Emission in the V2X Environment

1
College of Electromechanical Engineering, Qingdao University of Science and Technology, Qingdao 266100, China
2
Collaborative Innovation Center for Intelligent Green Manufacturing Technology and Equipment of Shandong Province, Qingdao 266100, China
*
Author to whom correspondence should be addressed.
Sustainability 2022, 14(22), 15231; https://doi.org/10.3390/su142215231
Submission received: 27 October 2022 / Revised: 8 November 2022 / Accepted: 12 November 2022 / Published: 16 November 2022

Abstract

:
The type of vehicles in realistic traffic systems are not homogeneous. Impacts of the preceding vehicle’s type on the car-following behavior, fuel consumption and exhaust emissions are still unclear. This paper presents a study on the impacts of two types of preceding vehicles, heavy vehicles and new energy vehicles, on car-following behavior, traffic flow characteristics, fuel consumption and exhaust emissions. Firstly, an extended car-following model was proposed by incorporating the influence of the preceding vehicle’s type. Secondly, impacts of the preceding vehicle’s type on platoon stability were analyzed by applying linear stability theory. Finally, numerical simulations were carried out to analyze impacts of the preceding vehicles’ type on the characteristics of the car-following platoon, traffic flow operation, and vehicle’s fuel consumption and exhaust emissions. The results reveal that, compared with the normal preceding vehicle, there are negative impacts of the heavy and new-energy preceding vehicles on the platoon stability, traffic flow operation, and vehicle’s fuel consumption and exhaust emissions, and these impacts are related to the corresponding sensitivity parameters and the penetration percentages of the two types of preceding vehicle. The research results of this paper can provide a reference for understanding car-following behavior and traffic-flow characteristics affected by the type of preceding vehicles in the V2X environment.

1. Introduction

Traffic problems, such as congestion, fuel consumption and exhaust emission, have significant negative impacts on the operation and sustainable development of our society. Car-following is the driving behavior where a vehicle follows its preceding vehicle and maintains the current lane, which describes the vehicles’ longitudinal movement. It is the most basic driving behavior, and the research on car-following behavior is the theoretical basis of traffic-flow management, energy consumption estimation, vehicle control scheme, etc. Dozens of car-following models have been proposed, and they form one of the core parts of traffic-flow theory [1,2,3,4].
Recently, the development and applications of Vehicle-to-Everything (V2X) technologies have had a profound impact on the operation of transportation systems, which have prompted the exploration of car-following behavior. For vehicles, the application of V2X technologies has greatly enhanced their information perception and application capabilities. Information is the basis of behavioral decision-making. Enhanced information perception and application capabilities enable vehicles to access various information, parts of which were difficult to obtain in the past. Based on the information, the vehicles’ car-following behavior will be changed or optimized. In order to describe the car-following behavior under such conditions, a series of improved or extended models were proposed [5,6,7,8,9,10,11,12,13,14,15,16,17]. In terms of other vehicles’ motion-state information, Li et al., proposed an extended Full Velocity Difference (FVD) model to take into account the information about headway, velocity and acceleration of the arbitrary number of preceding vehicles [5]. After that, the average velocity [6], average headway [7] and average optimal velocity [8] of the arbitrary number of preceding vehicles were, respectively considered, and extended models were proposed. In addition to the vehicles in the current lane, the motion-state information of vehicles in adjacent lanes can also be obtained by the vehicle. Considering this, Yu et al., constructed an extended model to consider the velocity of vehicles in the adjacent lane [9]. Then, Gao et al., further extended the model to take into account the velocity of vehicles in all adjacent lanes [10]. Recently, Han et al., proposed a Generalized Preceding Vehicle (GPV) model, in which the motion state of the preceding vehicle along with its preceding vehicle, the preceding vehicle in the left adjacent lane, and the preceding vehicle in the right adjacent lane were incorporated [11]. In terms of traffic-state information, Tang et al., proposed an extended FVD model by resetting the parameters and introducing a disturbance item [12]. Using this extended model, Tang et al., analyzed the impacts of big disturbance (represented by an accident) on car-following behavior in the V2X environment. Later, they further extended the research scenarios to two lanes [13]. Based on similar means, Tang et al., formed an extended FVD model and used this model to analyze the impacts of green-light remaining time on car-following behavior [14]. Zhao et al., constructed an extended-partition FVD model and employed the model to explore impacts of the signal-control scheme on car-following behavior [15]. Soon after, the impacts of speed guidance information on the car-following behavior of vehicles in conflicting streams in the non-signalized intersection were studied by Zhao et al. [16]. Additionally, Ci et al., explored the impacts of speed guidance information on car-following behavior in the signalized intersection [17].
The aforementioned models show great potential to describe the car-following behavior affected by various information in the V2X environment. However, in these models, vehicles in the system were assumed to be homogeneous, which is inconsistent with the actual situation. Actual traffic situations are composed of diverse types of vehicles. According to the traffic flow theory, the car-following behavior and the operation, along with stability characteristics of traffic flow will be affected due to the penetration of various types of vehicles, especially the heavy ones. Peeta et al., recognized the difference in car-following behavior when the subject vehicle was following a normal or heavy vehicle [18]. Aghabayk et al., explored the difference in car-following behavior with the headway index between various vehicle pairs [19,20]. Based on the trajectory data of vehicles of various types manufactured by different brands, the difference in car-following behavior with the desired velocity and acceleration index was recognized and analyzed by Rakha et al. [21]. Utilizing aerial data, Ossen and Hoogendoorn analyzed the characteristics of heavy vehicles’ car-following behavior [22]. Other field data sets, respectively collected in India [23,24,25], Japan [26] and Australia [27] were employed to recognize and analyze the difference in car-following behavior between various types of vehicle pairs. Additionally, the questionnaire investigation method was employed by Kong et al., to study the impacts of trucks on the car-following behavior of normal vehicle drivers [28]. The results suggest that the normal vehicle’s driver will take a larger headway and lower velocity when following a truck instead of a normal vehicle. Based on the aforementioned recognition and analysis results, extended car-following models, in which impacts of the preceding vehicle’s type were incorporated, were proposed [29,30,31]. The results reveal that these models can better fit the actual car-following behavior with consideration of the impacts of the preceding vehicle’s type.
In the V2X environment, it is simple to obtain the type of preceding vehicle by utilizing onboard sensors or other V2X devices [32,33,34]. Thus, it is necessary to incorporate the impacts of the preceding vehicle’s type when modeling car-following behavior in a V2X environment. Compared with the traditional traffic environment, there are also new penetration conditions of the preceding vehicle’s type in the V2X environment. With the increasingly urgent energy situation and stringent emission laws in various countries, new energy vehicles, represented by electric vehicles and plug-in hybrid vehicles, are penetrating the traffic system more and more. Compared with traditional vehicles, there is no doubt that these new energy vehicles are better for the environment. As another type of vehicle, the penetration percentages of new energy vehicles will also affect car-following behavior [35,36,37]. However, in these studies, efforts were devoted to modeling the subject vehicle’s car-following behavior when it is a new energy vehicle. To date, very few efforts have been undertaken to model the subject vehicle’s car-following behavior when its preceding vehicle is a new energy vehicle. Thus, it is still an interesting topic worthy of discussion that the impacts of the penetration of these new energy vehicles with different percentages on the car-following behavior, and further on traffic flow, energy consumption and exhaust emission.
The objective of this study is to analyze the traffic flow characteristics, fuel consumption and exhaust emission affected by the preceding vehicle’s type. To achieve this, an extended model that incorporates the impacts of the preceding vehicle’s type including the new energy vehicle is proposed, and theoretical analysis and numerical simulation are employed in the analysis. The results of this paper can provide a reference for answering the following questions:
  • The impacts of new energy and other types of preceding vehicles on car-following behavior;
  • The impacts of new energy and other types of preceding vehicles on traffic flow;
  • The impacts of new energy and other types of preceding vehicles on fuel consumption and exhaust emission.
The structure this paper, excluding the present introduction, is as follows: Section Two: Car-following Model; Section Three: Platoon Stability Analysis; Section Four: Numerical Simulation; Section Five: Discussion and Section Six: Conclusions.

2. Car-Following Model

2.1. Car-Following Behavior Characteristics Analysis

In previous studies, it has been confirmed that there are differences in the car-following of the subject vehicle when the preceding vehicle’s type is different. In general, according to the physical and dynamic characteristics, the types of preceding vehicle can be divided into normal vehicles and heavy vehicles. Recently, the proportion of new energy vehicles has been increasing. There are significant differences in the dynamic characteristics between normal vehicles and new energy vehicles, which influences the vehicle’s driving behavior. Thus, new energy vehicles should be listed as a separate type of vehicle when modeling car-following behavior. According to previous studies [18,22,26,37,38,39], the car-following behavior characteristics of the subject vehicle when the preceding vehicle is a heavy vehicle or a new energy vehicle are summarized as shown in the following contents (to be concise, heavy vehicles are denoted as H-V, and new energy vehicles are denoted as NE-V).
  • The preceding vehicle is an H-V.
H-Vs will show significantly different driving characteristics from normal vehicles due to different physical and dynamic characteristics, even without considering the restrictions of traffic laws and rules. According to the previous research [18,22,26], due to large inertia and low power, H-Vs tend to adopt stable and conservative driving strategies and take slower actions when the driving state needs to be changed. To be specific, H-Vs tend to take larger headway, lower relative velocity, and lower acceleration/deceleration. These characteristics of H-Vs influence the vehicle behind them and make it take car-following behavior which is different from that when following a normal vehicle. When the preceding vehicle is a H-V, the subject vehicle will take larger headway, lower acceleration/deceleration, and higher action delay.
  • The preceding vehicle is NE-V.
The proportion of NE-Vs has been increasing in the past few years. The changes in energy form not only create better exhaust emission performance for NE-Vs themselves, but also significantly influence their dynamic characteristics. Whether plug-in hybrid vehicles or electric vehicles, the most obvious difference between NE-Vs and traditional vehicles lies in their driving form (i.e., the addition of an electric motor). Compared to the internal combustion engine, there are advantages to the electric motor such as greater torque and faster dynamic response, which are reflected in the differences in the vehicle’s accelerating process. Additionally, to improve energy utilization, the kinetic energy recovery system is universally applicated in NE-Vs. Parts of the NE-Vs adopt the single-pedal control mode, which makes these vehicles instantly decelerate after the driver releases the pedal out of the acceleration range. These features are reflected in the decelerating process. The aforementioned features of NE-Vs influence their behind vehicle’s car-following behavior [37,38,39]. Specifically, due to the different energy form and dynamic characteristics, the subject vehicle will present a slower response, lower acceleration/deceleration, and thus, larger headway.
To sum up, compared with the normal preceding vehicles which are adopted in most car-following models, the subject vehicle will show different car-following behavior, which reflects in the indexes including velocity, acceleration, headway, and time to act, when the preceding vehicle is H-V or NE-V.
Although there are several studies in which the traffic flow has been explored from different perspectives [40,41,42,43,44,45,46,47,48,49], there is no research incorporating the aforementioned impacts of H-Vs and NE-Vs, and this study proposes a car-following model that considers these impacts.

2.2. Modeling Car-Following Behavior

A general form of the car-following model can be written as [50]
x ¨ = f s t i v n , Δ x n , Δ v n
where x ¨ is the acceleration of the subject vehicle and f s t i is the stimulus function. It is described in Equation (1) that the car-following behavior is the result of multiple factors, including velocity v n , headway Δ x n and relative velocity Δ v n .
Based on the above general form, we further proposed a general form of the car-following model in the V2X environment [34], which is
x ¨ = f X x n , m i , V v n , m i , a n , m i , Z n , m i ,
Applying Equation (2), the extended car-following model to incorporate the preceding vehicle’s type can be established based on the analysis results in Section 2.1. The model expression can be written as
x ¨ = f Δ x n , Δ v n , a n + 1
The first-order differential form of Equation (3) is
d x n t + τ d t = V Δ x n , Δ v n , a n + 1
A linearized form of Equation (4) is
V Δ x n , Δ v n , a n + 1 = V * Δ x n , v n + λ Δ v n + η a n + 1 t + τ
Applying the first-order and second-order Taylor expansion to Equation (5), one can obtain
d v n t d t = a V * ( Δ x n , v n ) v n t + λ Δ v n + η a n + 1 t τ d
where v n equals to v n t , Δ x n equals to Δ x n t , Δ v n equals to Δ v n t ; v n t , Δ x n t and Δ v n t are, respectively, the velocity of the subject vehicle, headway between the subject vehicle and its preceding vehicle and the relative velocity between the subject vehicle and its preceding vehicle; a n + 1 is the preceding vehicle’s acceleration; τ d is the delay item, which represents the time for the subject vehicle to act after its preceding vehicle altered its driving state; a , λ and η are the sensitivity parameters to the corresponding item and V * · is the optimal velocity function.
Helbing’s optimal velocity function [51] is extended to make it suitable for this research, and the extended optimal velocity function is
V * ( Δ x n , v n ) = v max 2 tanh T v n t Δ x n t h c + tanh h c
T v n t = v n t / θ κ
where v max is the maximum velocity of the vehicle; h c is the length of the vehicle; θ is the scaling item about velocity and κ is an adjustment parameter.
The core of the optimal velocity function is a hyperbolic tangent function which has vital features:
(1)
There is an inflection point at Δ x n = h c .
(2)
V Δ x n 0 , when Δ x n 0 .
(3)
V Δ x n v max , when Δ x n .
These features enable the optimal velocity function to accurately describe car-following behavior:
(1)
Drivers avoid the collision, and the following velocity depends on the headway.
(2)
Drivers will pursue higher velocity when conditions permit, but there is an upper limit of velocity due to restrictions of road or vehicle physical characteristics.
Additionally, the optimal velocity function also ensures the car-following model can be employed to analyze the platoon stability and reproduce the stop-and-go along with other nonlinear traffic phenomena in the simulation.
Submitting Equations (7) and (8) into Equation (6), the expression of our model can be rewritten as
d v n t d t = a v max 2 tanh v n t / θ κ Δ x n t h c + tanh h c v n t + λ Δ v n + η a n + 1 t τ d

3. Platoon Stability Analysis

To explore the impact of the preceding vehicle’s type on platoon stability in the V2X environment, linear stability analysis is conducted based on the perturbation method [51,52,53,54]. Assuming that all vehicles in the system are in the same stable state, which means they maintain the same headway h and velocity V h , at the initial moment, the position of the vehicle n can be expressed as follows
x n 0 t = h n + V * h t
where h = L / N is the headway; L is the total length of the road; N is the total number of the vehicles and V * h is the optimal velocity.
Exerting a small disturbance y n ( t ) , then the position of the vehicle n changed as
x n t = x n 0 t + y n ( t )
Submitting Equation (11) into (10), one can obtain that
x n t = h n + V * h t + y n ( t )
Submitting Equations (11) and (12) into Equation (6) and linearizing it, the model’s expression can be rewritten as
d 2 y n t d t 2 = a V * ( h ) Δ y n t d y n t d t + λ d Δ y n t d t + η d 2 y n + 1 t τ d d t 2
where V * ( h ) = d V * ( Δ x n , v n ) / d Δ x n Δ x n = h .
Applying the disturbance item y n ( t ) Fourier expansion y n ( t ) = A e i k n + z t , we can obtain the expression about the complex eigenvalue z, which is
d 2 y n t d t 2 = a V * ( h ) Δ y n t d y n t d t + λ d Δ y n t d t + η d 2 y n + 1 t τ d d t 2
According to Equation (14), one can obtain that z is of i k and z 0 if i k 0 . Thus, we adopt the long wave expansion z = z 1 i k + z 2 i k 2 and submit it into Equation (14). The result is
z 1 = V * ( h )
z 2 = z 1 a λ + η z 1 z 1 + 1 2 V * ( h ) z 1 2 τ d
According to the stability theory, the uniformly stable-state traffic flow will become unstable when z 2 < 0 and maintain stable when z 2 > 0 . Therefore, the stability condition is
a < 2 λ + η z 1 z 1 2 z 1 τ d 1
According to Equation (17), the neutral stability curves in the headway-sensitivity phase space can be obtained as shown in Figure 1.
From Figure 1, the headway-sensitivity phase space is divided by the neutral stability curve into two regions. The regions above the neutral stability curve are stable ones, and the ones below the neutral stability curve are unstable regions. In the stable regions, the vehicle platoon can resist the disturbance and maintain a stable state. In the unstable regions, the vehicle platoon cannot resist the disturbance and evolute to an unstable state. Under such conditions, stop-and-go phenomenon, traffic jams, and density waves may emerge, which means that the vehicle platoon’s operation deteriorates significantly. From Figure 1a, the neutral stability curve sinks when the value of η is getting lower. From Figure 1b, the neutral stability curve sinks when the value of τ d is getting lower.

4. Numerical Simulation

All parts of the simulation were carried out in MATLAB (Ver. 9.11).

4.1. Car-Following Behavior Characteristics

Virtual Scenario

Applying periodic boundary conditions, there are 100 vehicles that are driving on the road under a stable state, which means all vehicles are driving at their optimal velocity V h and headway h = 10 m. At t = 100 s, a disturbance with a scale that equals the length of the vehicle h c is exerted into the vehicle platoon. Then, the disturbance propagates and evolutes in the platoon. The propagation and evolution results are shown in Figure 2, which can represent the impacts of the preceding vehicle’s type on the vehicle platoon’s operation characteristics when it is at the car-following state.
From Figure 2, with the increase of the sensitivity parameter η and response delay τ d , the platoon’s operation increasingly deteriorates, affected by the disturbance. According to Figure 2a–c, due to the type of preceding vehicle being changed from a normal vehicle to an H-V or a NE-V, the platoon’s stability decreases. Additionally, this kind of negative impact enlarges with the increase of the sensitivity parameter’s value η . According to Figure 2d–f, due to the change in the preceding vehicle’s type, there is a response delay τ d , which deteriorates the operation of the vehicle platoon. τ d makes the platoon operate away from the optimal state, and this kind of impact is eventually reflected in the vehicle platoon’s operation characteristics. To be specific, the negative impacts of τ d on the stability of the platoon’s operation will enlarge with the increase of τ d value. Compared Figure 2a–c with Figure 2d–f, one can obtain that the response delay has a greater impact on the platoon’s operation stability.

4.2. Traffic Flow Characteristics

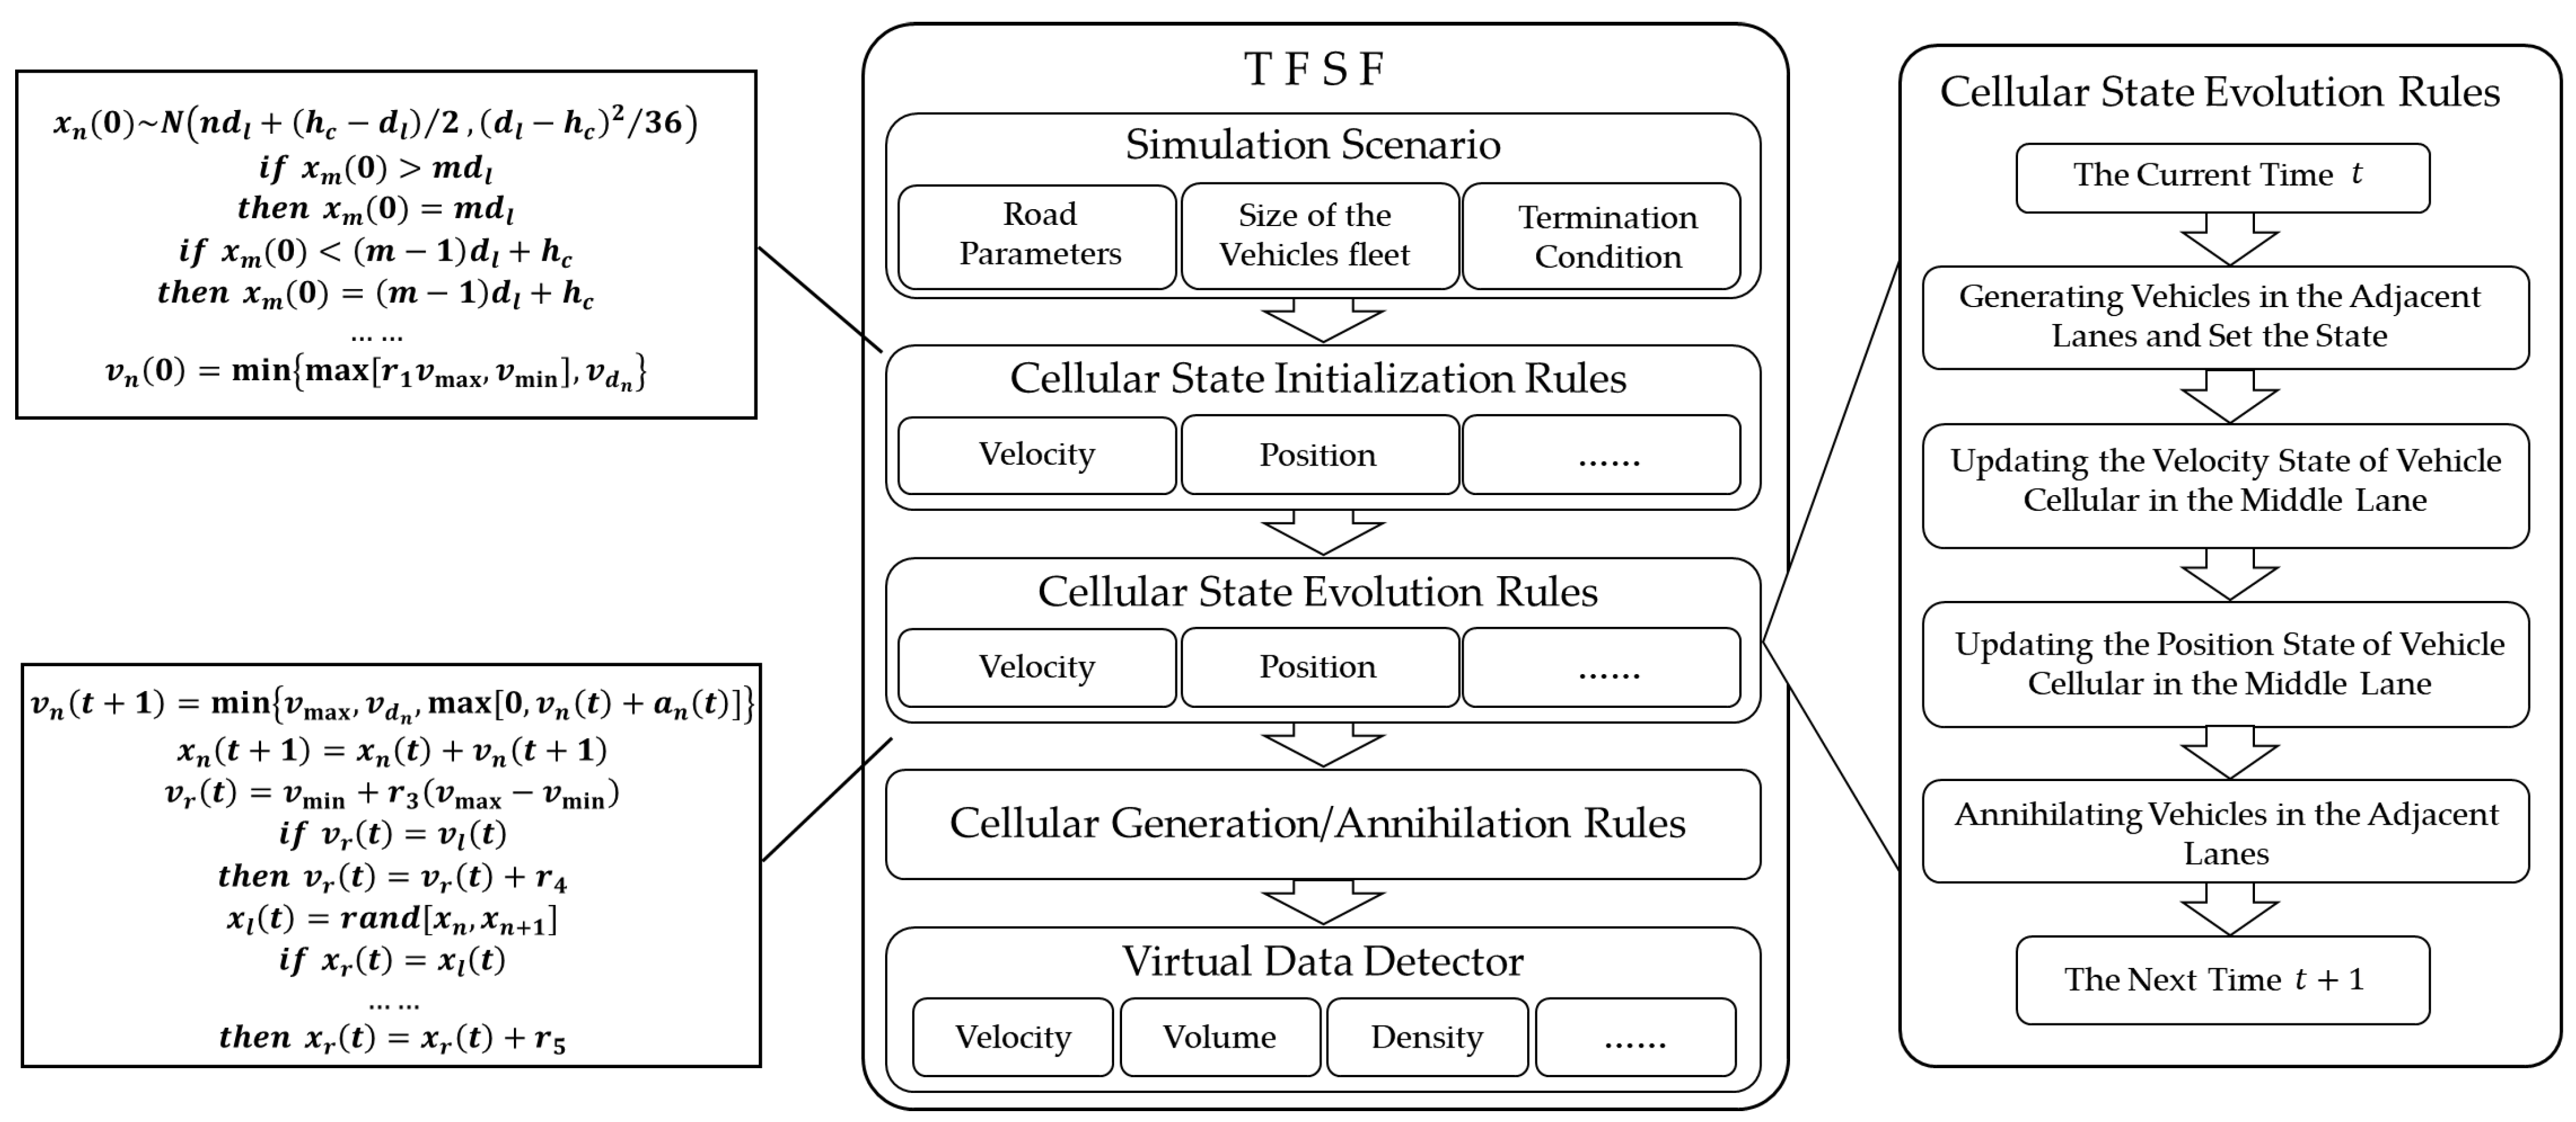
The macro characteristics of traffic flow are formed by the vehicle’s car-following behavior, which is at the micro-level. There are impacts of NE-Vs and other types of preceding vehicle, which makes the subject vehicle’s car-following behavior different from that it exhibits when the preceding vehicle’s type is normal. These micro-behavioral changes will eventually reflect in the macro-characteristics of traffic flow. There are advantages of the cellular automata (CA) model in the simulation of traffic flow. However, there are some defects in the previous CA model used in traffic flow simulation, such as discretization and isolation from the car-following models. To deal with these, we proposed a traffic-flow simulation framework (TFSF) by combining the continuous CA model and a car-following model [55]. The main body of TFSF is shown in Figure 3.
Employing TFSF, the traffic flow affected by new energy and heavy type preceding vehicles with different penetration percentages is simulated. In the simulation, Equation (9) is used as the acceleration calculation method of TFSF. The virtual scenario is set as follows:

Virtual Scenario

The boundary condition is periodic, and the velocity upper limit is set as v max = 100 km/h. The total length of the road is L = 2000 m, and the simulation lasts T = 4000 s. Other items of the virtual scenario are equal to that in [55]. By recording the total number of vehicles on the road as N , one can obtain that
v f = v ¯ k = L / N q = v f k
where v f is the traffic flow velocity, and v ¯ is the average velocity of all vehicles on the road; k is the traffic flow density, which is employed to be the control item in this simulation; q is the traffic flow volume, which is employed to be a performance indicator of traffic flow.
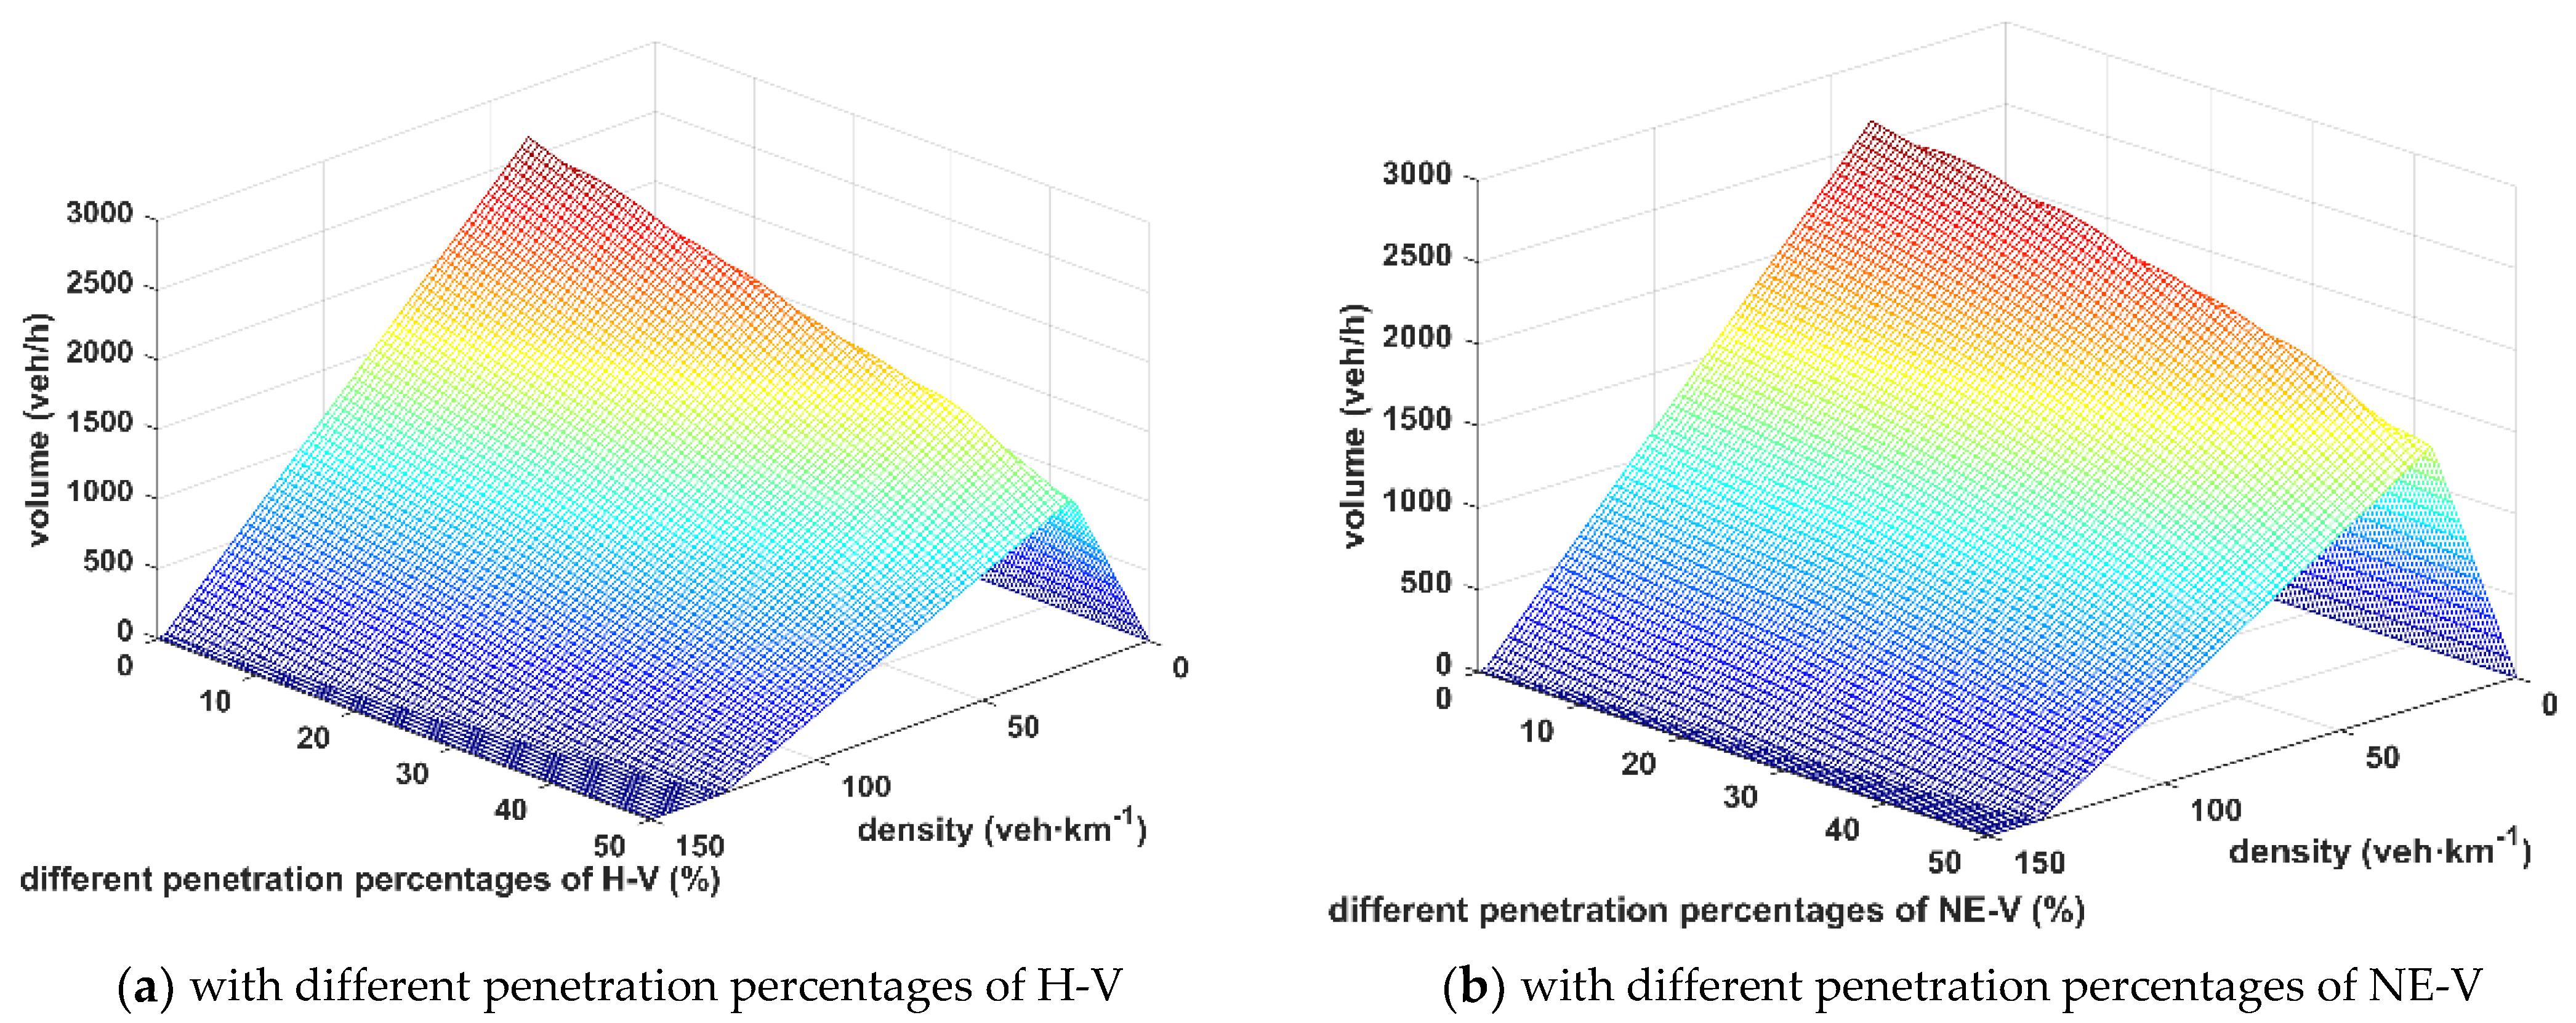
The operation characteristics of traffic flow affected by various types of preceding vehicles can be obtained through simulation by adjusting the control item and penetration percentages of the preceding vehicles, which are shown in Figure 4.
From Figure 4, in general, with the increase of the penetration percentages of H-Vs and NE-Vs, the maximum volume of traffic flow that the traffic system can achieve under the same density conditions gradually decreases. Specifically, from Figure 4a, one can obtain that when the penetration percentage of H-Vs is 0% (i.e., the type of vehicles in the system is uniform and all are normal vehicles), the maximum volume of traffic flow is 2648 veh/h. With the increase of the penetration percentages of H-Vs, the maximum volume surface gradually sinks, indicating that the maximum volume that the traffic system can achieve under the same density condition gradually decreases. When the penetration percentages of H-Vs reached 50% (i.e., all preceding vehicles of the subject vehicles are H-Vs), the volume of traffic flow reached its minimum value, which is 1217 veh/h. From Figure 4b, when the penetration percentage of NE-Vs is 0%, the volume of traffic flow achieved its maximum value, which equals to that of H-Vs’ penetration percentage is 0%. Additionally, the traffic flow reached its minimum volume, 1564 veh/h, when the penetration percentage of NE-Vs is 50%.
From Figure 4, we can also obtain that the traffic flow would achieve the maximum volume under lower density with the increase of penetration percentages of H-Vs and NE-Vs. Moreover, the traffic flow would reach the block state under lower density with the increase of penetration percentages of H-Vs and NE-Vs.

4.3. Fuel Consumption and Exhaust Emission

It is very difficult to directly measure the fuel consumption and exhaust emission of the vehicle platoon. To deal with this, Ahn proposed a fuel consumption and exhaust emission calculation model (the VT-Micro model) [56], which is
ln ( M O E e ) = i = 0 3 j = 0 3 K i , j e × v i × d v d t j
where the M O E e is the instantaneous rate of fuel consumption or emission of the vehicle n ; i is the velocity power of the vehicle n ; j is the acceleration power of the vehicle n and K i , j e is the regression coefficient. Applying different values of the regression coefficient, Equation (2) can be used to estimate the fuel consumption or exhaust emission of CO/HC/NOx.
The vehicle platoon’s fuel consumption or exhaust emission under various conditions can be obtained by combining the VT-Micro model and car-following model with the utilization of numerical simulation [42,57,58]. The value of parameters in Equation (19) for calculating different items is shown in Table 1.

Virtual Scenario

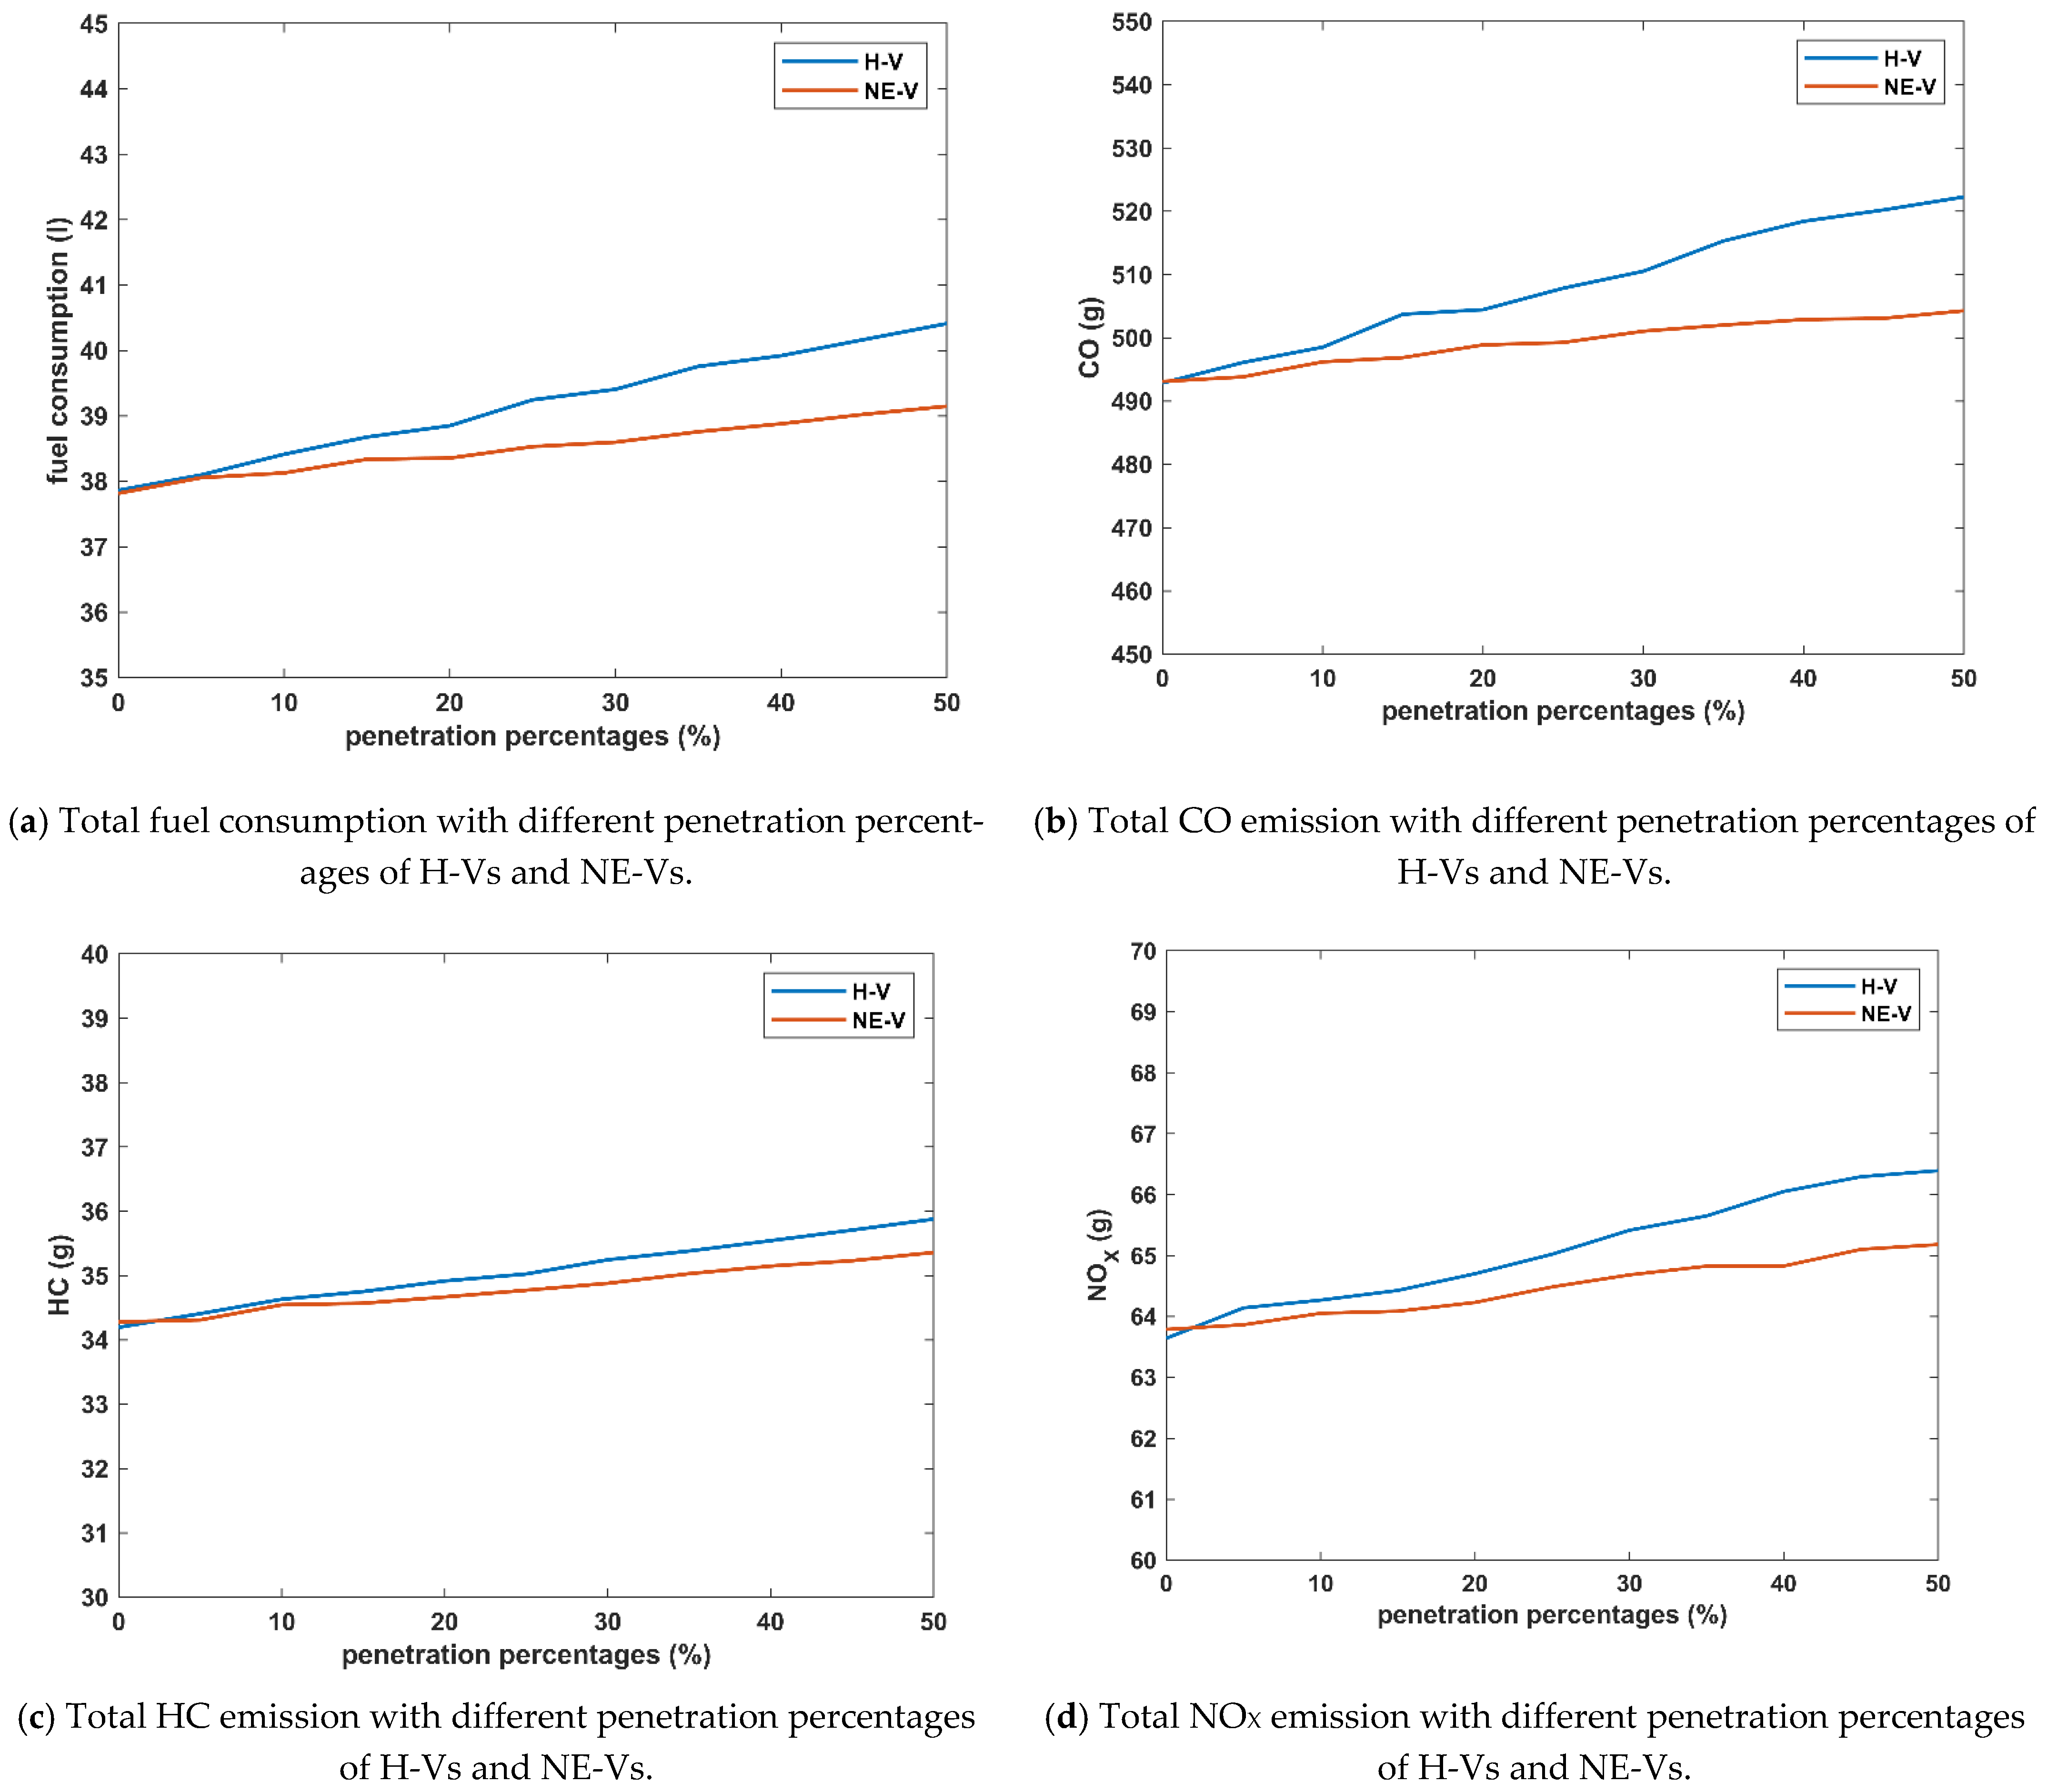
There is a one-way, single-lane highway with a length of 20 km. In the middle of the headway, there is a signalized intersection. On the side of the intersection entrance, there is a velocity limit change point A, which is 5 km away from the road starting point. On the side of the intersection exit, there is another velocity limit change point B, which is 15 km away from the road starting point. At points A and B, the velocity limit changes from 50 km/h to 100 km/h. At the intersection, the green light and red light alternately last for 1 min, and there is no yellow light. The velocity limit in the intersection is 20 km/h. The simulation results are shown in Table 2 and Figure 5.
According to Table 2 and Figure 5, the penetration of H-Vs and NE-Vs will affect their behind-vehicle’s car-following behavior and further influence the fuel consumption and exhaust emissions of these vehicles. Additionally, these impacts of the penetration of these two types of vehicles enhance with the increase of the penetration percentages of these vehicles. To be specific, when the penetration percentages are 50%, the fuel consumption and exhaust emissions reach their maximum values. Additionally, the impacts caused by the per-percentage increase of H-Vs are more significant than that of NE-Vs.

5. Discussion

To ensure the sustainable development of our society, it is necessary to enhance the traffic flow, ease traffic congestion and reduce fuel consumption along with exhaust emission. Car-following models are the theoretical basis for simulating traffic flow and estimating vehicles’ fuel consumption and exhaust emissions. In most of the previous car-following models, the type of vehicles is assumed to be homogeneous, which is inconsistent with reality. Some studies’ results reveal the subject vehicle will show different driving characteristics when following a H-V instead of a normal preceding vehicle [18,19,20,21,22,23,24,25,26,27,28]. Recently, NE-Vs, represented by the electric vehicle and the plug-in hybrid vehicle, are in large-scale applications. Due to the differences in dynamic architecture, the driving characteristics of NE-Vs are not the same as normal vehicles, which affects theirs behind-vehicles’ car-following behavior [37,38,39]. The contribution of NE-Vs to energy consumption and environmental protection has been proven. However, up to this point, there is no conclusion about the impacts of the penetration of NE-Vs on the car-following behavior of their behind-vehicles, and due to these impacts, the changes in fuel consumption and exhaust emissions of these vehicles. Accordingly, this paper explored the impacts of vehicle type, including NE-Vs and H-Vs, on car-following behavior, fuel consumption, and exhaust emissions through a “modeling-theoretical analysis-numerical simulation”. First, based on the analysis results in previous studies about the car-following characteristics affected by H-Vs and NE-Vs, an extended car-following model was proposed incorporating these characteristics. Second, applying the linear stability theory, the neutral stability condition was derived, and the platoon stability was discussed. Third, employing numerical simulation, the vehicle platoon’s car-following, traffic-flow operation and fuel consumption and exhaust emissions were simulated based on various constructed virtual scenarios. The results suggest that, compared with normal vehicles being the preceding vehicle of the subject vehicle, there are negative impacts of H-Vs and NE-Vs on the vehicle platoon’s car-following, traffic-flow operation, and fuel consumption and exhaust emissions, and these impacts will become more significant with the increase of the penetration percentages of H-Vs and NE-Vs.
Applying the linear stability theory, the stability condition of the vehicle platoon, which contains normal vehicles and H-Vs or NE-Vs, was derived, and, based on this, the neutral curves in the headway-sensitivity phase space were obtained. Then, the impacts of the penetration of H-Vs and NE-Vs as the preceding vehicle on subject vehicle platoon stability were analyzed. From Equation (17) and Figure 1, with the increase of η and τ d , the neutral curves continue to sink, which means that platoon stability is declining. η and τ d are respectively employed to represent the major impacts of H-Vs and NE-Vs as the preceding vehicle on the car-following behavior of the subject vehicle. The increase of η and τ d represents that the subject vehicle is more sensitive to the impacts of H-Vs and NE-Vs, and thus deviation of car-following behavior is greater, which will eventually cause the stability to decrease. Employing the numerical simulation means the vehicle platoon’s car-following, traffic-flow operation, and fuel consumption and exhaust emissions when the subject vehicle’s preceding vehicle is an H-V or a NE-V were simulated and analyzed. From Figure 2, the penetration of H-Vs and NE-Vs as the preceding vehicle will negatively affect the vehicle platoon’s car-following behavior. When dealing with the disturbance with the same scale, the deviation of the vehicle platoon’s operation from the ideal state is enlarging with the increase of η and τ d . These kinds of negative impacts are not only at the platoon level but also at the macro-traffic-flow level, which is consistent with the results of theoretical analysis. From Figure 4, the penetration of H-Vs and NE-Vs will lead to the deterioration of traffic flow operation, and these impacts will enlarge with the increase of the penetration percentages of H-Vs and NE-Vs. From Table 2 and Figure 4, the above negative impacts are also present in the aspect of vehicles’ fuel consumption and exhaust emissions, and these negative impacts also enlarge with the increase of penetration percentages. This result is consistent with that of the theoretical analysis and other numerical simulations.
It is noteworthy that as NE-Vs penetrate the system as the preceding vehicle, they affect the car-following behavior and the operation of traffic flow in a similar way as an H-V. However, compared with Figure 4a,b, the curvature of the corresponding color band (representing a volume value interval) in (a) is greater, which means that the negative impacts of H-Vs are more significant. This is also reflected in the overall effect. When the penetration percentages reach the maximum, the impacts of NE-Vs on the system are much less than that of H-Vs, and the deviation caused by NE-Vs of the system operation state from the ideal state is much less than that caused by H-Vs. This is consistent with the driving experience and previous research results, which confirmed that the performance of our proposed model is qualified when simulating the car-following behavior and traffic flow characteristics when the preceding vehicle of the subject vehicle is an H-V or a NE-V. Additionally, one issue needs to be pointed out. In Figure 4a, when the penetration percentages of H-Vs increase from 0% to non-0%, there is a rapid decline in the maximum volume of traffic flow. This is because, compared with a normal vehicle as the preceding vehicle of the subject vehicle in the ideal situation, the behavior of an H-V is significantly different, and the resulting impact is much greater. Thus, their penetration constitutes a disturbance, which leads to this phenomenon. The simulation of traffic flow characteristics is discussed as an example, but it should be pointed out that there are similar laws in those aforementioned impact characteristics.
In this paper, an extended car-following model was proposed by incorporating the behavior characteristics of the subject vehicle when following H-Vs and NE-Vs. Based on this model, the impacts of H-Vs and NE-Vs as preceding vehicles on platoon stability, platoon car-following behavior, traffic flow operation, and fuel consumption and exhaust emissions were explored with the utilization of theoretical analysis and numerical simulations. The research results can provide a new perspective and reference for understanding the impacts of the penetration of H-Vs and NE-Vs. However, the research can still be improved due to various limitations, which are:
  • The influence of model parameters’ value has been discussed in theoretical analysis and numerical simulation. However, calibration using field data is not carried out. Considering the absence of suitable field data and the difficulty in building such a data set, this limitation will be dealt with in one of our planned works.
  • There are parameters to represent different drivers’ sensitivity to the impact of H-Vs and NE-Vs in the extended car-following model proposed in this paper. Humans are typically a complex, heterogeneous groups, and various drivers’ reaction to the penetration of H-Vs and NE-Vs needs to be further explored.
  • The VT-Micro model proposed by Ahn was employed to calculate the vehicles’ fuel consumption and exhaust emissions. Although this model has been widely used, and the performance has been acknowledged, there will be a deviation between the calculated results and the real value due to the diverse vehicles that are put on the market. Despite that the VT-Micro model can be used to explore the difference and changes in fuel consumption and exhaust emission, further calibration works should be carried out.

6. Conclusions

In the V2X environment, the type of the preceding vehicle can be obtained by the subject vehicle. The impacts of the preceding vehicle’s type on car-following behavior have been analyzed and confirmed in some previous studies. According to this, an extended car-following model was proposed in this paper. Additionally, the impacts of two types of preceding vehicle (H-Vs and NE-Vd) on platoon stability, platoon car-following, traffic flow operation, and fuel consumption and exhaust emissions were explored with the utilization of theoretical analysis and numerical simulation. The results suggest that, compared with a normal vehicle, H-Vs and NE-Vs as the preceding vehicle will negatively affect the above aspects, and the impacts will enlarge with the increase of penetration percentages. Among them, the impacts of NE-Vs are less significant than that of H-Vs. The research results can provide a new perspective and reference for understanding the impacts of the penetration of H-Vs and NE-Vs on platoon stability, platoon car-following, traffic flow operation, and fuel consumption and exhaust emissions in the V2X environment. In the future, with the increasing penetration percentages of NE-Vs, the theme of this article will still be an interesting topic, which is worth further exploration. As for further research, more efforts are recommended to calibrate the parameters in the car-following models with large-scale field data and to analyze the traffic flow with nonlinear analysis methods.

Author Contributions

Conceptualization, J.H. and X.W.; methodology, J.H.; software, J.H. and B.W.; validation, J.H., X.W., H.S. and L.C.; investigation, J.H., H.S., B.W. and G.W.; resources, X.W.; writing—original draft preparation, J.H.; writing—review and editing, J.H., X.W., H.S. and Q.W.; visualization, J.H. and G.W.; supervision, X.W.; project administration, X.W.; funding acquisition, X.W. All authors have read and agreed to the published version of the manuscript.

Funding

This research was funded by the Natural Science Foundation of Shandong Province, grant number ZR2020MF082; the Collaborative Innovation Center for Intelligent Green Manufacturing Technology and Equipment of Shandong Province, grant number IGSD-2020-012; the Qingdao Top Talent Program of Entrepreneurship and Innovation, grant number 19-3-2-8-zhc; and the National Key Research and Development Program, grant number 2018YFB1601500.

Institutional Review Board Statement

Not applicable.

Informed Consent Statement

Not applicable.

Data Availability Statement

Not applicable.

Conflicts of Interest

The authors declare no conflict of interest.

References

  1. Babojelic, K.; Novacko, L. Modelling of driver and pedestrian behaviour—A historical review. Promet Traffic Transp. 2020, 32, 727–745. [Google Scholar] [CrossRef]
  2. Longhai, Y.; Chun, Z.; Xiaoyun, Q.; Shuai, L.; Hui, W. Research Progress on Car-Following Models. J. Traffic Transp. Eng. 2019, 19, 125–138. [Google Scholar]
  3. Zhengbing, H.; Ruikang, X.; Dongfan, X.; Fang, Z.; Renxin, Z. A Review of Data-Driven Car-Following Models. J. Transp. Syst. Eng. Inf. Technol. 2021, 21, 102–113. [Google Scholar]
  4. Han, J.; Wang, X.; Wang, G. Modeling the Car-Following Behavior with Consideration of Driver, Vehicle, and Environment Factors: A Historical Review. Sustainability 2022, 14, 8179. [Google Scholar] [CrossRef]
  5. Li, Y.; Sun, D.; Liu, W.; Zhang, M.; Zhao, M.; Liao, X.; Tang, L. Modeling and Simulation for Microscopic Traffic Flow Based on Multiple Headway, Velocity and Acceleration Difference. Nonlinear Dyn. 2011, 66, 15–28. [Google Scholar] [CrossRef]
  6. Sun, D.; Kang, Y.; Yang, S. A Novel Car Following Model Considering Average Speed of Preceding Vehicles Group. Phys. A Stat. Mech. Appl. 2015, 436, 103–109. [Google Scholar] [CrossRef]
  7. Kuang, H.; Xu, Z.; Li, X.; Lo, S. An Extended Car-Following Model Accounting for the Average Headway Effect in Intelligent Transportation System. Phys. A Stat. Mech. Appl. 2017, 471, 778–787. [Google Scholar] [CrossRef]
  8. Zhu, W.; Zhang, L. A New Car-Following Model for Autonomous Vehicles Flow with Mean Expected Velocity Field. Phys. A Stat. Mech. Appl. 2018, 492, 2154–2165. [Google Scholar] [CrossRef]
  9. Yu, G.; Wang, P.; Wu, X.; Wang, Y. Linear and Nonlinear Stability Analysis of a Car-Following Model Considering Velocity Difference of Two Adjacent Lanes. Nonlinear Dyn. 2016, 84, 387–397. [Google Scholar] [CrossRef]
  10. Gao, Z.; Zhang, N.; Mannini, L.; Cipriani, E. The Car Following Model with Relative Speed in Front on the Three-Lane Road. Discret. Dyn. Nat. Soc. 2018, 2018, 7560493. [Google Scholar] [CrossRef] [Green Version]
  11. Han, J.; Zhang, J.; Wang, X.; Liu, Y.; Wang, Q.; Zhong, F. An Extended Car-Following Model Considering Generalized Preceding Vehicles in V2X Environment. Future Internet 2020, 12, 216. [Google Scholar] [CrossRef]
  12. Tang, T.; Shi, W.; Shang, H.; Wang, Y. A New Car-Following Model with Consideration of Inter-Vehicle Communication. Nonlinear Dyn. 2014, 76, 2017–2023. [Google Scholar] [CrossRef]
  13. Ou, H.; Tang, T.-Q. An Extended Two-Lane Car-Following Model Accounting for Inter-Vehicle Communication. Phys. A 2018, 495, 260–268. [Google Scholar] [CrossRef]
  14. Tang, T.-Q.; Yi, Z.-Y.; Zhang, J.; Zheng, N. Modelling the Driving Behaviour at a Signalised Intersection with the Information of Remaining Green Time. IET Intell. Transp. Syst. 2017, 11, 596–603. [Google Scholar] [CrossRef]
  15. Zhao, J.; Li, P. An Extended Car-Following Model with Consideration of Speed Guidance at Intersections. Phys. A 2016, 461, 1–8. [Google Scholar] [CrossRef]
  16. Zhao, J.; Li, P. An Extended Car-Following Model with Consideration of Vehicle to Vehicle Communication of Two Conflicting Streams. Phys. A 2017, 473, 178–187. [Google Scholar] [CrossRef]
  17. Ci, Y.; Wu, L.; Zhao, J.; Sun, Y.; Zhang, G. V2I-Based Car-Following Modeling and Simulation of Signalized Intersection. Phys. A 2019, 525, 672–679. [Google Scholar] [CrossRef]
  18. Peeta, S.; Zhang, P.C.; Zhou, W.M. Behavior-Based Analysis of Freeway Car-Truck Interactions and Related Mitigation Strategies. Transp. Res. Part B Methodol. 2005, 39, 417–451. [Google Scholar] [CrossRef]
  19. Aghabayk, K.; Sarvi, M.; Young, W. Understanding the Dynamics of Heavy Vehicle Interactions in Car-Following. J. Transp. Eng. 2012, 138, 1468–1475. [Google Scholar] [CrossRef]
  20. Aghabayk, K.; Sarvi, M.; Young, W. Attribute Selection for Modelling Driver’s Car-Following Behaviour in Heterogeneous Congested Traffic Conditions. Transp. A 2014, 10, 457–468. [Google Scholar] [CrossRef]
  21. Rakha, H.; Wang, W. Procedure for Calibrating Gipps Car-Following Model. Transp. Res. Rec. 2009, 2124, 113–124. [Google Scholar] [CrossRef]
  22. Ossen, S.; Hoogendoorn, S.P. Heterogeneity in Car-Following Behavior: Theory and Empirics. Transp. Res. Part C Emerg. Technol. 2011, 19, 182–195. [Google Scholar] [CrossRef]
  23. Mathew, T.V.; Ravishankar, K.V.R. Car-Following Behavior in Traffic Having Mixed Vehicle-Types. Transp. Lett. 2011, 3, 109–122. [Google Scholar] [CrossRef]
  24. Asaithambi, G.; Kanagaraj, V.; Srinivasan, K.K.; Sivanandan, R. Study of Traffic Flow Characteristics Using Different Vehicle-Following Models under Mixed Traffic Conditions. Transp. Lett. 2018, 10, 92–103. [Google Scholar] [CrossRef]
  25. Raju, N.; Arkatkar, S.; Joshi, G. Modeling Following Behavior of Vehicles Using Trajectory Data under Mixed Traffic Conditions: An Indian Viewpoint. Transp. Lett. 2021, 13, 649–663. [Google Scholar] [CrossRef]
  26. Nagahama, A.; Yanagisawa, D.; Nishinari, K. Car-Following Characteristics of Various Vehicle Types in Respective Driving Phases. Transp. B Transp. Dyn. 2020, 8, 22–48. [Google Scholar] [CrossRef]
  27. Sarvi, M. Heavy Commercial Vehicles-Following Behavior and Interactions with Different Vehicle Classes. J. Adv. Transp. 2013, 47, 572–580. [Google Scholar] [CrossRef]
  28. Kong, D.; Guo, X.; Yang, B.; Wu, D. Analyzing the Impact of Trucks on Traffic Flow Based on an Improved Cellular Automaton Model. Discret. Dyn. Nat. Soc. 2016, 2016, 1236846. [Google Scholar] [CrossRef] [Green Version]
  29. Aghabayk, K.; Sarvi, M.; Young, W. Including Heavy Vehicles in a Car-Following Model: Modelling, Calibrating and Validating. J. Adv. Transp. 2016, 50, 1432–1446. [Google Scholar] [CrossRef]
  30. Zheng, L.; Jin, P.J.; Huang, H.; Gao, M.; Ran, B. A Vehicle Type-Dependent Visual Imaging Model for Analysing the Heterogeneous Car-Following Dynamics. Transp. B Transp. Dyn. 2016, 4, 68–85. [Google Scholar] [CrossRef]
  31. Wu, P.; Gao, F.; Li, K. A Vehicle Type Dependent Car-Following Model Based on Naturalistic Driving Study. Electronics 2019, 8, 453. [Google Scholar] [CrossRef] [Green Version]
  32. Ahangar, M.N.; Ahmed, Q.Z.; Khan, F.A.; Hafeez, M. A Survey of Autonomous Vehicles: Enabling Communication Technologies and Challenges. Sensors 2021, 21, 706. [Google Scholar] [CrossRef] [PubMed]
  33. Abdelkader, G.; Elgazzar, K.; Khamis, A. Connected Vehicles: Technology Review, State of the Art, Challenges and Opportunities. Sensors 2021, 21, 7712. [Google Scholar] [CrossRef] [PubMed]
  34. Han, J.; Shi, H.; Chen, L.; Li, H.; Wang, X. The Car-Following Model and Its Applications in the V2X Environment: A Historical Review. Future Internet 2022, 14, 14. [Google Scholar] [CrossRef]
  35. Li, Y.; Zhang, L.; Zheng, H.; He, X.; Peeta, S.; Zheng, T.; Li, Y. Nonlane-Discipline-Based Car-Following Model for Electric Vehicles in Transportation-Cyber-Physical Systems. IEEE Trans. Intell. Transp. Syst. 2018, 19, 38–47. [Google Scholar] [CrossRef]
  36. Qu, X.; Yu, Y.; Zhou, M.; Lin, C.-T.; Wang, X. Jointly Dampening Traffic Oscillations and Improving Energy Consumption with Electric, Connected and Automated Vehicles: A Reinforcement Learning Based Approach. Appl. Energy 2020, 257, 114030. [Google Scholar] [CrossRef]
  37. Xu, Y.; Zheng, Y.; Yang, Y. On the Movement Simulations of Electric Vehicles: A Behavioral Model-Based Approach. Appl. Energy 2021, 283, 116356. [Google Scholar] [CrossRef]
  38. Yoong, M.K.; Gan, Y.H.; Gan, G.D.; Leong, C.K.; Phuan, Z.Y.; Cheah, B.K.; Chew, K.W. Studies of Regenerative Braking in Electric Vehicle. In Proceedings of the 2010 IEEE Conference on Sustainable Utilization and Development in Engineering and Technology, Kuala Lumpur, Malaysia, 20–21 November 2010; pp. 40–45. [Google Scholar]
  39. Mahmoudi, C.; Flah, A.; Sbita, L. An Overview of Electric Vehicle Concept and Power Management Strategies. In Proceedings of the 2014 International Conference on Electrical Sciences and Technologies in Maghreb (CISTEM), Tunis, Tunisia, 3–6 November 2014; pp. 1–8. [Google Scholar]
  40. Tian, C.; Sun, D.; Zhang, M. Nonlinear Analysis of Lattice Model with Consideration of Optimal Current Difference. Commun. Nonlinear Sci. Numer. Simul. 2011, 16, 4524–4529. [Google Scholar] [CrossRef]
  41. Zhou, T.; Sun, D.; Kang, Y.; Li, H.; Tian, C. A New Car-Following Model with Consideration of the Prevision Driving Behavior. Commun. Nonlinear Sci. Numer. Simul. 2014, 19, 3820–3826. [Google Scholar] [CrossRef]
  42. Yu, S.; Shi, Z. An Improved Car-Following Model Considering Relative Velocity Fluctuation. Commun. Nonlinear Sci. Numer. Simul. 2016, 36, 319–326. [Google Scholar] [CrossRef]
  43. Yu, S.; Zhao, X.; Xu, Z.; Zhang, L. The Effects of Velocity Difference Changes with Memory on the Dynamics Characteristics and Fuel Economy of Traffic Flow. Phys. A Stat. Mech. Appl. 2016, 461, 613–628. [Google Scholar] [CrossRef]
  44. Ma, C.; Hao, W.; Wang, A.; Zhao, H. Developing a Coordinated Signal Control System for Urban Ring Road Under the Vehicle-Infrastructure Connected Environment. IEEE Access 2018, 6, 52471–52478. [Google Scholar] [CrossRef]
  45. Ma, C.; Hao, W.; Xiang, W.; Yan, W. The Impact of Aggressive Driving Behavior on Driver-Injury Severity at Highway-Rail Grade Crossings Accidents. J. Adv. Transp. 2018, 2018, 9841498. [Google Scholar] [CrossRef] [Green Version]
  46. Ma, C.; Wang, C.; Xu, X. A Multi-Objective Robust Optimization Model for Customized Bus Routes. IEEE Trans. Intell. Transp. Syst. 2021, 22, 2359–2370. [Google Scholar] [CrossRef]
  47. Ma, C.; Zhao, Y.; Dai, G.; Xu, X.; Wong, S.-C. A Novel STFSA-CNN-GRU Hybrid Model for Short-Term Traffic Speed Prediction. IEEE Trans. Intell. Transp. Syst. 2022, 1–10. [Google Scholar] [CrossRef]
  48. Dayi, Q.; Zixu, Z.; Yanfeng, J.; Tao, W. Interaction Potential-Based Complex Characteristics and Models for Car-Following. Complex Syst. Complex. Sci. 2022, 19, 87–95. [Google Scholar]
  49. Yanfeng, J.; Dayi, Q.; Zixu, Z.; Tao, W.; Hui, S. Car-Following Decision-Making and Model for Connected and Autonomous Vehicles Based on Safety Potential Field. J. Transp. Syst. Eng. Inf. Technol. 2022, 22, 85–97. [Google Scholar]
  50. Chowdhury, D.; Santen, L.; Schadschneider, A. Statistical Physics of Vehicular Traffic and Some Related Systems. Phys. Rep. 2000, 329, 199–329. [Google Scholar] [CrossRef] [Green Version]
  51. Helbing, D.; Tilch, B. Generalized Force Model of Traffic Dynamics. Phys. Rev. E 1998, 58, 133–138. [Google Scholar] [CrossRef] [Green Version]
  52. Bando, M.; Hasebe, K.; Nakayama, A.; Shibata, A.; Sugiyama, Y. Dynamical model of traffic congestion and numerical-simulation. Phys. Rev. E 1995, 51, 1035–1042. [Google Scholar] [CrossRef]
  53. Jiang, R.; Wu, Q.S.; Zhu, Z.J. Full Velocity Difference Model for a Car-Following Theory. Phys. Rev. E 2001, 64, 017101. [Google Scholar] [CrossRef] [PubMed] [Green Version]
  54. Nagatani, T.; Nakanishi, K.; Emmerich, H. Phase Transition in a Difference Equation Model of Traffic Flow. J. Phys. A Math. Gen. 1998, 31, 5431–5438. [Google Scholar] [CrossRef]
  55. Wang, X.; Han, J.; Bai, C.; Shi, H.; Zhang, J.; Wang, G. Research on the Impacts of Generalized Preceding Vehicle Information on Traffic Flow in V2X Environment. Future Internet 2021, 13, 88. [Google Scholar] [CrossRef]
  56. Ahn, K.; Rakha, H.; Trani, A.; Aerde, M.V. Estimating Vehicle Fuel Consumption and Emissions Based on Instantaneous Speed and Acceleration Levels. J. Transp. Eng. 2002, 128, 182–190. [Google Scholar] [CrossRef]
  57. Yu, S.; Tang, J.; Xin, Q. Relative Velocity Difference Model for the Car-Following Theory. Nonlinear Dyn. 2018, 91, 1415–1428. [Google Scholar] [CrossRef]
  58. Jiao, S.; Zhang, S.; Zhou, B.; Zhang, Z.; Xue, L. An Extended Car-Following Model Considering the Drivers’ Characteristics under a V2V Communication Environment. Sustainability 2020, 12, 1552. [Google Scholar] [CrossRef]
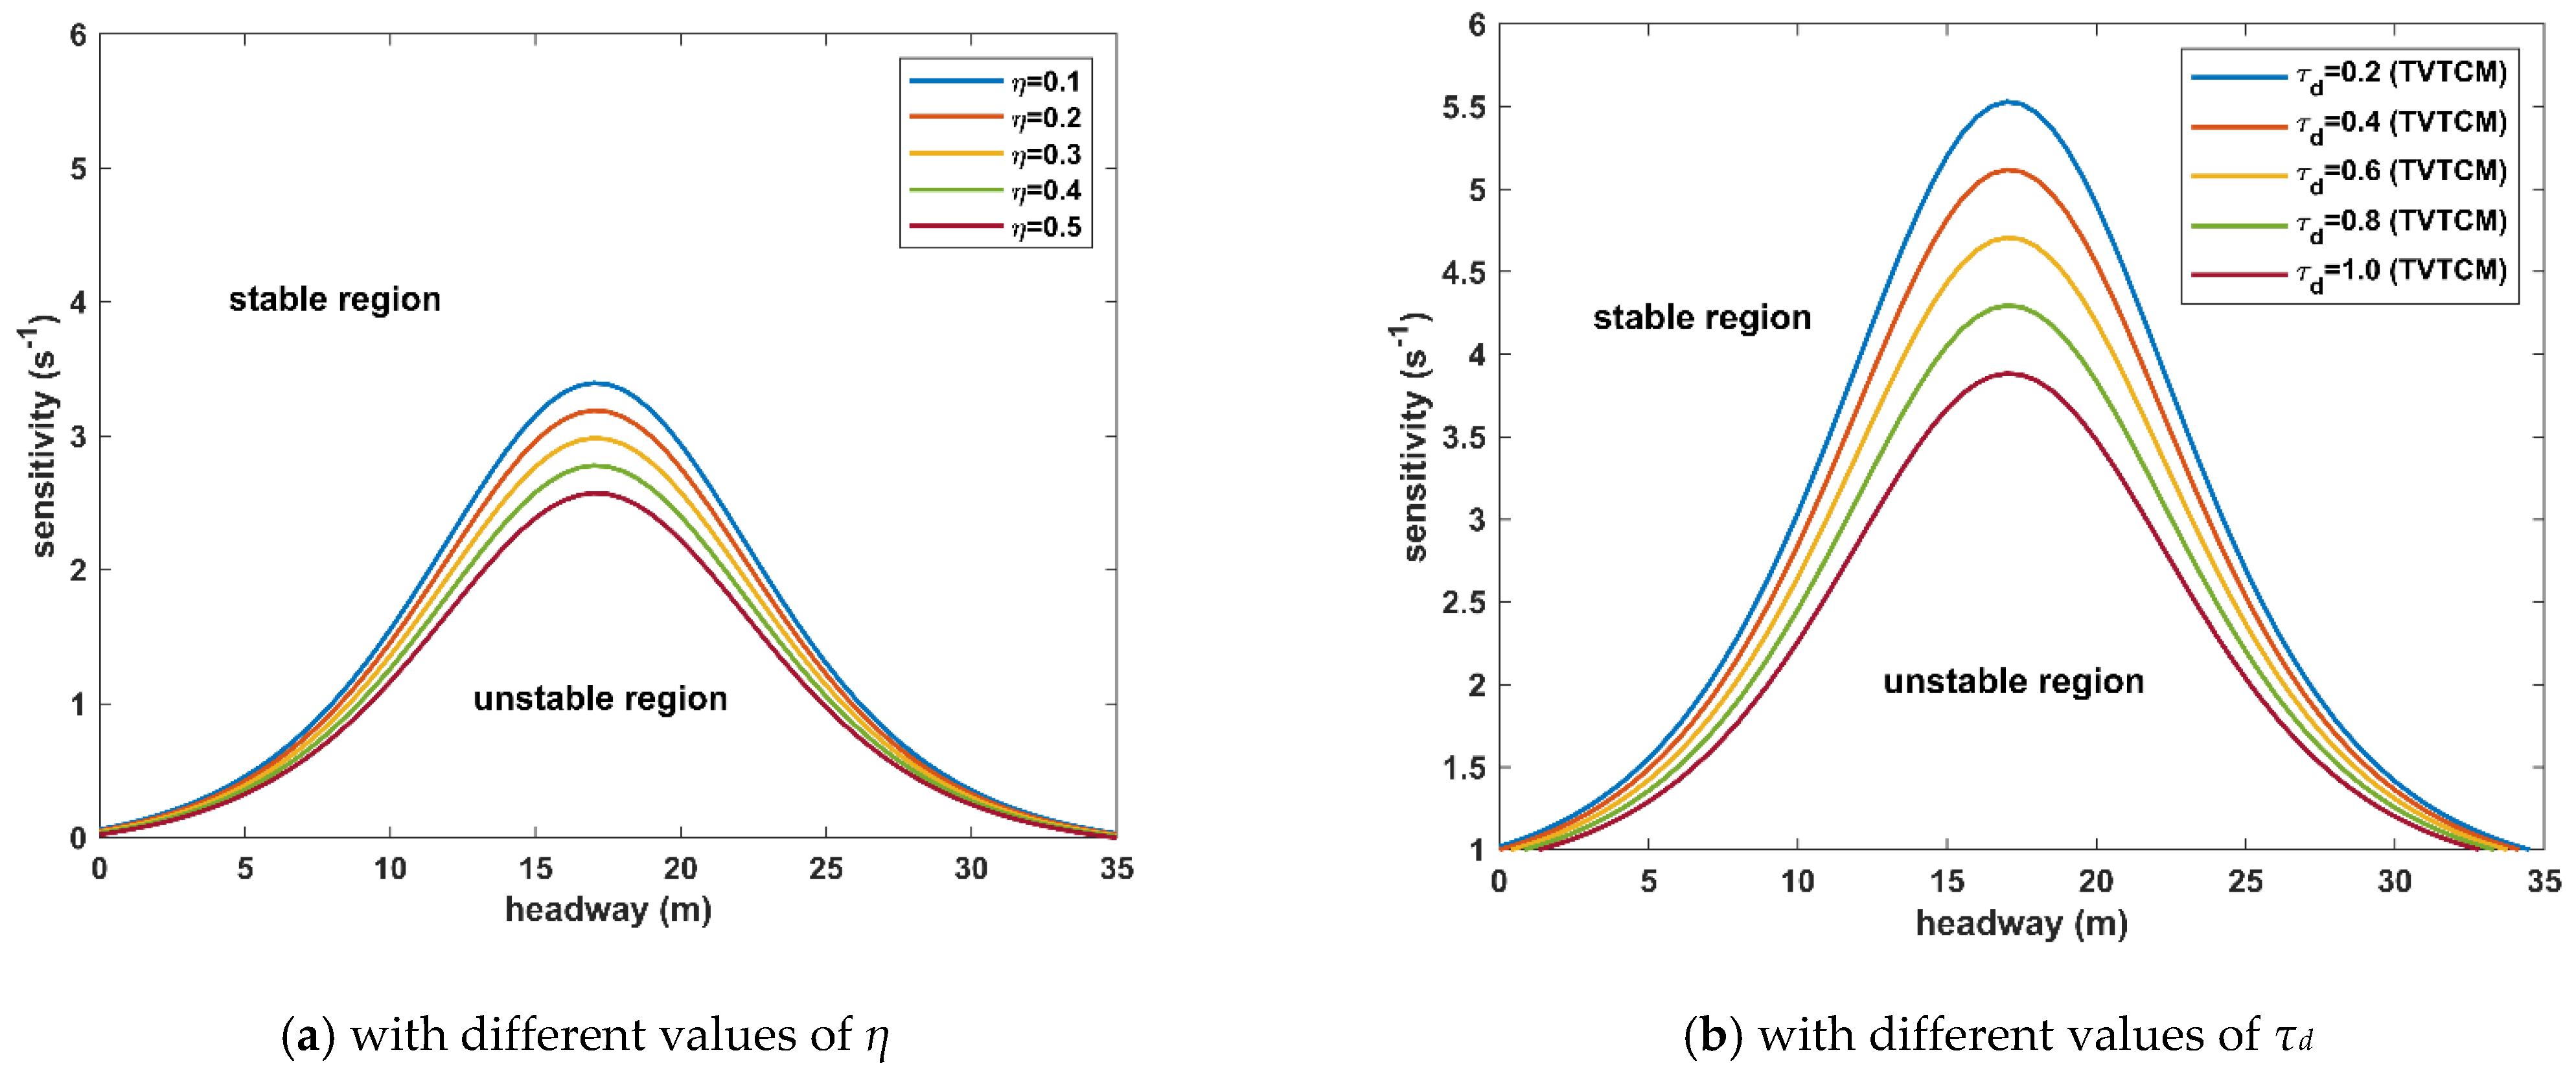
Figure 1. Neutral stability curves.
Sustainability 14 15231 g001
Figure 2. Propagation of disturbance with various parameters’ values.
Sustainability 14 15231 g002aSustainability 14 15231 g002b
Figure 3. Traffic flow simulation framework.
Sustainability 14 15231 g003
Figure 4. Traffic flow operation characteristics.
Sustainability 14 15231 g004
Figure 5. Total fuel consumption and CO/HC/NOX emissions of subject vehicles.
Sustainability 14 15231 g005
Table 1. Value of parameter in Equation (19) for calculating different items [56].
FuelCOHCNOX
K 0.0 e −0.6794390.887447−0.728042−1.067682
K 0.1 e 0.1352730.1488410.0122110.254363
K 0.2 e 0.0159460.0305500.0233710.008866
K 0.3 e −0.001189−0.001348−0.000093243−0.000951
K 1.0 e 0.0296650.0709940.0249500.046423
K 2.0 e −0.000276−0.000786−0.000205−0.000173
K 3.0 e 0.0000014870.0000046160.0000019490.000000569
K 1.1 e 0.0048080.0038700.0101450.015482
K 1.2 e −0.0000205350.000093228−0.000103−0.000131
K 1.3 e 5.5409285 × 10⁻⁸−0.0000007060.0000006180.000000328
K 2.1 e 0.000083329−0.000926−0.0005490.002876
K 2.2 e 0.0000009370.0000491810.000037592−0.00005866
K 2.3 e −2.479644 × 10⁻⁸−0.000000314−0.0000002130.00000024
K 3.1 e −0.0000613210.000046144−0.000113−0.000321
K 3.2 e 0.000000304−0.0000014100.0000033100.000001943
K 3.3 e −4.467234 × 10−98.1724008 × 10−9−1.739372 × 10⁻⁸−1.257413 × 10⁻⁸
Table 2. Average fuel consumption and CO/HC/NOX emissions of subject vehicles.
Preceding Vehicle’s TypeFuel Consumption (l)CO Emission (g)HC Emission (g)NOX Emission (g)
H-V2.01717733526.171582591.7895999533.313692018
NE-V1.96035543825.18397571.7639119153.265898383
N-V 11.89406322524.690172251.712535843.186242325
1 N-V is the normal vehicle.
Publisher’s Note: MDPI stays neutral with regard to jurisdictional claims in published maps and institutional affiliations.