Article

Research on the Firm Spatial Distribution and Influencing Factors of the Service-Oriented Digital Industry in Yangtze River Delta

1
Key Research Institute of Yellow River Civilization and Sustainable Development & Collaborative Innovation Center on Yellow River Civilization Jointly Built by Henan Province and Ministry of Education, Henan University, Kaifeng 475001, China
2
Department of Aerospace Technology Application, China Aerospace Science & Technology Consulting Co., Ltd., Beijing 100054, China
3
College of Geography and Environmental Science, Henan University, Kaifeng 475004, China
*
Author to whom correspondence should be addressed.
Sustainability 2022, 14(22), 14902; https://doi.org/10.3390/su142214902
Submission received: 10 October 2022 / Revised: 31 October 2022 / Accepted: 9 November 2022 / Published: 11 November 2022
(This article belongs to the Special Issue Frontiers in Economic Geography)

Abstract

:
Exploring the spatial distribution and influencing factors of firms’ location choices in the service-oriented digital industry is of great significance for achieving a new round of rapid development for the digital economy in the context of a post-epidemic situation. Based on the micro perspective of firms, this paper explores the spatial distribution and influencing factors of the location choice of the service-oriented digital industry in the Yangtze River Delta of China. The research shows that the number of the service-oriented digital industry firms varies greatly among cities in the Yangtze River Delta region of China, showing an obvious core–periphery structure. There are many firms in municipalities directly under the central government and provincial capitals, which are the core areas; the number of firms in non-provincial capital cities is small and they are marginal areas. The influencing factors include: per capita GDP, industrial structure upgrading, whether it is a municipality directly under the Central Government or a provincial capital city, whether it has opened high-speed rail, information transmission, number of employees in the computer service industry, number of patent applications, Internet infrastructure level, and scientific fiscal expenditure have a significant positive impact on its location choice, while the per capita total social consumer goods have a significant negative impact on its location choice.

1. Introduction

With the development of the Internet, big data, artificial intelligence, and other new generation digital technologies, the digital economy has gradually become a “new engine” for high-quality regional development and an important strategic choice to shape new regional competitive advantages. According to the 2019 Digital Economy Report, global digital economic activities and the wealth they create are growing rapidly. The scale of the digital economy is estimated to account for 4.5–15.5% of the world GDP and it continues to expand [1]. Since the US Department of Commerce released a series of reports on the Emerging Digital Economy in 1998, the EU, Japan, Russia, and China have introduced policies to promote the development of the digital economy [2]. In China, the Yangtze River Delta is a new highland for the development of the national digital economy by grasping the foreword of the digital economy reform. The core industries of the digital economy are divided into the manufacturing-oriented and the service-oriented digital industry. Compared with them, the service-oriented digital industry in the Yangtze River Delta has developed more rapidly and its total scale is larger. In 2000, the number of service-oriented digital firms in the Yangtze River Delta accounted for about 40% of the total number of digital firms and it rose to more than 80% in 2019 [3]. In this process, its evolution pattern and influencing factors have not been clear. Therefore, it is urgent to clarify the development process of the service-oriented digital industry firms in the Yangtze River region, seek for key influencing factors, and provide suggestions for entrepreneurs, the government, society, and other relevant stakeholders to achieve high-quality development of the digital industry in the post-epidemic era.
Since Tapscott put forward the concept of “digital economy” in 1994, many scholars and research institutions around the world have different understandings and interpretations of its connotation and extension, but it has gradually become a consensus to regard digital economy as an economy based on digital technology. With the further development of digital technology, the category and boundary of the digital economy gradually converged with the core field, namely digital industry [2,4,5]. Bukht pointed out that the digital industry is the core of the digital economy, including software and hardware manufacturing, IT consulting, information services, electronic communications, and other digital products or services [6]. In 2021, the National Bureau of Statistics of China issued the Statistical Classification of Digital Economy and Its Core Industries (2021), which believed that digital economy was a series of economic activities that used data resources as the key production factors, modern information networks as an important carrier, and the effective use of information and communication technologies as an important driving force for efficiency improvement and economic structure optimization. This classification defined the scope of the digital economy industry into five categories: digital product manufacturing industry, digital product service industry, digital technology application industry, digital factor driven industry, and digital efficiency improvement industry, and includes 32 medium categories and 156 sub categories [7]. This classification method is consistent with the 2017 Annotation on the Classification of National Economic Industries and is the most authoritative classification standard for digital economic industries at the national level in China.
The spatial distribution and evolution characteristics of digital industry and the driving factors of location selection are first widely concerned by global economic geographers [8,9,10]. The spatial distribution pattern of digital industry is unique [3]. Due to the requirements of technical threshold and factor endowment, the agglomeration characteristics of digital industry are more significant, but the location of the agglomeration shows the tendency of suburbanization [11,12]. The spatial distribution of digital industries at varied scales is different. On the provincial scale, China’s digital industry has shown an obvious distribution trend of decreasing gradients from east to west [8]. On the urban scale, China’s provincial capitals and municipalities directly under the Central Government have become absolute gathering highlands [3] and urban agglomeration has also become the preferred place for digital industry distribution [10]. In analyzing the influencing factors of digital firms’ location choice, the classical location theory mainly focuses on the basic factors of regional development, such as location accessibility, market scale and potential, factor endowment and cost, and agglomeration externality, from the perspective of cost reduction and agglomeration economy, to explain the characteristics of industrial spatial distribution and evolution trend [13,14,15]. Empirical research shows that regions with better urban services, closer to the tourist source market, and higher traffic accessibility can promote the location choice of firms [12,16,17]. With the deepening of research, some empirical studies believe that digital industry, as a knowledge intensive high-tech industry, has gradually weakened the impact of traditional location factors on industrial development [18]. Human capital, institutional environment, digital infrastructure, and other new location factors play an increasingly important role in the location selection of digital industries [16,19].
However, there is still a gap in the research on digital industry. Early research is greatly limited by data. Most of them measure the development of the digital economy based on the digital economy development index published by research institutions [20,21], by building a digital economy development index system [22,23], or by using broadband access, human capital, high-tech industrial patents, and Internet related industrial macro statistical data [24]. The micro perspective based on firms is extremely lacking. With the advent of the era of big data, the availability of data has been greatly improved. The POI data of micro firms have begun to be used in the research of digital industries. A small number of studies have explored the evolution characteristics and driving mechanism of the spatial distribution pattern of digital industry based on the micro perspective of firms. However, the manufacturing-oriented digital industry and the service-oriented digital industry have not been explored separately, causing the identification of driving mechanisms to be limited.
Therefore, based on the micro firm data of the service-oriented digital industry in the Yangtze River Delta region, this paper scientifically depicts the evolution characteristics of the spatial distribution pattern of the service-oriented digital industry, and then explores the influencing factors of its location selection, in order to provide scientific analysis and useful suggestions for the development of the service-oriented digital industry in the Yangtze River Delta demonstration area.

2. Research Process

2.1. Analysis Framework and Explanatory Variables

Based on the relevant research on the influencing factors of location selection of digital industry and service industry, this paper believes that the location selection of the service-oriented digital industry firms in the regional scale is mainly affected by the socio-economic development foundation, location innovation, ability, and business environment. First of all, regions with a high level of regional socio-economic development can provide the economic foundation and market potential for the growth of the digital industry [3]. It has long been considered by most scholars as one of the important dimensions affecting the development of the digital industry [3,13,16,25]. On the one hand, the high level of economic development provides many basic elements for the development of the digital industry, such as R&D capital, facilities, and customer markets. On the other hand, the development of digital industry has a strong dependence on the derivation of existing related industries and the breakthrough development of digital industry can also be achieved relying on the continuously optimized industrial structure. Secondly, the service industry, especially the modern service industry, generally gathers in large cities and tends to gather in the center of the city [26,27]. The spatial distribution of the service-oriented digital firms has a significant core–periphery structure [28]. The digital economy industry is mainly concentrated in areas with high urbanization levels [29]. Among them, the concentration degree of municipalities directly under the Central Government and provincial capitals is the most typical [3]. The convenience of urban traffic conditions will significantly improve the location selectivity of digital economy service firms, facilitate travel and external contacts, and facilitate firms to quickly connect with customers [28]. In addition, the innovation ability is widely considered by scholars as one of the important factors affecting the distribution of digital firms [3,14,15,16,30]. Knowledge and technology spillovers can occur in regions with strong innovation abilities, which is a prerequisite for the rapid development of the digital industry. Last but not least, the business environment includes the level of urbanization, marketization, public services, and ecological environment [31]. The quality of the business environment directly affects the strength of the regional and urban sustainable development momentum [32]. Creating a good business environment has become a breakthrough to attract market players, gather production factors and improve regional competitiveness. At present, some cities, such as Suqian in Jiangsu Province and Guiyang City in Guizhou Province, have performed great efforts to optimize their business environment by establishing a sound digital whole industry ecosystem and continuously strengthening ecological construction, thus realizing the rapid development of service-oriented digital industry.
(a) The foundation of socio-economic development. The development of the digital industry cannot be separated from the regional socio-economic foundation [3]. From the perspective of traditional location theory and industrial development evolution theory, the regional socio-economic development level is considered as the basis of digital industry development [33]. The regions with higher socio-economic development levels provide necessary market potential for the growth of the digital industry.
(b) Location. Municipalities and provincial capitals are highly concentrated areas of digital industry [3], mainly because they are the regions with the most developed economy, the most concentrated population and the most frequent factor flows, which provides the market, talent, capital, institutional environment, and other conditions required for the development of technology and capital intensive digital industries. At the same time, the external connectivity of the city affects the city accessibility and the convenient “face-to-face communication” caused by the improvement of the traffic environment will promote the spread of tacit knowledge, which is conducive to the spread of explicit knowledge [34,35,36]. China’s unique high-speed rail network has greatly improved regional accessibility. Based on this, this paper selects whether the city is a “municipalities directly under the Central Government or provincial capitals” and “whether the city has opened high-speed rail” as dummy variables.
(c) Innovation ability. The digital industry is a technology intensive industry with the characteristics of forerunner, strategy, high permeability, and uncertainty [37], which requires a strong innovation capability. The existing empirical studies often divide innovation capability into knowledge innovation and technology innovation [38]. The most indispensable part of knowledge innovation is human capital. The number of colleges and universities, the number of college students and other indicators are often used to represent human capital. In view of the uniqueness of the digital industry, the number of employees in the information transmission and computer service industries began to be included in the important indicators of human capital [30,39]. In terms of technological innovation, the number of patent applications and the number of patent authorizations are often used as indicators. Some scholars believe that the number of patent applications can better reflect the level of regional innovation and its innovation vitality is stronger [40,41]. Therefore, we choose the number of colleges and universities, the number of employees in information transmission and computer service industries to represent human capital, and use the number of patent applications to represent technological innovation.
(d) Business environment. Early studies believed that business environment is the “soft power” of location selection, but for digital industry, a good business environment is conducive to shaping the new advantages of the digital economy. The globalization level, marketization level, market vitality, policy environment, Internet infrastructure, and ecological environment of cities are mentioned more in different documents [3,24,34]. Based on this, this paper uses the actual use of foreign capital to represent the level of globalization, the proportion of state-owned firms in the service-oriented digital industry to represent the level of marketization, the total retail sales of consumer goods to represent the market vitality, the scientific financial expenditure per 10000 people to represent the policy environment, the Internet penetration rate to represent the level of Internet infrastructure, and PM2.5 to represent the ecological environment (Table 1).

2.2. Research Data

The research data used in this paper include spatio-temporal big data and socio-economic statistics. (a) Spatio-temporal big data include the POI data of micro firms. The service-oriented digital industry in the Yangtze River Delta had obtained nearly 1.27 million firm data (157,944 in Shanghai, 508,730 in Jiangsu Province, 329,510 in Zhejiang Province and 285,396 in Anhui Province) from “the firm search website” (https://sh.gsxt.gov.cn/index.html, accessed on 1 June 2022), including firm name, date of establishment, date of approval, business status (existence, cancellation, revocation, etc.), firm address, firm type (state-owned, private, foreign capital, etc.), business scope, and lots of other attribute information. Due to the lack of establishment date, approval date, and business status of some firm data, we used registration numbers as the key word to supplement in the national firm credit information publicity system (https://sh.gsxt.gov.cn/index.html, accessed on 8 June 2022). If the national enterprise credit information publicity system also lacked this data, it would be eliminated. In 2000, 2005, 2010, 2015, and 2019, the total number of the service-oriented digital firms in business was enterprises that were established in the same year or before and had not canceled in the same year. The proportion of state-owned firms is the ratio between the number of state-owned firms and the number of all firms in the year. (b) Socio-economic statistics. The GDP, added value of the tertiary industry, information transmission, number of employees in the computer service industry, actual utilization of foreign capital, scientific fiscal expenditure, Internet penetration, and other data are from China’s Urban Statistical Yearbook and China’s Regional Economic Statistical Yearbook (https://kns.cnki.net/, accessed on 15 June 2022). Some missing data will be supplemented by statistical yearbooks of provinces and cities, social and economic development reports and interpolation methods. Considering the large difference between variables, which is easy to affect the estimation results, all independent variables except dummy variables are standardized. The descriptive statistical analysis and correlation analysis are shown in Table 2 and Table 3. The highest collinearity is the variable “College”, which has the highest correlation coefficient with the “City”. The possible reason is that the spatial distribution of Chinese colleges and universities is extremely uneven. Colleges and universities use megacities, urban agglomerations, provincial capital cities, and prefecture level cities as the centers, presenting a multi-level and multi-center distribution structure [42]. For the Yangtze River Delta, colleges and universities gather in municipalities directly under the Central Government and provincial capital cities, which corresponds to the dummy variable of “City” in this paper, so its correlation is high. In addition, the number of patent applications has a strong correlation with the per capita scientific financial expenditure. The possible reason is that the increase in scientific financial expenditure per capita can promote patent application and a large number of patent applications are required to fund projects and other assessment indicators to meet the needs of projects. Last but not least, the per capita scientific research financial expenditure attracts talents to gather in high-tech scientific research, which causes the city to be more innovative and has more patent applications. Therefore, the correlation between the two is high. Table 2 is the descriptive statistical analysis of the variables, and Table 3 is the correlation analysis of the variables.

2.3. Research Methods and Model Setting

Considering the heterogeneity between individuals, this paper adopts the random panel model. This paper uses data from 2000, 2005, 2010, 2015, and 2019, which belong to short panel data. Considering the spatial effect of regions, we try to use spatial panel data. We uses ArcGIS10.8 software to create a local Moran’s I test and the spatial effect of the service-oriented digital firms in most regions is not significant (Figure 1 and Figure 2). Therefore, we do not use the spatial panel model.
Second, in terms of the selection of fixed effects and random effects of panel models, this paper conducts the F test of individual effects (p = 0.000) and time effects (p = 0.000), respectively, indicating that the model has individual effects and time effects. Then, we conduct a fixed effect model and random effect model, respectively, and we conduct a Hausman test on them. The p value of the test result is 0.051, indicating that the original hypothesis is accepted at the 95% confidence level, so the random panel model is selected. The specific model settings are as follows:
Firmi,t = β0 + β1GDPi,t + β2IndustStructi,t + β3Cityi,t + β4Raili,t + β5Universityi,t + β6Employeei,t + β7Patenti,t + β8Globali,t + β9State-ownedi,t + β10MarketVitalityi,t + β11SciFiscali,t + β12Interneti,t + β13PM2.5i,t + εi,t
Firm is the total number of firms. GDP is GDP per capita. IndustStruct is the proportion of added value of the tertiary industry in GDP. City is the dummy variable and whether it is a municipality/provincial capital city. Rail is the dummy variable whether there is high-speed railway in that year. University is the number of colleges and universities. Employee is the number of employees in information transmission and computer service industries. Patent is number of patent applications. Globe is actually utilized foreign capital. State-owned is the proportion of state-owned firms. MarketVitality is the total retail sales of consumer goods per capita. SciFiscal is scientific fiscal expenditure per capita. Internet is Internet infrastructure. PM2.5 is PM2.5 concentration. “i” express individual and “t” expresses time.

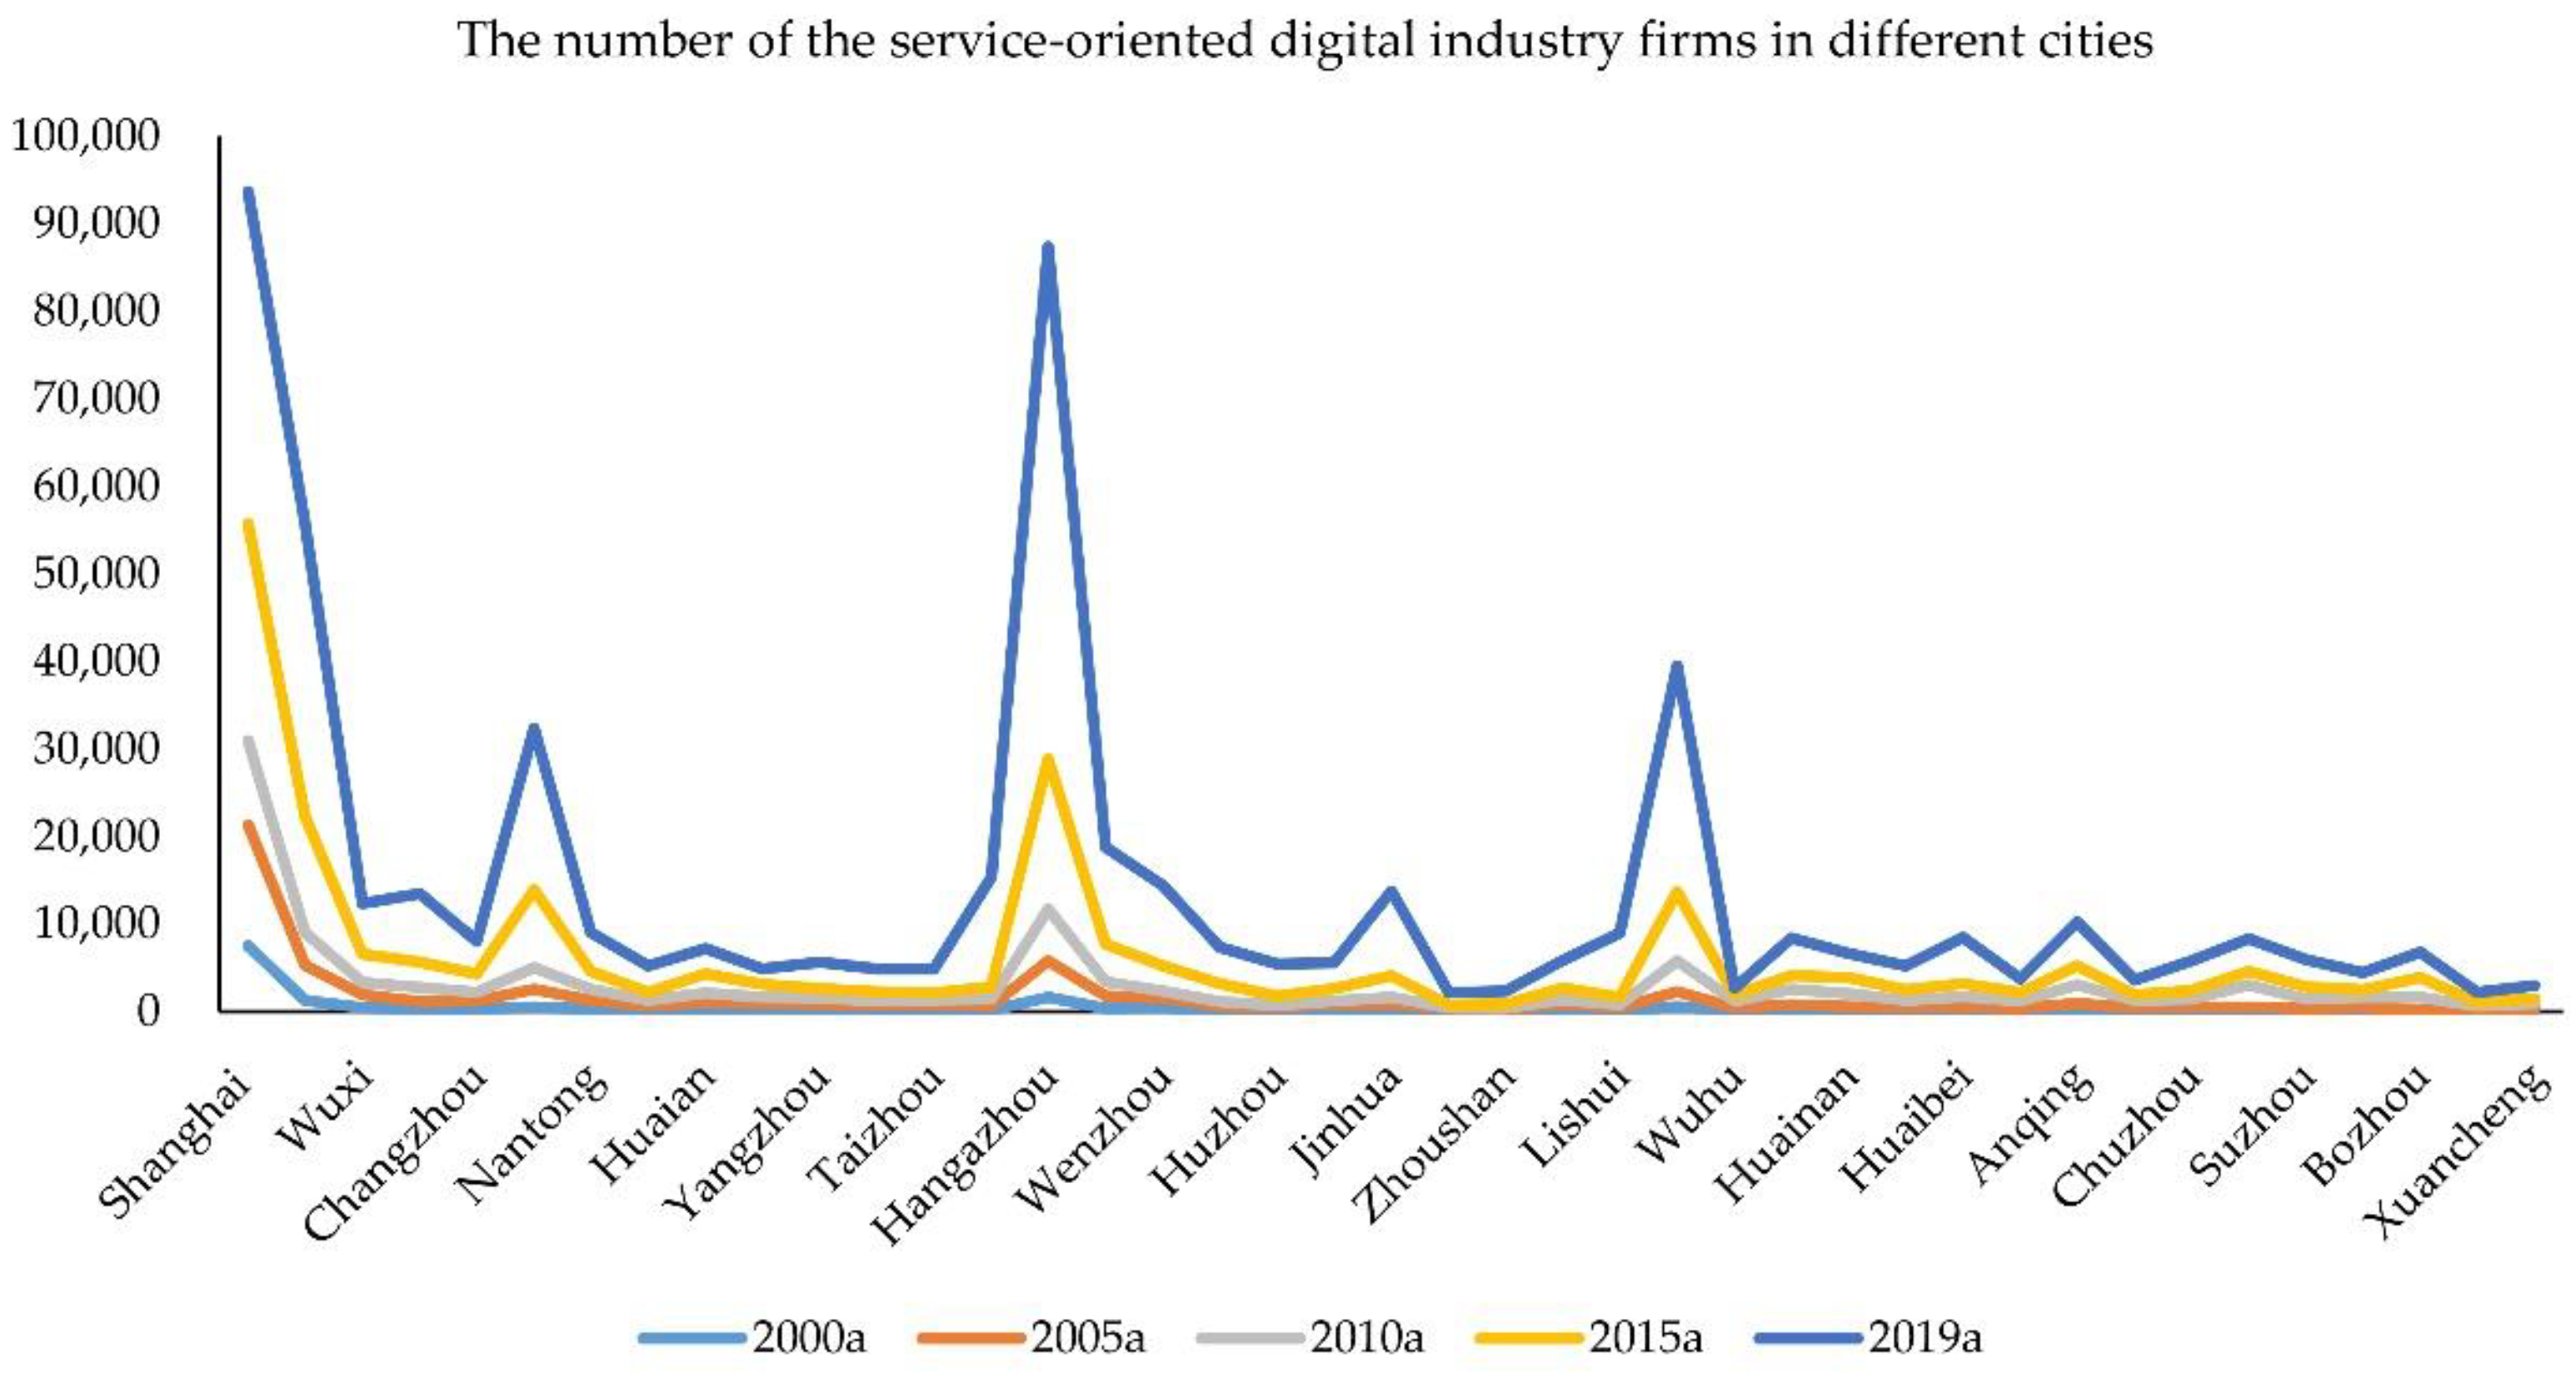
3. Spatial and Temporal Evolution Characteristics of the Total Number of Service-Oriented Digital Industries in the Yangtze River Delta

The service-oriented digital industry firms in the Yangtze River Delta have developed rapidly with a large increase in total volume (Figure 3). In 2000, there were 18,049 service-oriented digital enterprises in the Yangtze River Delta. In 2005, the total number of firms increased rapidly to 63,931. Since then, the number of firms has doubled every five years. In 2010, 2015, and 2019, the total number of enterprises was 122,560, 249,711, and 570,222, respectively.
In terms of provinces, the growth rates of each province and city are quite different. The number of firms in Shanghai grew the least. Additionally, the total number of firms in 2019 was 12.44 times of that in 2000, with 93,660 and 7530 firms in two years, respectively. Anhui has the largest growth rate. The total number of firms in 2019 was 52.61 times that in 2000 and the total number of firms in two years was 125,211 and 2380, respectively. Zhejiang Province’s growth rate was second only to the Anhui Province, with 3419 and 172,145 firms in 2000 and 2019, respectively. The growth rate of the Jiangsu Province was third, with 4720 enterprises in 2000 and 179,206 in 2019. At the same time, the proportion of enterprises in four provinces and cities has also changed greatly over time. In 2000, the number of service-oriented digital industry firms in Shanghai accounted for the highest proportion of the total number of firms in the Yangtze River Delta, reaching 41.72%. The Anhui Province accounted for the smallest proportion, only 13.19%. Jiangsu and Zhejiang accounted for 26.15% and 18.94%, respectively. In 2019, the number of the service-oriented digital industry firms in Shanghai accounted for the lowest proportion of the total number of firms in the Yangtze River Delta, only 16.42%. The Jiangsu Province accounted for the highest proportion of 31.43%. Zhejiang and Anhui accounted for 30.19% and 21.96%, respectively. To sum up, in the development process of the service-oriented digital industry firms in the Yangtze River Delta, Shanghai has a good foundation but a slow development rate, while Anhui Province has a poor foundation but a fast development rate. The Jiangsu Province and Zhejiang Province have a certain development foundation and a fast development speed and eventually become the main agglomeration of the service-oriented digital industry firms in the Yangtze River Delta.
In order to further depict the spatio-temporal evolution pattern of service-oriented digital industry enterprises in the Yangtze River Delta, we used ArcGIS10.8 software to map and make descriptive analysis on them in 2000, 2005, 2010, 2015, and 2019 on the scale of the prefecture level cities (Figure 4).
The number of the service-oriented digital industry firms vary greatly across the Yangtze River Delta, showing an obvious core–edge structure (Figure 4). The number of firms in municipalities directly under the central Government and capital cities was large, which was the core zone. The number of firms in non-provincial capital cities was small and they were marginal areas. The total amount of firms formed a high value agglomeration area mainly in the estuary of the Yangtze River Delta, while the northwest of the Jiangsu Province, the northeast of the Anhui Province, and the southwest of the Zhejiang Province all formed low value agglomeration areas. Specifically:
(a) In 2000, the spatial pattern showed a significant difference between east and west. The number of firms in the eastern region was more than that in the western region, which showed an obvious core–edge structure. As the core of the Yangtze River Delta region, the number of the service-oriented digital industry firms in Shanghai was much higher than other cities, reaching 7530. The provincial capital cities Hangzhou, Nanjing, and Hefei are the core of the Zhejiang Province, Jiangsu Province, and Anhui Province, respectively. The number of firms was second only to Shanghai, with 1669, 1295, and 619, respectively. The cities located on the edge of the Yangtze River Delta had fewer firms, especially in western Anhui and western Zhejiang provinces. The number of firms in Bozhou, Fuyang, Chizhou, and Lu’an service-oriented digital industries in Anhui is 16, 29, 33, and 62, respectively. The number of firms in Lishui and Quzhou of Zhejiang was 67 and 80, respectively (Figure 5). The reason may be that in the early stage of reform and opening up, the port cities open to the outside world were the highlands of social and economic development, which may have a high market demand for the service-oriented digital industry. Therefore, coastal cities in the Yangtze River Delta region were high agglomeration areas of firms.
(b) In 2005, the difference between east and west was more significant, and the core– periphery structure was still obvious. The number of the service-oriented digital industry firms in Chizhou, Bozhou, Quzhou, and Lishui located in the west of the Yangtze River Delta was 134, 257, 344, and 412, respectively. The number of firms in Nantong, Wenzhou, and Ningbo in the eastern part of the Yangtze River Delta was 1265, 1591, and 1797, respectively. In the core–periphery structure, Shanghai was still the core area of the Yangtze River Delta, with 21,325 enterprises. Hangzhou, Nanjing, and Hefei, the cores of Zhejiang, Jiangsu, and Anhui provinces, had 5832, 5340, and 2271 companies, respectively. The reason may be that, after China joined the World Trade Organization in 2001, production factors such as technology, foreign capital, and human capital needed for digital industry were brought and, on the other hand, the domestic and foreign markets were also greatly expanded. The eastern region of the Yangtze River Delta has seized on a new round of a development wave, with a large increase in the service-oriented digital industry and a huge siphon effect, causing the difference between the east and the west to be more significant.
(c) In 2010, the east–west difference slowed down, the core–periphery structure was significant, and a high-value cluster with Shanghai as the center was formed. The number of firms in Hangzhou, Nanjing, and Hefei was 11,691, 9015, and 5808, respectively. The number of firms in Shanghai accounted for 25.25% of the total firms in the Yangtze River Delta, reaching 30,946. At the same time, the number of firms in Suzhou and Nantong, which are adjacent to Shanghai, was also larger, with 4997 and 2591 firms, respectively.
(d) In 2015, the spatial pattern showed obvious north–south differences. With the Yangtze River as the boundary, the number of firms in the northern cities is large, while the number of firms in the southern cities is small. Xuzhou and Huai ‘an, located in the north, had 5638 and 4294 enterprises, respectively. The southern cities of Quzhou and Lishui had only 784 and 1615, respectively. The reason may be that, with the further development of China’s high-speed railway, a complete high-speed railway network has gradually formed in the north of the Yangtze River, which greatly improves regional accessibility, produces a strong spatial spillover effect, and changes the location choice of enterprises. In contrast, the south of the Yangtze River has not formed a complete high-speed railway network, so there was a significant difference between the North and the South at this stage.
(e) In 2019, there was no obvious east–west difference and north–south gap and the core–edge structure was still significant. The number of service-oriented digital industry enterprises in Shanghai was 93,660, accounting for 16.43% of the total in the Yangtze River Delta. The number of enterprises in Hangzhou, Nanjing, and Hefei was 87,396, 55,709, and 39,475, respectively, accounting for 15.33%, 9.77%, and 6.92% of the total number of enterprises in the Yangtze River Delta. This is due to the strong spatial spillover effect of the digital economy at this stage [25].
To sum up, the spatial pattern of the service-oriented digital industry firms in the Yangtze River Delta shows three characteristics: first, the five stages all show an obvious preference between municipalities directly under the central government and provincial capitals; second, it is greatly influenced by the opening of high-speed railways and the formation of a high-speed railway network and the degree of influence is slightly different in different stages; and third, there is a significant core–periphery structure, which is weakened over time, but the difference between the core area and the edge area is still significant. The core cities of Shanghai, Hangzhou, Nanjing, and Hefei accounted for 61.58%, 54.38%, 46.88%, 48.30%, and 48.44% of the total firms in the Yangtze River Delta in 2000, 2005, 2010, 2015, and 2019, respectively.

4. Regression Result Analysis

We used the random panel model of Stata15 software to explore the location selection of the service-oriented digital industry firms in the Yangtze River Delta. The collinearity test was carried out before the model operation. The results showed that the maximum value of VIF in all variables was 8.08, the minimum value was 1.19, and the average value was 3.84, indicating that the collinearity between variables was weak, and the operation could be carried out directly. The R2 of the model regression result is 0.904, indicating that the model fitting effect is good. Table 4 shows the regression results and Table 5 more directly shows the positive and negative effects of each variable in the regression results and its insignificant variables.

4.1. The Foundation of Socio-Economic Development

The foundation of socio-economic development drives the spatial differentiation of urban service-oriented digital industries in the Yangtze River Delta. As shown in Table 4, the impact coefficients of per capita GDP and industrial structure upgrading on firm location selection are 949.161 (p < 0.1) and 1614.902 (p < 0.01), respectively, indicating that the higher the per capita GDP and the higher the industrial structure upgrading, the more firms there are. The first reason is that the higher the per capita GDP of cities, the greater the market potential of digital industry development and the more attractive the location choice is for firms. Second, the more advanced the urban industrial structure is, the better the development of the tertiary industry is. As the penetration of “industrial digitalization” into the primary, secondary, and tertiary industries is increasing, the higher the proportion of the tertiary industry [43], the more robust the demand for industrial digitalization, so the total number of firms is large. This is in strong consistency with the existing empirical research, indicating that the indicator selection is more reliable [3].

4.2. Location

The location has significantly affected the spatial differentiation of urban service-oriented digital industries in the Yangtze River Delta [3]. The impact coefficients of “whether it is a municipality/provincial capital city” and “whether it has opened high-speed rail” on the total number of firms are 6351.897 (p < 0.01) and 3131.287 (p < 0.01), respectively, indicating that the municipality/provincial capital city has a significant and positive impact on the firm’s location selection and the opening of high-speed rail has significantly and positively promoted the firm’s location selection. The reason is that for the service industry, cities with different levels have different service functions. China’s municipalities directly under the Central Government and provincial capitals have higher levels and have higher advantages in economic development, human capital, market conditions, and many other aspects, causing them to have greater market potential, thus becoming the absolute preferred place for the service-oriented digital firms.

4.3. Innovation Ability

The innovation capability has significantly affected the spatial differentiation of urban service-oriented digital industries in the Yangtze River Delta [4]. As shown in Table 4, the regression coefficients of the number of colleges and universities, the number of employees in the information transmission and computer service industries and the number of patent applications on the location selection of firms are 161.934 (p > 0.1), 5455.717 (p < 0.1), and 3958.436 (p < 0.1), respectively, indicating that the number of employees in the information transmission and computer service industries and the number of patent applications have a positive and significant impact on them, while the number of colleges and universities has no significant impact on them. This is not completely consistent with the existing research. On the one hand, the number of employees and patent applications in the information transmission and computer service industries are the same as the existing research results. The reasons are that: first, the more employees in the information transmission and computer service industries, the more opportunities for formal or informal exchanges, the higher the possibility of fission and entrepreneurship, and the greater the possibility of knowledge and technology spillovers, which affect the location choice of firms; and second, the more patent applications, the stronger the local innovation capacity, the greater the possibility of technology spillovers, which can significantly affect the location choice of firms. On the other hand, the number of colleges and universities is not significant to the location choice of firms. The possible reason is that the cooperation between colleges and universities, the government, and firms is still insufficient. At the same time, the innovation ability of colleges and universities has not been fully realized due to the insufficient supply of innovative research and development related to the digital economy and high-level applied talents, which has become an important factor in the slow development of digital economy in Latin American countries such as Brazil, Argentina, Mexico, etc [44]. Therefore, the impact on the location choice of enterprises is not significant.

4.4. Business Environment

The impact of the business environment on the location choice of service-oriented digital industries is more complex. Among them, the levels of Internet infrastructure and scientific fiscal expenditure significantly affect the total number of enterprises, which is consistent with a large number of empirical research results. However, the per capita total amount of social consumer goods is negative to the location choice of firms, which indicates that the lower the per capita total amount of social consumer goods, the higher the total number of firms, which is inconsistent with the existing experience. After in-depth analysis of the total amount of social consumer goods, we find that the regions with higher service-oriented digital industries are more likely to purchase online, with more transactions of virtual products and a lower consumption of physical stores. In the early days, the Chinese government had poor supervision over the digital industry, forming a large number of “funnels”, such as the “Weiya” phenomenon (tax evasion) [45], that is, the products of online shopping were not or only partially included in the total amount of social consumer goods, leading to a significant reduction in the total amount of consumer goods per capita. Therefore, there is a significant negative correlation. In addition, the actual utilization of foreign capital, the proportion of state-owned firms and PM2.5 have no significant impact on the location choice of the service-oriented digital industry. The possible reasons are: first, although some regions have a low level of opening to the outside world, they can actively undertake regional industrial transfers. For example, Suqian formed a national call center under the initiative of Liu Qiangdong, which can also realize the vigorous development of firms [46]. Second, in the digital industry, private firms still account for the vast majority, so the proportion of state-owned firms is not significant.

5. Conclusions and Discussion

5.1. Conclusions

Based on the location selection theory of firms, combined with the development process of the service-oriented digital industry and its socio-economic foundation, this paper analyzes the firm spatial differentiation characteristics of the service-oriented digital industry in the Yangtze River Delta in 2000, 2005, 2010, 2015, and 2019 based on enterprise micro data and constructs an analysis framework from the four dimensions of the socio-economic development foundation, location, innovation ability, and business environment. Using the random OLS panel model to analyze its influencing factors, the results show that:
(a)
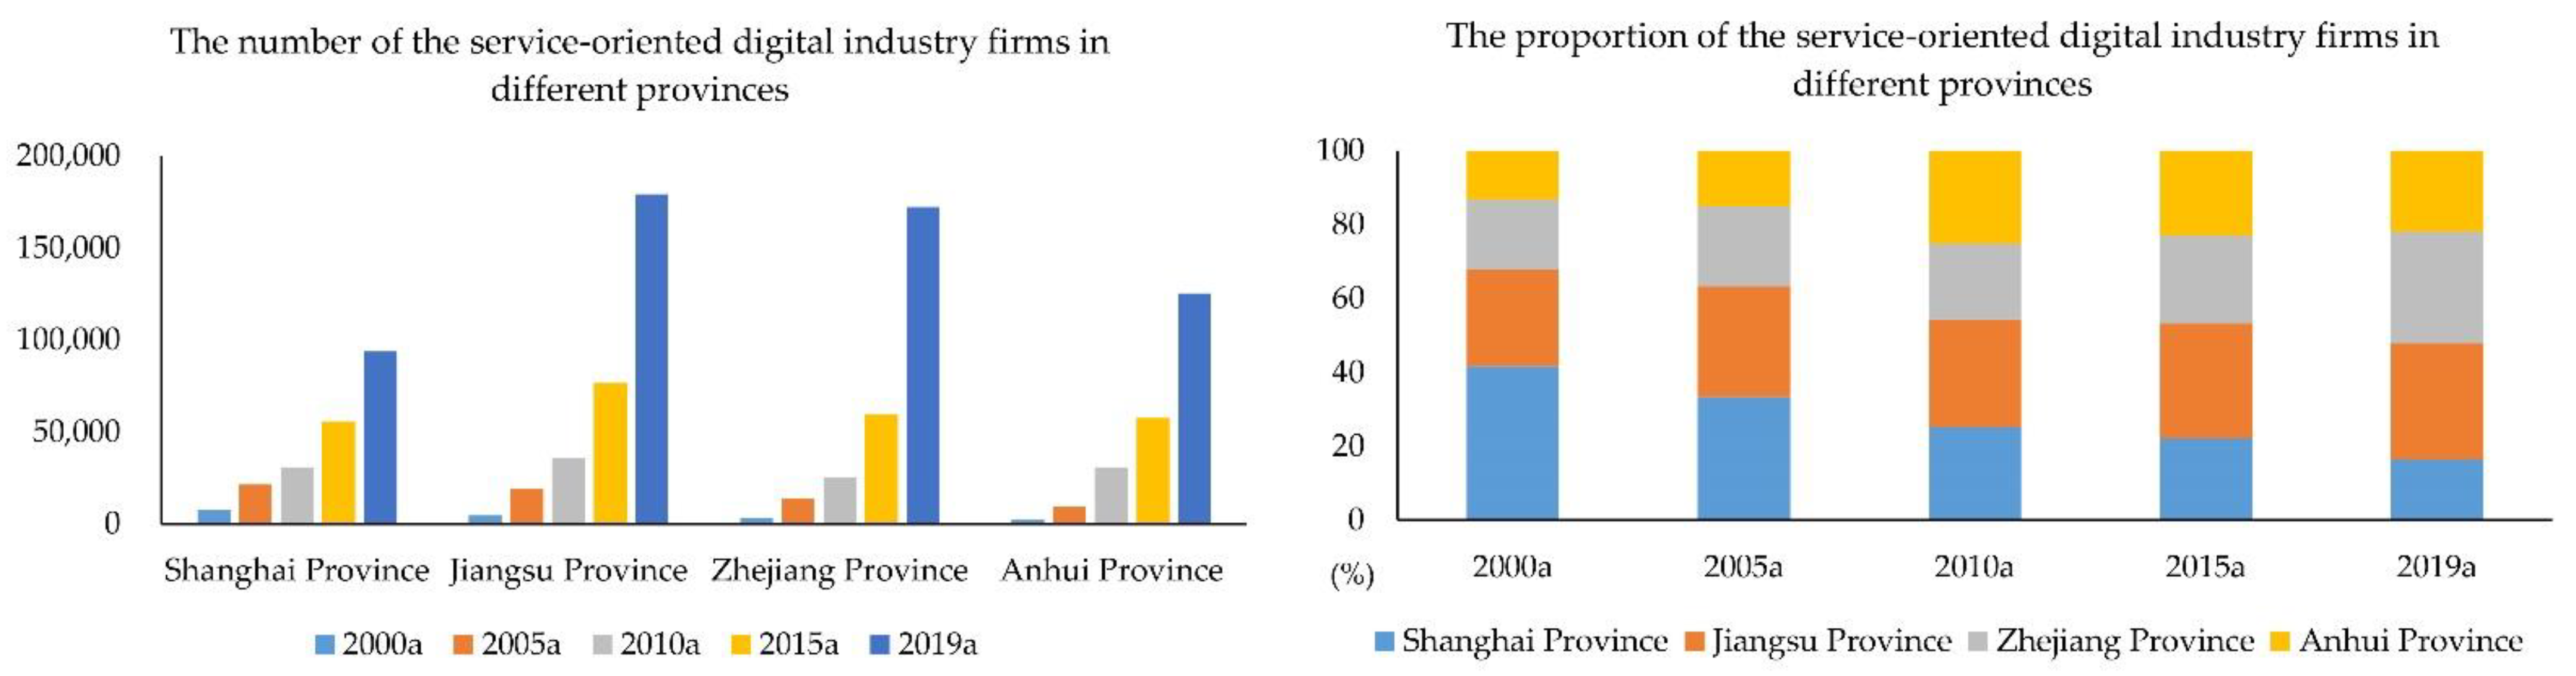
The service-oriented digital industry in the Yangtze River Delta has witnessed rapid growth and large changes in the total number of firms. In terms of provinces, the growth rates of each province and city are quite different. Among them, Anhui has the largest growth rate, the Zhejiang Province has the second largest growth rate, the Jiangsu Province has the third largest growth rate, and Shanghai has the smallest growth rate in the number of firms.
(b)
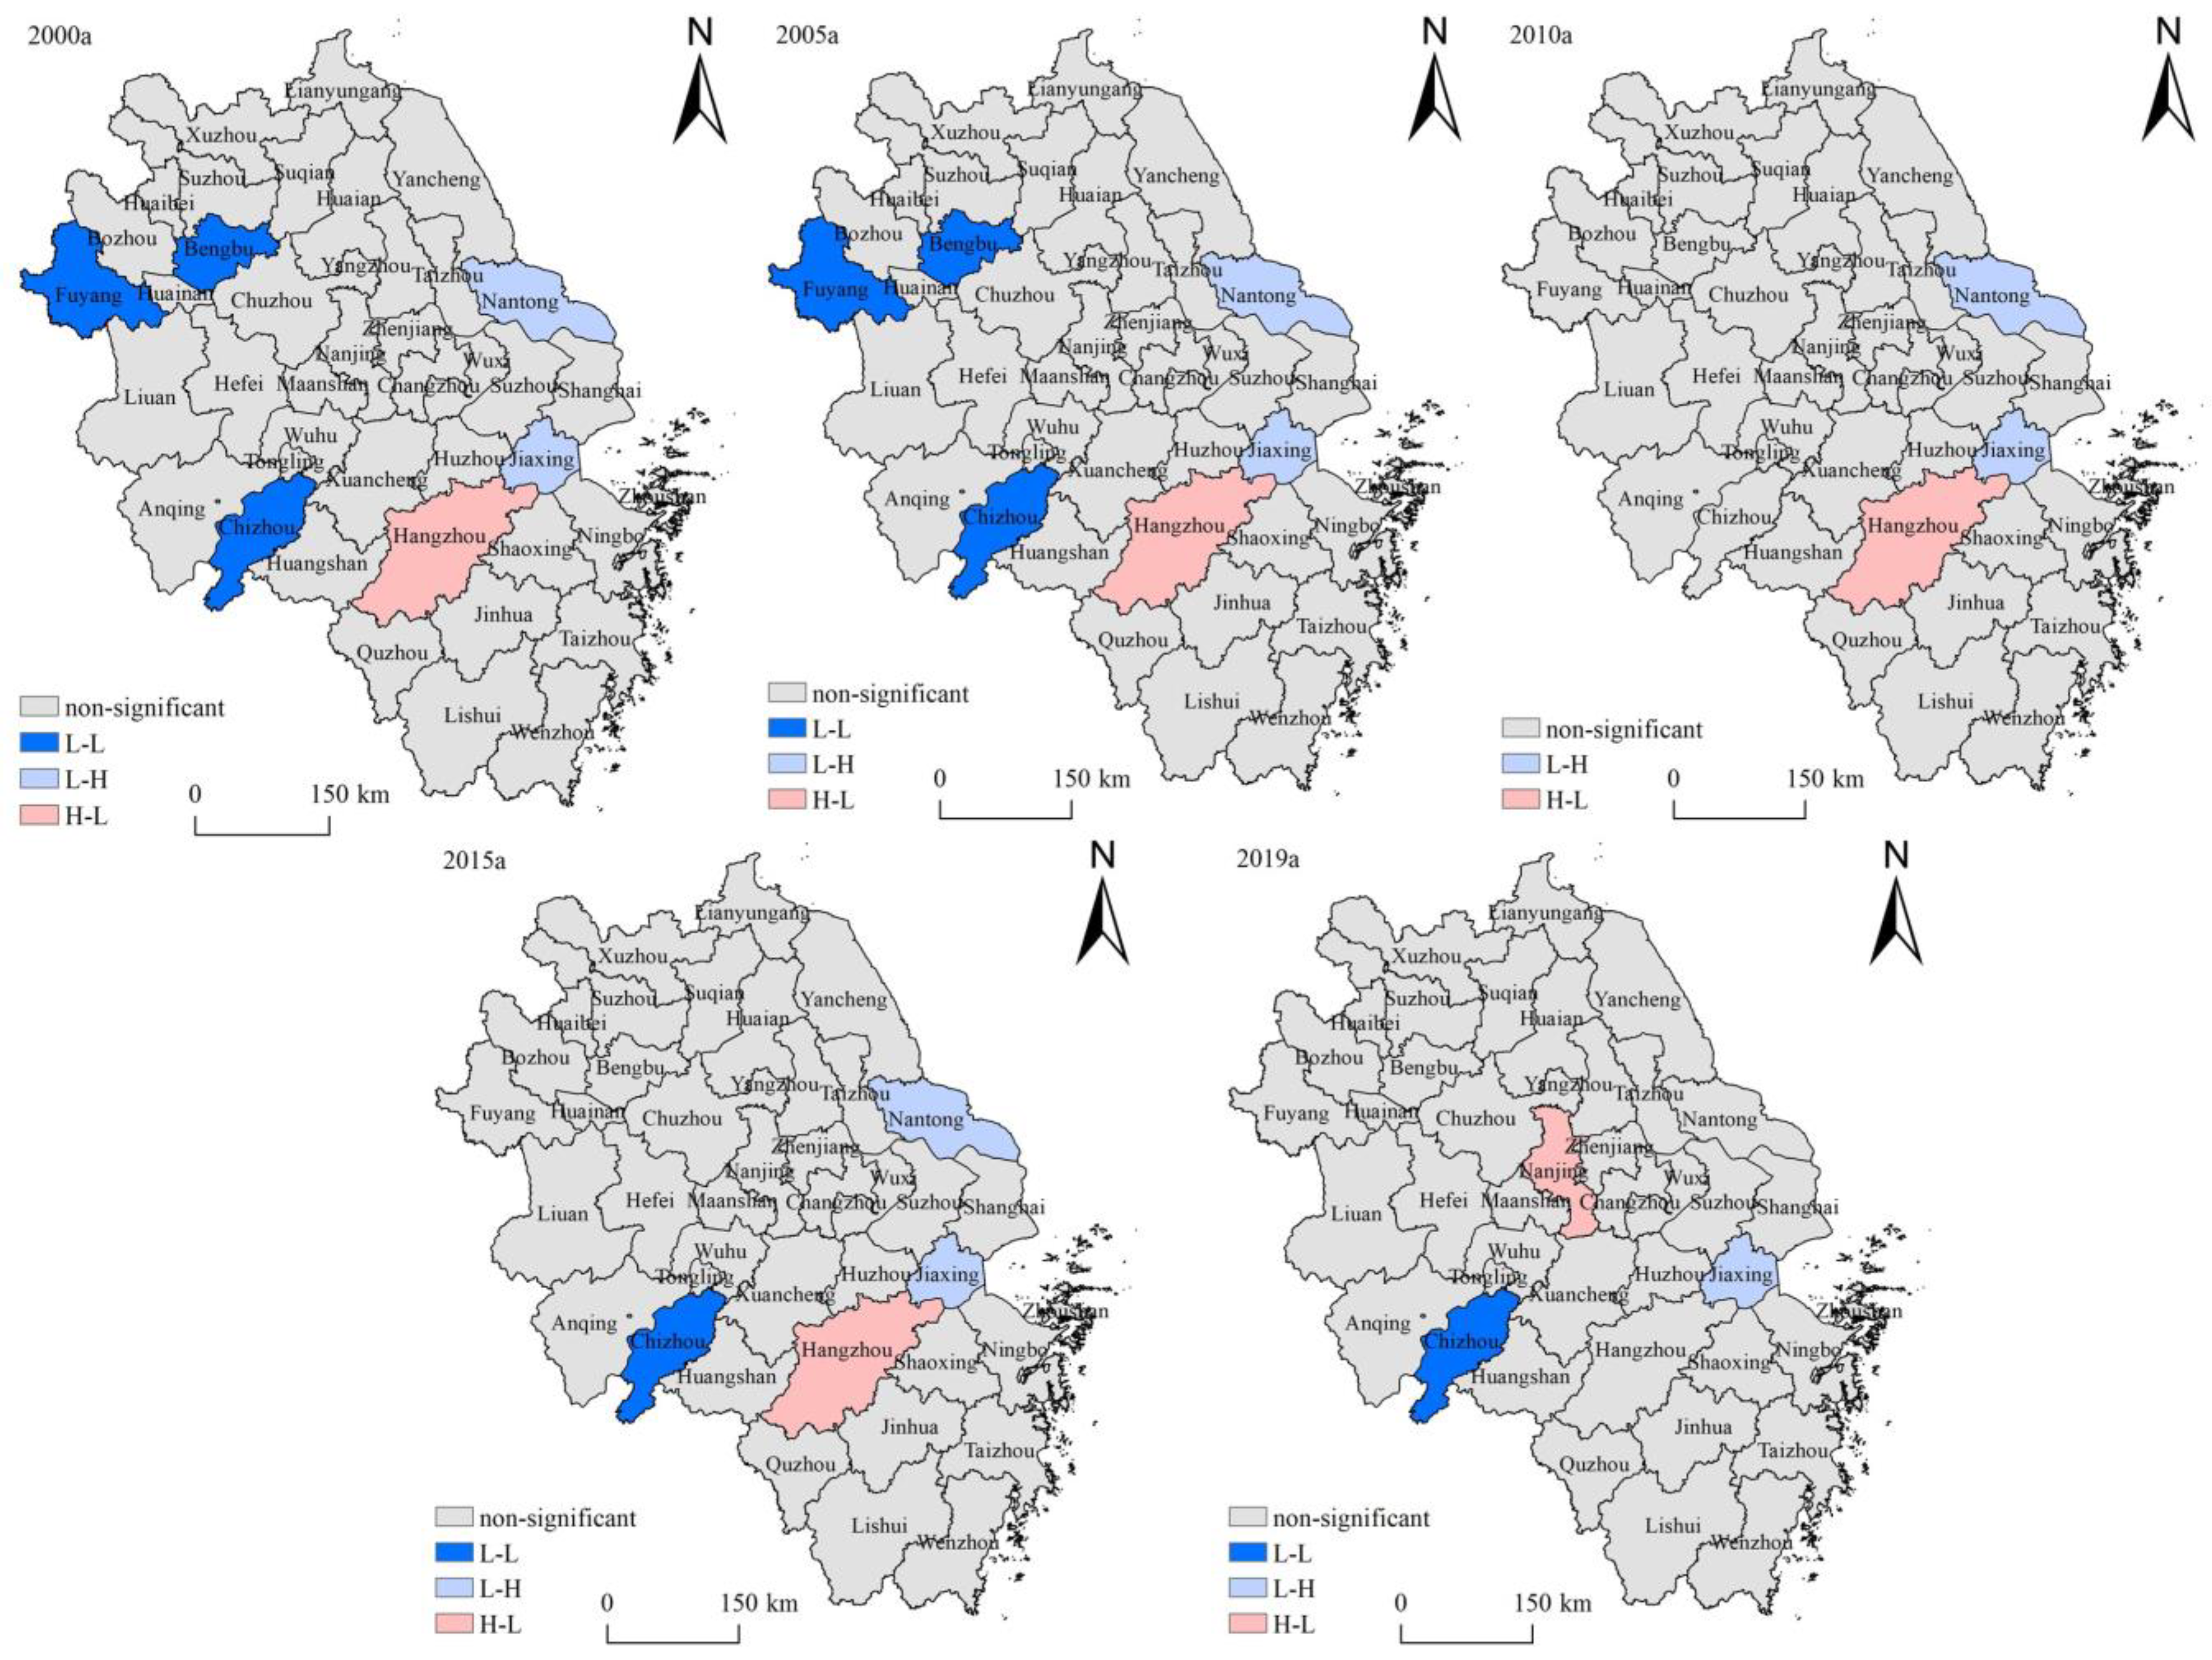
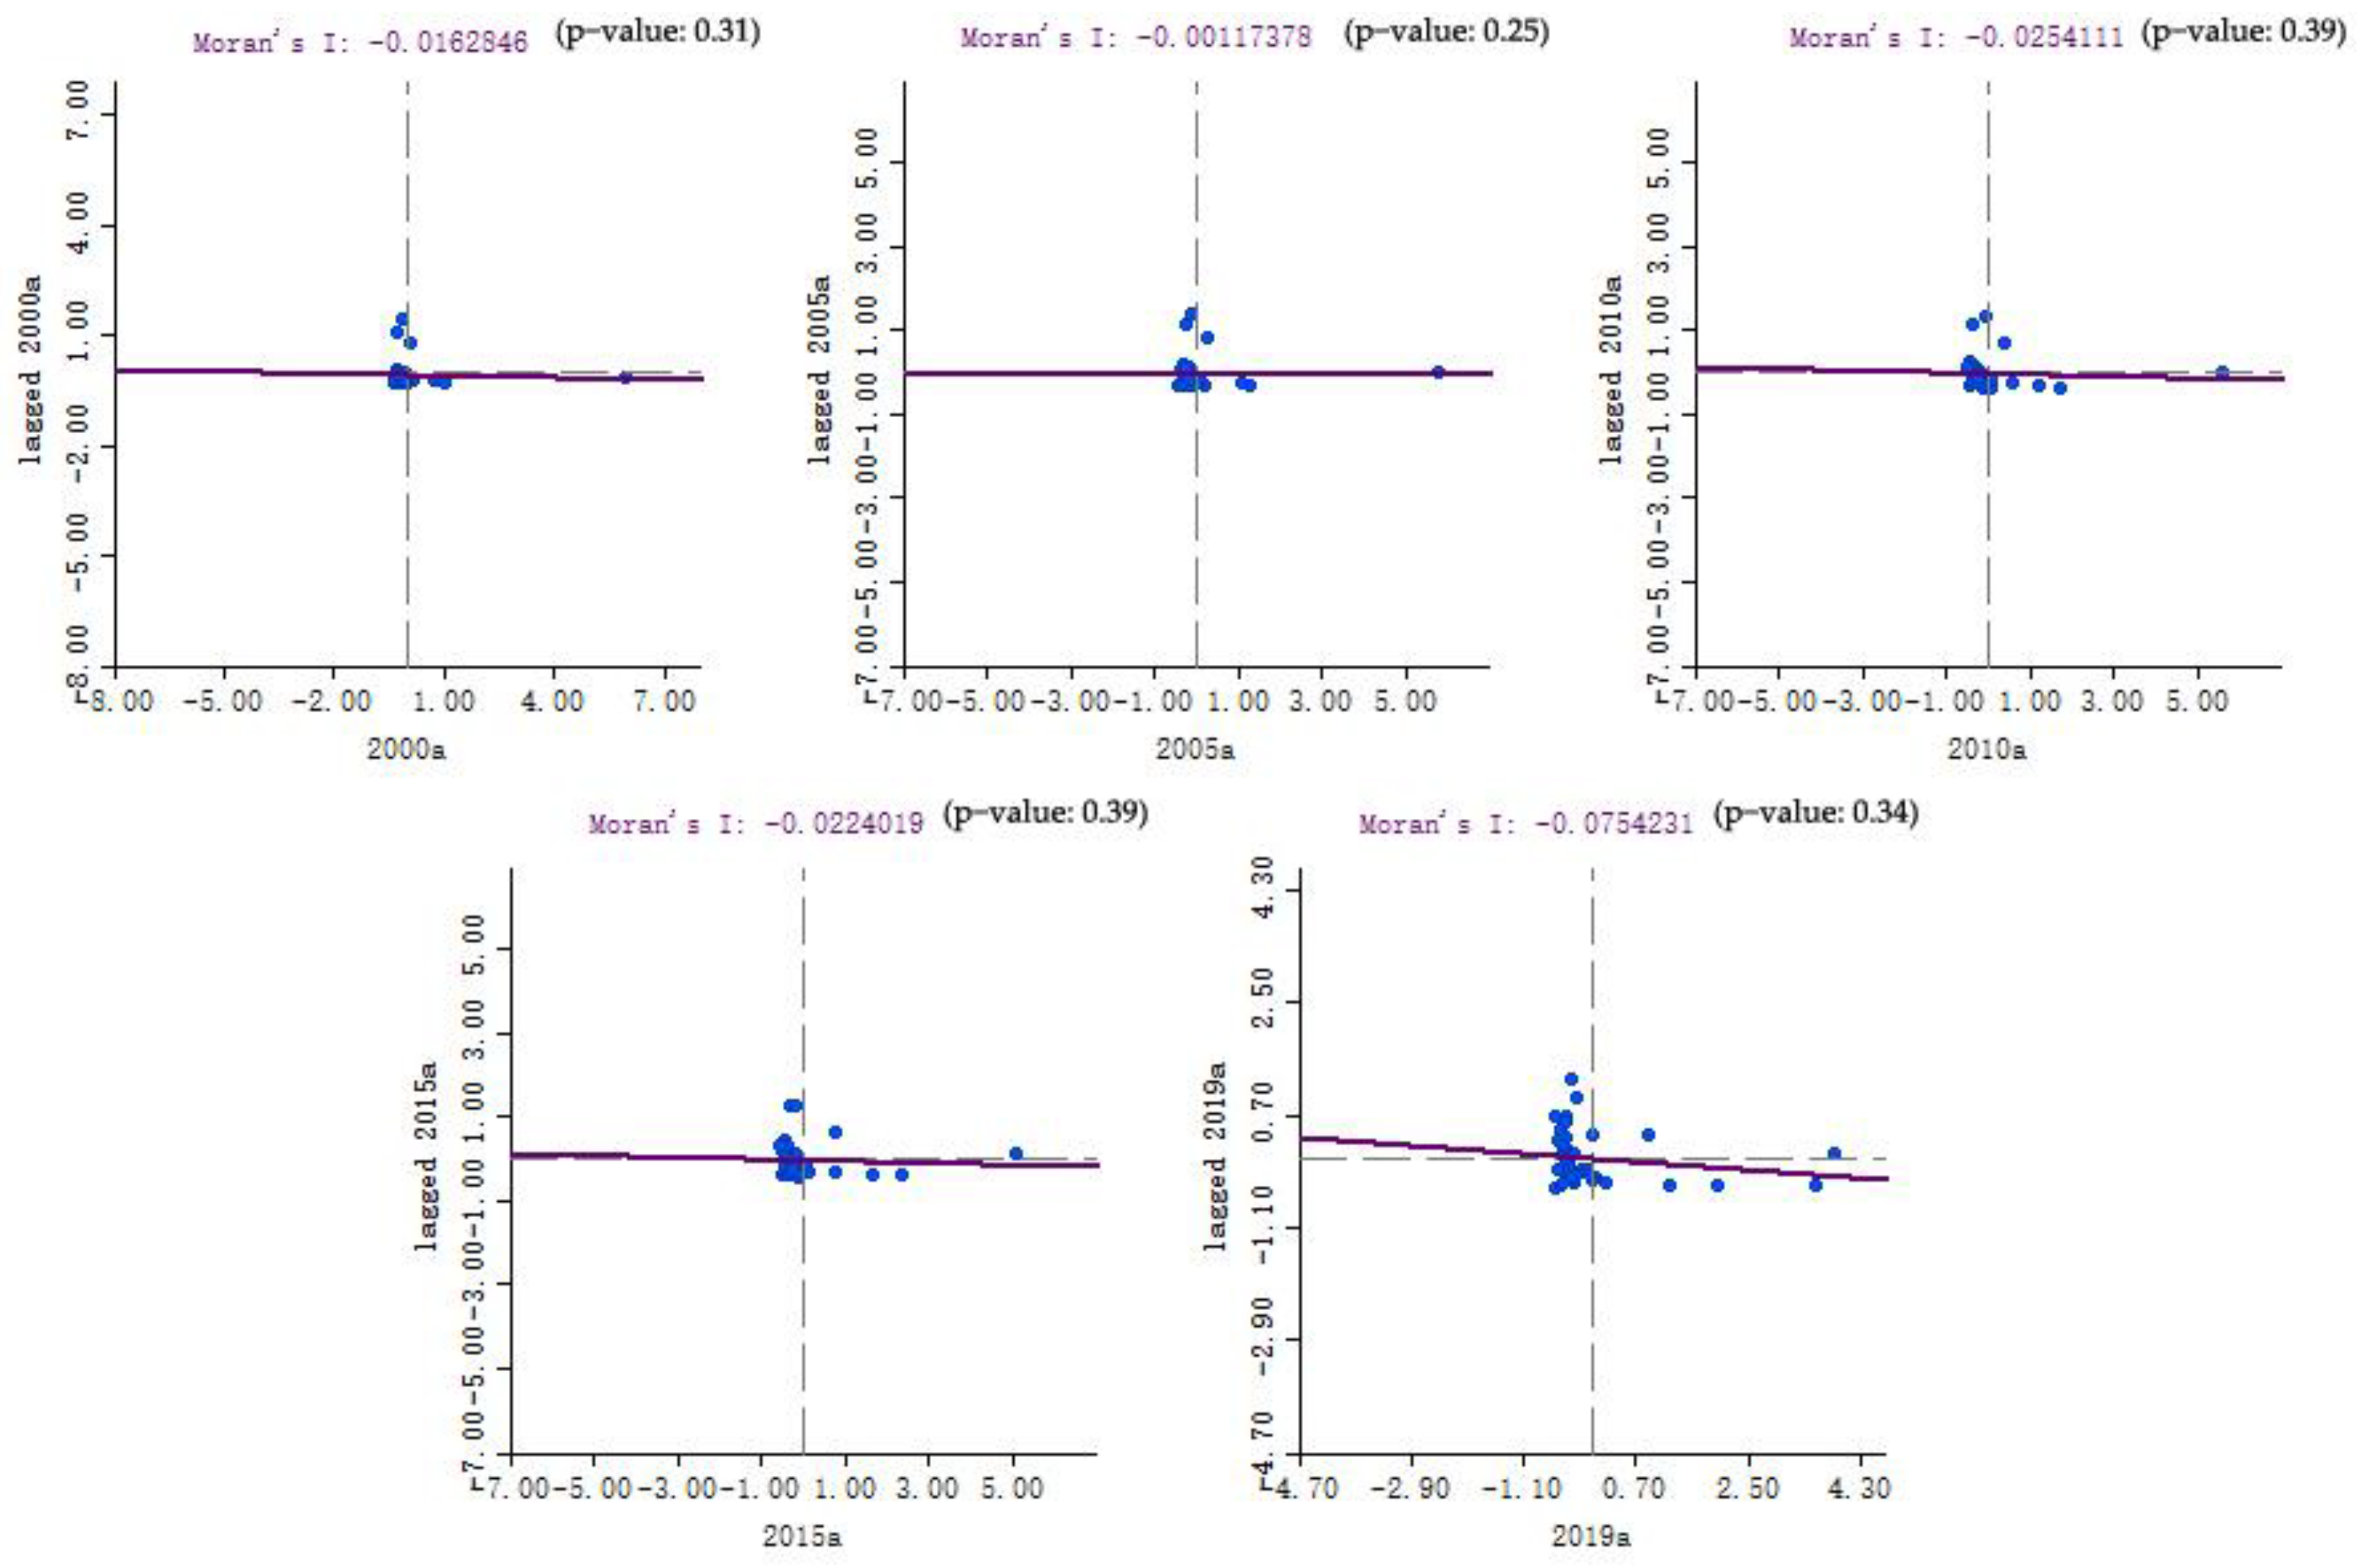
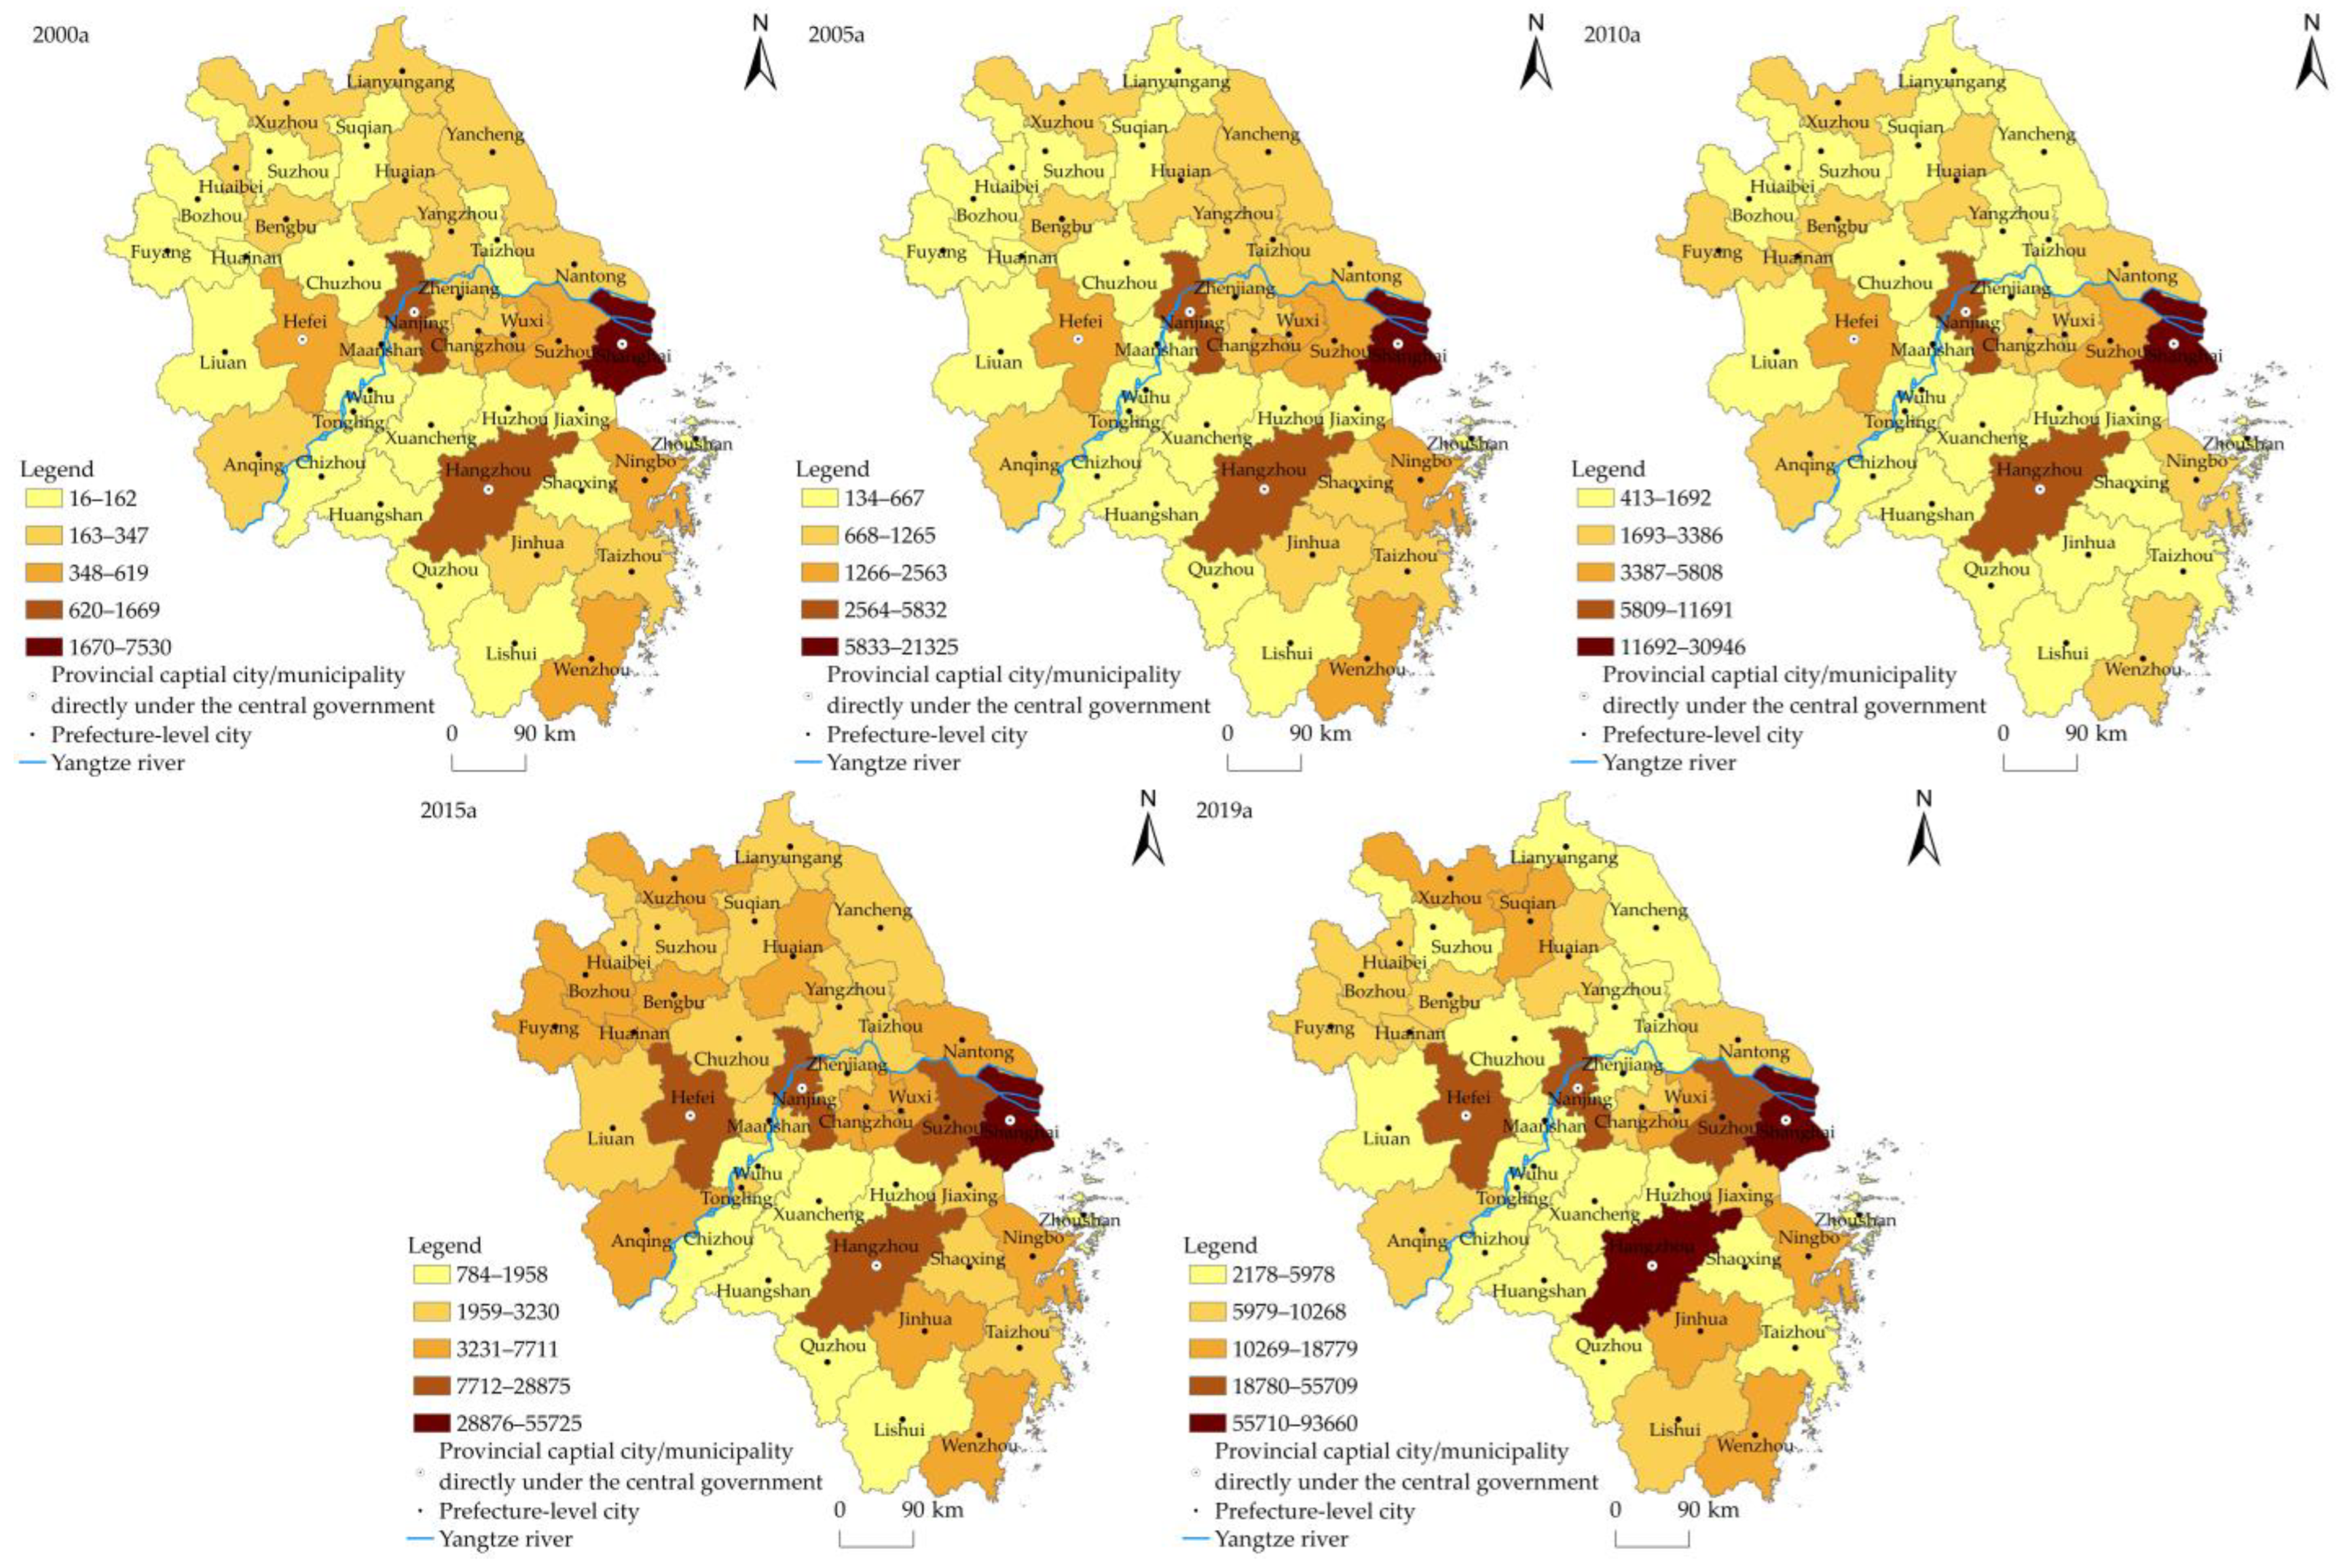
The number of the service-oriented digital industry firms in various cities in the Yangtze River Delta varies greatly, showing an obvious core–periphery structure. There are many enterprises in municipalities and provincial capitals, which are the core areas. The number of firms in non-provincial capital cities is small and they are marginal areas. The total number of firms has formed a high-value cluster area dominated by the estuary of the Yangtze River Delta, while the northwest of the Jiangsu Province, the northeast of the Anhui Province, and the southwest of the Zhejiang Province have all formed a low value cluster area. There are significant differences in the spatial differentiation of firms in different years. In 2000, the spatial pattern showed obvious differences between the east and the west, with a large number of firms in the eastern region and a small number in the western region and presented an obvious core–periphery structure. In 2005, the difference between east and west was more significant and the core–periphery structure was still obvious. In 2010, the difference between the east and the west slowed down, the core–periphery structure was significant and a high-value cluster with Shanghai as the center was formed. In 2015, the spatial pattern showed significant differences between the north and the south. With the Yangtze River as the boundary, there were more firms in the northern regions and less in the southern regions. In 2019, there was no obvious east–west difference or north–south difference and the core–periphery structure was still significant.
(c)
From the perspective of the influencing factors of the location selection of firms in the service-oriented digital industry, the basis of social and economic development, location, innovation ability, and business environment have different degrees of influence on the location choice of enterprises. Specifically, the per capita GDP, industrial structure upgrading, whether it is a municipality directly under the Central Government/provincial capital city, whether it has opened high-speed rail, information transmission, number of employees in the computer service industry, number of patent applications, Internet infrastructure level, and scientific fiscal expenditure have a significant positive impact on its location choice and the per capita total social consumer goods have a significant negative impact on its location choice.

5.2. Discussion

The research contribution of this paper is in broadening the research data and updating the research period of the service-oriented digital industry. Based on the micro-digital firm data, this paper analyzes the latest characteristics of firm location selection since the 21st century and explores the influencing factors of its location selection. In addition, in the empirical study, this paper has verified the previous actual situation. For example, cities with higher per capita social consumer goods may have more physical consumption but less online shopping and virtual consumption. Some consumption has not been included in the statistics, resulting in a large number of tax losses.
For each indicator, this paper proposes corresponding strategic goals and tools to achieve the rapid development of the service-oriented digital industries in the Yangtze River Delta region and other regions (Table 6).
Through the results of this study, it is found that there are still problems worthy of further discussion. This paper does not explore the spatial distribution and influencing factors of the manufacturing-oriented digital industry, nor does it analyze the similarities and differences between the spatial and temporal distribution of the two types of digital industries and their influencing factors. The existing studies have shown that there are differences between the two types of digital industries in terms of time and space evolution, but there is still no distinction in the identification of influencing factors, so research is worth further deepening. Especially after the impact of COVID-19 for nearly three years, has the location choice of the service-oriented digital firms changed significantly [47]? How to change? What is the mechanism of change? At present, the existing research is still unclear and needs to be further deepened.
Of course, this paper has some limitations. First of all, the impact of the yearbook data has not been updated for 2021. Secondly, the data of individual variables in 2000 were missing. Although they were supplemented by interpolation, there were still some differences. In addition, this paper chooses whether there is high-speed rail in the city that year as a variable, which does not fully conform to the level of urban traffic connectivity. Some of the research uses data such as train trips. However, due to the lack of data before 2010, they are not included in the indicator selection. Follow-up research needs to be further deepened.

Author Contributions

Conceptualization, J.Z. and B.Z.; methodology, J.Z. and B.Z.; software, Y.F.; validation, J.Z. and B.Z.; formal analysis, Y.F.; resources, Y.F.; data curation, J.Z. and B.Z.; writing—original draft preparation, J.Z.; writing—review and editing, J.Z. and B.Z.; visualization, Y.F.; supervision, Y.F.; project administration, Y.F. All authors have read and agreed to the published version of the manuscript.

Funding

This research was funded by the National Natural Science Foundation of China (Fund project host: Miao Changhong), grant number 42171186; The Major Project of China National Social Science Fund in Art (Fund sub-project host: Miao Changhong), grant number 21ZD03.

Data Availability Statement

Spatio-temporal big data includes the POI data of micro firms (https://sh.gsxt.gov.cn/index.html, accessed on 1 June 2022). The national firm credit information publicity system (https://sh.gsxt.gov.cn/index.html, accessed on 8 June 2022). China’s Urban Statistical Yearbook and China’s Regional Economic Statistical Yearbook (https://kns.cnki.net/, accessed on 15 June 2022).

Conflicts of Interest

The authors declare no conflict of interest.

References

  1. UNCTAD. Digital Economy Report 2019 Value Creation and Capture: Implication for Developing Countries; United Nations: New York, NY, USA, 2019; pp. 25–45. [Google Scholar]
  2. Jing, Q.P. The Emerging Digital economy; China Renmin University Press: Beijing, China, 1998; pp. 4–65. [Google Scholar]
  3. Mao, F.; Gao, Y.; Zhou, C. Evolution characteristics of spatial patterns of digital industry and its driving factors in the Yangtze River Economic Belt. Geogr. Res. 2022, 6, 1593–1609. [Google Scholar] [CrossRef]
  4. Chen, X.; Li, Y.; Song, L.; Wang, Y. Theoretical Framework and Research Prospect of Digital Economy. Manag. World 2022, 38, 208–224+213–216. [Google Scholar] [CrossRef]
  5. Wu, Y.; Wang, T. Research on the Statistical Definition and Industrial Classification of Digital Economy. Stat. Res. 2021, 38, 18–29. [Google Scholar] [CrossRef]
  6. Bukht, R.; Heeks, R. Defining, conceptualising and measuring the digital economy. Dev. Inform. Work. Pap. Ser. 2017, 68, 1–24. [Google Scholar] [CrossRef] [Green Version]
  7. National Bureau of Statistics. Statistical Classification of Digital Economy and Its Core Industries (2021). Available online: http://www.stats.gov.cn/xxgk/tjbz/gjtjbz/202106/t20210603_1818135.html (accessed on 27 May 2021).
  8. Zhang, X.; Wu, T. Research on spatial differentiation patterns of China’s provincial digital economy development. World Surv. Res. 2019, 10, 34–40. [Google Scholar] [CrossRef]
  9. Wang, B.; Tian, J.; Cheng, L. Spatial differentiation of digital economy and its influencing factors in China. Sci. Geogr. Sin. 2018, 38, 859–868. [Google Scholar] [CrossRef]
  10. Zhong, Y.; Mao, W. Spatial differentiation of digital economy and its influencing factors in the Yangtze River Economic Belt. J. Chongqing Univ. Soc. Sci. Ed. 2020, 26, 19–30. [Google Scholar] [CrossRef]
  11. Yuan, F.; Wei, Y.; Chen, W. Spatial agglomeration and new firm formation in the information and communication technology industry in Suzhou. Acta Geogr. Sin. 2010, 65, 153–163. Available online: https://kns.cnki.net/kcms/detail/detail.aspx?dbcode=CJFD&dbname=CJFD2010&filename=DLXB201002005&uniplatform=NZKPT&v=dwWPUfiS6rPWSiMw_TG_SERJ94d3Ug6j8HQ0b-tCUQK8_nAuQoMfGdooB13zfbIL (accessed on 1 June 2022).
  12. Lin, J.; Zhang, X.; Wang, M. Agglomeration and spatial evolution of the internet of things industry in Shanghai metropolitan. Hum. Geogr. 2017, 32, 131–137, 145. [Google Scholar] [CrossRef]
  13. Scott, A.J. Industrial organization and the logic of intra-metropolitan location: I. theoretical considerations. Econ. Geogr. 1983, 59, 233–250. [Google Scholar] [CrossRef]
  14. Wang, Z.; Mao, K.; Liu, X. An analysis for location factors that cause industrial agglomeration. Acta Geogr. Sin. 2005, 4, 567–576. Available online: https://kns.cnki.net/kcms/detail/detail.aspx?dbcode=CJFD&dbname=CJFD2005&filename=DLXB200504006&uniplatform=NZKPT&v=0-BIUiNLOgRaKQTE9Slmwk_4jdIf1lG8DizfeR9NhMFTZJHKZ0bdFTLIjp_5013t (accessed on 1 June 2022).
  15. Liu, Y.; Guo, Q.; He, C. Urban characteristics and firms’ location selection. Geogr. Res. 2016, 35, 1301–1313. [Google Scholar] [CrossRef]
  16. Liu, C.; Wang, Z.; Li, X. Spatial pattern evolution and location choice of internet startups: A case study of Hangzhou. Econ. Geogr. 2021, 41, 107–115. [Google Scholar] [CrossRef]
  17. Yang, F.; Du, D.; Duan, D. The intra-metropolitan location of R&D: Intensive manufacturing in Beijing and Shanghai. Sci. Geogr. Sin. 2017, 37, 492–501. [Google Scholar] [CrossRef]
  18. Deng, Z. Analysis of the advantages and disadvantages of China’s digital economy development based on the industrial division. Econ. Rev. J. 2020, 4, 67–76. [Google Scholar] [CrossRef]
  19. OECD. OECD Digital Economy Outlook 2015. Available online: https://www.oecd-ilibrary.org/science-and-technology/oecd-digital-economy-outlook-2015_9789264232440-en (accessed on 13 July 2021).
  20. Yao, Z. Regional marketization level and digital economic competition: Based on the analysis of digital economic index inter—provincial spatial distribution feature. Jianghan Trib. 2020, 12, 23–33. Available online: https://kns.cnki.net/kcms/detail/detail.aspx?dbcode=CJFD&dbname=CJFDLAST2021&filename=JHLT202012003&uniplatform=NZKPT&v=cOhPE6mYQ1mtsRwmnCnYsfA7SAxSkXUUnHlQuN5C4g1dFryLoQy_99qDsSqmdHVx (accessed on 1 June 2022).
  21. Tian, J.; Wang, B.; Wang, S. Spatial differentiation of urban digital economic development and its causes in northeast China. Areal Res. Dev. 2019, 38, 16–21. [Google Scholar] [CrossRef]
  22. Wang, J.; She, G. Measurement and regional comparison of digital economy development level in China. China Bus. Mark. 2021, 8, 3–17. [Google Scholar] [CrossRef]
  23. Zhang, L.; Hu, B.; Wang, S. Research on the evolution mechanism and characteristics of digital economy. Stud. Sci. Sci. 2021, 39, 406–414. [Google Scholar] [CrossRef]
  24. Jiao, S.; Sun, Q. Research on the measurement of China’s digital economy development and its influencing factors. World Surv. Res. 2021, 7, 13–23. [Google Scholar] [CrossRef]
  25. Peng, W.; Han, D.; Yin, Y.; Yang, Y. Spatial Evolution and Integrated Development of Digital Economy in Beijing-Tianjin-Hebei Region. Econ. Geogr. 2022, 42, 136–143+232. [Google Scholar] [CrossRef]
  26. Cox, K.R. Location and Public Problems: A Political Geography of the Contemporary World; Maaroufa Press., Inc: Chicago, IL, USA, 1979; pp. 45–63. [Google Scholar]
  27. Zhang, W.J. The economics of Location; The Commercial Press: Beijing, China, 2022; pp. 221–235. [Google Scholar]
  28. Kang, J.J.; Wang, M.F. Spatial Pattern Evolution and Influencing Factors of Digital Economy Service Industry in Shanghai. Shanghai Econ. 2021, 4, 14–26. Available online: https://kns.cnki.net/kcms/detail/detail.aspx?dbcode=CJFD&dbname=CJFDLAST2021&filename=SJIN202104003&uniplatform=NZKPT&v=-xEyXlyTYy6ryDCvXyj43CL8f9uSl-1KTwP6ZH9l8El2y0M1cXrdTQA_ZDAnxbrU (accessed on 1 June 2022).
  29. Kang, J.J.; Zhang, F.; Ning, Y.M. Value allocation and China’s evolving role in the global value chains of iPhone parts. Prog. Geogr. 2019, 38, 395–406. [Google Scholar] [CrossRef]
  30. Xu, W.; Zhou, J.; Liu, C. The impact of digital economy on urban carbon emissions: Based on the analysis of spatial effects. Geogr. Res. 2022, 41. [Google Scholar] [CrossRef]
  31. Li, Z.J.; Zhang, S.G.; Niu, Z.W.; Yuan, W.R.; Liu, Q. Theoretical logic, Comparative Analysis, and the Countermeasures of Doing Business Assessment in Chinese Cities. J. Manag. World 2021, 37, 98–112+118. [Google Scholar] [CrossRef]
  32. Zhou, W. Data Empowerment: The Theoretical Logic and Optimization Path of Digital Business Environment Construction. Truth Seek. 2022, 4, 30–42+110. Available online: https://kns.cnki.net/kcms/detail/detail.aspx?dbcode=CJFD&dbname=CJFDLAST2022&filename=QUAK202204004&uniplatform=NZKPT&v=kXcfJTujshqzcGmen5WkpZwtjrn8t2ep19ofTb_fXHvSNAM21ksdtf3tYFs8NENn (accessed on 1 June 2022).
  33. Qiu, J.; Wang, M. The temporal-spatial differences and influencing factors of internet development in China since 2020. Areal Res. Dev. 2010, 29, 28–32, 38. Available online: https://kns.cnki.net/kcms/detail/detail.aspx?dbcode=CJFD&dbname=CJFD2010&filename=DYYY201005006&uniplatform=NZKPT&v=uemvkw4drAb38nIlu2OWyOuKM9ryLbl69EcxE7no7wr3I304FTPvc4QEFVF-cVLk (accessed on 1 June 2022).
  34. Xiao, F.; Lin, J.J. High-speed rail and high-tech industry evolution: Empirical evidence from China. Transportation Res. Interdiscip. Perspect. 2021, 10, 100358. [Google Scholar] [CrossRef]
  35. Jiao, J.; Wang, J.; Zhang, F. Roles of accessibility, connectivity and spatial interdependence in realizing the economic impact of high-speed rail: Evidence from China. Transp. Policy 2020, 91, 1–15. [Google Scholar] [CrossRef]
  36. Bai, J.; Jin, W.; Zhou, S. Proximity and Knowledge Spillovers: Evidence from the Introduction of New Airline Routes. Available online: https://papers.ssrn.com/sol3/papers.cfm?abstract_id=3851753 (accessed on 1 June 2022).
  37. Chen, X.; Miao, Z. Spatial distribution of digital economic growth dynamics and regional income. Acta Geogr. Sin. 2021, 76, 1882–1894. [Google Scholar] [CrossRef]
  38. Xiao, F.; Wang, J.; Yujin, H.; Hengyu, G. Exploring the spatial and scale variation of factors affecting the geography of high-tech enterprises in China. Geogr. Res. 2022, 41, 1338–1351. [Google Scholar] [CrossRef]
  39. Sun, C.; Song, X. Total factor productivity of marine economy in China in the era of digital economy. Prog. Geogr. 2021, 40, 1983–1998. [Google Scholar] [CrossRef]
  40. Li, W.; Zheng, M. Is it Substantive Innovation or Strategic Innovation?—Impact of Macroeconomic Policies on Micro-enterprises’ Innovation. Econ. Res. J. 2016, 51, 60–73. [Google Scholar]
  41. Zhou, X.; Cheng, L.; Wang, H. Is the higher the level of technological innovation, the better the financial performance of enterprises—Empirical study based on patent application data of Chinese pharmaceutical listed companies in 2016 Research. J. Financ. Res. 2012, 8, 166–179. Available online: https://kns.cnki.net/kcms/detail/detail.aspx?dbcode=CJFD&dbname=CJFD2012&filename=JRYJ201208016&uniplatform=NZKPT&v=0v72DW-iZqgtfXPH75E4A7J0gga3HjIueeLMNZ17OYMq8U4Gnb4lMRPlQaNHhCoV (accessed on 1 June 2022).
  42. Li, H. The Spatial Distribution Chaiacteristics of China Higher Education Institutions and Their Influential Factors. J. High. Educ. 2021, 42, 40–47. Available online: https://kns.cnki.net/kcms/detail/detail.aspx?dbcode=CJFD&dbname=CJFDLAST2021&filename=HIGH202104005&uniplatform=NZKPT&v=-4m9-EW7O9dPl5xrJBSSMp1ZuFuF9EIOQbKpyutpC_D8GFD-0FIR-hm7RzQPr0qB (accessed on 23 October 2022).
  43. LI, T.; Sun, G.; Cui, G. Digital industrialization and industrial digitization: Two-way linkage, industrial network characteristics, and digital economy development. Ind. Econ. Res. 2021, 4, 54–68. [Google Scholar] [CrossRef]
  44. Institute, T.R. How Much Is the Impact of Higher Education on the Sluggish Development of Digital Economy? Available online: https://36kr.com/p/1243914050620678 (accessed on 28 May 2021).
  45. BaiDu. Weiya’s Tax Evasion Case. Available online: https://baike.baidu.com/item/%E8%96%87%E5%A8%85%E9%80%83%E7%A8%8E%E6%A1%88/59551306?fr=aladdin (accessed on 20 December 2021).
  46. News, N. Digital Economy Enables Suqian to Develop in High Quality as a “Famous E-Commerce City”. Available online: https://www.sohu.com/a/551847449_412025 (accessed on 27 May 2022).
  47. Wu, F.; Hu, H.; Lin, H.; Ren, X. Enterprise Digital Transformation and Capital Market Performance:Empirical Evidence from Stock Liquidity. Manag. World 2021, 37, 130–144+110. [Google Scholar] [CrossRef]
Figure 1. Local Moran’s I of the service-oriented digital firm.
Sustainability 14 14902 g001
Figure 2. Statistical test of local Moran’s I.
Sustainability 14 14902 g002
Figure 3. Total number of service-oriented digital industry enterprises in the Yangtze River Delta region.
Sustainability 14 14902 g003
Figure 4. Total number of service-oriented digital industry firms in each city.
Sustainability 14 14902 g004
Figure 5. The number of the service-oriented digital industry firms in different cities.
Sustainability 14 14902 g005
Table 1. Independent variable and expected signs of the firm location selection model in the service oriented digital industry.
Indicator SystemVariable NameVariable Name AbbreviationExpected Symbol
Social and economic development needsUrban economic development levelGDP per capitaGDP+
Upgrading of urban industrial structureProportion of added value of tertiary industry in GDPIndustStruct+
LocationMunicipality/provincial capital cityDummy variable, whether it is a municipality/provincial capital cityCity+
High-speed railDummy variable, whether there is high-speed railway in that yearRail+
Innovation capabilityHuman capital innovationNumber of colleges and universitiesUniversity+
Number of employees in information transmission and computer service industriesEmployee+
Technological innovationNumber of patent applicationsPatent+
Business environmentGlobalization levelActually utilized foreign capitalGlobal+
Marketization levelProportion of state-owned firmsState-owned
Market vitalityTotal retail sales of consumer goods per capitaMarketVitality+
Policy environmentScientific fiscal expenditure per capitaSciFiscal+
InfrastructureInternet InfrastructureInternet+
Ecological environmentPM2.5 concentrationPM2.5
Notes: “+” indicates positive correlation, and “−” indicates negative correlation.
Table 2. Descriptive statistics of independent variables.
VariablesVariable Description (Unit)MinimumMaximumMeanStandard DeviationVif
Urban economic development levelGDP per capita (RMB 10,000/Person)0.11015.8794.4983.7574.36
Upgrading of urban industrial structureProportion of added value of tertiary industry in GDP (%)25.1972.7341.1868.1792.24
Municipality/provincial capital cityVirtual variable, whether it is a municipality/provincial capital city010.0980.2975.36
High-speed railDummy variable, whether there is high-speed railway in that year010.4440.4982.15
Human capital innovationNumber of colleges and universities (Pieces)0678.71712.8278.08
Number of employees in information transmission and computer service industries (Person)700417,68014,826.19045,728.1304.33
Technological innovationNumber of patent applications (Pieces)0173,58611,167.56023,481.5005.37
Globalization levelActually utilized foreign capital (RMB 100 mn)0.0811314.02084.852158.6544.78
Marketization levelProportion of state-owned firms034255.97661.1381.30
Market vitalityTotal retail sales of consumer goods per capita (RMB/Person)916.71776,572.47017,102.74015,021.8404.83
Policy environmentScientific fiscal expenditure per capita (RMB 10,000/Person)0.0911689.132221.185327.5263.44
InfrastructureInternet Infrastructure (%)0.0022.3340.4210.4382.48
Ecological environmentPM2.5 concentration (um)2078.88548.28112.2171.19
Table 3. Pearson correlation coefficients of independent variables of the model.
VariableGDPIndustStructRailCityUniversityEmployeePatentGlobalState-OwnedMarketVitalitySciFiscalInternetPM2.5
GDP1
IndustStruct0.443

***
1
Rail0.690
***
0.291
***
1
City0.230
***
0.400
***
0.1031
University0.238
***
0.516
***
0.1090.882
***
1
Employee0.367
***
0.643
***
0.169
***
0.502
***
0.664
***
1
Patent0.544
***
0.610
***
0.236
***
0.382
***
0.544
***
0.761
***
1
Global0.555
***
0.504
***
0.307
***
0.528
***
0.675
***
0.772
***
0.715
***
1
State-owned−0.222
***
−0.0187−0.202
***
−0.055−0.002−0.005−0.009−0.1071
MarketVitality0.622
***
0.591
***
0.360
***
0.237
***
0.301
***
0.503
***
0.693
***
0.392
***
0.1091
SciFiscal0.554
***
0.540
***
0.279
***
0.347
***
0.457
***
0.569
***
0.797
***
0.563
***
0.723
***
0.0081
Internet0.448
***
0.467
***
0.245
***
0.178
**
0.212
***
0.345
***
0.533
***
0.275
***
0.753
***
0.0900.595
***
1
PM2.50.0890.129
*
0.146
**
−0.065−0.0550.00010.041−0.0650.110
***
−0.244
***
0.0380.182
***
1
Notes: ***, ** and * Indicate the significance level of correlation coefficient. *** represents p < 0.01, ** means p < 0.05, * represents p < 0.1.
Table 4. Regression results of the determinants of spatial variation of the firm location selection model in the service-oriented digital industry.
FactorsVariablesVariable Description (Unit)Coefficientp Value 1
Social and economic development needsUrban economic development levelGDP per capita (RMB 10,000/Person)949.1610.077 *
Upgrading of urban industrial structureProportion of added value of tertiary industry in GDP (%)1614.9020.005 ***
LocationMunicipality/provincial capital cityVirtual variable, whether it is a municipality/provincial capital city6351.8970.001 ***
High-speed railDummy variable, whether there is high-speed railway in that year3131.2870.000 ***
CreativityHuman capital innovationNumber of colleges and universities (Pieces)161.9340.862
Number of employees in information transmission and computer service industries (Person)5455.7170.000 ***
Technological innovationNumber of patent applications (Pieces)3958.4360.000 ***
Business environmentGlobalization levelActually utilized foreign capital (RMB 100 mn)−875.8960.119
Marketization levelProportion of state-owned firms−217.9850.483
Market vitalityTotal retail sales of consumer goods per capita (RMB/Person)−2399.9190.004 ***
Policy environmentScientific fiscal expenditure per capita (RMB 10,000/Person)1251.2630.025 **
InfrastructureInternet infrastructure (%)1311.7480.020 **
Ecological environmentPM2.5 concentration (um)−530.0660.258
Cons--−2589.540.001 ***
1p Value is Significance level. *** represents p < 0.01, ** means p < 0.05, * represents p < 0.1.
Table 5. Positive and negative results of influencing factors on the service-oriented digital industry in the Yangtze River Delta.
FactorsVariablesPositive
Influence
Negative
Influence
Social and economic development needsUrban economic development level
Upgrading of urban industrial structure
LocationMunicipality/provincial capital city
High-speed rail
CreativityCollege and University--
Employees in information transmission and computer service industries
Technological innovation
Business environmentGlobalization level--
Marketization level--
Market vitality
Policy environment
Infrastructure
Ecological environment--
In the formula: “√” indicates that there is an influence and “-” indicates that the influence is not significant.
Table 6. Directions and tools for the development of the service-oriented digital industry in the Yangtze River Delta.
DirectionsIndicatorsStrategic GoalsTools
Social and economic development needsUrban economic development levelAccelerate the development of digital industrialization and industry digitalizationDigital industrialization: enhance the innovation ability of key technologies (sensors, quantum information, etc.), improve the competitiveness of core industries, and cultivate new business forms and models (platform economy, etc.).
Industrial digitalization: based on different industrial characteristics and differentiated needs, promote the all-round and full-chain digital transformation of traditional entrepreneurship and improve total factor productivity.
Upgrading of urban industrial structureAdvanced industrial structure promotes high-quality development of digital industryCombine the industrial structure and resource endowment of cities in the Yangtze River Delta region, provide play to comparative advantages, and promote the development of service-oriented digital industry.
LocationMunicipality/provincial capital cityCreate a new digital city (Shanghai, Haizhou, Nanjing, Hefei, etc.)Deepen the construction of a new digital city, promote the integration and sharing of urban data and business collaboration, improve the urban comprehensive management service capacity, and improve the urban information model platform and operation management service platform.
High-speed railStrengthen the accessibility of urban high-speed rail networkRebuild the new logistics system and strengthen the formation of the “high-speed rail + e-commerce” development model.
Improve high-speed railway infrastructure.
Innovation abilityCollege and UniversityImproving the innovation ability of colleges and universitiesDeepen the development mode of universities, industry research cooperation, and implement the policy of double first-class universities and double first-class disciplines.
Employees in information transmission and computer service industriesCultivate and own digital industry talentsCultivate digital strategic management talents, in-depth analysis talents, product R&D talents, advanced manufacturing talents, digital operation talents, and digital marketing talents.
Accelerate talent introduction policy (settlement, subsidy, and high-level person time).
Technological innovationProtection of intellectual property rights such as patentsCarry out research and practical exploration on intellectual property protection system in new fields and formats such as big data and artificial intelligence. Promote the implementation of data intellectual property protection projects.
Business environmentGlobalization levelAccelerate the globalization of digital industryPromote the global development of emerging service capabilities such as data storage and intelligent computing. We will increase innovation in cooperation models in finance, logistics, e-commerce, and other fields, support digital firms in the Yangtze River Delta to “go global”, and actively participate in international cooperation.
Marketization levelOptimize the allocation of production factors of digital industryStudy data-right confirmation and classified and hierarchical management, smooth data transaction flow, realize market-oriented configuration of data elements, and promote transparency, standardization, and legalization of data-right confirmation, transaction, sharing, and protection.
Market vitalityStrengthen market vitality and improve digital tax policyStimulate domestic market demand, strengthen cross sectoral and cross regional division of labor and collaboration, promote the collection, sharing, and utilization of regulatory data, and improve the openness, transparency, and rule of law of regulation. Strengthen tax supervision and inspection.
Policy environmentIncrease financial supportFocus on supporting a group of key firms with core technologies and invest in high-end chips, integrated circuits, artificial intelligence, and other key software and hardware technologies to tackle key problems.
InfrastructureOptimize and upgrade digital infrastructureSpeed up the construction of information network infrastructure. Promote the development of cloud network collaboration and computing network integration. Promote intelligent upgrading of infrastructure.
Ecological environmentAccelerate ecological environment controlGovernance of regional ecological environment and digital enabling ecological environment governance.
Publisher’s Note: MDPI stays neutral with regard to jurisdictional claims in published maps and institutional affiliations.

