Abstract
Many conferences, exhibitions, and trade shows planned in the early days of COVID-19 were canceled or postponed, and only some events were able to convert quickly to virtual events by using existing virtual conference and exhibition platforms. This study examined whether the virtual convention platform, combined with advanced technologies, can enhance the trust in Seoul city and further influence the attitude and intention to use Virtual SEOUL 2.0. Furthermore, this study applies the Extended Technology Acceptance Model (ETAM) framework to identify external variables that affect perceived usefulness and ease of use and describes how practitioners embrace the new convention technology of Virtual SEOUL 2.0. The 300 usable survey data were collected and used to identify the proposed hypothesized relationship of seven latent constructs. The hypothesized relationships were tested by structural equation modeling (SEM). The analytic results confirmed the proposed hypothesized relationship among these seven constructs (Personal innovativeness, Perceived ease of use, Perceived usefulness, Perceived trust of Seoul, Perceived enjoyment, Attitude toward using Virtual SEOUL 2.0, and Intention to use Virtual SEOUL 2.0). More interestingly, the study’s findings provide that perceived trust in a smart city is an essential factor that directly or indirectly enhances users’ intention to use technology.
1. Introduction
The convention industry constantly evolves, applying innovative technologies to create new opportunities and enhance competitiveness [1,2]. Technology advancements have also affected how conventions are delivered, enabling virtual conventions where participants can access meetings and exhibitions via mobile devices from their homes or offices [3]. Increasingly, smart MICE (meetings, incentive travels, conventions, and exhibitions) have been introduced, especially during the pandemic, which is defined as the integration of innovative high-technologies services in the MICE industry [4]. The keys to successful smart MICE are to improve the efficiency of agencies, enhance the service quality for attendees and suppliers, and facilitate the interactions among stakeholders [4]. Online MICE can be represented as the combination of online conferences and exhibitions. According to Virtual Edge Institute (VEI), an organization dedicated to advancing event engagement and marketing programs through technology, a virtual event is a live meeting conducted using a virtual platform [5]. The virtual platform is implemented as a 3D virtual environment and video streaming, while providing presenter-participant live interaction, brainstorming events, and virtual industry exhibitions [6,7].
Recently, the population of the concept of open innovation (OI) platforms influenced the company/organizations to attract new ideas to create new products and expand markets for the use of innovations. According to Ober [8], motivation factors in using OI platforms were identified such as; to access to new technologies, sharing knowledge, acquiring external cooperation partners, and complementing each other’s different skills when working with other external partners. These factors can be applied to answer why the MICE industry is also using virtual convention platforms.
Since virtual conventions provide networking opportunities and resolve concerns about personal circumstances, health, mobility, and cost, these types of conventions have been continuously held through various platforms [9]. The first virtual trade fair, the 1993 Convention View, provided simply recorded exhibition content attached to the HTML floor map. Recently, more virtual convention platforms that have created their own virtual event platform offer free or paid services [10,11,12].
The virtual convention industry has seen a rise in popularity with the COVID-19 Pandemic as many countries have closed borders or restricted movement within regions to restrict the spread of the coronavirus [10]. Many conferences, exhibitions, and trade shows planned in the early days of COVID-19 were canceled or postponed, and only some events were able to quickly convert to virtual events by using existing virtual conference and exhibition platforms [13].
However, increasing virtual conventions through virtual convention platforms may raise concerns that the expansion of various tourism industries facilitated by conventions and the consequent growth of cities will be hindered. Previous studies have shown that event tourism directly or indirectly affects the local economy and enhances a favorable image of a destination, contributing to the revitalization of various cities and regions [14,15]. As results of these studies, there is a concern that the positive image of the destination may be affected, and existing convention attendees will be attracted to the virtual convention or exhibition.
These questions can be answered with smart cities, where the impact of technology is growing by presenting new sustainable visions for cities or destinations [16,17]. The concept of a smart city combines ideas about how information and communication technologies can enhance the functioning of cities [18]. A smart city refers to the realization of the technological potential of a city through an organization to bring out the possibility of urban change [19]. Recently, the application of innovative technologies has been more prominent since, without using them, it is almost impossible for destinations to achieve successful market valorization of their geographical attributes [20]. Gretzel and Koo [21] presented an example of how various cities worldwide create smart cities and support and activate smart tourism consumption based on technological infrastructure. According to their research, London in the UK, Amsterdam in the Netherlands, and Busan in Korea have developed and provided applications representing each city. The names of applications representing each city are Visit London, iBeacon Mile, and TaaS (Travel as a Service) in order. These applications provide tourism information and local services for the respective city and take a position as a smart tourism platform. In particular, in Finland, Helsinki provides travel services using virtual reality and helps Helsinki grow as a smart tourism city. The technical support with these programs also provides solutions for issues beyond simple travel information. For example, London’s Justpark solved traffic congestion, and Korea’s delivery service applications offer English service. These cases demonstrate how developing a platform that applies the growing technologies can affect the image of a city.
Seoul, Korea, is making various efforts to revitalize MICE and tourism in Seoul and to enhance the image of Seoul as a smart city. Seoul Convention Bureau, which opened in 2019, conducts overseas marketing and Public Relations (PR) activities to develop MICE content. The Virtual SEOUL 2.0 that Seoul Convention Bureau creates and distributes is a virtual event platform that provides virtual conferences, exhibitions, online PR booths, online team building, business meetings, and information about various regions and cultures of Seoul. Seoul Convention Bureau offers Virtual SEOUL 2.0 free to revitalize the Seoul convention industry. According to Gretzel and Koo [21], technologies can affect the trust and image of a city. Therefore, Virtual SEOUL 2.0 might serve as a technology that leads and develops trust and a positive image for the city. Accordingly, this study examined whether the virtual convention platform, combined with advanced technologies, can enhance trust in Seoul and further influence the attitude and intention to use Virtual SEOUL 2.0. Furthermore, this study applies the Extended Technology Acceptance Model (ETAM) framework to identify external variables that affect perceived usefulness and ease of use and describe how practitioners embrace the new convention technology of Virtual SEOUL 2.0.
This paper first assesses the current literature on smart technology, virtual platform, and the extended technology acceptance model (ETAM) in the tourism and convention industry context. Additionally, then, it goes on to outline the research design of the quantitative study approach while developing the hypothesis based on the hypothesized structural relationship and describing the research findings. With the findings of the study, it highlights several theoretical and managerial implications and discusses limitations and suggestions for future research.
2. Literature Review
2.1. Smart Destination and Technology
In the context of tourism, smart destination competitiveness can be defined as a destination’s compatibility to provide tourists with high-quality travel experiences and enhance residents’ quality of life while adopting various innovative technologies and managing tourism resources effectively [22]. In recent years, Internet-based technologies, social networking tools, and the proliferation of information and communication technologies have allowed smart cities to achieve a unique selling proposition and make the overall experience for tourists visiting these destinations more distinctive, fun, and convenient [23]. On the other hand, according to Coca-Stenfaniak [24], it is essential to consider that smart cities and smart tourism destinations of the future need to understand what tourists want rather than just depend on innovative technologies. As the Pandemic ends, most worldwide destinations need to provide more complex combinations of attractions to increase tourist numbers and enhance unique personalized experiences. It is believed that these multi-attraction travel experiences can be increasingly promoted via the developments of ICT (Information communication technology) [22]. Past research supports that the ICT for smart destinations plays a vital role in the connection of various platforms including attractions, places, or destinations, which facilitate information distribution and navigation, finally contributing to the augmentation of the satisfaction and loyalty of the destination [25]. Similar to smart destinations, smart MICE (Meetings, Incentive travels, Convention & Exhibition) aims to improve visitors’ personalized experience and enhance service quality through the comprehensive application and integration of ICTs in MICE [4]. Smart MICE can be considered as the combination of the online (virtual) conference and online exhibition; thus, it is valuable to unveil how the virtual conference platform can improve work efficiency and make the MICE more flexible, which can lead to the enhancement of all stakeholders’ experience in the conference and exhibition industry.
2.2. Virtual Convention Platform
2.2.1. Virtual Convention Platform
A conference is an event where people gather together to exchange information and build relationships. Various terms have been used interchangeably, such as meeting, summit, assembly, and congress [26]. An exhibition is an overall marketing program in which exhibitors display their company’s products and provide promotional opportunities through communication with target customers [27]. A convention is the combination of a conference and an exhibition. It provides programs where people can experience both events, such as training seminars, sales meetings, press briefings, and product launch exhibitions [26]. The most traditional convention format for audience communication services was face-to-face (F2F) [28]. However, attending meetings and exhibitions during the Pandemic was difficult since there were so many factors to consider, including personal circumstances, health, mobility, cost, accessibility, and safety of the venue. Virtual convention solves these concerns because it allows participants to access the real-time on-site meetings and exhibitions via their own mobile device, regardless of location and time [3]. Technology advances redefine the convention’s fundamental framework by introducing new platforms, such as a virtual convention platform that includes conferences and exhibitions [6].
A virtual convention platform is implemented within 3D virtual environments and video streaming that provides information to participants who want to access various places online, enabling participants to access multiple areas and interact with participants [6]. Sarabipour [7] explained various programs and functions offered by the virtual conference platform. For instance, presenters and participants can have live conversations, Q and A sessions, electronic poster sessions, and follow-up discussion sessions. Beyond that, they can also participate in brainstorming events, virtual industry exhibitions, or conferences using audiovisual technology. According to the research about virtual exhibition platforms, virtual exhibition spaces are composed of real exhibition decorations in 3D (3D virtual relics, architecture, other artwork, etc.), content using imaging technology and visual effects, virtual reality (VR) painting, live audio communication, and visitors’ inventory, which can facilitate video conferencing more efficiently [12,29,30]. Through the virtual convention platform, conferences provide a lot of communication-focused functions since the value is more significant for networking [31]. At the same time, exhibitions emphasize the visual and audio functions since the value is in the restoration and explanation of actual exhibits or past artifacts [12,29].
The following platforms have been used for virtual conferences and general meeting platforms; Zoom, Microsoft Teams, Google Meet, Skype for Business, Cisco WebEx, GoToMeeting, ezTalks, Jitsi Meet, Doxy.Me, and Let’s Talk Interactive [10,11]. In addition, Zidianakis et al. [12] demonstrated that Google Arts and Culture, Inventing Europe, MUSEON, DynaMus, Scan4Reco, and VIRTUE are the most representative virtual exhibition platforms.
Since virtual meetings and exhibitions do not require moving to a physical location, they received even greater attention when face-to-face social activities were restricted globally due to the spread of COVID-19 [10]. Many researchers predict that the demand for these virtual conventions will continue post-COVID [6,10,32,33]. Therefore, it is valuable to explore which factors affect the adoption of this virtual convention platform.
2.2.2. Virtual SEOUL 2.0
Virtual SEOUL 2.0, hereafter Virtual SEOUL, is a 3D virtual meeting platform representing the actual city of Seoul, Korea. It is an all-inclusive business event solution capable of e-conferences, virtual exhibitions, 1:1 buyer-seller meetings, live discussions between participants, and entertaining events. Seoul Convention Bureau (SCB) launched it to continue to host international conferences throughout the Pandemic while introducing the new interactive digital world. Specifically, the 8th UIA (Union of International Associations) Round Table Asia-Pacific event presented new possibilities for promoting the host city even in a virtual conference setting with historical buildings and landmarks that mirror the South Korean capital.
Virtual SEOUL is a web-based program that works on any type of mobile device including cell phones and tablets. It provides a total of 9 virtual venues in Seoul and more than 20 virtual event functions. The 3D graphic of the leading tourism spots in Seoul, such as the Changdeokgung Palace and Nodeul Island at Hangang River, has been represented as a digital representation of real-life locations. Nine representative convention venues can hold different types of events such as e-conferences, live discussions, and meet-and-greets with a Seoul promotional booth and event for audience engagement. E-conference broadcasting offers various online conferences through live streaming and VODs and can run several breakout sessions simultaneously. It also offers a virtual exhibition function that can register promotional content in the exhibition booth and use various features such as hosting live streaming, shopping, storing visitors’ business cards, and showcasing products. The platform also has attendee and speaker management features, allowing organizers to send out real-time messages to attendees and providing technical support to attendees unfamiliar with virtual events. Organizers can also use the stamp tour and gamification features to induce more engagement from attendees and encourage visitors to stay longer on the platform. To reduce the burden of building a new platform in the MICE industry, anyone can use the platform for free to host an online or hybrid event. Figure 1 presents actual images of the Virtual SEOUL’s overview, conference hall, exhibition hall, and networking lounge.
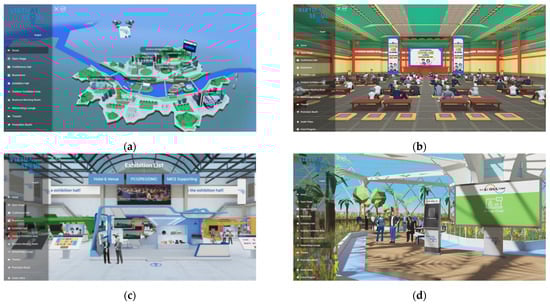
Figure 1.
Virtual SEOUL 2.0.: (a) Overview; (b) Conference Hall; (c) Exhibition Hall; (d) Networking Lounge.
3. Theory and Hypotheses
This section presents why this study uses the Extended Technology Acceptance Model (ETAM) framework. More specifically, the relationship between initially developed TAM factors and other extended factors that predict users’ behavioral intention to use the innovative technology is explored through the literature review.
3.1. Technology Acceptance Model (TAM)
The Technology Acceptance Model (TAM) was proposed by Davis [34,35] and Davis et al. [36] to explain the fundamental determinant of a user’s computer system acceptance behavior. The TAM has been applied in many studies [37,38,39,40,41,42,43,44] since it allows practitioners to predict the acceptability of particular technology’s system and identify the underlying causes of non-acceptance of it [35]. The TAM is configured by system design features, motivational variables (perceived usefulness, perceived ease of use, and attitude toward using), and actual system use [34]. In this model, motivational variables mediate between system design features and actual system use, and perceived usefulness is influenced by perceived ease of use. Several decades since the TAM was proposed, it has been established as a sturdy, powerful, and succinct model for predicting users’ system acceptance [45]. Especially, TAM has proven to be among the most effective models in virtual reality (VR) system literature for forecasting user acceptance behavior. For example, it has been used to verify the user’s technology acceptance ability in VR-based sports training studies [40,41], VR tours [38,44], and VR educational activities [42,43].
3.2. The Extended Technology Acceptance Model (ETAM)
Although the TAM is easy to apply to various technologies, it has limitations in reflecting information about individual opinions [46]. The Extended Technology Acceptance Model (ETAM) is the alternative model that overcame the above limitations [45]. Venkatesh and Davis [45,47] stated that it is necessary to understand better the antecedents and determinants of perceived ease of use and perceived usefulness, which are drivers of users’ behavioral intention to use technology and to predict users’ acceptance better. They explained that perceived usefulness and perceived ease of use are fundamental influencing factors affecting users’ attitudes, which can lead to determining users’ decision-making of whether to accept the new informational technology or system [45]. Furthermore, it claimed that perceived usefulness and perceived ease of use would be influenced by several external stimuli [48]. Accordingly, Venkatesh and Davis [45] newly proposed the ETAM model considering the theoretical constructs of social influence processes and cognitive instrumental processes as determinants of factors confirming perceived usefulness and users’ behavioral intention to use.
In relation to the ETAM, it has also been confirmed that external variables can be antecedents or moderators of perceived usefulness and perceived ease of use, which can directly affect users’ behavioral intention to use. Previous studies were conducted to find external variables to strengthen the ETAM [49,50,51,52]. In particular, some research discovered external variables in the VR context. For example, Sagnier et al. [52] applied the ETAM to investigate user acceptance of virtual environment programs for aviation training purposes. The results of this study reported that the pragmatic quality of VR affects perceived ease of use, while hedonic quality stimulation and personal innovativeness influence perceived usefulness. Moreover, Yoo et al. [53] used the ETAM to discover what factors influence the adoption of smart tourism applications. The results indicated that perceived enjoyment has flow experience as the antecedent and directly affects the intention to use smart tourism applications.
In summary, external variables, including utilitarian/hedonic quality, personal innovativeness, perceived enjoyment, flow experience, and hedonic motivation, can create an ETAM that effectively predicts users’ behavioral intention to use technology. Therefore, this study employed the ETAM framework to identify external variables affecting perceived usefulness and ease of use and to explain how practitioners embrace the new convention technology of Virtual SEOUL.
3.2.1. Perceived Innovativeness
As new innovative technologies develop rapidly, it is essential to identify personal innovativeness, which is an individual characteristic that continues to powerfully influence users’ perceptions and decisions on the acceptance of technologies [54]. Personal innovativeness is an individual’s willingness to try or utilize new information technology [55]. People respond differently to new ideas, practices, or objects depending on their differences in individual innovativeness [56]. For example, people with high personal innovativeness have a more favorable attitude toward new technologies or ideas and are less resistant to change than people with low personal innovativeness [56,57]. According to previous literature, personal innovativeness plays a significant role in users’ behavioral intention to use technology [54,58]. Previous researchers explained that perceived innovativeness is a significant factor that should be considered in embracing virtual reality simulation or virtual communication technology. For instance, Fagan et al. [59] discovered that personal innovativeness had a direct positive impact on behavioral intention to use the virtual reality simulation in training, and Gupta et al. [60] proved that personal innovativeness affects both user’s intention and actual technology use for virtual communication technology.
Agarwal and Prasad [55] found that an individual’s perceived innovativeness, which has a strong influence on the use of new technology, also acts as an antecedent for the perception of a specific system in the field of information technology. Notably, they indicated that personal innovativeness directly affects perceived usefulness and perceived ease of use. For example, according to Bigne–Alcaniz et al. [61] and Joo et al. [62], personal innovativeness is a determinant that directly affects perceived ease of use in the process of people’s willingness to adopt mobile learning and online shopping. Fagan et al. [59] also revealed that personal innovativeness had a significant positive relationship with perceived ease of use and perceived usefulness in the process of the adoption of a virtual reality simulation, thus supporting Agarwal and Prasad’s study.
The results of past research on personal innovativeness suggest that it is an essential factor to be considered in using new technology. In detail, the influence of personal innovativeness on perceived usefulness and perceived ease of use has been continuously investigated. Still, it has been found that it affects only perceived ease of use or both perceived usefulness and perceived ease of use depending on the level of innovativeness. Therefore, it is necessary to explore whether an individual’s perceived innovativeness affects either or both perceived usefulness and perceived ease of use in adopting Virtual SEOUL. Virtual SEOUL is a new technology platform that provides various exhibitions and business information through virtual reality simulation within the platform enabling virtual communication. Therefore, according to previous literature, this study hypothesizes the following:
Hypothesis 1 (H1).
Perceived innovativeness has a positive effect on perceived ease of use.
Hypothesis 2 (H2).
Perceived innovativeness has a positive effect on perceived usefulness.
Previous studies suggest innovativeness affects trust in new products/services or providers. For example, Dai et al. [63] have proven that innovativeness directly affects trust in using emerging IT services. Kalinić et al. [64] suggested that more innovative consumers have greater trust in new products/services or providers. The findings contributed to the extension of the theoretical literature review, given that it elucidated the causal relationship between two variables, personal innovativeness, and trust in products/services or providers [65]. The results of the previous literature listed above suggest that an individual’s innovativeness may affect the trust in Seoul offering Virtual SEOUL. Accordingly, this study investigates the relationship between personal innovativeness and trust in Seoul, the Virtual SEOUL service provider. Therefore, this study hypothesizes the following:
Hypothesis 3 (H3).
Perceived innovativeness has a positive effect on the perceived trust of Seoul.
3.2.2. Perceived Ease of Use and Perceived Usefulness
Perceived usefulness is defined as “the degree to which a person believes that using a particular system would enhance his or her job performance,” and perceived ease of use refers to “the degree to which a person believes that using a particular system would be free of effort” [35] (p. 320). Davis et al. [36] explained that both variables are significant determinants and predictors of intention to use a new system immediately after the new system introduction and after time has elapsed. According to the study, one hour after the system introduction, people’s intention to use is jointly determined by perceived usefulness and perceived ease of use. After two weeks, perceived usefulness directly affects people’s intentions to use, and perceived ease of use indirectly affects people’s intentions to use through perceived usefulness. This means that perceived usefulness directly influences intentions to use a technology and mediates the relationship between perceived ease of use and a user’s behavioral intention to use. Multiple researchers have proven these findings of Davis et al.’s study [39,52,64,66].
Venkatesh and Davis [45] also found the effect of perceived usefulness on attitude toward new technology, meaning that perceived usefulness indirectly influences intention to use through attitude toward new technology. This result showed in a study investigating the intention to use VR technology. According to Lee et al. [39], perceived usefulness does not directly affect the intention to use a VR game, including a communication function. Still, it affects the intention to use through attitude toward a device. Moreover, Wu et al. [67] investigated the factors that motivate users to use virtual exhibitions since virtual exhibitions can play a role in communication, enabling communication and attracting attendees by inducing pleasure [68]. These previous studies revealed that attendees’ perceived usefulness influenced their intention to use virtual exhibitions through their attitude in the process of attendees’ adoption of virtual exhibitions.
With that in mind, the results of previous studies [38,44,65] indicated that perceived usefulness in using the virtual space was an essential factor that performs both a role as an independent variable that directly affects the attitude and a mediator role between perceived ease of use and attitude. In adopting the Virtual Seoul, it was essential to explore the direct or indirect relationships among perceived usefulness, perceived ease of use, and attitude. Accordingly, this study hypothesizes the following:
Hypothesis 4 (H4).
Perceived ease of use has a positive effect on perceived usefulness.
Hypothesis 5 (H5).
Perceived usefulness has a positive effect on attitude toward to use of Virtual SEOUL.
Moreover, some researchers found the importance of the relationship between perceived usefulness and trust in an online or mobile environment. For instance, McKnight et al. [69] stated that consumers’ perceptions of a brand’s website usefulness build trust in brands and platforms. Amin et al. [70] identified a positive relationship between perceived usefulness and trust in the service provider of a mobile website. In addition, Harrigan et al. [71] indicated that perceived usefulness positively affects trust in information on a website and in a provider who provides information. In situations where users may not directly know the service provider or product provider, it is essential to understand the factors determining a customer’s trust in a provider [72]. Therefore, in this study, the relationship between the perceived usefulness of the Virtual SEOUL service and the trust of the service provider, the city of Seoul, is investigated. Based on the existing literature, this study hypothesizes the following:
Hypothesis 6 (H6).
Perceived usefulness has a positive effect on the perceived trust of Seoul.
3.2.3. Trust in Smart city
Previous literature on trust revealed that building trust is a critical antecedent of risk-taking behaviors; trust can reduce perceived uncertainty and drive consumers to accept and use innovative technologies [73,74]. In general, trust is defined as an individual’s belief that the online service provider/vendor is reliable and fulfills its obligations [75]. There is another definition of trust in the government, which is referred to as ‘the public’s assessment of government based on their perception of political authorities’ agencies and institutions’ integrity and ability to provide services fulfilling the expectations of citizens’ [76] (p. 17). According to Habib et al. [77], when enhancing trust in technology developed by the government, trust in government is essential in facilitating users’ decision to adopt e-government services. The past research unveiled that the cognitive component of trust consisted of three distinct factors: benevolence, competence, and integrity of another party [37]. Benevolence reflects the belief that the trustee will not act opportunistically against the trustor, competence is defined as the perceived skills and knowledge of the trustee. In this study, competence refers to Seoul’s perceived skills and abilities. Integrity is the belief that trustees will be honest and fulfill their promises [37]. In the context of online business, past research demonstrated that when consumers initially trust their online vendors, they believe that adopting online business is beneficial to business performance and effectiveness, which can lead to a favorable attitude toward online shopping [78,79]. These observations led us to explore the relationship between trust in Seoul and attitude toward Virtual SEOUL and perceived enjoyment, respectively. Based on the previous research, this study hypothesizes the following:
Hypothesis 7 (H7).
The perceived trust of Seoul has a positive effect on attitude toward the use of Virtual SEOUL.
Hypothesis 8 (H8).
The perceived trust of Seoul has a positive effect on perceived enjoyment.
3.2.4. Perceived Enjoyment
Previous research has shown that when an individual’s behavior is triggered by an intrinsic motivation such as pleasure, the individual’s willingness to continue the same behavior is strengthened [80,81]. Davis et al. [82] defined perceived enjoyment as the degree to which a particular system is perceived as enjoyable to use by itself, excluding the performance results caused by the system. They applied perceived enjoyment to TAM to investigate whether it affects usage intention. In addition, van der Heijden [83] revealed that perceived enjoyment significantly influenced people’s attitudes and intentions toward website adoption. Ha et al. [84] also claimed that perceived enjoyment was critical in adopting mobile games since they can stimulate hedonic emotion.
Combining previous literature, studies on the relationship between perceived enjoyment and usage intention are divided into two categories. In the first category, studies confirm that perceived enjoyment affects usage intention directly [37,82,85]; in the other category, studies show that attitude mediates between perceived enjoyment and intention to use [34,39,86]. In this study, based on previous research results, hypotheses were established to investigate both whether perceived enjoyment directly affects the intention to use technology and whether it indirectly affects the intention to use technology by using a mediator of attitude:
Hypothesis 9 (H9).
Perceived enjoyment has a positive effect on attitude toward to use of Virtual SEOUL.
Hypothesis 10 (H10).
Perceived enjoyment has a positive effect on the intention to use Virtual SEOUL.
3.2.5. Attitude toward to use of Virtual SEOUL and Intention to use of Virtual SEOUL
In TAM, attitude toward a specific technology refers to the degree to which a user responds positively or negatively to using a specific technology. Behavioral intention to use a particular technology can be defined as the individual’s willingness to use a specific technology [49]. Various studies have demonstrated that an individual’s attitude toward technology mediates the relationship between perceived usefulness and their behavioral intention to use technology [35,39,45,49,51]. Thus, an individual’s attitude toward new technology directly influences their behavioral intention to use it. With the aim of confirmation, the current study tested that an individual’s attitude toward the Virtual SEOUL directly affected behavioral intentions to use it. Hence, the following hypothesis can be formulated:
Hypothesis 11 (H11).
Attitude toward to use of Virtual SEOUL has a positive effect on the intention to use Virtual SEOUL.
Based on the Extended Technology Acceptance Model (ETAM) and the relevant literature review above, the proposed conceptual framework is illustrated in Figure 2.
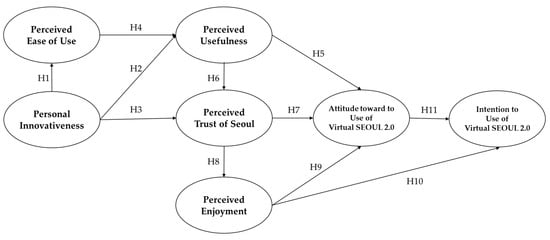
Figure 2.
Proposed Conceptual Framework.
4. Methodology
4.1. Measures
A standardized, self-administered questionnaire was developed from an extensive literature review. All variables used in this study were adopted from previous studies, and multiple items were used for each construct. Perceived ease of use and perceived usefulness were measured with six items and adapted from Chiu et al.’s study [37]. Personal innovativeness was measured by four items [64], while perceived enjoyment (four items) was adapted and modified from El-said and Aziz [87]. Attitude toward the use of Virtual SEOUL (four items) and intention to use Virtual SEOUL (five items) was adapted from Venkatesh et al. [88] and Chiu et al. [37]. Finally, perceived trust of Seoul was measured with eleven items consisting of benevolence, competence, and integrity, which were adapted and modified from the previous study [37,77]. We tested the content validity by asking two scholars and one office manager of the City of Seoul to evaluate all measurement items, checking if these measurements were appropriate for acceptance of Virtual SEOUL. Then, we also conducted a pretest for thirty-eight undergraduate and five graduate students. Some ambiguous items were revised for clarity. These measurement items were measured on a 5-point Likert-type scale ranging from 1 = ‘strongly disagree’ to 5 = ‘strongly agree’.
4.2. Data Collection
The online survey was conducted, and the sample was targeted to MICE-related organizations, meeting professionals, and exhibitors. The pilot test consisted of seven graduate students from the college attending a class. These students were provided with an English version of the instructional materials. They administered the survey, which was translated into Korean and back-translated by bilingual professionals in advance to ensure cross-language equivalence in meaning. Upon consent for their participation in the survey, the validated Korean version of the online survey was given to the meeting professionals, exhibition organizers, association managers, and DMOs who had experience in hosting or planning conferences, conventions, and exhibitions in Korea. More specifically, the research team approached the above potential participants based on their agreement; the online questionnaire was sent by e-mail. Further, the link to Virtual SEOUL with the explanation of the function was attached via email to facilitate answering the questions.
A total of 1500 questionnaires were distributed to the meeting professionals, exhibition organizers, and meeting association managers, and 325 questionnaires were completed, representing 21.6% of the response rate. Twenty-five questionnaires were eliminated because of insincere and missing responses; thus, 300 questionnaires were used as data for the analysis. According to Hair et al. [89], sample size requirements should be at least ten to one, which reflects a response to the variable ratio, and hence 300 responses were sufficient to proceed. The first part of the questionnaire asked whether the respondents had attended a virtual conference. 66% of the respondents had experienced attending the virtual conference, while 34% indicated ‘no experience’. 69% of the respondents were female. In terms of the years of working experience in the MICE industry, most respondents (81.4%) indicated less than 15 years. In addition, the respondents consist of 36.7% meeting professionals, 13.3% exhibition organizers, and 50% meeting association managers.
5. Results
The hypothesized relationships were tested using structural equation modeling (SEM), using Amos 26.0. The proposed model consisted of seven latent constructs: (1) Perceived ease of use, (2) personal innovativeness, (3) perceived usefulness, (4) perceived trust of Seoul, (5) perceived enjoyment, (6) attitude toward to use of Virtual SEOUL, (7) intention to use Virtual SEOUL. Confirmatory factor analysis with a robust maximum likelihood (MLR) estimator was performed to verify the relationship between observed variables and latent constructs in the measurement model. Following Anderson and Gerbing’s [90] recommendation of a two-step procedure, the construct validity was evaluated, and the measurement model was examined. Regarding the construct reliability and convergent and discriminant validity of seven primary constructs, each construct’s internal consistency reliability (ICR) was measured by computing the composite reliability coefficients. Bagozzi and Yi [91] suggested that all composite reliabilities should be above the 0.60 cut-off value. As shown in Table 1, the ICR values ranged from 0.80 (Perceived Innovativeness) to 0.91 (Perceived Trust of Seoul). Since none of the values for all seven constructs indicated less than 0.6, it can be said that the scales are reliable (see Table 1). This study examined the standardized factor loadings, construct reliability, and average variance extracted (AVE) from convergent validity [89]. Specifically, two perceived ease of use items, one item from personal innovativeness, four items from the perceived trust of Seoul, and two items from the intention to use Virtual SEOUL were removed due to the low standardized factor loadings (<0.60) [89,92]. The t-values for all the rest of the factor loadings were significant (p < 0.001), indicating satisfactory convergent validity. In addition, to ensure that the measure of one theoretical construct was not similar to the measures of other different theoretical constructs, Discriminant Validity (DV) was tested [93]. According to Kline [94], DV analysis can be confirmed when the estimated correlations of the constructs are not excessively high (>0.85) or excessively low (<0.1). As shown in Table 1, all values fell within the acceptable range, which indicated that the DV analysis of the constructs was supported.

Table 1.
Reliability, Convergent Validity and Discriminant Validity of Constructs.
The convergent validity was examined by the average variance extracted (AVE). It was recommended that AVE values higher than 0.5 are acceptable [95]. The AVE values for most constructs exceeded the threshold value of 0.5. In conclusion, the ICR, discriminant validity, and convergent validity of the current research model were all satisfactory.
Refereeing to Coetsee’s [96] suggestion, the Kaiser-Meyer-Olkin (KMO) Measure of Sampling Adequacy (MSA) and Bartlett’s Test of Sphericity tests were conducted before factor analysis. The results of the KMO and Bartlett’s tests are presented in Table 2. According to Hair et al. [97], equal to or greater than 0.6 is required for the MSA to be acceptable. Based on Table 2, it is confirmed that the data set complied with the requirements for sampling adequacy (0.895) and Bartlett’s Test. Thus, the next step of the factor analysis could proceed.
Table 2.
KMO and Bartlett’s Test Results.
Confirmatory factor analysis was used to assess the model’s seven dimensions. Each construct was measured using the multi-dimensional scales: Considering the goodness-of-fit indices for the measurement model, some standard critical indices, as suggested by Hu and Bentler [98], were examined. As shown in Table 3, the proposed measurement model was found to fit the data well: (χ2/df = 2.12, CFI = 0.93, IFI = 0.93, RMSEA = 0.059, RMR = 0.026). In addition, the convergent validity of the scales was confirmed as the CFA outputs indicated that all factor loadings were greater than 0.60 and were statistically significant [91].
Table 3.
Goodness-of-Fit Indices.
Subsequently, the structural model was tested. In the context of reasonable fit for the model, all the goodness-of-fit measures under investigation fell into acceptable ranges (χ2/df = 2.21, CFI = 0.93, IFI = 0.93, RMSEA = 0.064, RMR = 0.033), it can be claimed that the structural model for the current study provided a good fit to the data. Moreover, the regression coefficient of each proposed path coefficient was positive and significant except for the path coefficient from Personal Innovativeness to Perceived Usefulness (H2), from Personal Innovativeness to Perceived Trust of Seoul (H3), and from Perceived Enjoyment to Intend to use Virtual SEOUL (H10) as shown in Table 4, which indicated that most hypothesized relationships were supported in this study.
Table 4.
Standardized Path Coefficient of the Hypothesized Model.
More specifically, Personal Innovativeness had a significant relationship with Perceived Ease of Use (β = 0.55, p < 0.01) but was not associated with Perceived Usefulness and Perceived Trust of Seoul. Perceived Ease of Use had positively influenced on Perceived Usefulness (β = 0.87, p < 0.01). Moreover, the results of the structural model showed that Perceived Usefulness positively affected the Perceived Trust of Seoul (β = 0.78, p < 0.01) and Attitude toward to Use of Virtual SEOUL (β = 0.35, p < 0.01). In addition, the findings demonstrated that Perceived Trust of Seoul was significantly associated with Attitude toward to Use of Virtual SEOUL (β = 0.25, p < 0.01) and Perceived Enjoyment (β = 0.63, p < 0.01). More interestingly, Perceived Enjoyment had a positive impact on Attitude toward to Use of Virtual SEOUL (β = 0.54, p < 0.01), but not Intention to Use Virtual SEOUL. Finally, the results of the structural model showed that Attitude toward to Use of Virtual SEOUL significantly influenced Intention to Use Virtual SEOUL (β = 0.86, p < 0.01).
Furthermore, the fit of the structural model was examined by the Squared Multiple Correlations (R2) for structural equations, which implied that the amount of variance in each endogenous latent variable could be explained by the antecedent variables in the relevant structural equations. For the current research, the model explained 82 percent in Perceived Ease of Use, 79 percent in Perceived Usefulness, 58 percent in Perceived Trust of Seoul, 57 percent in Perceived Enjoyment, 84 percent in Attitude toward to Use of Virtual SEOUL, and 92 percent in Intention to Use Virtual SEOUL. In summary, the findings provided that most hypotheses were supported except for H2, H3, and H10. Figure 3 shows the overview of analysis results.
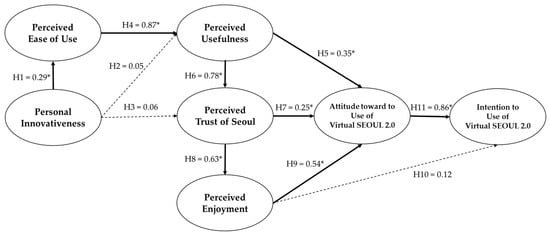
Figure 3.
Path coefficients of the research model. Note. Bold lines show significant paths, and dotted lines show no significant paths. * p < 0.01.
6. Discussion
6.1. Theoretical Implications
This study could be one of the few studies investigating practitioners’ intentions to adopt a new virtual convention platform technology specifically offered by the government (e.g., the City of Seoul). Although virtual convention platforms have become more popular during the Pandemic, research on the intentions of practitioners to use this technology is very limited in the tourism and hospitality field. Therefore, this study can contribute to the theoretical expansion of adapting the virtual platforms in terms of various virtual meetings, conventions, and events as below.
First, this study verified that the Extended Technology Acceptance Model (ETAM) could be practically applied to virtual MICE flatform research. The ETAM is a model that reflects information about individual opinions on technology adoption [45,46]. The results of this study show that the ETAM’s original variables, an individual’s perceived ease of use and perceived usefulness, and the external variables adopted for this study, including an individual’s perceived innovativeness, perceived enjoyment, and perceived trust, have a direct and indirect impact on the attitude and intention to use of Virtual SEOUL. The study statistically proves the relationship between all constructs of proposed hypothesized relationships through structural equation modeling (SEM) while confirming that the ETAM can be applied to future research in the context of the virtual MICE platform.
Furthermore, this study contributes to expanding knowledge about the ETAM’s external variable perceived innovativeness affecting the intention to use the virtual MICE platform. For example, the results of this study examined the role of personal innovativeness as antecedents of perceived ease of use and perceived usefulness. With the development of new technologies, the importance of identification of personal innovativeness has been emphasized in the adoption of various technologies [54,58]. According to Bigne-Alcaniz et al. [61] and Joo et al. [62], personal innovativeness affects only perceived ease of use depending on new technology. Nevertheless, Agarwal and Prasad [54] and Fagan et al. [58] reveal that personal innovativeness affects both perceived usefulness and perceived ease of use depending on the level of the new technology. The results of this study show that personal innovativeness directly affects only the perceived ease of use of Virtual SEOUL Bigne-Alcaniz et al. [61] and Joo et al. [62] studies. Additionally, this study indicates that perceived innovativeness does not directly impact the perceived trust of city government, so it does not support previous studies [63,64,65]. The current study implies that personal innovativeness may not be sufficient as an external variable with significant influence in using the virtual MICE platform. Considering that planning or organizing a convention or exhibition is not determined by personal innovativeness, it can be assumed that the age of the practitioners is younger than those from previous studies. Thus, the researcher should keep in mind proceeding with future research whether the practitioners are familiar with this type of technology regardless of their innovativeness.
Moreover, this study proves that the people’s perceived trust in the government providing new products/services reinforces the attitude and intention of using the technology. It also emphasizes that perceived trust is an essential factor in facilitating the decision to adopt the government-developed service. For instance, this study investigated the relationship between practitioners’ trust in Seoul and other variables, including perceived usefulness, perceived enjoyment, and attitude toward using Virtual SEOUL. According to the literature review, McKnight et al. [69] and Amin et al. [70] found that perceived usefulness positively affected trust in information providers of websites. Tussyadiah et al. [73] and Chi et al. [74] claimed that trust drives people to accept and use innovative technologies. The results of this study verified the findings of the previous studies. In detail, practitioners’ perceived usefulness of Virtual SEOUL directly affected practitioners’ perceived trust in Seoul, and practitioners’ perceived trust in Seoul directly affected their attitude toward using Virtual SEOUL, which directly influenced the intention to use Virtual SEOUL. These results explain that perceived trust in a smart city is an essential factor that directly or indirectly enhances users’ intention to use technology. This finding supports the study by Habib et al. [77] that trust in the government is an essential prerequisite for attitudes and behaviors toward the technologies and services provided by the government. Overall, the results imply that increasing users’ trust in the government is critical for cities to develop into smart cities by providing various technologies.
Lastly, this study theoretically supports the past literature on the indirect role of perceived enjoyment in examining the intention to use technology [34,39,86]. More specifically, this study found that perceived enjoyment indirectly affects the intention of practitioners to use the meeting platform Virtual SEOUL. This implies that perceived enjoyment of new technology can facilitate the intention to use it continuously.
6.2. Managerial Implications
Based on the findings of the current study, the following practical implications are put forward. Over the past two years, the Pandemic has brought about a significant change in the convention industry. The integration of ICTs (Information Communication Technologies), including the comprehensive platforms and various types of communication channels, is essential for the MICE stakeholders (e.g., convention/exhibition managers, convention visitor bureaus, meeting planners, and attendees), which can maximize their access to the various meeting formats and enhance their personalized experience to realize the resource sharing [4,34].
In particular, the results confirm a positive relationship between the perceived usefulness and the trust of the city government that offers the convention platform free of charge. Therefore, the current study emphasizes that cities need to develop strategic help when introducing these innovative technologies, which can be critically important in building trust in government. In addition, the findings suggest that the well-designed virtual convention platform can play a critical role in enhancing the positive attitude toward using the platform and improving the intention to use it continuously.
Moreover, the results of this study show that perceived enjoyment of the virtual convention platform can play a critical role in raising a positive attitude toward using the platform and ultimately increasing the intention to use the platform. This stresses the importance of enjoyment functions when the government creates or develops a future virtual convention platform.
By experiencing the convenience of virtual conferences and realizing the importance of face-to-face events, hybrid events that combine the strengths of these two types are expected to become the trend. Integrating the online and offline meeting services can heighten the output of the meeting industry and attract existing and future convention attendees. From a destination marketing perspective, it will be meaningful to activate the use of a virtual conference platform that represents the actual city as a marketing means of a smart city in the future.
7. Conclusions
The present study investigated whether a virtual convention platform combined with advanced technology can increase trust in Seoul and influence attitudes and intentions to use Virtual SEOUL. More specifically, this research explored factors that directly or indirectly affect trust in Seoul, attitudes, and intentions to use Virtual SEOUL.
First, this study introduced Virtual SEOUL, an existing platform of smart MICE (Meeting, Incentive travels, Convention & Exhibition). Smart MICE combines online (virtual) conferences and online exhibitions. It applies ICT to the MICE industry and, at the same time, emphasizes value co-creation and mutual benefits among stakeholders [4]. This study developed the hypothesis using the Virtual SEOUL, the latest virtual meeting platform that contains new contents for Seoul Convention Bureau (SCB), event organizers, and meeting planners.
Second, this study confirmed that the Extended Technology Acceptance Model (ETAM), an alternative model that overcomes the Technology Acceptance Model (TAM) [45], was able to apply to examining the attitudes and intentions of practitioners who want to use a specific type of technology, a virtual convention platform. The results of the regression coefficient of each proposed relationship showed a positive and significant relationship among these seven constructs: Personal innovativeness, Perceived ease of use, Perceived usefulness, Perceived trust of Seoul, Perceived enjoyment, Attitude toward using of Virtual SEOUL, and Intention to use of Virtual SEOUL.
Third, through this study, we identified three factors that directly or indirectly affect ETAM; personal innovativeness, perceived trust of Seoul, and perceived enjoyment. In summary, the personal innovativeness of practitioners directly affects the perceived ease of use of Virtual SEOUL. However, personal innovativeness does not directly affect perceived usefulness on Virtual SEOUL but affecting indirectly perceived usefulness through perceived ease of use. Practitioners’ trust of Seoul, which provides Virtual SEOUL, was found to be a critical factor that directly or indirectly raises the intention to use the technology of Virtual SEOUL. Practitioners’ perceived enjoyment of Virtual SEOUL was found to indirectly affect the intention to use Virtual SEOUL. These findings suggest that these three factors directly or indirectly constitute a significant relationship in ETAM.
Finally, in particular, the results of this study discovered that practitioners’ trust in Seoul, the provider of Virtual SEOUL, is an essential factor in deciding to utilize the service developed by the government. Practitioners’ perceived trust of Seoul influences attitude toward using Virtual SEOUL in various ways, directly affecting the intention to use Virtual SEOUL.
As with all research, the current study has limitations. This study was conducted using only one convention and meeting-related platform. Thus, the study’s findings cannot be generalized to all types of meetings platforms or communication channels. There is a need to conduct additional research that investigates other similar types of technologies to confirm whether the same hypothesized relationships still hold a broader spectrum of the MICE industry.
Moreover, the results of this study cannot generalize the participants’ intention to adopt government-provided technology. Governments or related organizations must conduct further research by collecting participants’ opinions on adopting government-provided technology to build a smart city.
Author Contributions
Conceptualization, W.L., J.P. and M.H.; methodology, M.H., W.L. and J.P.; formal analysis, W.L.; writing—original draft preparation, W.L. and J.P.; writing—review and editing, W.L., J.P. and M.H.—supervision, W.L.; project administration, J.P.; data collection, M.H. All authors have read and agreed to the published version of the manuscript.
Funding
This research received no external funding.
Institutional Review Board Statement
In relation to this study, there is no conflict or potential conflict that should be managed for several reasons. First, all participants aged 20 or older were selected for the research. Second, all subjects agreed to participate in the study. Additionally, all participants were informed that anonymity is assured. Third, there were adequate provisions to protect subjects’ privacy and maintain data confidentiality. Thus, this study does not suggest policies and procedures protect IRB-related activities from conflicts.
Informed Consent Statement
Informed consent was obtained from all subjects involved in the study.
Data Availability Statement
Not applicable.
Conflicts of Interest
The authors declare no conflict of interest.
References
- Kim, D.-Y.; Park, O. A study on American meeting planners’ attitudes toward and adoption of technology in the workplace. Tour. Hosp. Res. 2009, 9, 209–223. [Google Scholar] [CrossRef]
- Rose, N.; Steinbrink, S. Real and Virtual Meetings Technology; Phocuswright: New York, NY, USA, 2011. [Google Scholar]
- Mair, J. Conferences and Conventions: A Research Perspective; Routledge: Oxfordshire, UK, 2014. [Google Scholar]
- Liu, C.; Hung, K.; Wang, D.; Wang, S. Determinants of self-service technology adoption and implementation in hotels: The case of China. J. Hosp. Mark. Manag. 2020, 29, 636–661. [Google Scholar] [CrossRef]
- Exhibitor. Virtual Edge Institute Acquires Engage365. Available online: https://www.exhibitoronline.com/news/article.asp?ID=11760 (accessed on 17 January 2022).
- Samsonovich, A.V.; Chubarov, A.A. Virtual convention center: A socially emotional online/VR conference platform. In Brain-Inspired Cognitive Architectures for Artificial Intelligence: BICA*AI 2020; Advances in Intelligent Systems and Computing; Springer: Berlin/Heidelberg, Germany, 2020; Volume 1310, pp. 435–445. [Google Scholar]
- Sarabipour, S. Virtual conferences raise standards for accessibility and interactions. ELife 2020, 9, e62668. [Google Scholar] [CrossRef] [PubMed]
- Ober, J. Open innovation in the ICT industry: Substantiation from Poland. J. Open Innov. Technol. Mark. Complex. 2022, 8, 158. [Google Scholar] [CrossRef]
- Fraser, H.; Soanes, K.; Jones, S.A.; Jones, C.S.; Malishev, M. The value of virtual conferencing for ecology and conservation: Virtual conferencing. Conserv. Biol. 2017, 31, 540–546. [Google Scholar] [CrossRef] [PubMed]
- Lim, L.X.; Lim, P.E.; Lim, S.H.; Lim, Y.X.; Oktaviandra, A.G. Hi, let’s meet online! A study of virtual meeting platforms during the pandemic. Asia Pac. J. Manag. Educ. 2022, 5, 126–140. [Google Scholar] [CrossRef]
- Oehme, K.; O’Rourke, K.S.; Bradley, L. Online virtual supervised visitation during the COVID-19 pandemic: One state’s experience. Fam. Court Rev. 2021, 59, 131–143. [Google Scholar] [CrossRef]
- Zidianakis, E.; Partarakis, N.; Ntoa, S.; Dimopoulos, A.; Kopidaki, S.; Ntagianta, A.; Ntafotis, E.; Xhako, A.; Pervolarakis, Z.; Kontaki, E.; et al. The Invisible Museum: A user-centric platform for creating virtual 3D exhibitions with VR support. Electronics 2021, 10, 363. [Google Scholar] [CrossRef]
- Falk, M.T.; Hagsten, E. When international academic conferences go virtual. Scientometrics 2020, 126, 707–724. [Google Scholar] [CrossRef]
- Grado, S.C.; Strauss, C.H.; Lord, B.E. Economic impacts of conferences and conventions. J. Conv. Exhib. Manag. 1998, 1, 19–33. [Google Scholar] [CrossRef]
- Fenich, G. Convention center operating characteristics. J. Conv. Exhib. Manag. 1998, 1, 1–25. [Google Scholar] [CrossRef]
- Yigitcanlar, T.; Kamruzzaman, M. Does smart city policy lead to sustainability of cities? Land Use Policy 2018, 73, 49–58. [Google Scholar] [CrossRef]
- Femenia-Serra, F.; Perles-Ribes, J.F.; Ivars-Baidal, J.A. Smart destinations and tech-savvy millennial tourists: Hype versus reality. Tour. Rev. 2019, 74, 63–81. [Google Scholar] [CrossRef]
- Batty, M.; Axhausen, K.W.; Giannotti, F.; Pozdnoukhov, A.; Bazzani, A.; Wachowicz, M.; Ouzounis, G.; Portugali, Y. Smart cities of the future. Eur. Phys. J. Spec. Top. 2012, 214, 481–518. [Google Scholar] [CrossRef]
- Wiig, A. The empty rhetoric of the smart city: From digital inclusion to economic promotion in Philadelphia. Urban Geogr. 2016, 37, 535–553. [Google Scholar] [CrossRef]
- Jovicic, D.Z. From the traditional understanding of tourism destination to the smart tourism destination. Curr. Issues Tour. 2017, 22, 276–282. [Google Scholar] [CrossRef]
- Gretzel, U.; Koo, C. Smart tourism cities: A duality of place where technology supports the convergence of touristic and residential experiences. Asia Pac. J. Tour. Res. 2021, 26, 352–364. [Google Scholar] [CrossRef]
- Koo, C.; Shin, S.; Gretzel, U.; Hunter, W.C.; Chung, N. Conceptualization of smart tourism destination competitiveness. Asia Pac. J. Inf. Syst. 2016, 26, 561–576. [Google Scholar] [CrossRef]
- Khan, M.; Woo, M.; Nam, K.; Chathoth, P. Smart city and smart tourism: A case of Dubai. Sustainability 2017, 9, 2279. [Google Scholar] [CrossRef]
- Coca-Stefaniak, J.A. Beyond smart tourism cities—Towards a new generation of “wise” tourism destinations. J. Tour. Futur. 2021, 7, 251–258. [Google Scholar] [CrossRef]
- Gretzel, U.; Werthner, H.; Koo, C.; Lamsfus, C. Conceptual foundations for understanding smart tourism ecosystems. Comput. Hum. Behav. 2015, 50, 558–563. [Google Scholar] [CrossRef]
- Rogers, T. Conferences and Conventions: A Global Industry; Elsevier: Amsterdam, The Netherlands, 2007. [Google Scholar]
- Lee, M.J.; Lee, S.; Joo, Y.M. The effects of exhibition service quality on exhibitor satisfaction and behavioral intentions. J. Hosp. Mark. Manag. 2015, 24, 368–707. [Google Scholar] [CrossRef]
- Sox, C.B.; Kline, S.F.; Crews, T.B.; Strick, S.K.; Campbell, J.M. Virtual and hybrid meetings: A mixed research synthesis of 2002–2012 research. J. Hosp. Tour. Res. 2017, 41, 945–984. [Google Scholar] [CrossRef]
- Lin, C.-L.; Chen, S.-J.; Lin, R. Efficacy of virtual reality in painting art exhibitions appreciation. Appl. Sci. 2020, 10, 3012. [Google Scholar] [CrossRef]
- Deac, G.C.; Georgescu, C.N.; Popa, C.L.; Ghinea, M.; Cotet, C.E. Virtual reality exhibition platform. In Proceedings of the 29th International DAAAM Symposium, Zadar, Croatia, 24–27 October 2018; pp. 0232–0236. [Google Scholar]
- Urry, J. Social networks, travel and talk. Br. J. Sociol. 2003, 54, 155–175. [Google Scholar] [CrossRef] [PubMed]
- Roos, G.; Oláh, J.; Ingle, R.; Kobayashi, R.; Feldt, M. Online conferences—Towards a new (virtual) reality. Comput. Theor. Chem. 2020, 1189, 112975. [Google Scholar] [CrossRef]
- Monaco, D.; Pellegrino, M.A.; Scarano, V.; Vicidomini, L. Linked open data in authoring virtual exhibitions. J. Cult. Herit. 2022, 53, 127–142. [Google Scholar] [CrossRef]
- Davis, F.D. A Technology Acceptance Model for Empirically Testing New End-User Information Systems: Theory and Results. Ph.D. Thesis, MIT Sloan School of Management, Cambridge, MA, USA, 1986. [Google Scholar]
- Davis, F.D. Perceived usefulness, perceived ease of use, and user acceptance of Information Technology. MIS Q. 1989, 13, 319–340. [Google Scholar] [CrossRef]
- Davis, F.D.; Bagozzi, R.P.; Warshaw, P.R. User acceptance of computer technology: A comparison of two theoretical models. Manag. Sci. 1989, 35, 982–1003. [Google Scholar] [CrossRef]
- Chiu, C.M.; Chang, C.C.; Cheng, H.L.; Fang, Y.H. Determinants of customer repurchase intention in online shopping. Online Inf. Rev. 2009, 33, 761–784. [Google Scholar] [CrossRef]
- Jung, K.; Nguyen, V.T.; Piscarac, D.; Yoo, S.-C. Meet the virtual Jeju Dol Harubang—The mixed VR/AR application for cultural immersion in Korea’s main heritage. ISPRS Int. J. Geo-Inf. 2020, 9, 367. [Google Scholar] [CrossRef]
- Lee, J.; Kim, J.; Choi, J.Y. The adoption of virtual reality devices: The technology acceptance model integrating enjoyment, social interaction, and strength of the social ties. Telemat. Inform. 2019, 39, 37–48. [Google Scholar] [CrossRef]
- Zhao, Y.-X.; Su, Y.-S.; Chang, Y.-C. A real-time bicycle record system of ground conditions based on internet of things. IEEE Access 2017, 5, 17525–17533. [Google Scholar] [CrossRef]
- Colombo, V.; Mondellini, M.; Gandolfo, A.; Fumagalli, A.; Sacco, M. Usability and acceptability of a virtual reality-based system for endurance training in elderly with chronic respiratory diseases. In Virtual Reality and Augmented Reality, Proceedings of the 16th EuroVR International Conference, EuroVR 2019, Tallinn, Estonia, 23–25 October 2019; Springer: Cham, Switzerland, 2019; pp. 87–96. [Google Scholar] [CrossRef]
- Chen, C.-Y.; Shih, B.-Y.; Yu, S.-H. Disaster prevention and reduction for exploring teachers’ technology acceptance using a virtual reality system and partial least squares techniques. Nat. Hazards 2012, 62, 1217–1231. [Google Scholar] [CrossRef]
- Huang, H.-M.; Liaw, S.-S.; Lai, C.-M. Exploring learner acceptance of the use of virtual reality in medical education: A case study of desktop and projection-based display systems. Interact. Learn. Environ. 2016, 24, 3–19. [Google Scholar] [CrossRef]
- De Canio, F.; Martinelli, E.; Peruzzini, M.; Cavallaro, S. Experiencing a food production site using wearable devices: The indirect impact of immersion and presence in VR tours. Sustainability 2022, 14, 3064. [Google Scholar] [CrossRef]
- Venkatesh, V.; Davis, F.D. A theoretical extension of the technology acceptance model: Four longitudinal field studies. Manag. Sci. 2000, 46, 186–204. [Google Scholar] [CrossRef]
- Mathieson, K. Predicting user intentions: Comparing the technology acceptance model with the theory of planned behavior. Inf. Syst. Res. 1991, 2, 173–191. [Google Scholar] [CrossRef]
- Venkatesh, V.; Davis, F.D. A model of the antecedents of perceived ease of use: Development and test. Decis. Sci. 1996, 27, 451–481. [Google Scholar] [CrossRef]
- Lin, K.Y.; Lu, H.P. Why people use social networking sites: An empirical study integrating network externalities and motivation theory. Comput. Hum. Behav. 2011, 27, 1152–1161. [Google Scholar] [CrossRef]
- Alhashmi, F.S.; Salloum, S.A.; Mhamdi, C. Implementing artificial intelligence in the United Arab Emirates healthcare sector: An extended technology acceptance model. Int. J. Inf. Technol. Lang. Stud. 2019, 3, 27–42. [Google Scholar]
- Kim, D.-Y.; Jang, S.S.; Morrison, A.M. Factors affecting organizational information technology acceptance: A comparison of convention and visitor bureaus and meeting planners in the United States. J. Conv. Event Tour. 2011, 12, 1–24. [Google Scholar] [CrossRef]
- Hoong, A.L.; Thi, L.S.; Lin, M.-H. Affective technology acceptance model: Extending technology acceptance model with positive and negative affect. In Knowledge Management Strategies and Applications; IntechOpen: London, UK, 2017. [Google Scholar] [CrossRef]
- Sagnier, C.; Loup-Escande, E.; Lourdeaux, D.; Thouvenin, I.; Valléry, G. User acceptance of virtual reality: An extended technology acceptance model. Int. J. Hum.–Comput. Interact. 2020, 36, 993–1007. [Google Scholar] [CrossRef]
- Yoo, C.; Kwon, S.; Na, H.; Chang, B. Factors affecting the adoption of gamified Smart tourism applications: An integrative approach. Sustainability 2017, 9, 2162. [Google Scholar] [CrossRef]
- Yi, M.Y.; Fiedler, K.D.; Park, J.S. Understanding the role of individual innovativeness in the acceptance of it-based innovations: Comparative analyses of models and measures. Decis. Sci. 2006, 37, 393–426. [Google Scholar] [CrossRef]
- Agarwal, R.; Prasad, J. A conceptual and operational definition of personal innovativeness in the domain of Information Technology. Inf. Syst. Res. 1998, 9, 204–215. [Google Scholar] [CrossRef]
- Rogers, E.M. Diffusion of Innovations; The Free Press: New York, NY, USA, 2003. [Google Scholar]
- Chao, C.-W.; Reid, M.; Mavondo, F. Global consumer innovativeness and consumer electronic product adoption. Asia Pac. J. Mark. Logist. 2013, 25, 614–630. [Google Scholar] [CrossRef]
- Vafaei-Zadeh, A.; Ng, S.-X.; Hanifah, H.; Teoh, A.P.; Nawaser, K. Safety technology adoption: Predicting intention to use car dashcams in an emerging country. Int. J. Innov. Technol. Manag. 2021, 18, 2150022. [Google Scholar] [CrossRef]
- Fagan, M.; Kilmon, C.; Pandey, V. Exploring the adoption of a virtual reality simulation: The role of perceived ease of use, perceived usefulness and personal innovativeness. Campus-Wide Inf. Syst. 2012, 29, 117–127. [Google Scholar] [CrossRef]
- Gupta, S.; Mathur, N.; Narang, D. E-leadership and virtual communication adoption by educators: An UTAUT3 model perspective. Glob. Knowl. Mem. Commun. 2022. [Google Scholar] [CrossRef]
- Bigne-Alcaniz, E.; Ruiz-Mafe, C.; Aldas-Manzano, J.; Sanz-Blas, S. Influence of online shopping information dependency and innovativeness on internet shopping adoption. Online Inf. Rev. 2008, 32, 648–667. [Google Scholar] [CrossRef]
- Joo, Y.J.; Lee, H.W.; Ham, Y. Integrating user interface and personal innovativeness into the TAM for mobile learning in cyber university. J. Comput. High. Educ. 2014, 26, 143–158. [Google Scholar] [CrossRef]
- Dai, H.; Luo, X.R.; Liao, Q.; Cao, M. Explaining consumer satisfaction of services: The role of innovativeness and emotion in an electronic mediated environment. Decis. Support Syst. 2015, 70, 97–106. [Google Scholar] [CrossRef]
- Kalinić, Z.; Liébana-Cabanillas, F.J.; Muñoz-Leiva, F.; Marinković, V. The moderating impact of gender on the acceptance of peer-to-peer mobile payment systems. Int. J. Bank Mark. 2020, 38, 138–158. [Google Scholar] [CrossRef]
- Zhou, T. Examining mobile banking user adoption from the perspectives of trust and flow experience. Inf. Technol. Manag. 2012, 13, 27–37. [Google Scholar] [CrossRef]
- Chen, N.-H. Extending a TAM–TTF model with perceptions toward telematics adoption. Asia Pac. J. Mark. Logist. 2019, 31, 37–54. [Google Scholar] [CrossRef]
- Wu, Y.; Jiang, Q.; Liang, H.; Ni, S.Y. What drives users to adopt a digital museum? A case of virtual exhibition hall of National Costume Museum. SAGE Open 2022, 12, 215824402210821. [Google Scholar] [CrossRef]
- Kim, S.; Hong, S. How virtual exhibition presentation affects visitor communication and enjoyment: An exploration of 2D versus 3D. Des. J. 2020, 23, 677–696. [Google Scholar] [CrossRef]
- McKnight, D.H.; Choudhury, V.; Kacmar, C. The impact of initial consumer trust on intentions to transact with a web site: A trust building model. J. Strateg. Inf. Syst. 2002, 11, 297–323. [Google Scholar] [CrossRef]
- Amin, M.; Rezaei, S.; Abolghasemi, M. User satisfaction with mobile websites: The impact of perceived usefulness (PU), perceived ease of use (PEOU) and trust. Nankai Bus. Rev. Int. 2014, 5, 258–274. [Google Scholar] [CrossRef]
- Harrigan, M.; Feddema, K.; Wang, S.; Harrigan, P.; Diot, E. How trust leads to online purchase intention founded in perceived usefulness and peer communication. J. Consum. Behav. 2021, 20, 1297–1312. [Google Scholar] [CrossRef]
- Corbitt, B.J.; Thanasankit, T.; Yi, H. Trust and e-commerce: A study of consumer perceptions. Electron. Commer. Res. Appl. 2003, 2, 203–215. [Google Scholar] [CrossRef]
- Tussyadiah, I.P.; Zach, F.J.; Wang, J. Do travelers trust intelligent service robots? Ann. Tour. Res. 2020, 81, 102886. [Google Scholar] [CrossRef]
- Chi, O.H.; Jia, S.; Li, Y.; Gursoy, D. Developing a formative scale to measure consumers’ trust toward interaction with artificially intelligent (AI) Social Robots in Service delivery. Comput. Hum. Behav. 2021, 118, 106700. [Google Scholar] [CrossRef]
- Kim, D.J.; Ferrin, D.L.; Rao, H.R. A trust-based consumer decision-making model in electronic commerce: The role of trust, perceived risk, and their antecedents. Decis. Support Syst. 2008, 44, 544–564. [Google Scholar] [CrossRef]
- Almuraqab, N.A.S.; Jasimuddin, S.M. Factors that influence end-users’ adoption of smart government services in the UAE: A conceptual framework. Electron. J. Inf. Syst. Eval. 2017, 20, 11–23. [Google Scholar]
- Habib, A.; Alsmadi, D.; Prybutok, V.R. Factors that determine residents’ acceptance of smart city technologies. Behav. Inf. Technol. 2020, 36, 610–623. [Google Scholar] [CrossRef]
- Gefen, D.; Karahanna, E.; Straub, E.W. Trust and tam in online shopping: An integrated model. MIS Q. 2003, 27, 51–90. [Google Scholar] [CrossRef]
- Pavlou, P.A.; Fygenson, M. Understanding and predicting electronic commerce adoption: An extension of the theory of planned behavior. IS Q. 2006, 30, 115–143. [Google Scholar] [CrossRef]
- Deci, E.L.; Koestner, R.; Ryan, R.M. A meta-analytic review of experiments examining the effects of extrinsic rewards on intrinsic motivation. Psychol. Bull. 1999, 125, 627–668. [Google Scholar] [CrossRef]
- Fredrickson, B. The value of positive emotions. Am. Sci. 2003, 91, 330. [Google Scholar] [CrossRef]
- Davis, F.D.; Bagozzi, R.P.; Warshaw, P.R. Extrinsic and intrinsic motivation to use computers in the workplace. J. Appl. Soc. Psychol. 1992, 22, 1111–1132. [Google Scholar] [CrossRef]
- van der Heijden, H. Factors influencing the usage of websites: The case of a generic portal in the Netherlands. Inf. Manag. 2003, 40, 541–549. [Google Scholar] [CrossRef]
- Ha, I.; Yoon, Y.; Choi, M. Determinants of adoption of mobile games under mobile broadband wireless access environment. Inf. Manag. 2007, 44, 276–286. [Google Scholar] [CrossRef]
- Alalwan, A.A.; Baabdullah, A.M.; Rana, N.P.; Tamilmani, K.; Dwivedi, Y.K. Examining adoption of mobile internet in Saudi Arabia: Extending TAM with perceived enjoyment, innovativeness and trust. Technol. Soc. 2018, 55, 100–110. [Google Scholar] [CrossRef]
- Wu, J.; Liu, D. The effects of trust and enjoyment on intention to play online games. J. Electron. Commer. Res. 2007, 8, 128–140. [Google Scholar]
- El-Said, O.; Aziz, H. Virtual tours a means to an end: An analysis of virtual tours’ role in tourism recovery post COVID-19. J. Travel Res. 2022, 61, 528–548. [Google Scholar] [CrossRef]
- Venkatesh, V.; Morris, M.; Davis, G.B.; Davis, F. User acceptance of information technology: Toward a unified view. MIS Q. 2003, 27, 425–478. [Google Scholar] [CrossRef]
- Hair, F.; Black, W.C.; Babin, B.J.; Anderson, R.; Tatham, R. Multivariate Data Analysis, 6th ed.; Pearson Prentice Hall: Upper Saddle River, NJ, USA, 2006. [Google Scholar]
- Anderson, J.C.; Gerbing, D.W. Structural equation modeling in practice: A review and recommended two-step approach. Psychol. Bull. 1988, 103, 411–423. [Google Scholar] [CrossRef]
- Bagozzi, R.P.; Yi, Y. On the evaluation of structural equation models. J. Acad. Mark. Sci. 1988, 16, 74–94. [Google Scholar] [CrossRef]
- Chin, W.W. Issues and opinion on structural equation modeling. MIS Q. 1988, 22, 7–16. [Google Scholar]
- Cronbach, L.J.; Meehl, P.E. Construct validity in psychological tests. Psychol. Bull. 1955, 52, 281–302. [Google Scholar] [CrossRef] [PubMed]
- Kline, R.B. Principles and Practice of Structural Equation Modeling, 3rd ed.; Guilford Press: New York, NY, USA, 2011. [Google Scholar]
- Fornell, C.; Larcker, D.F. Evaluating structural equation models with unobservable variables and measurement error. J. Mark. Res. 1981, 18, 39–50. [Google Scholar] [CrossRef]
- Coetsee, J.H.C. Barriers-to-Change in a Governmental Service Delivery Type Organization. Ph.D. Thesis, University of Johannesburg (RAU), Johannesburg, South Africa, 2006. [Google Scholar]
- Hair, J.F.; Anderson, R.E.; Tatham, R.L.; Black, W.C. Multivariate Data Analysis, 5th ed.; Prentice-Hall International: Upper Saddle River, NJ, USA, 1998. [Google Scholar]
- Hu, L.; Bentler, P.M. Cutoff criteria for fit indexes in covariance structure analysis: Conventional criteria versus new alternatives. Struct. Equ. Model. A Multidiscip. J. 1999, 6, 1–55. [Google Scholar] [CrossRef]


Publisher’s Note: MDPI stays neutral with regard to jurisdictional claims in published maps and institutional affiliations. |
© 2022 by the authors. Licensee MDPI, Basel, Switzerland. This article is an open access article distributed under the terms and conditions of the Creative Commons Attribution (CC BY) license (https://creativecommons.org/licenses/by/4.0/).