Abstract
Water resources are increasingly limited and less available, so improving water use efficiency is particularly pressing in the agricultural sector, where inefficient irrigation systems are often in operation. Drip irrigation is one of the most water-saving systems that can optimize distribution according to the actual needs of the crop. In the present study, an engineered drip irrigation system was applied to a poplar crop dedicated to the production of biomass for energy use. The aim was to evaluate the influence of the supply of different volumes of irrigation water on crop growth. Four levels of water supply were tested (theses T1, T2, T3, and T4), each determined by different intervention thresholds established by using four soil moisture sensors, one for each thesis (PLOT) (20, 30, 40, and 50 percent, respectively). In the third growing season, the effect of the different amounts of irrigation water supplied on plant growth was particularly evident between control T1 (104 m3 ha−1) compared with T2 (540 m3 ha−1), T3 (1924 m3 ha−1) and T4 (4549 m3 ha−1). Regarding biomass production, no statistical differences were found between T2 (8.97 Mg DM ha−1 year−1), T3 (9.99 Mg DM ha−1 year−1) and T4 (10.02 Mg DM ha−1 year−1), but they were all different from T1 (7.09 Mg DM ha−1 year−1. This leads to the conclusion, at least up to the third growing season, that with equal satisfactory levels of biomass production, water and energy savings can be achieved by choosing intermediate levels of water supply (e.g., with the sensor at 30%) as compared to the maximum value tested.
1. Introduction
The availability of water resources is increasingly critical because of both the huge increase in global needs in all productive sectors due to rising population levels and increasing standards of living and climate change leading to increasing desertification of the planet. [1,2].
The need to improve water use is particularly pressing for the agricultural sector, where the low efficiency of water distribution systems is widespread given the sharp increase in water demand for food production in order to meet the needs of the ever-increasing world population. Currently, about 70–75% of the world’s freshwater is consumed for irrigated agriculture [2,3] and a study by the International Water Management Institute (IWMI) has documented that about 50% of the increase in water demand by 2025 can be met by improving irrigation efficiency [4,5].
The causes of this low efficiency in water use are very complex and involve aspects related not only to economics and technological development but also to the environment, biology and social aspects. To address these problems, although slowly, the concept of precision irrigation is also becoming more widely used in water distribution in the agricultural sector.
“Precision irrigation”, in fact, means precise metering of water delivered to the crop in specific areas of the field to promote plant growth, avoiding unnecessary random distributions scattered around the cultivated field. This system, which is part of the more general concept of “precision agriculture”, involves four basic steps ranging from the acquisition of basic data related to soil characteristics, crop and applied technology, interpretation of the acquired data over time, application, and control of the precision system, and finally, the final evaluation from both an agronomic and energy point of view and from the point of view of economic and environmental sustainability [6].
Drip irrigation is among the systems that fully fall under the notion of precision irrigation, since this system, with the technology that characterizes it, is able to apply the available water in a precisely dosed and more efficient manner according to the actual physiological needs of the specific crop, avoiding the unnecessary waste of water which is observed in other less efficient irrigation systems [7,8,9].
In 2021, the EU enacted the European Green Deal, legally binding on member countries, which aims to achieve the goal of zero net emissions by 2050 and an intermediate reduction target of 55 percent by 2030 [10]. Forest energy crops for biomass production have been considered in recent years as possible alternative energy sources to fossil fuels [11], fitting fully into the global goals of combating climate change and achieving higher levels of energy efficiency [12,13]. Hybrid poplars are the most widely used species to create dedicated Short Rotation Coppice (SRC) plantations and are among those considered most interesting as they can produce large amounts of biomass in a very short time [14], especially when these plantations are irrigated to increase yields per hectare [15].
Currently, despite numerous support and incentive policies, European SRC plantations, consisting mostly of poplar clones, cover an estimated area of only 50,000 hectares [16]. Interest in this type of plantation is widespread in many European countries, as shown by studies focusing on biomass production from different clones used in this crop [17,18,19,20,21]. In Italy, in recent years, there has been a concrete decrease in the area planted at SRC, this is also a result of criticisms expressed by public opinion regarding the emission of pollutants into the atmosphere from biomass combustion processes [22]. However, domestic thermal power generation is an important strategic sector, and renewable sources can contribute to the achievement of international energy and environmental goals in the medium to long term (2030–2050) [23]. This has led to a profound change in the technological development of biomass plants, both small- and large-scale, involving the use of more environmentally friendly technical solutions and energy processes [24].
In Italy, the maximum area of SRC was reached a few years ago, when a total national area of about 7000 hectares was estimated, made mainly using modern poplar hybrids whose biomass is used in thermal or electric power plants, where regional rural development programs have provided a range of financial incentives to support the establishment of the plantation [25,26,27]. SRC poplar plantations are found, for the most part, in areas of northern Italy that are characterized by climatic conditions that are favorable to the normal growth of poplar plantations. Poplars grown in southern areas of the country, on the other hand, are normally exposed to recurring, even very long, periods of drought and therefore, efficient irrigation is necessary for a successful plantation [15,28].
The availability of water, in fact, usually represents a limiting factor for the growth of poplars due to the high water requirements of this species [29,30]. To maintain and improve the qualitative and quantitative biomass production of poplar plantations, the practice of irrigation has long been considered essential in the cultivation of this species worldwide. A study by Xi et al. [31] highlights that in most of the cases examined, irrigation was carried out based on the number and fixed duration of irrigation interventions, not considering the physiological or agronomic needs of the species, with the risk of insufficient or excessive water intake. The consideration of water stress indicators, on the other hand, would help to meet these needs and to plan irrigation interventions in a more regulated and efficient way. This approach underpins regulated deficit irrigation, which involves the use of technological tools and sensors that can help improve the efficiency of irrigation water use [32]. Deficit irrigation is now considered a valuable and sustainable production strategy in arid regions as it aims to maximize water productivity and stabilize crops [33]. Surface and subsurface drip irrigation systems are increasingly applied in the context of deficient irrigation strategies, particularly in tree crops [15]. They are advanced irrigation systems, based on the use of digital technologies and sensor applications that significantly reduce water losses from the soil [34].
The relationship between biomass production and water use in SRC poplar plantations, as well as the study of the efficiency of water distribution, have been the subject of numerous studies [35,36], many of them with conflicting results on the effects of the use of water in poplar SRCs. On the one hand, a higher water requirement has been demonstrated for this crop than for other agricultural crops with negative effects on the availability of local water resources [37,38], while other studies have reported that consumption of SRC water is similar or less than that of agricultural and grassland crops [39].
Sixto et al. [40] highlighted that, in the poplar SRC, the amount of water required varies from 800 to 5000 m3 ha−1, in close relation to the soil and climatic characteristics of the site, the age and density of the plant. Studies on the efficiency of water use allow the development of appropriate management strategies for this crop in sites that foreshadow scenarios with reduced water availability [41,42]. The optimization of the relationship between the production of large quantities of biomass, environmental adaptation and greater efficiency in the use of water is the basis of the interest in the selection of genotypes more suitable for environments with low water availability and subject to other abiotic stresses [43,44].
Higher production of wood per unit area by these plantations also allows greater efficiency in CO2 sequestration and in climate change mitigation [45,46]. In these cases, however, the impacts of water consumption, both on the energy and economic balance and on the environmental impact, are certainly factors to be investigated with particular attention.
This study aimed to investigate the effects of different levels of deficit irrigation on the growth of an SRC poplar plantation. The relationship between the amount of water delivered through an automated drip irrigation system, the average soil water content, and the growth rate response of poplar to four different water supply levels during the growing season was examined. The automated control system made it possible to control the supply of the quantity of water to be administered based on the different levels of soil moisture detected by special humidity sensors connected to the system. The final objective is to identify, in relation to the quantity of aboveground biomass produced, the level of greater water efficiency and energy saving in relation to the constant maintenance in the soil of the different levels of water content considered.
2. Materials and Methods
In spring 2019, a poplar plantation was established at the CREA-IT experimental farm in Monterotondo (Rome, central Italy) (Lat. 42°06′00.96″ N, Lon. 12°37′36.45″ E).
The soils are of volcanic origin, deriving from the intense volcanic activity of the lower and middle Pleistocele that affected the area. They are located near the alluvial valley of the Tevere River, which has produced alluvial deposits consisting of fine sandy loam and fine sediments deriving from the erosion and reworking of the deposits and soils of the slopes [47]. Such soils can be classified as Typical Argixeroll [48].
The climate is typically Mediterranean, with dry summers and cold winters (average temperature and precipitation in the three reference years of 15.3 °C and 644 mm, respectively). Rainfall events are mainly concentrated in the winter months, reaching peaks of more than 180 mm. The experimental field covers a flat terrain characterized by a predominantly silt and clay mixture, with about 52.8 percent silt, 44.3 percent clay, and 2.7 percent sand. Organic matter is about 2 percent, with a low nitrogen and phosphorus content. These characteristics classify the soil as silty clay, according to the USDA soil taxonomy [49]. The main average physical characteristics of the soil, obtained by analyzing six soil samples, taken from 0 to 40 cm deep, are shown in Table 1.

Table 1.
Main physical characteristics of the soil.
Clone AF18, Populus euramericana Dode (Guinier), was used (Figure 1a), adopting a completely randomized experimental design (Figure 1b).
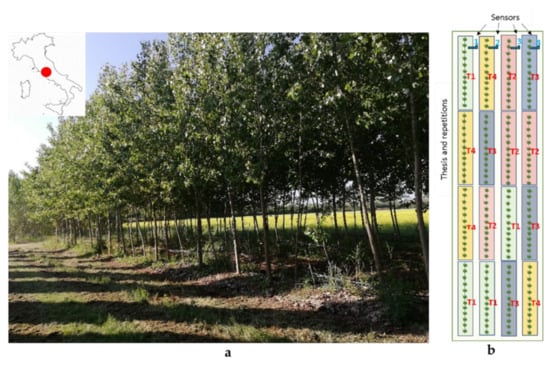
Figure 1.
Poplar SRC realized (a) and experimental design (b).
Before planting, the soil was deeply plowed and finished with a disc harrow. Afterwards, basic fertilization with a 12-12-12 (N-P-K) complex fertilizer (about 800 kg ha−1) was carried out, then it was incorporated using a rotary harrow. After planting the poplar cuttings, a cover fertilization with urea (300 kg ha−1) was carried out in spring. The external drip irrigation system was designed taking into account the needs of the randomized experimental scheme.
The experimental plantation was of medium density and follows the cultivation patterns typical of fast-growing, short-rotation crops (Short Rotation Coppices—SRC). The clone that was used had already been planted on the farm’s fields and proved suitable for the soil conditions of the site. Moreover, in view of the influence of tree density per hectare on poplar yield [50], the experimental planting was carried out using fewer trees than normally considered for SRC poplar groves [51]. Poplar cuttings (20–25 cm long) were planted in March, using a spacing of 1 m between cuttings on the row and 3 m between rows, for a planting density of 3330 trees per hectare. The total area of the experimental planting was 600 m2, divided into 16 blocks, represented by 4 irrigated theses with 4 repetitions. Each block thus consisted of 12 poplar cuttings, for a total of 48 cuttings per thesis, amounting to a total of 192 cuttings (Figure 1b). The automated irrigation system, based on the Idrosat control unit supplied by the company Idrobit (Villanova di Guidonia, Rome, Italy) uses four soil moisture sensors, one for each experimental plot, to control the volumes of water delivered. The control unit manages four solenoid valves that control the flow of water according to the soil moisture levels reached. For each experimental thesis, the water supply starts when the soil moisture value, detected by the specific sensor, falls below the minimum set level. When the threshold value is exceeded, the water supply is interrupted.
The irrigation system consisted of drip lines with 2 L h−1 emitters, spaced 40 cm apart along the line, for a total of 30 drip emitters per block (120 emitters per single line, for a total of 480).
The four moisture sensors (one per thesis), the Gro-Point Lite model (Riot Technology Corp., North Saanich, Canada), were placed in the ground in a horizontal position at the beginning of each row, one per thesis, at a depth of about 30 cm. The location of the sensors was chosen for practical reasons to facilitate the installation and control of the detection system. With this surface drip irrigation system, as the irrigation water drips from above (drippers positioned approximately 50 cm high on each row), the 0 to 30 cm soil layer will be wetter during the irrigation operation than with that recorded at the sensor level, while, on the contrary, in the layer deeper than 30 cm, the soil humidity could be lower. However, this condition does not affect the entire surface but only a strip of land about 50–60 cm wide on each row of trees.
The sensors detected volumetric water content by measuring changes in soil dielectric permittivity, which is closely related to soil moisture. The measuring range of the sensors ranged from a minimum of 0%, where the sensor was completely dry, to a maximum of 53% where the sensor was completely submerged in water.
To determine the relationship between the gravimetric water content of the soil and the moisture detected by the sensor, 30 soil samples were taken to each of which an increasing amount of water was added. The moisture sensor was placed on each soil sample and the reading was recorded. Each soil sample was immediately weighed and dried in an oven at 105 °C for 24 h to determine exactly the gravimetric water content of the sample. The percentage value of the water content was calculated by applying the following Formula (1) [52,53]:
where: Wc is the water content of the soil (in %); Sw is the wet soil (in g) and Sd is the dry soil (in g).
Once the data set was completed, a regression model was found with which the correspondence of gravimetric water content as a function of sensor-detected moisture could be expressed (Figure 2a). The minimum and maximum intervals of the sensor reading that controlled the start or stop of water delivery for each thesis (T), and the correspondence between the sensor reading and the gravimetric soil water content obtained by applying the equation in Figure 2a, are given in Table 2. Figure 2b, on the other hand, shows the soil water retention curve (SWRC) with the indication of the two critical points, the field capacity level, and the wilting point. This curve was constructed on the average of the values obtained from six soil samples subjected to controlled pressure treatment in a Richards pressure plate.
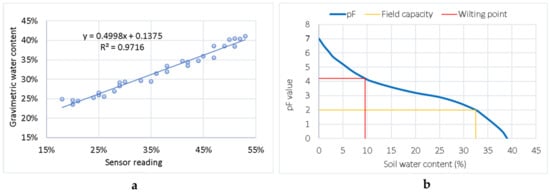
Figure 2.
Relationship between the gravimetric water content of the soil (in %) and the moisture detected by the sensor (in %) (n. 30 observations) (a), and the soil water retention curve (b).
Table 2.
Correspondence between sensor reading and gravimetric water content in the soil samples.
The pF value is the numerical index related to the soil water potential (in mbar), obtained using the Formula (2) proposed by Schofield:
where: Ψ is the water potential of the soil (in mbar).
pF = −Log|Ψ|
The choice of the four levels of irrigation intervention was made on the basis of the two graphs in Figure 2. On the one hand, by examining the correspondence between the soil moisture carried out by the sensors and the soil water content (Figure 2a) and, from the other, identifying the main critical points of the SWRC (Figure 2b). T1 was set at an irrigation activation level equal to the reading of 20%, the minimum level of useful water in the soil. T2 was set with the sensor at 30%, corresponding to a soil water content of approximately 28%. T3 was set at 40%, corresponding to the field water capacity (approximately 32.5%). Finally, T4 was set at an intervention level of 50%, relating to a soil water content close to the maximum water retention capacity (about 39%). T1 was also considered the control plot, and the program only intervened in the driest periods and with water supply intended as emergency irrigation.
The start of the irrigation program was controlled by the humidity sensor which communicates with the control unit. When the humidity sensor falls below the stabilized threshold, the opening signal of the solenoid valve that manages the irrigation of the specific thesis is sent. The program included four mandatory departures every four hours, starting at 6 in the morning and ending at 6 in the afternoon every day (6, 10, 14 and 18). At each start of irrigation, the control unit checks the sensor readings and if the values are lower than the minimum levels set for each thesis, it starts irrigation, otherwise, it remains suspended until the respective sensors fall below the programmed threshold again.
The first growing season (S1, year 2019) was dedicated to the vegetative growth of plants, using the same irrigation schedule for all theses to ensure a successful establishment of the young plantlets. The approach used in this case was to provide the same amount of water for all plants in all theses. This was achieved by setting the irrigation system control unit in manual mode, therefore independent of the soil moisture sensors. The irrigation interventions were carried out only in the months of June and August, in relation to periods of greater drought. In total, 7 irrigation interventions were carried out (lasting about 2 h), 2 in June and 5 in August, with a supply of about 9.4 L per plant for each intervention.
In the second (S2, year 2020) and third (S3, year 2021) growing seasons, due to the good vegetative development of all plants, the experimental activities could be started through the activation of differentiated irrigation schedules for the four theses.
In the spring of 2019, 2020, and 2021, dendrometric measurements were taken in relation to the first, second, and third growing years to estimate tree growth by measuring the diameters at breast height (DBH), the heights, and estimating the fresh and dry epigeal biomass produced. In order to highlight the relationship between the diameters and the heights of the poplar, hypsometric curves were determined for each irrigation treatment with reference to the third growing season. The second-degree polynomial equations were considered for the best interpretation of the data for all treatments (highest coefficient of determination).
Regarding the estimation of epigeal biomass production, since it was not possible to cut and weigh a sample of trees to be taken directly in the experimental field, an estimate of biomass per tree was made, in relation to the growing season, using the following Formula (3):
where: W, tree weight (kg tree−1); DBH, diameter at breast height (cm); H, tree height (m); S, shape coefficient (0.50; 0.51; 0.52); D, density coefficient (0.80, 0.805, 0.81); B, branches coefficient (1.12; 1.14; 1.16).
This formula is determined on the basis of the general one applied to calculate the volume of a cylinder (section by height), to which corrective multiplicative coefficients have been applied to obtain the quantity of biomass by weight. These coefficients were obtained by processing the growth data observed in the last 15 in the poplar plantations grown on the same farm [24,26,52].
The values assigned to the S, D and B coefficients increase proportionally to the age of the trees. As for coefficient B, it expresses the increase in weight due to branches to be added to the estimated weight of the trunk alone and ranges from 12%, 14% and 16% for one-, two- and three-year-old trees, respectively. For estimating biomass in terms of dry matter (DM), an average water content of 52.01 (±2.81) % was considered. This value was obtained by placing 15 wood samples in a ventilated oven at 105 °C until they reached a constant weight (ISO 18134-1:2015). These samples were taken from a separate poplar plantation (clone AF18) adjacent to the experimental field. The samples consisted of 3 wooden cylinders (3 cm high), taken from the basal, median and apical portions of the stems of 5 sample trees.
During the three years of the field test, climatic parameters were measured by means of a weather station installed near the plantation.
The comparison of these parameters was carried out to assess the growths and thus the effects produced by the level of water supply in relation to the four theses and for each of the three years of observation. The Shapiro-Wilk and Levene tests were performed to verify the normality and homogeneity of the variance for the quantitative variable considered, respectively. A Kruskal–Wallis non-parametric one-way ANOVA and multiple comparison tests, based on a stepwise decreasing method, were performed to establish the significant differences between the treatments examined. Statistical analysis of the data was performed using IBM SPSS software (PASW Statistics 18).
3. Results and Discussion
Analysis of the data collected from the weather station resulted in the graphs shown in Figure 3, which represent the Walter-Leith climograms for the years 2019, 2020 and 2021. The graphs allow us to make a direct comparison between the thermal and pluviometric regimes. In the months in which the average monthly temperatures are higher than the average rainfall, conditions of greater drought and more critical for plantations occur. The graphs show that the seasons during this period have been progressively drier with total annual precipitation of 888 mm in 2019, reduced by 35 percent in 2020 (582 mm) and 48 percent in 2021 (462 mm).
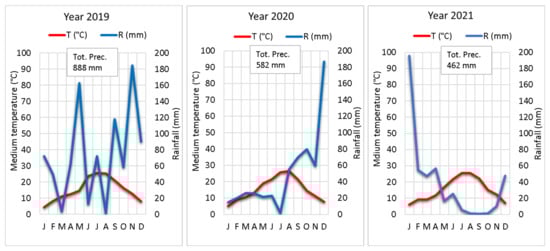
Figure 3.
Walter-Leith climograms for the years 2019, 2020 and 2021, which compare the average monthly temperatures (T, in °C) and relative rainfall (R, in mm).
The trends in the mean temperature and precipitation curves show that the annual dry period has increased over the years. In 2019, the most critical period covered a total period of about three months of the entire year (March, June, and August), while, in 2020, the months increased to five (April to August) and reached seven months in 2021 (uninterrupted period from May to November).
As a consequence of climate trends, the volumes of water delivered in the experimental field have also been different and have increased over the years. Figure 4 shows the total volumes of water supplied for each year in relation to individual experimental theses.
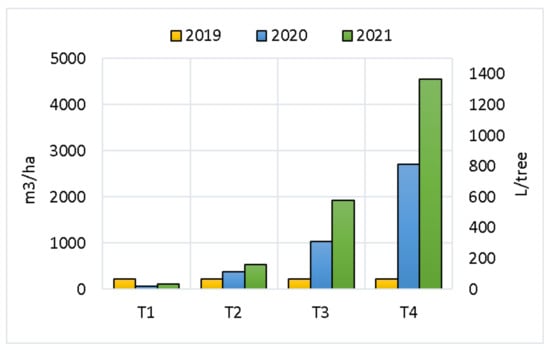
Figure 4.
Watering volumes (in m3 ha−1 and in L tree−1) delivered for each year and for each experimental thesis.
In 2019, around 66 L tree−1 (219 m3 ha−1) were equally distributed for all theses. In the 2020 season, a minimum of 20 L tree−1 was delivered for the control plot T1 (67 m3 ha−1) and 112 L tree−1 (374 m3 ha−1), 310 L tree−1 (1032 m3 ha−1) and 812 L tree−1 (2703 m3 ha−1), respectively, for the other thesis T2, T3 and T4. In 2021, compared to the previous year, water volumes increased from a low of 44% for T2 to a high of 86% for T3. The water supplied in the last year has therefore risen to 31 L tree−1 (104 m3 ha−1) for T1, 162 L tree−1 (540 m3 ha−1) for T2, 578 L tree−1 (1924 m3 ha−1) for T3 and 1366 L tree−1 (4549 m3 ha−1) for T4. The total water supply periods per hectare in the last year were approximately 6.2 h for the control T1, 32.4 h for T2, 115.5 h for T3 and 273.2 h for T4.
The growth response of poplar to different water supply regimes during the three growing seasons is shown in Table 3, in which the average values and the relative standard deviations (in brackets) of DBH, heights and biomass production of each thesis are reported for the three years of irrigation considered. Statistical analysis of the growth data allowed us to highlight some differences. In the first growing season, the data collected relating to the growth variables showed distributions that were not always normal for all the theses (Shapiro–Wilk test of normality significant with p < 0.05). The Levene test, to evaluate the homogeneity of the variance, was also significant in some cases (p < 0.05), with non-homogeneous variances for the diameters of 2019, while for 2020 and 2021 most of the variables have shown normal distributions and homogeneous variances (p > 0.05). Analysis of variance was then performed with a Kruskal–Wallis non-parametric one-way ANOVA test for independent samples.
Table 3.
Results relating to tree growth and biomass production in relation to the four experimental theses in the three growing seasons.
Figure 5, Figure 6 and Figure 7 show the box plots of the characteristics of the distribution of the data relating to the variables of diameter and height, the hypsometric curves and biomass production, respectively. Statistically significant differences (level 0.05) between the theses were expressed with lowercase letters (in red).
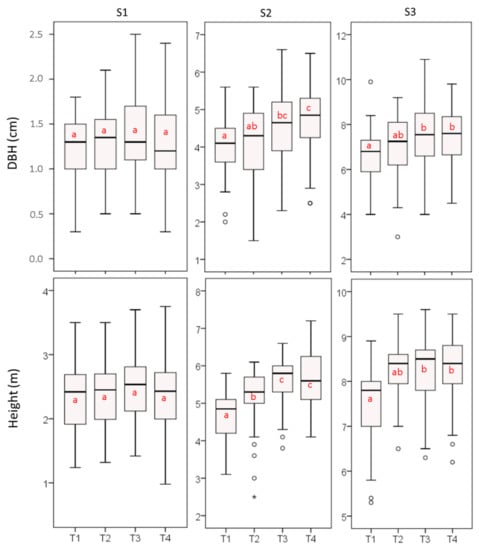
Figure 5.
Box plot of the diameters and heights of the SRC poplar plantation in relation to the four irrigation theses in the three growing seasons (S1, S2 and S3). The letters in red indicate the statistically significant differences (p < 0.05).
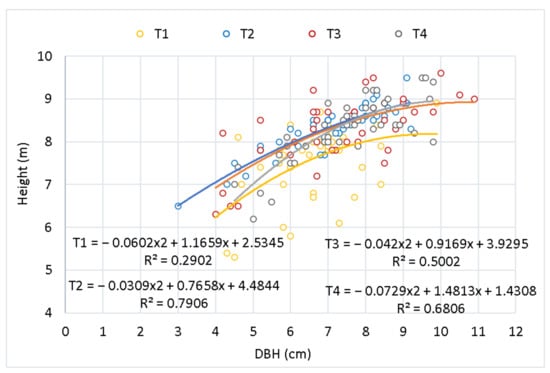
Figure 6.
Hypsometric curves that express the relationship between heights and diameters for each thesis with reference to 2021 data.
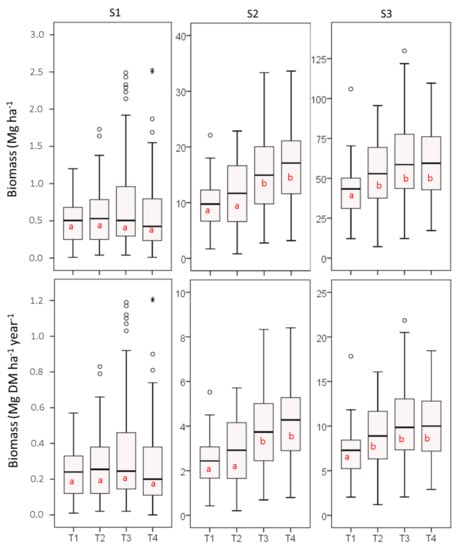
Figure 7.
Box plot of the biomass production in fresh tons per hectare (Mg ha−1) and dry matter per hectare and per year (Mg DM ha−1 year−1) of the SRC poplar plantation in relation to the four irrigation theses in the three growing seasons (S1, S2 and S3). The letters in red indicate the statistically significant differences. * (p < 0.05).
In general, there is statistical equality between the variables of the different theses for the year 2019, during which an equivalent volume of water was supplied to all theses. For the following years, there is generally a statistically significant difference between the control T1 and the other theses. Differences are noted in the year 2020 for diameters and heights. Regarding the diameters, T4 (4.73 ± 0.97 cm) differs statistically from T2 (4.12 ± 1.02) and T1 (3.98 ± 0.74), while it is similar to T3 (4.57 ± 1.08). The latter is similar to both T2 and T4, but still different from T1. In terms of heights, however, differences are clearly seen between the theses that have received greater irrigation volumes T4 and T3 (which are equal to each other) compared to T2 and T1, but also T2 is different from the control T1. In the year 2021, both for diameters and heights, the differences between the control T1 (6.62 ± 1.19 cm and 7.53 ± 0.85 m) and the other theses are highlighted. T4 (7.47 ± 1.40 cm and 8.29 ± 0.75 m) and T3 (7.39 ± 1.72 cm and 8.29 ± 0.79 m) are statistically similar for both parameters, while T2 (7.06 ± 1.44 cm and 8.29 ± 0.85 m) is similar to T4, T3 and T1.
These differences are also found in Figure 6, which shows the hypsometric curves referring to each thesis, which relates the growth in height of the trees with the relative diameter. The equations that best interpret the data are polynomials. The T1 control curve is the lowest and with the lowest value of the regression determination index. It shows, with equal diameter, generally lower heights than in the other theses. T2 and T3 show a similar trend, while T4, on the other hand, despite having heights lower than the minimum diameters, shows a greater response in height than the other theses, for larger diameters. This particular trend of the T4 curve is justified by the interpolation effect of the polynomial equation which tends downwards for the very low values of diameters and heights found in four trees. The latter showed a more stunted and non-linear growth than the others, probably due to greater difficulty in the initial rooting of the cuttings, which continued in the following years. Since larger diameters correspond to heights on average higher than those of the other theses, curve T4 has a steeper slope than the other three curves.
Figure 7 reports the distribution data of the epigeal biomass produced. In terms of total dry biomass per year, a general consistent average annual increase is observed, starting from the first year of growth with 0.30 Mg DM ha−1 year−1, to reaching 3.22 Mg DM ha−1 year−1 in the second year, ending with 9.02 Mg DM ha−1 year−1 in the third year, achieving in the latter case an average increase of 180% compared to the previous year. However, when analyzing the calculated increase for each thesis, it can be seen that this increase tends to decrease with increasing irrigation volume. The increase in annual DM biomass production per hectare in control T1 was 207%, compared to 215% in T2, 166% in T3 and 153% in T4. The percentage reduction in annual biomass observed when irrigation water quantity increases would seem to penalize, in terms of water distribution efficiency, the theses associated with a higher amount of supplied water. However, the increase in yield in absolute value, obtained in the third growing season compared to the second, is always lower for T1 with about 4.8 Mg DM ha−1 year−1, compared to that obtained from the other irrigation theses which exceed 6 Mg DM ha−1 year−1. If we then observe the increase in biomass obtained in the third year compared to the first, for each thesis, we realize that the greatest increase is found precisely for T4 (34 times), then T2 (31 times), then T1 (28 times) and finally T3 (25 times).
In the first year, there are no statistically significant differences in fresh and dry biomass between the different irrigation theses. In the second growing year, two similar groups can be distinguished: the first with higher yields (T4 and T3) compared to the second group with lower yields (T2 and T1). In the third growing year, T2 seems to have better growth yielding higher biomass than T1 and similar to T3 and T4.
By linking the results relating to the third growing season in terms of water supply efficiency, also in relation to the hydrological characteristics of the soil, the statistical equality of the growth variables (DBH, height and biomass production) of T2, T3 and T4, shows how the excess water supply (T4) beyond the limit of the soil field capacity (pF < 2, soil water content > 32.5%), is certainly an inefficient solution that involves a considerable waste of water and, consequently, of energy for the activation of the irrigation system, compared to T2 and T3. According to the statistical results, even between these last two theses, it can be noted that T2 is therefore more efficient than T3 and that the maintenance of soil water content of 28% (pF < 2.5, sensor set to 30%) represents the most efficient solution not only compared to T4 but also compared to T3.
Many authors have tested irrigation systems applied to SRC poplar plantations. Paris et al. [15], investigated the problem of subsurface drip irrigation accuracy to test the effects on the growth of two different levels of water supply to the poplar grove (115 mm and 239 mm). The results show a significant increase in field yield by doubling the amount of water given compared to the reference standard. In fact, the dry biomass yields rise from 11.4 Mg ha−1 year−1 of the basic level to 20.4 Mg ha−1 year−1 of the double level. The latter value is extremely higher than that reported in the present work also considering the maximum irrigation levels obtained with the T4 thesis. In fact, while the lower yields are comparable to those obtained in the T2 and T3 theses (7.1 and 8.9 Mg DM ha−1 year−1, respectively), the higher yields are not even comparable to the yields in T4, although twice as much water was supplied to the plantation, instead achieving half the productive yields (10.0 against 20.4 Mg DM ha−1 year−1). This is probably due both to the diversity of the clones used and to the characteristics of the soil less suitable for this type of plantation.
A study by Di Matteo et al. [26], on the adaptability of poplar clones in SRC plantations in central Italy under non-irrigated conditions, reports average yields (expressed in dry matter) of 5.7, 6.5 and 8.7 Mg per year, in R9S3 plantations (9-year-old roots and 3-year-old stem), depending on the clone studied (Monviso, AF6 and AF2). These values are consistent with those reported in the present study for both T1 (7.0 t) and T2 (8.9 t) cases. Besides the different clones used, however, it is necessary to consider the difference in the vegetative stage of the trees in our study which have not undergone any cutting, unlike those in the previous study which had undergone the last productive cutting three years earlier.
Another study by Di Matteo et al. [53], analyzes the biomass production of SRC poplar plantations receiving emergency irrigation only during the first year of planting, subjected to one or more harvest cycles. For example, very high yields are shown for 2-year-old trees that have undergone only one cutting after the first growing season, with values ranging from 8.5 to 11.8 Mg DM ha−1 year−1, in comparison with ours of 2.3–4.0 Mg DM for our 2-year-old trees. This is amply explained not only by the cut to the first year of planting which favored the greater vigor of the new suckers but also by the different initial planting density (7000 to 10,000 cuttings compared to our 3330 cuttings per hectare) and by the fact that, after cutting, the new productive suckers per stump were more than three times the initial number. If the yield value is normalized on a single tree basis, it can then be pointed out that the above results are reversed in favor of the irrigated theses, which, in the second year, achieve single plants with more than double the weight shown in the aforementioned article, confirming the positive effect of irrigation at different water levels (0.7–1.2 kg DM tree−1 versus 0.3–0.5 kg DM tree−1).
The study by Verani et al. [24] regarding the sustainability of biomass obtained from SRC poplar plantations for energy use also reports an average production of 10.2 Mg DM ha−1 year−1, similar to those obtained in our field.
In a study focusing on assessing the biomass production potential of poplar clones in Spain, Perez-Cruzado et al. [54], adopted empirical models on data from a network of 144 plots, distinguishing poorly managed SRC plantations from those managed with weeding and irrigation. The results obtained, referring to three-year plantations, show a significant difference between the two cases, with productions of 8.9–12.5 Mg ha−1 year−1 in the first case compared to a range of 12.4–18.6 MG for one year in the second. Moreover, these values are therefore compatible with those of the present work in reference to the non-irrigated case (T1) compared to the irrigated cases (T2, T3 and T4).
In relation to the local conditions in which the experimentation was conducted, the characteristics of the soil and the type of poplar clone adopted, it is believed that the results obtained, at least up to the third vegetative year of planting, provide useful information on the level of efficiency in terms of water saving of the plantation. However, it will be necessary to continue the experimentation also for the other levels of water supply in order to confirm the results obtained or verify any differences.
Finally, it is believed that this study represents an important starting point, both from a technical-operational point of view, as it can provide useful information for the application of an automated irrigation control system in relation to the maintenance of programmed levels of soil water content, both from a production, energy and economic point of view, being able to identify the optimal level of deficit irrigation for a unit of produced biomass, optimizing energy and economic savings.
4. Conclusions
The aim of the study was to investigate the effects of deficit irrigation, represented by four different levels of water supply, on the growth of an SRC poplar plantation. This was pursued by relating the quantity of water delivered by the automated drip irrigation system, the average soil water content, and the response in terms of the growth rate of the poplar trees.
This first analysis on the use of different volumes of water for irrigation shows that, in terms of growth, poplar trees respond positively to higher irrigation levels. However, the amount of water delivered for thesis T4 (irrigated intervention with 50% moisture sensor), for the time being (third year of vegetation) did not produce statistically different effects compared to lower levels of water delivery, such as those for thesis T3 (40% moisture sensor) and T2 (30% moisture sensor).
The results obtained so far, namely up to the third poplar growing season, have shown satisfactory production levels for the plantation even in the case of lower levels of water supply with respect to the maximum planned. This implies that, not having found significant differences in the growth rates between the irrigation theses, it is possible to obtain reductions in water and energy consumption considering the levels compatible with those tested for thesis T2 (sensor adjustment at 30%, corresponding to a soil water content of 28%). This also leads to economic savings for the farmer who uses this irrigation system. Considering conditions similar to those of the study, this also leads to economic savings for the farmer who uses this irrigation system.
These issues will be the subject of further study aimed in particular at examining the aspects concerning the solutions that can be implemented to achieve greater energy efficiency in water distribution and the identification of minimum levels of economic sustainability of drip irrigation systems.
Author Contributions
Conceptualization, G.S., R.T. and M.P.; methodology, G.S., R.T. and M.P.; software preparation, G.S.; data standardization, G.S.; validation, G.S., R.T. and M.P.; formal analysis, G.S.; investigation, G.S., R.T., M.P. and C.C.; data curation, G.S., R.T., M.P., C.C. and P.M.; writing—original draft preparation, G.S.; writing—review and editing, G.S., R.T., M.P., A.A., V.C. and C.C.; visualization, G.S.; supervision, G.S., R.T., M.P., A.A., V.C. and C.C. All authors have read and agreed to the published version of the manuscript.
Funding
This research was developed as part of the national project AGROENER funded by MIPAAF (D.D. 26329 of 1 April 2016).
Institutional Review Board Statement
Not applicable.
Informed Consent Statement
Not applicable.
Data Availability Statement
Not applicable.
Acknowledgments
The authors wish to thank the IDROBIT company and the brothers Giuseppe and Giulio Antoniolli for the supply and installation of the IDROSAT control unit and the sensors applied to the experimental poplar plantation of CREA-IT.
Conflicts of Interest
The authors declare no conflict of interest.
References
- Van Opstal, J.D.; Neale, C.M.U.; Hipps, L.E. Evaluating the adaptability of an irrigation district to seasonal water availability using a decade of remotely sensed evapotranspiration estimates. Agric. Water Manag. 2022, 261, 107383. [Google Scholar] [CrossRef]
- Zhang, G.; Liu, C.; Xiao, C.; Xie, R.; Ming, B.; Hou, P.; Liu, G.; Xu, W.; Shen, D.; Wang, K.; et al. Optimizing water use efficiency and economic return of super high yield spring maize under drip irrigation and plastic mulching in arid areas of China. Field Crops Res. 2017, 211, 137–146. [Google Scholar] [CrossRef]
- Rosegrant, M.W.; Ringler, C.; Zhu, T.J. Water for agriculture: Maintaining food security under growing scarcity. Environ. Resour. 2009, 34, 205–222. [Google Scholar] [CrossRef]
- Shareef, M.; Gui, D.; Zeng, F.; Waqas, M.; Zhang, B.; Iqbal, H. Water productivity, growth, and physiological assessment of deficit irrigated cotton on hyperarid desert-oases in northwest China. Agric. Water Manag. 2018, 206, 1–10. [Google Scholar] [CrossRef]
- Seckler, D.; Amarasinghe, U.; Molden, D.; de Silva, R.; Barker, R. World Water Demand and Supply, 1990 to 2025: Scenarios and Issues, Research Report 19; International Water Management Institute (IWMI): Colombo, Sri Lanka, 1998. [Google Scholar]
- Sperandio, G.; Menesatti, P.; Tomasone, R.; Pagano, M.; Cedrola, C.; Acampora, A.; Santelli, P. Drip line size selection in micro irrigation design for tree crops: Economic and energetic sustainability. ISHS Acta Hortic. 2022, 1335, 7–14. [Google Scholar] [CrossRef]
- Li Yan, X.; Fei Dai, T.; Ming Jia, L. Evaluation of the cumulative effect of drip irrigation and fertigation on productivity in a poplar plantation. Ann. For. Sci. 2018, 75, 5. [Google Scholar] [CrossRef]
- Soulis, K.X.; Elmaloglou, S.; Dercas, N. Investigating the effects of soil moisture sensors positioning and accuracy on soil moisture based drip irrigation scheduling systems. Agric. Water Manag. 2015, 148, 258–268. [Google Scholar] [CrossRef]
- Taylor, R.; Zilberman, D. Diffusion of drip irrigation: The case of California. Appl. Econ. Perspect. 2017, 39, 16–40. [Google Scholar] [CrossRef]
- COM; European Commission. Directive of the European Parliament and of the Council amending Directive 2003/87/EC Establishing a System for Greenhouse Gas Emission Allowance Trading within the Union, Decision (EU) 2015/1814 Concerning the Establishment and Operation of a Market Stability Reserve for the Union Greenhouse Gas Emission Trading Scheme and Regulation (EU) 2015/757; COM: Brussels, Belgium, 2021.
- IPCC. AR5—Working Group 3, Mitigation of Climate Change. In Contribution of Working Group III to the Fifth Assessment Report of the Intergovernmental Panel on Climate Change; Edenhofer, O., Pichs-Madruga, R., Sokona, Y., Farahani, E., Kadner, S., Seyboth, K., Adle, A., Eds.; Cambridge University Press: Cambridge, UK; New York, NY, USA, 2014. [Google Scholar]
- Kaltschmitt, M. Biomass for energy in Germany status, perspectives and lessons learned. J. Sustain. Energy Environ. 2011, 1–10. Available online: https://www.thaiscience.info/journals/Article/JOSE/10977078.pdf (accessed on 10 August 2022).
- COM. Impact Assessment: A Policy Framework for Climate and Energy in the Period from 2020 up to 2030; COM: Brussels, Belgium, 2014. [Google Scholar]
- Zamora, D.S.; Apostol, K.G.; Berguson, W.E.; Volk, T.A.; Wright, J.; Ogdahl, E.J. Short rotation woody crops biomass production. In Biomass and Biofuel: Advanced Biorefineries for Sustainable Production and Distribution; CRC Press: Boca Raton, FL, USA, 2015. [Google Scholar]
- Paris, P.; Di Matteo, G.; Tarchi, M.; Tosi, L.; Spaccino, L.; Lauteri, M. Precision subsurface drip irrigation increases yield while sustaining water-use efficiency in Mediterranean poplar bioenergy plantations. For. Ecol. Manag. 2018, 409, 749–756. [Google Scholar] [CrossRef]
- Lindegaard, K.N.; Adams, P.W.R.; Holley, M.; Lamley, A.; Henriksson, A.; Larsson, S.; Von Engelbrechten, H.-G.; Lopez, G.E.; Pisarek, M. Short rotation plantations policy history in Europe: Lessons from the past and recommendations for the future. Food Energy Secur. 2016, 5, 125–152. [Google Scholar] [CrossRef]
- Liesebach, M. Poplars and other fast growing tree species in Germany: Report of the National Poplar Commission. 2016–2019. In Thünen Working Paper, No. 141a; Johann Heinrich von Thünen-Institut: Braunschweig, Germany, 2020. [Google Scholar] [CrossRef]
- Karacic, A.; Adler, A.; Weih, M.; Christersson, L. An analysis of poplar growth and quality traits to facilitate identification of climate-adapted plant material for Sweden. Bioenergy Res. 2021, 14, 409–425. [Google Scholar] [CrossRef]
- Mola-Yudego, B.; Arevalo, J.; Díaz-Yáñez, O.; Dimitriou, I.; Freshwater, E.; Haapala, A.; Khanam, T.; Selkimäki, M. Reviewing wood biomass potentials for energy in Europe: The role of forests and fast growing plantations. Biofuels 2017, 8, 401–410. [Google Scholar] [CrossRef]
- Nielsen, U.B.; Madsen, P.; Hansen, J.K.; Nord-Larsen, T.; Nielsen, A.T. Production potential of 36 poplar clones grown at medium length rotation in Denmark. Biomass Bioenergy 2014, 64, 99–109. [Google Scholar] [CrossRef]
- Niemczyk, M.; Kaliszewski, A.; Jewiarz, M.; Wróbel, M.; Mudryk, K. Productivity and biomass characteristics of selected poplar (Populus spp.) cultivars under the climatic conditions of northern Poland. Biomass Bioenergy 2018, 111, 46–51. [Google Scholar] [CrossRef]
- PREPAIR (LIFE 15 IPE IT 013 of European Union). Gli Impatti Ambientali Della Combustione di Biomassa Legnosa per la Produzione di Calore: Le Esperienze Delle Azioni di Comunicazione Nell’area del Bacino Padano e in Slovenia. 2018. Available online: http://www.lifeprepair.eu/wp-content/uploads/2018/09/Gli-impatti-ambientali-della-combustione-di-biomassalegnosa_le-esperienze-di-comunicazione.pdf (accessed on 15 June 2022).
- Mandley, S.J.; Daioglou, V.; Junginger, H.M.; van Vuuren, D.P.; Wicke, B. EU bioenergy development to 2050. Renew. Sustain. Energy Rev. 2020, 127, 109858. [Google Scholar] [CrossRef]
- Verani, S.; Sperandio, G.; Picchio, R.; Marchi, E.; Costa, C. Sustainability Assessment of a Self-Consumption Wood-Energy Chain on Small Scale for Heat Generation in Central Italy. Energies 2015, 8, 5182–5197. [Google Scholar] [CrossRef]
- Sperandio, G.; Acampora, A.; Del Giudice, A.; Civitarese, V. Models for the Evaluation of Productivity and Costs of Mechanized Felling on Poplar Short Rotation Coppice in Italy. Forests 2021, 12, 954. [Google Scholar] [CrossRef]
- Di Matteo, G.; Nardi, P.; Verani, S.; Sperandio, G. Physiological adaptability of Poplar clones selected for bioenergy purposes under non-irrigated and suboptimal site conditions: A case study in Central Italy. Biomass Bioenergy 2015, 81, 183–189. [Google Scholar] [CrossRef]
- Costa, C.; Sperandio, G.; Verani, S. Use of multivariate approaches in biomass energy plantation harvesting: Logistic advantages. Agric. Eng. Int. CIGR J. 2014, 70–79, 1682-1130. [Google Scholar]
- Navarro, A.; Stellacci, A.M.; Campi, P.; Vitti, C.; Modugno, F.; Mastrorilli, M. Feasibility of SRC species for growing in Mediterranean conditions. BioEnergy Res. 2016, 9, 208–223. [Google Scholar] [CrossRef]
- Xi, B.Y.; Bloomberg, M.; Watt, M.S.; Wang, Y.; Jia, L.M. Modeling growth response to soil water availability simulated by HYDRUS for a mature triploid Populus tomentosa plantation located on the North China Plain. Agric. Water Manag. 2016, 176, 243–254. [Google Scholar] [CrossRef]
- Di, N.; Wang, Y.; Clothier, B.; Liu, Y.; Jia, L.; Xi, B.; Shi, H. Modeling soil evaporation and the response of the crop coefficient to leaf area index in mature Populus tomentosa plantations growing under different soil water availabilities. Agric. For. Meteor. 2019, 264, 125–137. [Google Scholar] [CrossRef]
- Xi, B.; Clothier, B.; Coleman, M.; Duan, J.; Hu, W.; Li, D.; Di, N.; Liu, Y.; Fu, J.; Li, J.; et al. Irrigation management in poplar (Populus spp.) plantations: A review. For. Ecol. Manag. 2021, 494, 119330. [Google Scholar] [CrossRef]
- Chai, Q.; Gan, Y.; Zhao, C.; Xu, H.L.; Waskom, R.M.; Niu, Y.; Siddique, K.H.M. Regulated deficit irrigation for crop production under drought stress. A review. Agron. Sustain. Dev. 2016, 36, 3. [Google Scholar] [CrossRef]
- Geerts, S.; Raes, D. Deficit irrigation as an on-farm strategy to maximize crop water productivity in dry areas. Agric. Water Manag. 2009, 96, 1275–1284. [Google Scholar] [CrossRef]
- Ayars, J.E.; Fulton, A.; Taylor, B. Subsurface drip irrigation in California-Here to stay? Agric. Water Manag. 2015, 157, 39–47. [Google Scholar] [CrossRef]
- Li, D.; Liu, J.; Verhoef, A.; Xi, B.; Hernandez-Santana, V. Understanding the relationship between biomass production and water use of Populus tomentosa trees throughout an entire short-rotation. Agric. Water Manag. 2021, 246, 106710. [Google Scholar] [CrossRef]
- Liang, Z.S.; Yang, J.W.; Shao, H.B.; Han, R.L. Investigation on water consumption characteristics and water use efficiency of poplar under soil water deficits on the Loess Plateau. Colloid Surf. 2006, 53, 23–28. [Google Scholar] [CrossRef]
- Dimitriou, I.; Busch, G.; Jacobs, S.; Schmidt-Walter, P.; Lamersdorf, N. A review of the impacts of Short Rotation Coppice cultivation on water issues. Landbau-Forsch. Volkenrode 2009, 59, 197–206. [Google Scholar]
- Petzold, R.; Schwarzel, K.; Feger, K.H. Transpiration of a hybrid poplar plantation in Saxony (Germany) in response to climate and soil conditions. Eur. J. For. Res. 2011, 130, 695–706. [Google Scholar] [CrossRef]
- Fischer, M.; Trnka, M.; Kučera, J.; Fajman, M.; Zalud, Z. Biomass productivity and water use relation in short rotation poplar coppice (Populus nigra x P. maximowiczii) in the conditions of Czech Moravian Highlands. Acta Univ. Agric. Silvic. Mendel. Brun. 2014, 59, 141–152. [Google Scholar] [CrossRef]
- Sixto, H.; Hernández, M.J.; De Miguel, J.; Cañellas, I. Red de Parcelas de Cultivos Leñosos en Alta Densidad y Turno Corto a Escala Nacional; INIA: Madrid, Spain, 2013; ISBN 978-84-7498-559-7. [Google Scholar]
- Gonzáles-Gonzáles, B.D.; Oliveira, N.; González, I.; Cañellas, I.; Sixto, H. Poplar biomass production in short rotation under irrigation: A case study in the Mediterranean. Biomass Bioenergy 2017, 107, 198–206. [Google Scholar] [CrossRef]
- Bloemen, J.; Fichot, R.; Horemans, J.A.; Broeckx, L.S.; Verlinden, M.S.; Zenone, T.; Ceulemans, R. Water use of a multigenotype poplar short-rotation coppice from tree to stand scale. GCB Bioenergy 2016, 9, 370–384. [Google Scholar] [CrossRef]
- Condon, A.G.; Richards, R.A.; Rebetzke, G.J.; Farquhar, G.D. Breeding for high water use efficiency. J. Exp. Bot. 2004, 55, 2447–2460. [Google Scholar] [CrossRef]
- Guerra, F.P.; Richards, J.H.; Fiehn, O.; Famula, R.; Stanton, B.J.; Shuren, R.; Sykes, R.; Davis, M.F.; Neale, D.B. Analysis of the genetic variation in growth, ecophysiology, and chemical and metabolomic composition of wood of Populus trichocarpa provenances. Tree Genet. Genomes 2016, 12, 6–21. [Google Scholar] [CrossRef]
- Šēnhofa, S.; Lazdiņa, D.; Zeps, M. Winter frost damage and its link to early growth and survival in a poplar clone collection. For. Wood Process. 2021, 36, 70–76. [Google Scholar] [CrossRef]
- Sulaiman, C.; Abdul-Rahim, A.S.; Ofozor, C.A. Does wood biomass energy use reduce CO2 emissions in European Union member countries? Evidence from 27 members. J. Clean. Prod. 2020, 253, 119996. [Google Scholar] [CrossRef]
- Bascietto, M.; Santangelo, E.; Beni, C. Spatial Variations of Vegetation Index from Remote Sensing Linked to Soil Colloidal Status. Land 2021, 10, 80. [Google Scholar] [CrossRef]
- USDA—NRCS. Soil Taxonomy. A Basic System of Soil Classification for Making and Interpreting Soil Surveys. In Agricultural Handbook, 2nd ed.; Natural Resources Conservation Service: Washington, DC, USA, 1999; Volume 436, p. 863. [Google Scholar]
- Cañellas, I.; Huelin, P.; Hernández, M.J.; Ciria, P.; Calvo, R.; Gea-Izquierdo, G.; Sixto, H. The effect of density on short rotation Populus sp. plantations in the Mediterranean area. Biomass Bioenergy 2012, 46, 645–652. [Google Scholar] [CrossRef]
- Facciotto, G.; Bergante, S.; Rosso, L.; Minotta, G. Comparison between two and five years rotation models in poplar, willow and black locust Short Rotation Coppices (SRC) in North West Italy. CREA J. Ann. Silvic. Res. 2020, 45, 12–20. Available online: https://journals-crea.4science.it/index.php/asr (accessed on 10 August 2022).
- Gardner, W.H. Water content. In Methods of Soil Analysis, Part 1, 2nd ed.; Klute, A., Ed.; American Society of Agronomy Inc.: Madison, WI, USA; Soil Science Society of America Inc.: Washington, DC, USA, 1986; pp. 493–544. [Google Scholar]
- MIPAF—Ministero delle politiche agricole e forestali. Approvazione dei metodi ufficiali di analisi chimica del suolo. In Supplemento Ordinario alla G.U.N. 248 del 21/10/1999, Serie Generale; Gazzetta Ufficiale Della Repubblica Italiana: Roma, Italy, 1999. [Google Scholar]
- Di Matteo, G.; Sperandio, G.; Verani, S. Field performance of three Poplar clones in Short Rotation Forestry of Central Italy. iForest Biogeosciences For. 2012, 5, 224–229. [Google Scholar] [CrossRef]
- Pérez-Cruzado, C.; Sanchez-Ron, D.; Rodríguez-Soalleiro, R.; Hernández, M.J.; Sánchez-Martín, M.M.; Cañellas, I.; Sixto, H. Biomass production assessment from Populus spp. Short-rotation irrigated crops in Spain. GCB Bioenergy 2014, 6, 312–326. [Google Scholar] [CrossRef]


Publisher’s Note: MDPI stays neutral with regard to jurisdictional claims in published maps and institutional affiliations. |
© 2022 by the authors. Licensee MDPI, Basel, Switzerland. This article is an open access article distributed under the terms and conditions of the Creative Commons Attribution (CC BY) license (https://creativecommons.org/licenses/by/4.0/).