Article

Research on the Spatial Network Effect of Urban Tourism Flows from Shanghai Disneyland

1
School of Economics and Management, Anhui Agricultural University, Hefei 230036, China
2
Tourism Department, Hefei University, Hefei 230601, China
*
Author to whom correspondence should be addressed.
Sustainability 2022, 14(21), 13973; https://doi.org/10.3390/su142113973
Submission received: 12 September 2022 / Revised: 15 October 2022 / Accepted: 26 October 2022 / Published: 27 October 2022

Abstract

:
For a long time, Shanghai’s urban tourism has presented a single-core agglomeration pattern with the Bund area as the core, with the phenomenon of overcrowding in the core area during holidays. The opening of Disneyland in 2016 has had an important impact on the development of Shanghai’s urban tourism, including the spatial network of tourism flows. This study selects the travel notes of domestic tourists to Shanghai from Ctrip.com and sorts out a total of 1419 pieces of valid spatial information before and after the opening of Disneyland. With the help of social network analysis, it analyses the influence of Disneyland on the spatial network of domestic tourism flows in Shanghai. The results show that Disneyland has become a new spatial growth pole of Shanghai urban tourism, with an obvious network nuclear Overhauser effect, which is conducive to alleviating congestion in the Bund area, but the correlation effect of Disneyland on other tourism nodes is not obvious. The connection between high-grade tourism nodes is further enhanced, and some low-grade tourism nodes are more marginalized, showing the Matthew effect of nodes and the combined effects of nodes. Accordingly, this paper puts forward three suggestions. First, to strengthen the optimal design of tourism routes and enhance the connection between Disneyland and other tourism nodes; second, to upgrade low-grade tourism nodes, enhance recognition and strengthen integration with core tourism nodes; and, third, to strengthen top-level planning, provide comprehensive support for Disneyland, enhance its industrial linkage effect and spatial network effect, and promote the sustainable development of Shanghai’s urban tourism.

1. Introduction

Shanghai is the centre of China’s economy, finances, trade and shipping, as well as a world-famous tourist city. In 2019, the city received 8,972,300 inbound tourists and 361,405,100 domestic tourists, of whom 171,864,100 were non-Shanghai local tourists (2019, Shanghai Statistical Bulletin on National Economic and Social Development). For a long time, Shanghai’s urban tourism has shown a high degree of agglomeration characteristics, mainly concentrated in the areas on both sides of the Huangpu River, with the Bund and Lujiazui as the core, which is a typical single-core development pattern. The crowding phenomenon during the peak holiday periods is prominent, which affects the tourists’ sightseeing effect [1,2] and has safety hazards. Therefore, it is necessary for Shanghai to alleviate the local overcrowding of urban tourism. The planning and layout of major tourism projects to form new growth poles and disperse passenger flows are an effective way to optimize the spatial pattern of urban tourism and an important support for Shanghai as a world-class tourism city, contributing to the sustainable development of Shanghai’s urban tourism.
As a large-scale theme park with significant global influence, Disneyland has a huge scale, rich tour content and in-depth cultural experience functions. Shanghai Disneyland officially opened in 2016, receiving more than 10 million tourists annually, and is committed to creating a Disneyland with Chinese characteristics [3,4]. Disneyland has opened up a new space for urban tourism in Shanghai, which will inevitably have an impact on the spatial network of urban tourism flows and reconstruct the spatial pattern of urban tourism in Shanghai [5,6,7]. The social network analysis method is a quantitative analysis method developed by sociologists based on mathematical methods, graph theory and so on. It has been widely used in recent years for research in sociology, economics, management and other fields, and helps to combine inter-individual relationships in network, micro network and overall network structure [8,9,10]. Therefore, this paper uses the social network analysis method to collect information on the spatial routes of domestic tourists travelling to Shanghai before and after the opening of Shanghai Disneyland. Through the changes in the spatial network characteristics of tourism flows, the impact of Shanghai Disneyland on the spatial pattern of urban tourism is analysed, and relevant optimization suggestions are put forward accordingly.

2. Literature Review

The city is the political, economic and cultural centre of the region. With the rapid development of mass tourism, the city has also become the centre of tourism activities [11,12,13] due to its good natural conditions, profound history and culture, developed economic conditions and perfect tourism reception facilities [14,15]. Urban tourism has been an important field of tourism research [15]. Spatial structure is an important component of urban tourism research. Scholars at home and abroad have introduced location theory [16] and core–periphery theory [17] into the study of tourism spatial structure, and proposed tourism spatial structure models such as the spatial structure and order model [18], the distance decay model [19], and the tourism destination zone model [20]. The tourism consumption ability of urban residents, the influence of the tourism market, the construction effect of modern cities, and the influence of city brands have a strong attraction to major tourism projects. According to the theory of industrial spatial agglomeration, major tourism projects have strong operational synergy and resource-integration effects, forming agglomeration areas of various related business formats [21,22], and then becoming hotspots of urban tourism and new urban tourism growth poles [23,24], which are effective in guiding the efficient layout of related industries, optimizing the spatial pattern of urban tourism, reshaping the image of urban tourism, and promoting the development of cities into regional tourism centres [23]. However, the research results on the impact of major tourism projects on the spatial network of tourism flows and tourism spatial patterns within cities are relatively weak.
Theme parks are an important type of modern urban tourism product [25] and are a man-made tourism resource. Their powerful cultural and entertainment functions, novel tourism spaces and typical experience-business format make them uniquely advantageous in meeting the cultural creativity and interactive needs of tourists [26,27,28,29], and have become an important business format of urban tourism [30] and a postmodern spaces [31,32]. Most studies have focused on theme park site selection [33], economic impact [30,34], social effects [35,36], internal management [37], tourism carrying capacity [38], and tourists’ experience effects on the theme park products [39]. A successfully operated theme park can improve local economic income, create jobs [35,36] and stimulate economic growth in the surrounding area [34]. At the same time, the huge passenger flows of theme parks also have a great impact on the spatial network of urban tourism flows, which in turn affect the spatial patterns of urban tourism. However, there are few studies on the impact of large theme parks on the spatial patterns of intracity tourism.
Tourism flow is a regional manifestation of social network relationships [8]. Tourism flow network characteristics are the embodiment of regional tourism resources and the spatial pattern of tourism development [40]. Spatial networks are the main perspective of related research [41], involving the spatial distribution characteristics of tourism flows [42,43], evolution characteristics [43,44,45], spatial effects [46], and driving mechanisms [47,48]. Related studies believe that tourism flows are closely related to economy, trade, geography, culture, and other factors [49,50,51], and special factors such as high-speed rail [52], haze [53], and earthquakes [54] also have an impact on the spatial network characteristics of tourism flows [55,56]. The data sources of research are diverse [57], and online big data are the most applied [9], mainly including online travel notes [58], Sina Weibo [59], Baidu Index [60], and online booking platforms. The regional scales having undergone research range from global [8,61], national [62], urban agglomeration [63], and province [64,65] to city [66,67], but the research on intracity tourism flows is relatively weak [68]. The research methods mainly include GIS analysis [69], econometric analysis [70], and social network analysis [71]. This paper draws on the existing research results and uses the social network analysis method and a combination of Ucinet 6.0 and Gephi 0.9.2 software for analysis.
In summary, there are abundant research results on urban tourism, theme parks, and tourism flows, but few studies have analysed the impact of major tourism projects on the spatial pattern of intracity tourism from a spatial perspective. Therefore, taking Shanghai Disneyland as an example, this paper analyses its impact on the spatial network characteristics of Shanghai’s urban tourism flows and the spatial pattern of tourism, proposing corresponding optimization suggestions.

3. Methods

With the help of social network analysis, this study uses Ucinet 6.0 software to measure and analyse network characteristics from the two dimensions of tourism node characteristics and overall network characteristics. Among them, the characteristics of tourism nodes are analysed by indices such as node centrality, closeness, betweenness and structural holes, and the overall network structure is analysed by network size, network density, network centralization, and core–periphery model. Because this study involves the comparison of two spatial networks of different scales before and after the opening of Disneyland, the correlation analysis is carried out based on the results calculated by relative numbers. The visualization of the analysis results is expressed by Gephi 0.9.2 software.

3.1. Network Node Analysis Method

3.1.1. Node Centrality

Node centrality refers to the number of connections between a node and other nodes in the network, reflecting the importance of network nodes in the overall network. Directed networks can be divided into inner and outer degrees. The calculation formula is:
d i = i n i j
d i i n = i n i j
d i o u t = i n i j
The formula for the relative number is:
C D ( n i ) = d i i n + d i o u t 2 ( n 1 )
where di represents the overall centrality of the node, dini is the inward centrality, douti is the outward centrality, nij is the centrality of travel node i to j, and C′D(ni) is the node centrality.

3.1.2. Closeness Centrality

Closeness centrality refers to the sum of the shortest distances between a node and other nodes in the network and is used to measure the closeness of the connection between a tourism node and other nodes. Directed tourism networks have inner and outer degrees. The calculation formula is:
C A P i 1 = j = 1 n d i j
The formula for the relative number is:
C R P i 1 = C A P i 1 n 1
where dij represents the shortest path distance between travel nodes i and j, which is the path where all nodes and all line connections are not repeated. C−1APi represents the absolute closeness centrality, and C−1RPi is the relative closeness centrality.

3.1.3. Betweenness Centrality

Betweenness centrality refers to the intermediate node located in the shortest connection path between the other two nodes in the tourism network and is used to measure the degree of control of a node over other nodes. The calculation formula is:
C A B i = j n k n b j k ( i )
The formula for the relative number is:
C R B i = 2 C A B i n 2 3 n + 2
where bjk represents the shortest path between two nodes j and k adjacent to i. CABi represents the absolute betweenness centrality, and CRBi is the relative betweenness centrality.

3.1.4. Structural Holes

Structural holes are used to measure the degree of disconnection between network nodes and are usually measured by the effective size, efficiency, and constraint [68].
(1)
Effective size. Refers to the size of the individual network minus the redundancy of the network. The calculation formula is:
E S i = j ( 1 q p i q m j q )
where j represents all points connected to node i and q is every third party except i or j. piqmjq represents the redundancy between node i and a particular point j. ESi represents the effective size.
(2)
Efficiency. Refers to the ratio of the effective size of tourism nodes to the actual size.
(3)
Constraints. Reflects the degree to which a node directly and indirectly depends on other tourism nodes. The calculation formula is:
C i j = ( p i j + q p i q p q j ) 2
where pij represents the proportion of ties with j to all ties of node i, piq represents the proportion of ties with q to all ties of node i, pqj represents the proportion of ties with j to all ties of node q, and Cij represents the constraint.

3.2. Network Node Analysis Method

3.2.1. Network Size

Network size refers to the number of tourist nodes in the network, which is an important variable for measuring the relationship of the network structure. The larger the number of nodes in the network and the larger the network size are, the more complex the relationship structure and the greater the internal inequality and difference.

3.2.2. Network Density

Network density refers to the proportion of connections between nodes that actually exist in the network graph to the total possible connections, reflecting the closeness of network relationships. The higher the network density is, the closer the relationship between network nodes. In a directed graph with N nodes, the maximum number of possible connected lines is N (N − 1), and the actual connected lines are L. The calculation formula for the network density of the directed graph is L/N (N − 1).

3.2.3. Network Centralization

Network centralization is a measure of the centrality of the overall network. According to different calculation methods, it can be divided into degree centralization, closeness centralization, and betweenness centralization, reflecting the overall integration degree or consistency of the network.
(1)
Degree centralization. This is the degree of network centrality calculated according to the method of degree centrality. The calculation formula is:
C R D = i = 1 n ( C R D max C R D i ) n 2
where CRDmax is the maximum node centrality in the network, the numerator represents the sum of the differences between the centrality of all other nodes in the evaluated network and the maximum node centrality, and n is the number of tourism nodes in the tourism network. CRDi is the relative centrality, and CRD is the degree centralization.
(2)
Closeness centralization. This is the degree of network centrality calculated according to the method of closeness centrality. The calculation formula is:
C C = i = 1 n ( C R C max C R C i ) n 2 3 n + 2 ( 2 n 3 )
where C′RCmax is the maximum closeness centrality in the network and the numerator represents the sum of the differences between all other closeness centralities and the maximum closeness centralities in the evaluated network. C′RCi is the relative closeness centrality, and CC is the closeness centralization.
(3)
Betweenness centralization. This is the degree of network centrality calculated according to the method of betweenness centrality. The calculation formula is:
C B = i = 1 n ( C R B max C R B i ) n 1
where CRBmax is the maximum betweenness centrality in the network and the numerator represents the sum of the differences between all other betweenness centralities in the evaluated network and the maximum betweenness centralities. CRBi is the relative betweenness centrality, and CB is the betweenness centralization.

3.2.4. Core–Periphery Analysis

According to the calculation result of node centrality in the network, the nodes at the core position and the nodes at the edge position of the network are divided, which intuitively reflects the importance of a node in the overall network. It can be analysed using the core–peripheral module in Ucinet 6.0 software or with the index filtering function in Gephi 0.9.2 software.

4. Data Selection and Sample Analysis

4.1. Data Selection

As a prose form and a big data network in which to record the travel process, travel notes have become an important source of research materials in the field of tourism research. When tourists write travel notes on Ctrip.com, they need to fill in their itinerary information, the means of transportation (including long-distance transportation and intracity transportation), departure time, type of companions, and the number of travel days. Most travel notes record in detail each node that tourists reach in the process of travel, and this paper conducts research based on this spatial information. As of 12 March 2022, Ctrip has a total of 120,990 travel notes involving Shanghai. This study collated the content of a certain number of travel notes before and after the opening of Disneyland in March 2022 and analysed the main information in each travel note, focusing on the spatial information in tourists’ itineraries. Among them, a total of 7830 travel notes were browsed from July 2010 to June 2016 (before the opening of Disneyland), and the spatial data of 517 valid itineraries were sorted out, involving a total of 248 tourism nodes in Shanghai. A total of 12,516 travel notes were browsed from June 2016 to March 2022 (after the opening of Disneyland), and 892 valid spatial data were sorted out, involving a total of 234 tourism nodes in Shanghai (important tourism nodes are shown in Figure 1).

4.2. Sample Analysis

In the spatial data of all 1409 valid itineraries, there are 908 records of travel days, of which 83.80% of tourists are on 1–3-day trips. There are a total of 907 records with companions, of which 29% are friends, accounting for the highest proportion, followed by family trips, accounting for 24.81%. The main means of transportation to Shanghai are high-speed rail and airplanes. In terms of transportation within Shanghai, 88.96% of tourists choose the metro or the combination of metro and bus. In terms of the source of tourists, except for those from Hong Kong, Macao, and Taiwan, for whom statistics were not kept due to the low utilization rate of Ctrip.com, a total of 856 pieces of spatial information recorded the source, covering 30 provinces, municipalities, and autonomous regions in China, excluding Shanghai. Among them, tourists from Jiangsu and Zhejiang, which are closest to Shanghai, account for a higher proportion, followed by tourists from more developed regions such as Beijing and Guangdong (Table 1).

5. Analysis

5.1. Network Node Analysis

Using the network analysis function of Ucinet 6.0 software to analyse various indices of the spatial network of tourism flows, the results show that the high-value nodes are highly concentrated in nearly 30 tourism nodes, which is also verified in the overall network analysis. Based on the overall analysis of all tourism nodes in the network, this paper analyses the indices of the top 30 nodes in the total degree.

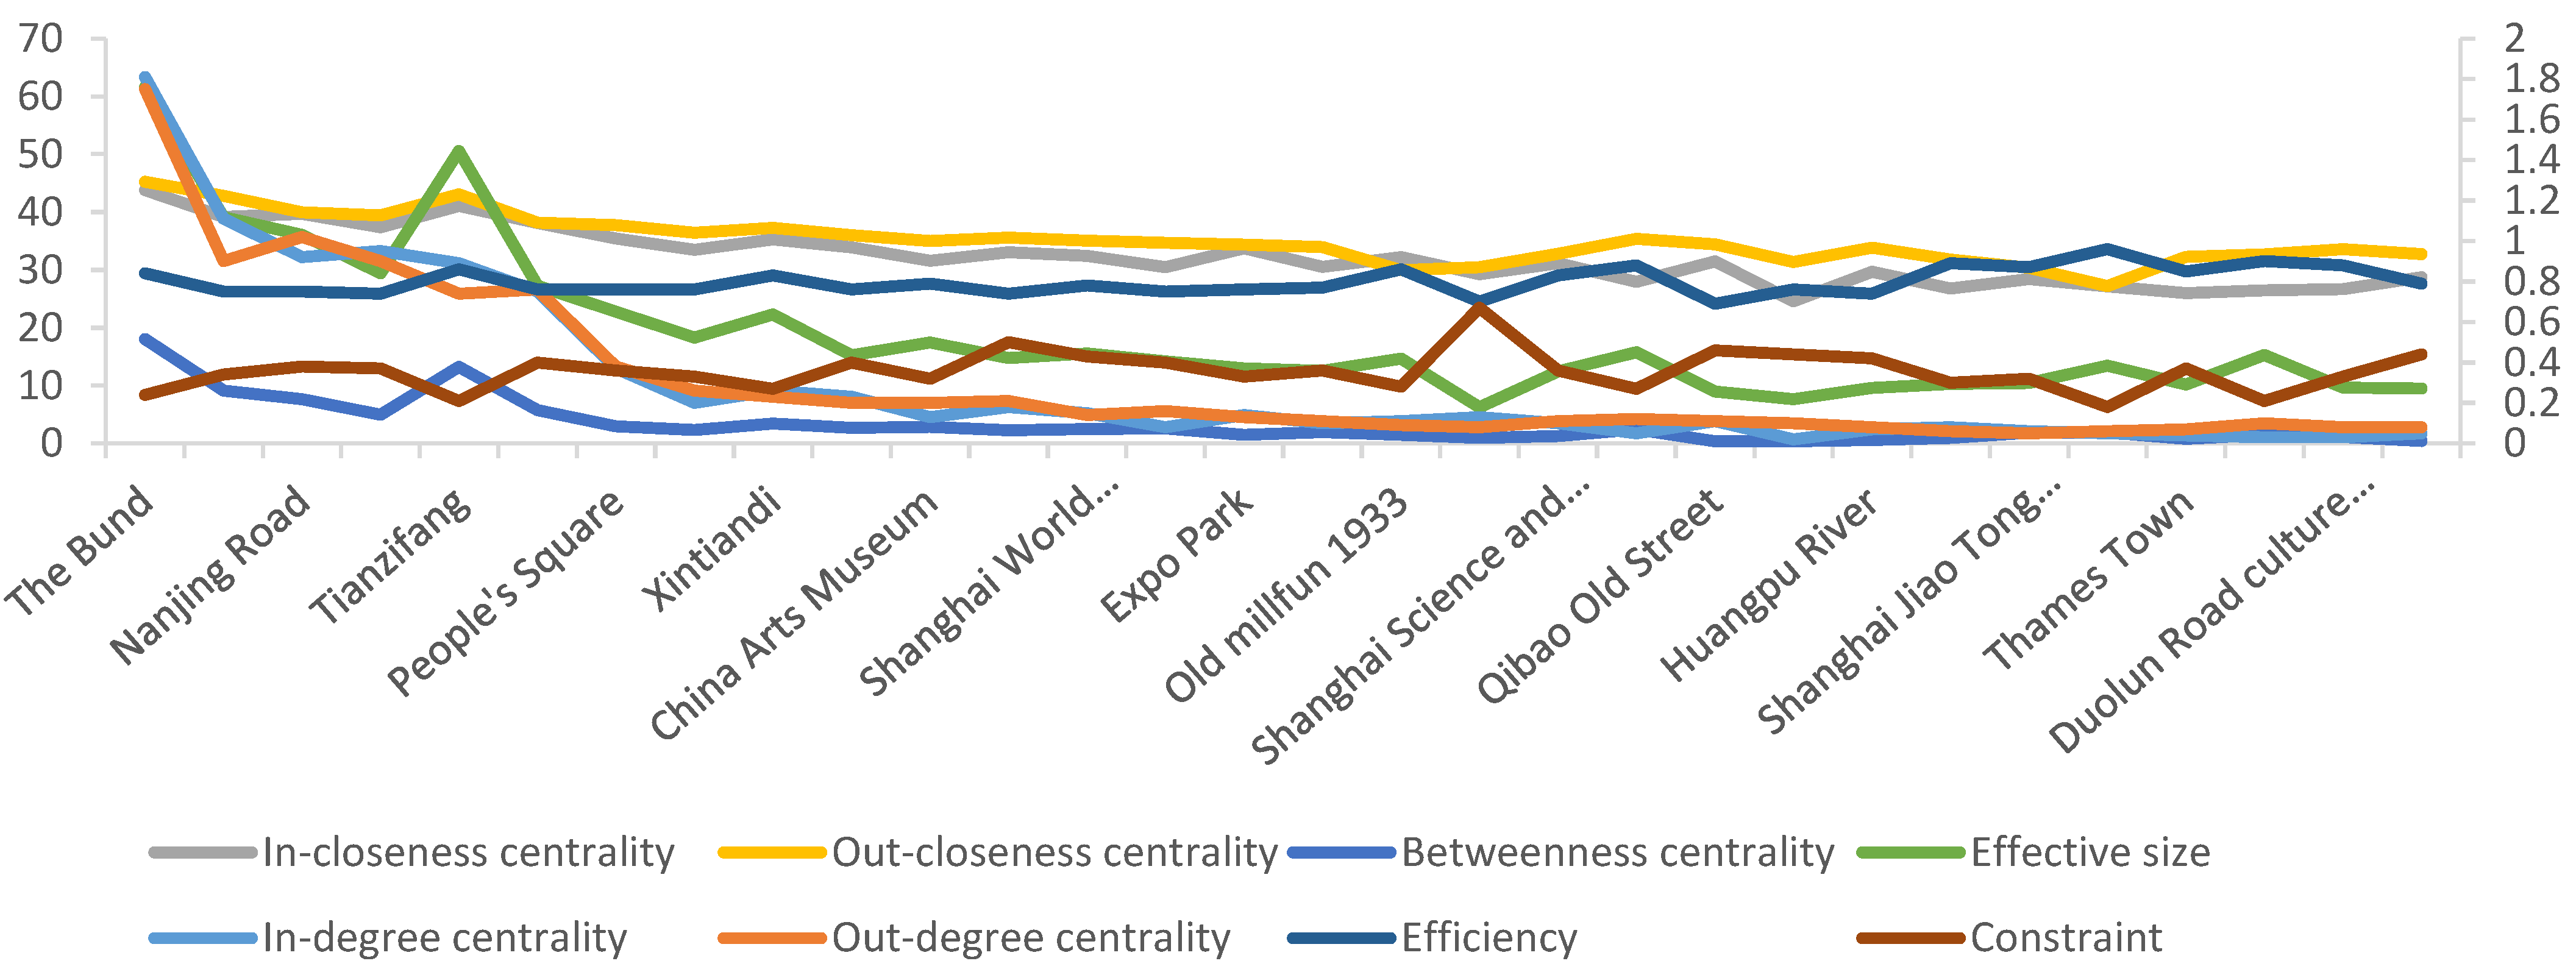
5.1.1. Analysis of Network Nodes before the Opening of Disneyland

It can be seen from the results of the relevant indices before the opening of Disneyland (Figure 2) that the Bund has higher values for all indices and ranks first in all indices except for the constraint. The smaller value of the constraint reflects the lower degree of dependence on other nodes, indicating the absolute central position of the Bund in the spatial network of domestic tourism flows in Shanghai. The index values of the Oriental Pearl TV Tower, Chenghuang Temple, Yu Garden, Nanjing Road, Tianzifang and other nodes are also relatively high. These nodes are distributed in the Bund and Lujiazui areas on both sides of the Huangpu River. This area is a witness to Shanghai’s history, a display of Shanghai’s modernization, and an urban landmark area; it displays an image of Shanghai and is a core area for tourists visiting Shanghai. The efficiency values of the above nodes are relatively low, reflecting that they are highly connected to each other, but the connections with other nodes in the network are not extensive. Other nodes with high index values are also mostly distributed in this area and the area linked by Nanjing Road, and the order of the index values is basically the same. On the one hand, it shows the high spatial agglomeration characteristics of the main tourism nodes in Shanghai, and on the other hand, it also reflects that the area composed of these high index tourism nodes is not only the destination area for domestic tourists in Shanghai, but is also an important distribution area, reflecting the highly integrated effect of tourism nodes.

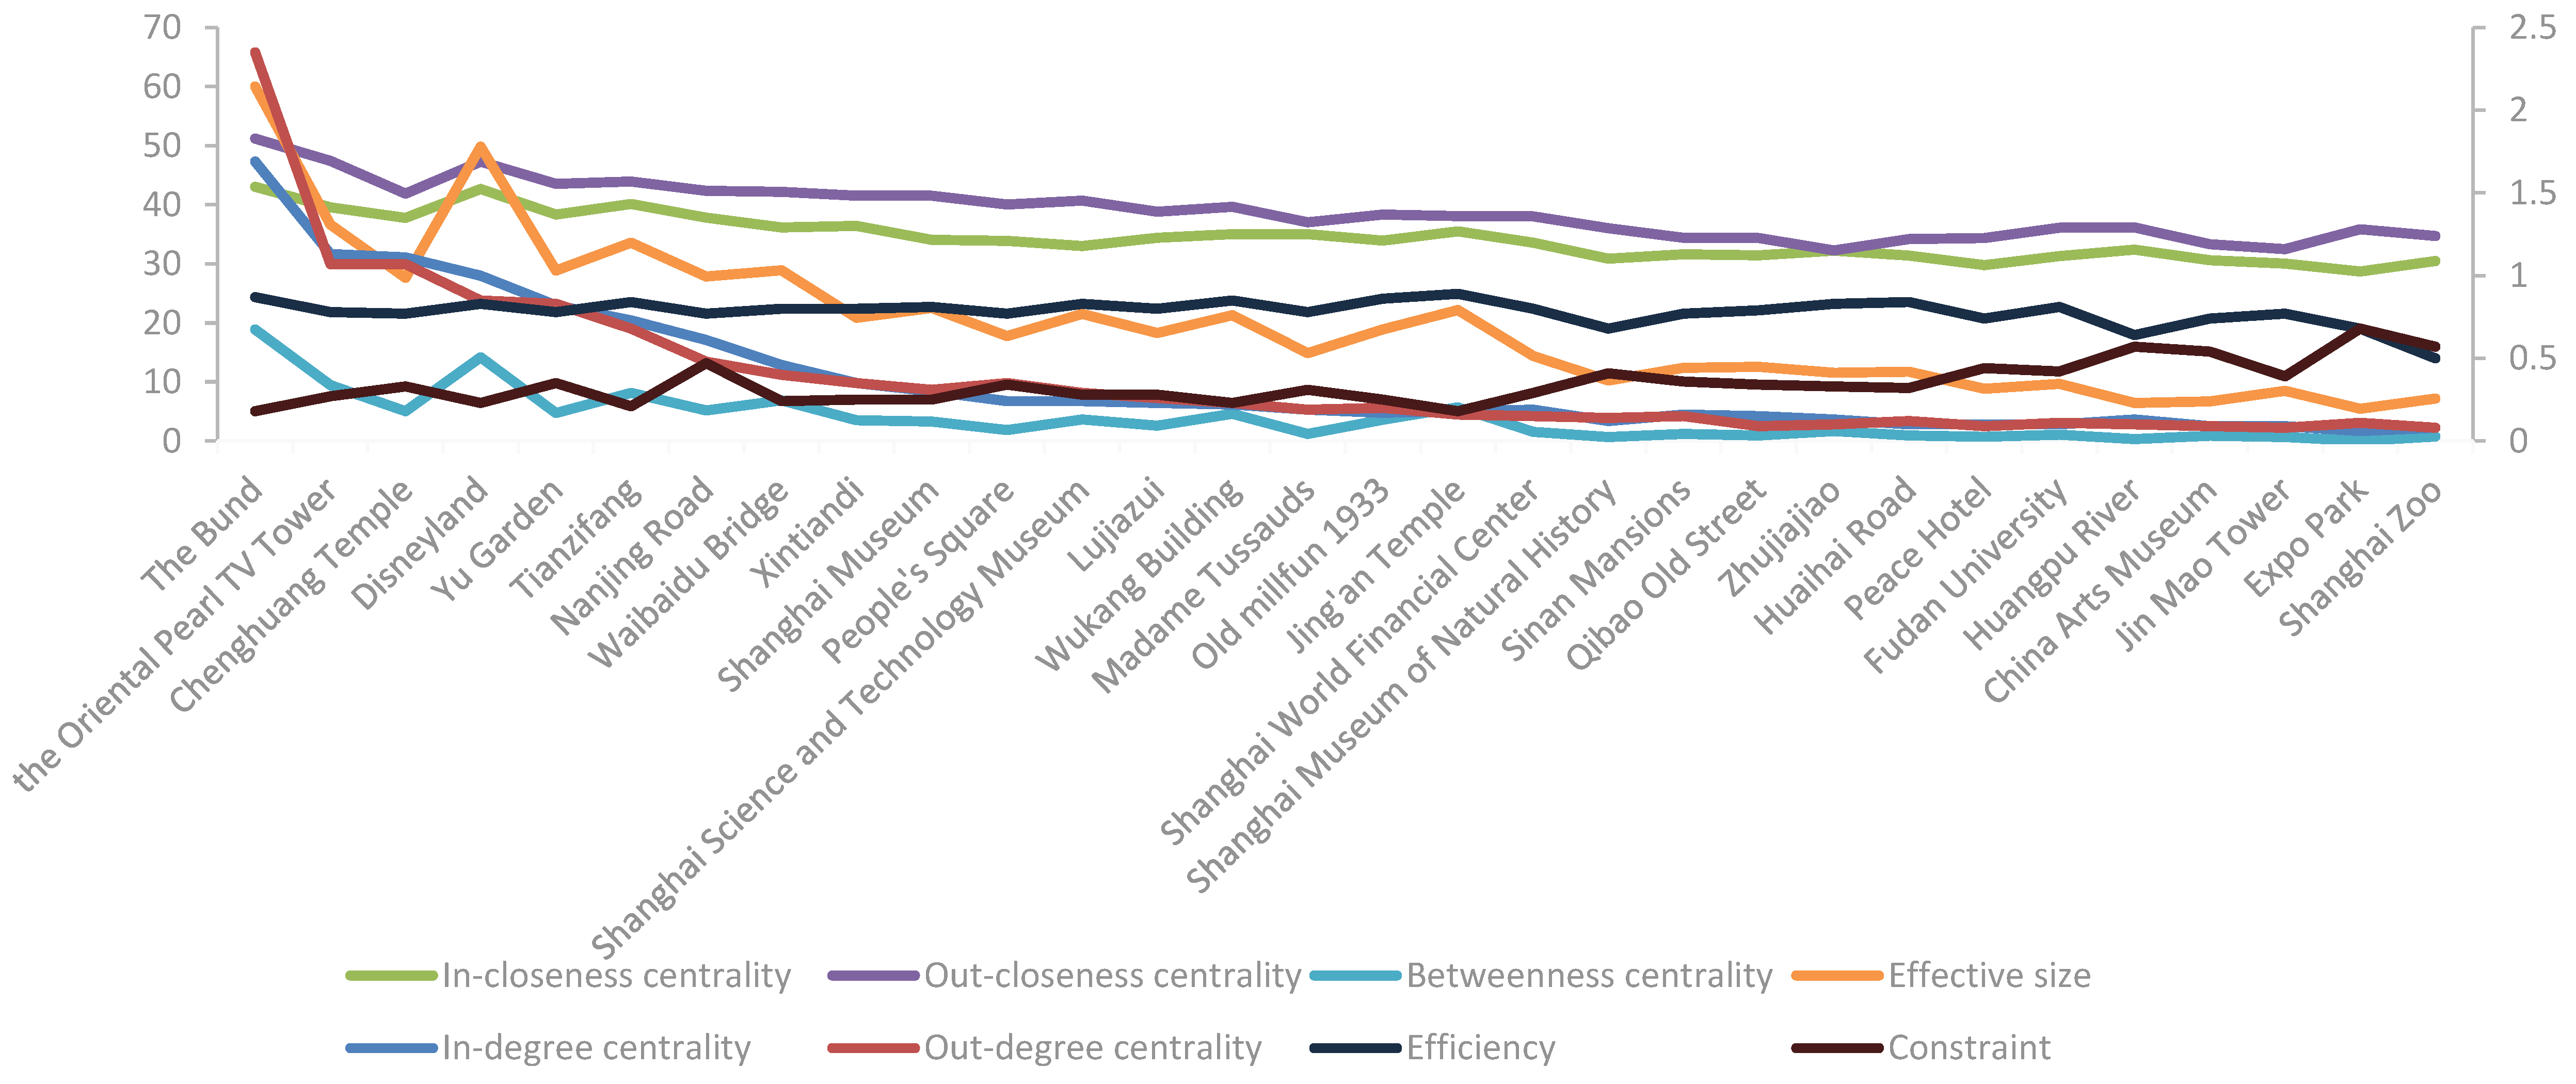
5.1.2. Analysis of Network Nodes after the Opening of Disneyland

After the opening of Disneyland, the index values of Disneyland are in the forefront (Figure 3). The low degree of constraint reflects its relative independence in the overall network, indicating that Disneyland has already played an important role in the spatial network of tourism flows in Shanghai and has become one of the core tourism resources in Shanghai. However, its outward centrality index is slightly higher than that of inward centrality, reflecting that its function as a tourist distribution centre needs to be improved. The four index values of the Bund still rank first, the efficiency value increases, and the constraint value is reduced, reflecting that its core position in the spatial network of domestic tourism flows in Shanghai is strengthened. The index values of the Oriental Pearl TV Tower, Tianzifang, Chenghuang Temple, Yu Garden, and other nodes are still in the forefront and have increased slightly, indicating that the Disneyland project has further strengthened the interconnection of core tourism nodes in Shanghai. The index values of the Shanghai Science and Technology Museum, the Shanghai Wildlife Park, and other nodes have dropped significantly, although they are on the east bank of the Huangpu River with Disneyland, but the connection and integration effect of the line with Disneyland has not been realized as expected, which reflects the relatively independent status of Disneyland.

5.2. Overall Network Analysis

In terms of network size, the number of network nodes decreased from 248 tourism nodes before the opening of Disneyland to 234, and the overall network size decreased. In terms of the network density index, the overall network density declined, of which Disneyland was 2.0788 before the opening and 1.7761 after the opening. In terms of network centralization (Table 2), the index values of degree centralization, out-degree centralization, out-closeness centralization, and betweenness centralization all increased to varying degrees, while the index values of in-degree centralization and in-closeness centralization showed a decreasing trend. The results of the core–periphery analysis (Table 3) show that before the opening of Disneyland, the core in the spatial network of tourism flows in Shanghai was the Bund, the Oriental Pearl TV Tower, Yu Garden, Nanjing Road, Chenghuang Temple and other nodes. After the opening of Disneyland, it became the core of the network.
Using the degree (d) filtering function of Gephi 0.9.2 software for analysis (Table 3), the results show that the Bund is in the core of the network before and after the opening of Disneyland. After its opening, Disneyland became the core of the second layer of the network after the Bund. Compared with before the opening of Disneyland, the core of the third layer of the network after the opening of Disneyland has changed significantly, and only People’s Square, the Shanghai Museum, Xintiandi, Madame Tussauds, Waibaidu Bridge, the Shanghai World Financial Center, and Lujiazui have not changed. The China Art Museum has become the core of the fourth layer of the network, while the Shanghai Science and Technology Museum, the Wukang Building, 1933 Old Millfun, Jing’an Temple, the Shanghai Museum of Natural History, the Sinan Mansions, Qibao Old Street, and Zhujiajiao have become the core of the third layer of the network.
Using Gephi 0.9.2 software to visualize the network, by inputting the spatial data of each tourism node, the FR (Fruchterman Reingold) layout method is selected, and the balanced layout of nodes in the network diagram is formed by the magnitude of the interaction force between the nodes, generating the spatial network structure diagram of Shanghai’s domestic tourism flows before and after the opening of Disneyland (Figure 4). The figure shows that the spatial network of domestic tourism flows in Shanghai before and after the opening of Disneyland has a high core effect; the core effect of the overall network after the opening of Disneyland is more significant, which shows that the opening of Disneyland has brought significant changes to the spatial network structure of tourism flows in Shanghai.
The top 30 nodes in the order of centrality before and after the opening of Disneyland were selected for Gephi 0.9.2 analysis (Figure 5). The network nodes in the analysis results are combined with their actual locations to show the changes in the core tourism nodes and spatial network structure.

5.3. Analysis of Effects

5.3.1. Network Nuclear Overhauser Effect

Before the opening of Disneyland, the Bund, the Oriental Pearl TV Tower, Yu Garden, Nanjing Road, Chenghuang Temple and Tianzifang were highly recognizable tourism nodes for domestic tourists in Shanghai and were also the core areas for domestic tourism flows. Among them, the Bund ranks first in all node indices, such as degree centrality, closeness centrality, betweenness centrality and structural holes, and the distribution of other core nodes also reflected the characteristics of high concentration with the Bund at the core. Therefore, the spatial pattern of tourism development in Shanghai presents a single-core agglomeration model formed by focusing on the Bund area and integrating nearby tourism resources. As a major tourism project, the opening of Disneyland has changed the overall pattern of the distribution of tourism resources in Shanghai. Disneyland has 7 themed areas, a total of 29 key amusement projects, and 24 entertainment performances. The Shanghai international resort at Disneyland as the core also includes Downtown Disney, Wishing Star Lake, Bicester Village in Shanghai, Ecological Garden, Herb Garden, MAXUS Datong Square, G Cube Maker Workshop and other tourism resources, which have formed a tourism destination offering food, accommodation, travel, sightseeing, shopping and entertainment. With its strong brand effect, rich tour content, deep cultural connotations, and in-depth experience, it has become another important tourism growth pole in Shanghai. Various network node analysis indices show that most of the indices of Disneyland have become a core node, second only to the Bund.

5.3.2. Matthew Effect of Nodes

The analysis results of node indices and overall network index characteristics show that after the opening of Disneyland, the degree of core tourism nodes in the spatial network of domestic tourism flows in Shanghai has been strengthened, and the status of some noncore tourism nodes has been weakened, showing a significant Matthew effect. From the degree filtering analysis of Gephi 0.9.2 software, the core tourism nodes in the top three layers increased from 14 before the opening of Disneyland to 22 after the opening of Disneyland. While the network size decreased, the network density also showed a declining trend. The above results all show that the overall connection relationship between the tourism nodes shows a decreasing trend after the opening of Disneyland, but the relationship between the core nodes has become closer. The development of tourism in China is a typical weekend economic model in which tourists travel mostly on weekend trips. As a giant tourism project, Disneyland is extremely rich in tour content; tourists spend a long time visiting Disneyland, which offers enough to support the 1–2 days of tourism, reducing the connection with other tourism nodes. Statistics show that after the opening of Disneyland, 45.71% of the domestic tourists who visited Disneyland were single-node tours. A considerable number of tours did not involve other tourism nodes in Shanghai, or the number of other connected nodes was low, mostly including core tourism nodes such as the Oriental Pearl Tower, the Bund, the Shanghai World Financial Center, and Tianzifang.

5.3.3. Combined Effects of Nodes

Before and after the opening of Disneyland, the standard deviation of degree centrality increased from 0.222 before the opening of Disneyland to 0.279 after the opening of Disneyland, the standard deviation of out-closeness centrality increased from 12.972 to 13.553, and the standard deviation of betweenness centrality increased from 1.729 to 1.948, except for a slight decrease in in-closeness centrality. Other indices are also on the rise, indicating that the heterogeneity of the network has increased, the “small group” effect in the network has increased, which reflects the spatial integration effect of tourism resources in a specific region, and the hierarchical characteristics of the tourism flows network are more significant. The clique analysis of Ucinet 6.0 performs cluster analysis on the closely connected nodes in the network. For a directed network, there is a clique formed by a set of interconnected nodes between each node, and each clique includes at least three nodes. The results show that the number of factions in the tourism flows spatial network increased from 181 before the opening of Disneyland to 199 after the opening of Disneyland. In the case of a decrease in the total number of network nodes, the combination methods are further diversified. For example, before the opening of Disneyland, the combination of nodes with the Bund as the core accounted for 26.99% of the route combination, while after the opening of Disneyland, it accounted for 10.87%, and the combination of other nodes increased significantly. In terms of the spatial clustering of nodes, the combined effect of the core tourism nodes integrating the neighbouring nodes and the combined effect of the belt with important roads and water systems are strengthened. Before the opening of Disneyland, the Bund and the Oriental Pearl Tower, Yu Garden, Chenghuang Temple, the Shanghai World Financial Center, Jin Mao Tower, Waibaidu Bridge, and other nodes combined to form the core tourism group in Shanghai, and the Bund, People’s Square, Peace Hotel, Jing’an Temple, and other nodes combined with Nanjing Road as a link to form a linear tourism combination. In 1933, Old Millfun, Duolun Road culture street, Sweet Love Road, Fudan University, and other nodes, and Tianzifang, Shanghai Jiao Tong University, Xujiahui Park, Expo Park, the China Arts Museum, and other nodes were combined to form secondary tourism groups. After the opening of Disneyland, the combination of the Bund and Disneyland has become the most frequent node combination, and the combination of Disneyland, the Bund and other core nodes in the network has also been strengthened. The analysis results not only reflect the strengthening of the reorganization and grouping trend of the tourism flows spatial network in Shanghai but also verify the Matthew effect of the tourism flows spatial network.

6. Discussion, Conclusion, and Policy Implications

6.1. Discussion

The results of this study show that Disneyland has become the spatial growth pole of Shanghai’s urban tourism development through the spatial network analysis of tourism flows, which validates the views of existing studies [72,73]. The results of this study also further show that Disneyland has an impact on the status of other tourism nodes in the overall network, with a clear reorganization phenomenon among the nodes, especially with a higher degree of combination among the high-grade tourism nodes in Shanghai, while some low-grade tourism nodes are more marginalized. Social network analysis is the main method of this type of research, and Ucinet 6.0 is the most widely used analysis software. This study incorporates Gephi 0.9.2 software analysis to enhance the visual expression effect of the research results. However, the following points need to be further discussed. First, the changes in various indices before and after the opening of Disneyland may not only be affected by a single factor of Disneyland. For example, in recent years, the leisure function of the North Bund has been enhanced to expand the leisure space of the Bund, and Chongming International Ecological Tourism Island has also increased its development efforts to gradually become an important tourism area in Shanghai. The development of areas such as Music Valley and Tilan Bridge and various measures taken by Shanghai municipal governments at all levels around tourism development may also have had a certain impact on the spatial network of tourism flow in Shanghai. Second, this paper analyses the spatial network of tourism flows in Shanghai by drawing on the data collection methods of existing research results and using the spatial information in online travel notes as the main source of research data. However, the research data do not include the spatial data of Shanghai local tourists and foreign tourists, and not all tourists have the habit of writing travel notes, which limits the generalizability of this study’s data. The data source channels should be expanded in future research, especially the collection of field investigation data. Third, this paper focuses on the impact of Disneyland on the spatial network of tourism flows in Shanghai, but as a top international theme park, Disneyland has a huge number of tourists, and the crowding phenomenon is more prominent during peak periods. The influx of a large number of foreign tourists also has a certain impact on the holiday leisure of local citizens in Shanghai. This phenomenon also needs the attention of researchers.

6.2. Conclusions

This paper uses the social network analysis method to conduct a comparative study on the spatial network characteristics of Shanghai’s tourism flows before and after the opening of Disneyland through changes in network node indices and overall network indices and forms the following conclusions. First, Disneyland ranks high in all network index results, which shows that Disneyland has become a new spatial growth pole of Shanghai urban tourism, with an obvious network nuclear Overhauser effect. At the same time, the network indicators of nodes such as the Bund and Yu Garden, Chenghuang Temple, Nanjing Road, and the Oriental Pearl Tower in Shanghai were all high before and after the opening of Disneyland, showing that the Bund and the surrounding areas are still the core areas of Shanghai urban tourism. Shanghai’s urban tourism has formed two spatial growth poles, the Bund and Disneyland, which is in line with the expectations of this study. Second, although the network nuclear Overhauser effect of Disneyland on Shanghai’s tourism spatial structure has already emerged, as a major tourism project, the network connection effect between Disneyland and other tourism nodes in Shanghai has not been fully exerted, and the capacity of radiation needs to be further enhanced, mainly due to the abundant content composition and complete functions of Disneyland itself, which has formed a relatively independent tourism destination. Third, the Matthew effect of nodes shows that after the opening of Disneyland, the connection between high-grade tourism nodes has been further enhanced, while some low-grade tourism nodes have become more marginalized, and their status in the overall spatial network of tourism flow has further declined, such as Shanghai Fisherman’s Wharf, Nanxiang Old Town, Sky Farm and a number of other tourism nodes, which need to take corresponding measures to enhance their relevance in the overall network.

6.3. Policy Implications

First, Shanghai’s urban tourism has formed two development poles, the Bund and Disneyland. The results of this study also show that a strong connection between the two as the core axis of Shanghai’s urban tourism development. However, the radiation and correlation effect on the tourism nodes along the route has not been fully exerted. Combined with the trend of Shanghai urban rail transit lines and the layout of river crossing tunnel, we should focus on the development of secondary tourism axes such as the Bund–Lujiazui–the Shanghai Science and Technology Museum–Disneyland, the Bund–Yu Garden–Chenghuang Temple–the Shanghai Science and Technology Museum–Disneyland, the Bund–Yu Garden–Chenghuang Temple–Expo Park–the China Arts Museum–Disneyland. Through the combination of tourism routes, driving the development of tourism nodes along the route and optimizing the network structure. Second, according to the phenomenon that the weaker-grade nodes in the network are more marginalized, it is necessary to strengthen the thematic and characteristic promotion of these tourism nodes, enhance the energy level, build the brand, enhance the recognition, strengthen the connection with the core tourism nodes, and enhance its status in the overall network. Third, to better integrate Disneyland into Shanghai’s urban tourism development, it is necessary to strengthen top-level planning, focus on the overall industrial development of the city, road traffic system, public service facilities and other aspects of its comprehensive support, enhance the industrial correlation effect and spatial network effect, make Disneyland truly an organic part of Shanghai’s urban tourism, and promote the sustainable development of Shanghai’s urban tourism.

Author Contributions

Conceptualization, H.C. and M.W.; methodology, H.C. and M.W.; software, H.C., M.W. and S.Z.; validation, H.C., M.W. and S.Z.; formal analysis, H.C.; writing—original draft preparation, H.C.; writing—review and editing, H.C., M.W. and S.Z.; supervision, H.C. All authors have read and agreed to the published version of the manuscript.

Funding

This research received no external funding.

Institutional Review Board Statement

The study did not require ethical approval.

Informed Consent Statement

Not applicable.

Data Availability Statement

The data used to support the findings of this study are available from the corresponding author upon request ([email protected]).

Acknowledgments

We thank all graduate research assistants who helped with data collection.

Conflicts of Interest

The authors declare no conflict of interest.

References

  1. Robinson, K.; Burns, R. Proceedings of the 2006 Northeastern Recreation Research Symposium; Forest Service, Northern Research Station: New York, NY, USA, 2006; p. 23. [Google Scholar]
  2. Manning, R.E. Studies in Outdoor Recreation: Search and Research for Satisfaction, 3rd ed.; Oregon State University Press: Corvallis, OR, USA, 2011; pp. 412–468. [Google Scholar]
  3. Sung, N.-C. The Glocalization of Shanghai Disneyland; Routledge: London, UK, 2021. [Google Scholar] [CrossRef]
  4. Cheung, M.; McCarthy, W. “Authentically Disney, distinctly Chinese” and faintly American: The emotional branding of Disneyland in Shanghai. Semiotica 2019, 226, 107–133. [Google Scholar] [CrossRef] [Green Version]
  5. Mittermeier, S. A Cultural History of the Disneyland Theme Parks: Middle Class Kingdoms; Intellect Books: Bristol, UK, 2020. [Google Scholar]
  6. Li, Z.W.; Fang, G. The Lens to See the Construction of Organizational Identities: A Discursive Framework of Shanghai Disneyland. Int. J. Engl. Linguist. 2021, 11, 300. [Google Scholar] [CrossRef]
  7. Zhang, W.Y.; Zhu, L.; Zhang, Z.X.; Zhang, Z.; Lu, L.J. A Sustainable Evaluation Method for a Tourism Public Wayfinding System: A Case Study of Shanghai Disneyland Resort. Sustainability 2020, 12, 8489. [Google Scholar] [CrossRef]
  8. Jiang, Y.Y.; Liu, Y.X.; Wang, N.; Xu, H.B.; Gao, J.; Hong, P.F.; Fang, Y. The spatial dynamics of global inbound tourism network centrality during 2004–2019. Geogr. Res. 2022, 41, 698–712. [Google Scholar] [CrossRef]
  9. Prandi, C.; Nisi, V.; Ribeiro, M.; Nunes, N. Sensing and making sense of tourism flows and urban data to foster sustainability awareness: Areal-world experience. J. Big Data 2021, 8, 51. [Google Scholar] [CrossRef]
  10. Grama, C.N.; Baggio, R. A network analysis of Sibiu County, Romania. Ann. Tour. Res. 2014, 47, 89–93. [Google Scholar] [CrossRef] [Green Version]
  11. Zhu, H.; Liu, J.M.; Long, J.Z.; Yu, L.; Li, T. Urban tourism research in China and the United States based on a “space-theme” framework: Analysis of Ph.D. dissertations on urban tourism in 2008–2017. Prog. Geogr. 2019, 38, 1056–1068. [Google Scholar]
  12. Zheng, W.M.; Ji, H.P.; Lin, C.; Wang, W.H.; Yu, B. Using a heuristic approach to design personalized urban tourism itineraries with hotel selection. Tour Manag. 2020, 76, 103956.1–103956.14. [Google Scholar] [CrossRef]
  13. Boivin, M.; Tanguay, G.A. Analysis of the determinants of urban tourism attractiveness: The case of Québec City and Bordeaux. J. Destin. Mark. Manag. 2019, 11, 69–79. [Google Scholar] [CrossRef]
  14. Carlisle, S.; Johansen, A.; Kunc, M. Strategic foresight for (coastal) urban tourism market complexity: The case of Bournemouth. Tour Manag. 2016, 54, 81–95. [Google Scholar] [CrossRef]
  15. Ashworth, G.; Page, S.J. Urban tourism research: Recent progress and current paradoxes. Tour Manag. 2011, 32, 1–15. [Google Scholar] [CrossRef]
  16. Christaller, W. Some Considerations of Tourism Loca-tion in Europe: The Peripheral Regions-under-developed Countries-recreation Areas. Pap. Reg. Sci. 1964, 12, 95–105. [Google Scholar] [CrossRef]
  17. Lundgren, J.O.J. Tourist Impact/Island Entrepreneurship in the Caribbean; Conference of Latin Americanist Geographers; University of Texas Press: Austin, TX, USA, 1975; pp. 12–19. [Google Scholar]
  18. Haggett, P.; Chorley, R.J. Network Analysis in Geography; Edward Arnold: London, UK, 1969; pp. 54–55. [Google Scholar]
  19. Gregoryd, D.; Johnston, R.; Pratt, G. The Dictionary of Human Geography; Blackwell: Oxford, UK, 2011; pp. 76–79. [Google Scholar]
  20. Gunn, C.A.; Var, T. Tourism Planning; Taylor & Francis: New York, NY, USA, 1988; pp. 122–123. [Google Scholar]
  21. Chan, L.Y.; Lin, H.L.; Wang, C.L. Industry-region Position and Economic Performance of Travel and Tourism Service Industry: An Agglomeration Perspective. Asia Pac. J. Tour. Res. 2012, 17, 562–576. [Google Scholar] [CrossRef]
  22. Li, S.H.; Feng, B.Y. The research progress of agglomeration economic theory on foreign spatial economics: Research on the progress of urban agglomeration economics. Econ. Probl. 2008, 342, 15–21. [Google Scholar] [CrossRef]
  23. Tang, M.G.; Luo, M.L.; Wei, L.; Li, L.; Qin, Z.H. Identification of Chengdu’s leisure and entertainment hotspots based on POI data. Resour. Dev. Mark. 2018, 34, 1191–1195. [Google Scholar] [CrossRef]
  24. Xu, D.; Huang, Z.F.; Lv, L.; Chen, X.Y.; Cao, F.D. Research on spatial characteristics of urban leisure tourism based on POI mining: A case study of Nanjing city. Geogr. Geo-Inf. Sci. 2018, 34, 59–64. [Google Scholar]
  25. Tahir, A.; Aslıhan, D.C.; Meltem, C.; Lawrence, H.N.F. Big data use in determining competitive position: The case of theme parks in Hong Kong. J. Destin. Mark. Manag. 2021, 22, 100668. [Google Scholar]
  26. Todd, G. Impacts of COVID-related capacity constraints on theme park attendance: Evidence from Magic Kingdom wait times. Appl. Econ. Lett. 2020, 28, 14. [Google Scholar] [CrossRef]
  27. Salamiah, A.J.; Norliza, A.; Norliza, A.R. Visitors’ Experiences of Cluster Developments at Theme Parks in Malaysia. Asian Soc. Sci. 2017, 13, 41–48. [Google Scholar] [CrossRef] [Green Version]
  28. Fotiadis, A.K.; Vassiliadis, C.A. Service Quality at Theme Parks. J. Qual. Assur. Hosp. Tour. 2016, 17, 178–190. [Google Scholar] [CrossRef]
  29. Kuang, H.Y.; Jiang, R.C. Theme Park Resources and Memorable Tourism Experience. Econ. Manag. J. 2019, 1, 137–155. [Google Scholar] [CrossRef]
  30. Li, Y.W. Theme park: Its impactson regional economy and its own construction and development. Econ. Geogr. 2005, 25, 694–697. [Google Scholar]
  31. Duan, X.; Chan, C.S.; Marafa, L.M. Does authenticity exist in cultural theme parks? A case study of Millennium city park in Henan, China. J. Tour. Cult. Chang. 2019, 17, 321–338. [Google Scholar] [CrossRef]
  32. Shinde, K.A. Religious theme parks as tourist attraction systems. J. Herit. Tour. 2021, 16, 281–299. [Google Scholar] [CrossRef]
  33. Zuo, B.; Lu, J.M. An Empirical Study on the Factors Influencing the Location of Theme Parks in China. Trop. Geogr. 2018, 38, 781–790. [Google Scholar] [CrossRef]
  34. Dong, G.Z. Trend and stratagem of the evolvement on theme park. Hum. Geogr. 2005, 20, 43–46. [Google Scholar]
  35. Lu, S.; Yang, X.Z.; Tang, W.Y. On the Tourist Impact of Urban Residents’ Perceptions and Attitude on the Mega Theme Parks: A Case Study of Fantaworld Adventure in Wuhu City. Tour. Trib. 2011, 26, 45–52. [Google Scholar]
  36. Zhang, T.T.; Wang, C.Y.; Zhang, J.L. On the Relationship between Theme Park’s Constructions and Regional Economy: A Case of Disney Theme Park. Mod. Urban Res. 2010, 25, 85–90. [Google Scholar] [CrossRef]
  37. Liang, Z.X. Theme Park Development and Mangement; Chongqing University Press: Chongqing, China, 2019; pp. 126–211. [Google Scholar]
  38. Zhang, Y.S.; Li, X.; Su, Q.; Hu, X.B. Exploring a theme park’s tourism carrying capacity: A demand-side analysis. Tour. Manag. 2017, 59, 564–578. [Google Scholar] [CrossRef]
  39. Xiao, N.; Huang, Y.; Liu, J.S. Evaluation and spatial differentiation of tourism experience quality of theme park in China. Sci. Geogr. Sin. 2019, 39, 978–986. [Google Scholar] [CrossRef]
  40. Bendle, L.J. The structures and flows of a large tourist itinerancy network. Curr. Issues Tour. 2018, 21, 103–122. [Google Scholar] [CrossRef]
  41. Lozano, S.; Gutierrez, E. A complex network analysis of global tourism flows. Int. J. Tour. Res. 2018, 20, 588–604. [Google Scholar] [CrossRef]
  42. Hossein, R.; Rodolfo, B.; Llandis, B.P.; Gregory, W. Hyperlink Network Analysis of a Tourism Destination. J. Travel Res. 2017, 57, 671–686. [Google Scholar] [CrossRef] [Green Version]
  43. Mou, N.X.; Yuan, R.Z.; Yang, T.F.; Zhang, H.C.; Tang, J.W.; Teemu, M. Exploring spatio-temporal changes of city inbound tourism flow: The case of Shanghai, China. Tour Manag. 2020, 76, 151–164. [Google Scholar] [CrossRef]
  44. Shih, H.Y. Network characteristics of drive tourism destinations: An application of network analysis in tourism. Tour Manag. 2005, 27, 1029–1039. [Google Scholar] [CrossRef]
  45. Liu, P.; Zhang, H.; Zhang, J.; Sun, Y.; Qiu, M.Y. Spatial-temporal response patterns of tourist flow under impulse pre-trip information search: From online to arrival. Tour Manag. 2019, 73, 105–114. [Google Scholar] [CrossRef]
  46. Lin, L.; Kang, Z.L.; Gan, M.Y.; Ye, J.Y. An analysis of the spatial field effects of tourist flow of Taiwanese visiting Mainland China based on airports. Geogr. Res. 2007, 26, 403–413. [Google Scholar] [CrossRef]
  47. Zeng, B.; He, Y. Factors influencing Chinese tourist flow in Japan-a grounded theory approach. Asia Pac. J. Tour. Res. 2019, 24, 56–69. [Google Scholar] [CrossRef]
  48. Accetturo, A.; Cascarano, M.; Degasperi, P.; Modena, F. The effects of common culture and language on economic exchanges: Vi-dence from tourist flows. Reg. Stud. 2019, 53, 1575–1590. [Google Scholar] [CrossRef]
  49. Zhang, Z.; Bao, J.G. Effects of multiple distances on inbound and outbound tourism flows in China: A configuration-based perspective. Sci. Geogr. Sin. 2021, 41, 13–21. [Google Scholar] [CrossRef]
  50. Balli, F.; Balli, H.O.; Cebeci, K. Impacts of exported Turkish soap operas and visa-free entry on inbound tourism to Turkey. Tour Manag. 2013, 37, 186–192. [Google Scholar] [CrossRef]
  51. Khalid, U.; Okafor, L.E.; Burzynska, K. Do regional trade agreements enhance international tourism flows? Evidence from a cross-country analysis. J. Travel Res. 2021, 61, 1391–1408. [Google Scholar] [CrossRef]
  52. Liu, D.J.; Chen, J.Z.; Jia, Y.Y. Characteristic of tourist flow network in Chengdu-Chongqing urban agglomeration under the influence of high-speed railway. World Reg. Stud. 2020, 29, 549–556. [Google Scholar] [CrossRef]
  53. Xu, D.; Huang, Z.F.; Huang, R. The spatial effects of haze on tourism flows of Chinese cities: Empirical research based on the spatial panel econometric model. Acta Geogr. Sin. 2019, 74, 814–830. [Google Scholar] [CrossRef]
  54. Liu, D.J.; Chen, J.Z.; Jia, Y.Y. Influence of Jiuzhaigou earthquake on the geographical distribution and flow of regional tourist flows. J. Arid. Land Res. Environ. 2020, 34, 1–208. [Google Scholar] [CrossRef]
  55. Liu, S.; Zhang, J.; Liu, P.X.; Xu, Y.F.; Xu, L.; Zhang, H.L. Discovering spatial patterns of tourist flow with multi-layer transport networks. Tour. Geogr. 2021, 23, 1–23. [Google Scholar] [CrossRef]
  56. Chung, M.G.; Herzberger, A.; Frank, K.A.; Liu, J.G. International tourism dynamics in a globalized world: A social network analysis approach. J. Travel Res. 2020, 59, 387–403. [Google Scholar] [CrossRef]
  57. Yan, S.S.; Jin, C. Spatial Network Structure of the City-Level Tourist Flow Based on Multisource Data: A Case Study of Luoyang. Econ. Geogr. 2019, 39, 31–240. [Google Scholar] [CrossRef]
  58. Wang, C.H.; Tang, C.S.; Qiao, H.H.; Zhang, W.; Xing, L.Y. Spatial Structure Characteristics of Rural Tourism Flow Based on Digital Footprint: Taking Huzhou City in Zhejiang Province for Example. Econ. Geogr. 2020, 40, 225–240. [Google Scholar] [CrossRef]
  59. Wang, L.C.; Yan, C.X.; Li, W. Research on Spatial-temporal Characteristics of Tourist Flow Based on Sina Microblog LBS Data: An Case Study of Lanzhou. Tour. Trib. 2017, 32, 94–105. [Google Scholar] [CrossRef]
  60. Liu, Y.W.; Liao, W. Spatial characteristics of the tourism flows in China: A study based on the Baidu index. ISPRS Int. J. Geo-Inf. 2021, 10, 378. [Google Scholar] [CrossRef]
  61. Choi, K.H.; KIM, I. Co-movement between tourist arrivals of inbound tourism markets in South Korea: Applying the dynamic copula method using secondary time series data. Sustainability 2021, 13, 1283. [Google Scholar] [CrossRef]
  62. Nistor, M.M.; Nicula, A.S. Application of GIS technology for tourism flow modelling in the United Kingdom. Geogr. Tech. 2021, 16, 1–12. [Google Scholar] [CrossRef]
  63. Chen, H.; Lu, L.; Zheng, S.T. The Spatial Network Structure of the Tourism Destinations in Urban Agglomerations Based on Tourist Flow: A Case Study of the Pearl River Delta. Acta Geogr. Sin. 2011, 66, 257–266. [Google Scholar] [CrossRef]
  64. Ju, S.L.; Tao, Z.M.; Lai, Z.Q.; Chen, H.; Xu, Z. Research on Network Structure Evolution of Domestic Tourist Flow System in Zhejiang Province. Geogr. Geo-Inf. Sci. 2015, 31, 91–97, 114. [Google Scholar] [CrossRef]
  65. Guo, X.M.; Li, W. The social network analysis of tourism economic ties in Yunnan province based on the tourist flow angle of view. Tour. Res. 2014, 6, 88–94. [Google Scholar] [CrossRef]
  66. Liu, J.S.; Ma, Y.F. The evolution and driving mechanism of the supply and demand coupling about tourism flow and destination system based on the genesis and system theory: Taking Xi’an as an example. Geogr. Res. 2017, 36, 1583–1600. [Google Scholar] [CrossRef]
  67. Zhou, L.; Wu, D.T.; Yu, H.; Wang, Y.M.; Ma, T.; Hu, C. Evolution of Urban Tourism Flow Network Structure Based on Network Travet al Notes: A Case Study of Beijing City. Sci. Geogr. Sin. 2020, 40, 298–307. [Google Scholar] [CrossRef]
  68. Yang, X.Z.; Gu, C.L.; Wang, Q. Urban Tourism Flow Network Structure Construction in Nanjing. Acta Geogr. Sin. 2007, 62, 609–620. [Google Scholar] [CrossRef]
  69. Yang, Z.; Liu, Y.T.; Qin, J.F.; Liu, B.; Wang, P.P.; Liu, S.J.; Xu, Z.Y. Spatial structure of tourist market and its influencing factors in the Yangtze River Delta theme parks: A case study of Shanghai Happy Valley, Changzhou Dinosaur Park and Wuhu Fangte. J. Nat. Resour. 2021, 36, 722–736. [Google Scholar] [CrossRef]
  70. Marcos, A.D.; Beatrice, D.H.; Claudia, G.N.; Nicola, P. Analysing domestic tourism flows at the provincial level in Spain by using spatial gravity models. Int. J. Tour. Res. 2020, 22, 403–415. [Google Scholar] [CrossRef]
  71. Hwayoon, S.; Yoonjae, N.; George, A.B. A social network analysis of international tourism flow. Qual. Quant. 2021, 55, 419–439. [Google Scholar] [CrossRef]
  72. Zha, X.L.; Xu, Y.C.; Lu, L.; Zhao, H.R. Geographical distribution and flows of Chinese visitors to Shanghai Disneyland. Tour. Trib. 2019, 34, 58–73. [Google Scholar] [CrossRef]
  73. Wei, H.Y.; Dai, Z.F.; Xu, X.; Feng, X.G. The Impact of Shanghai Disneyland on Shanghai’s Tourist Flow Network: From the Perspective of Tourists’ Digital Footprints on the Lvmama Website. Tour. Trib. 2018, 33, 33–45. [Google Scholar]
Figure 1. Distribution map of important tourism nodes in Shanghai. Note: This map is based on the standard map with approval number GS(2019)3266 downloaded from the standard map service website of the Ministry of Natural Resources.
Sustainability 14 13973 g001
Figure 2. Analysis results of the spatial network index of tourism flows in Shanghai before the opening of Disneyland. Note: In the figure, the data on the primary vertical axis are in-closeness centrality, out-closeness centrality, betweenness centrality, and effective size, and the data on the secondary vertical axis are in-degree centrality, out-degree centrality, efficiency, and constraint.
Sustainability 14 13973 g002
Figure 3. Analysis results of the spatial network index of tourism flows in Shanghai after the opening of Disneyland. Note: In the figure, the data on the primary vertical axis are in-closeness centrality, out-closeness centrality, betweenness centrality, and effective size, and the data on the secondary vertical axis are in-degree centrality, out-degree centrality, efficiency, and constraint.
Sustainability 14 13973 g003
Figure 4. Comparison of the spatial network structure of tourism flows before and after the opening of Disneyland ((a): before the opening of Disneyland, (b): after the opening of Disneyland). Note: In the figure, the size and colour of the nodes and the width and colour of the connection lines are expressed by the colour change in the band from left to right.
Sustainability 14 13973 g004
Figure 5. Comparison of the spatial network structure of tourism flows of major nodes before and after the opening of Disneyland ((a): before the opening of Disneyland, (b): after the opening of Disneyland). Note: In the figure, the size and colour of the nodes and the width and colour of the connection lines are expressed by the colour change in the band from left to right.
Sustainability 14 13973 g005
Table 1. Basic information of the study sample.
TypeRatio (%) TypeRatio (%)
Travel daysone-day trip26.54Companioncouple7.05
two-day trip34.36parents8.48
three-day trip22.90friends29.00
other16.20child24.81
Means of transportationhigh-speed rail34.39alone19.41
airplane44.06lovers11.25
train13.34City transportationmetro/bus88.96
vehicle2.20other11.04
self-drive6.01
Source of touristsIn descending order: Jiangsu, Zhejiang, Beijing, Guangdong, Liaoning, Shandong, Fujian, Tianjin, Sichuan, Anhui, Hubei, Chongqing, Hunan, Hebei, Shaanxi, Jilin, Henan, Jiangxi, Yunnan, Heilongjiang, Shanxi, Gansu, Xinjiang, Hainan, Inner Mongolia, Guangxi, Guizhou, Tibet, Qinghai, Ningxia
Table 2. Changes in network centralization before and after the opening of Disneyland.
Before OpeningAfter Opening
Degree centralization2.170%2.730%
In-degree centralization1.768%1.628%
Out-degree centralization1.708%2.296%
In-closeness centralization49.950%42.920%
Out-closeness centralization52.360%59.500%
Betweenness centralization17.010%18.820%
Table 3. Core–edge comparison of the tourism flows spatial network before and after the opening of Disneyland.
Ucinet6.0
Core–Peripheral Analysis
Gephi0.9.2 Degree (d) Filter Analysis
Core NodePeripheral NodeThe First Layer
(d ≥ 2)
The Second Layer
(2 > d ≥ 1)
The Third Layer
(1 > d ≥ 0.2)
The Fourth Layer (d < 0.2)
Before openingThe Bund, the Oriental Pearl TV Tower, Yu Garden, Nanjing Road, Chenghuang Templeother
nodes
The Bundthe Oriental Pearl TV Tower, Nanjing Road, Chenghuang Temple, TianzifangYu Garden, People’s Square, Shanghai Museum, Xintiandi, Madame Tussauds, China Arts Museum, Waibaidu Bridge, Shanghai World Financial Center, Lujiazuiother
nodes
After openingDisneyland, Chenghuang Temple, The Bund, Yu Garden, the Oriental Pearl TV Towerother
nodes
The BundDisneyland, the Oriental Pearl TV Tower, Chenghuang Temple, Yu Garden, Tianzifang, Nanjing RoadWaibaidu Bridge, Xintiandi, Shanghai Museum, People’s Square, Shanghai Science and Technology Museum, China Arts Museum, Wukang Building, Madame Tussauds, 1933 Old Millfun, Lujiazui, Shanghai World Financial Center, Shanghai Museum of Natural History, Sinan Mansions, Qibao Old Street, Zhujiajiaoother
nodes
Publisher’s Note: MDPI stays neutral with regard to jurisdictional claims in published maps and institutional affiliations.

