Abstract
Given the vitality of the renewable-energy grid market, the optimal allocation of clean energy is crucial. An optimal dispatching method for source–load coordination of renewable-energy grid is proposed. An improved K-means clustering algorithm is used to preprocess the source data and historical load data. A support vector machine is used to predict the cluster of renewable-energy grid resources and load data, and typical scenarios are selected from the prediction results. Taking typical scenarios as a representative, the probability distribution of wind power output is accurately obtained. An optimization model of the total operation cost of the renewable-energy grid is established. The experimental results show that the algorithm reduces the error between the predicted value and the actual value. Our method can improve the real-time prediction accuracy of the renewable-energy grid system and increase the economic benefits of the renewable energy grid.
1. Introduction
In order to solve environmental problems such as over-consumption of traditional energy and increasingly serious air pollution, clean, efficient and flexible renewable energy generation technology has gradually resulted in the development of electric energy [1,2]. As a new type of micro-power system, the renewable-energy grid can effectively support the local consumption and grid-connected transmission of new energy [3,4]. However, renewable energy with uncertain factors such as randomness, volatility and intermittency seriously affects the optimal operation of the renewable-energy grid [5]. Further improvements are required for operation safety, consumption efficiency and economic benefits of the renewable-energy grid [6]. Compared with the traditional source–load forecasting method, a machine learning algorithm can build a more accurate short-term forecasting model by using historical source–load data for training. At present, there are many kinds of machine learning algorithms for short-term prediction of source and load, and selecting a suitable algorithm can better achieve an accurate source and load prediction [7].
Based on a proposed machine learning fusion algorithm, this study constructed a grid dispatching optimization framework for renewable energy. Through a fusion algorithm, historical source and load data were clustered and trained, and clustering results were obtained according to the similarity of historical source and load. According to the training results, an economic dispatch model of renewable-energy grid with coordinated source and load was constructed, and the model predictive control MPC algorithm was used to carry out real-time rolling correction control of the economic dispatch model to reduce the error between the short-term source and load forecast value and the actual target value. Finally, it was concluded that the method can reduce the operating cost of the renewable energy grid, verify the validity and feasibility of the model, and enhance the adaptability of the renewable energy grid.
2. Related Work
2.1. The Main Challenges Facing the Power Distribution System in the Context of “Double Carbon”
To utilize the new features, the power distribution system faces the following main three problems: (1) static problems, that is, economic dispatch and operation problems caused by the uncertainty of loads such as distributed power and electric vehicles; (2) dynamic problems, that is, the stability and power quality deterioration caused by the low inertia characteristics of power electronic equipment and the complex dynamic interaction; (3) management problems, that is, the management and regulation of a large number of non-grid assets. On the one hand, a large number of new energy distributed power generation devices are connected to the power supply side, which makes it difficult for the system to formulate a scheduling plan [8]. On the other hand, the disordered and random charging of a large number of electric vehicles brings about load uncertainty, although there is an emergence of new power supply-and-consumption modes such as customized power and demand-side response [9,10,11]. The dual uncertainty of the power generation side and the load side exacerbates the problem of peak-to-valley difference in the distribution system. The anti-peak regulation characteristics of the output of the new energy power generation device (in extreme cases) and the randomness of the load seriously restrict the new energy consumption in the distribution system. Capacity reduces the economic benefits of the operation of the power distribution system [12].
The problem of power quality decline is prominent. The connection of a large amount of power-electronic equipment effects the harmonic sources of the power distribution system and there is a trend towards high density, decentralization and network-wide distribution, which affects the quality of power supply. In addition, the influence of power-electronic equipment on grid faults and voltage flicker is not yet clear. The trend of asset digitization and equipment intelligence supports the transformation of the distribution network, which will also lead to new problems in the distribution network [13,14]. On the other hand, due to the increase in intelligent equipment, information security and behavioral security are also issues that require attention.
2.2. K-Means
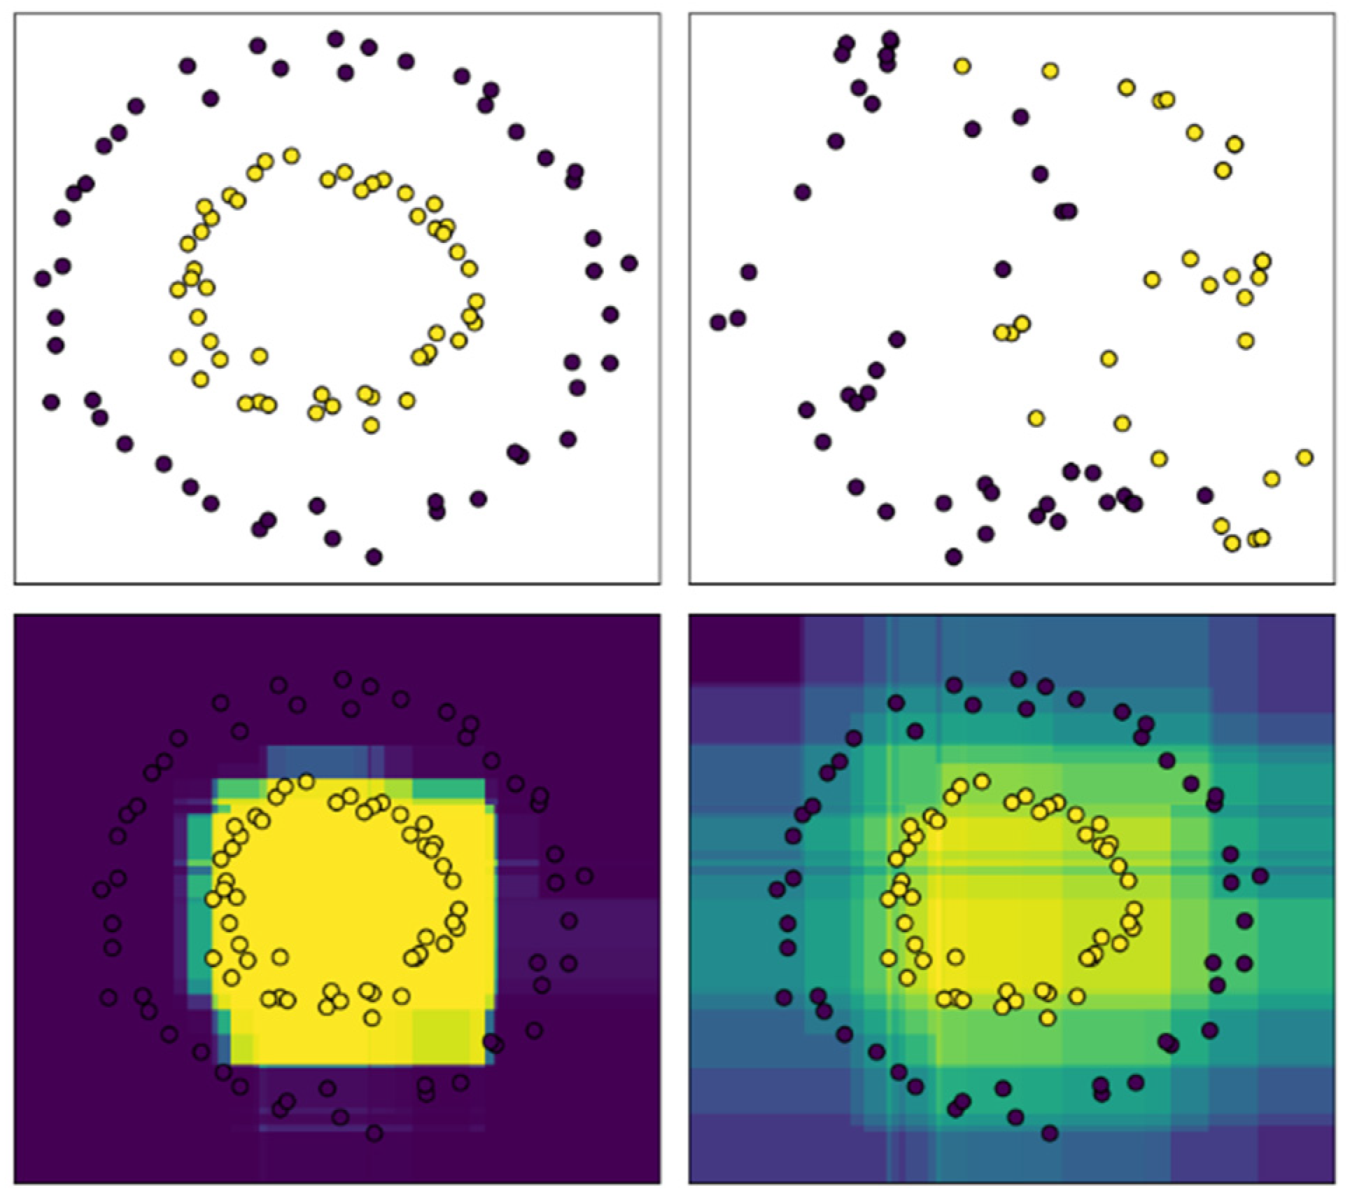
The K-means algorithm is an unsupervised learning and partition-based clustering algorithm [15]. The Euclidean distance is generally used measure the similarity between data objects. The similarity is inversely proportional to the distance between the data objects. The larger the Euclidean distance, the smaller the distance, see Figure 1. The algorithm pre-specifies the initial number of clusters k and k initial cluster centers, and continuously updates the position of the cluster centers according to the similarity between the data objects and the cluster centers, and continuously reduces the sum of the squared errors (SSE) of the clusters. When the SSE no longer changes or the objective function converges, the clustering ends and the final result is obtained. The core idea of the K-means algorithm is: first randomly select k initial cluster centers (1 ≤ ≤ k) from the data set, calculate the Euclidean distance between the remaining data objects and the cluster centers , determine the distance from the target data object to the nearest cluster center and assign the data object to the cluster corresponding to the cluster center . Then calculate the average value of the data objects in each cluster as the new cluster center, and perform the next iteration until the cluster center does not change or reaches the maximum number of iterations. To determine when to stop the calculation of the Euclidean distance between the data object and the cluster center in the space the formula is:
where is the data object, is the cluster center, is the dimension of the data object and and are the attribute values of and . The SSE calculation formula of error square sum of the whole data set is:

Figure 1.
Iterative process of K-Means algorithm.
2.3. SVM
Support vector machine theory has gained extensive attention in recent years because of its solid theoretical foundation and many beneficial characteristics. It has been proved that the Structural Risk Minimization (SRM), which is one of the most basic ideas of SVM, is superior to traditional Empirical Risk Minimization (ERM). Unlike ERM, which tries to minimize the error on the training set, SRM tries to minimize the upper bound of the VC dimension so that its learning machine obtains better generalization performance, which is one of the most important goals of statistical learning theory. The advantage of SVM is that its method is based on the VC dimension theory of statistical learning theory and the principle of structural risk minimization (i.e., the ability to identify any sample without error) to seek the best compromise, in order to obtain the best generalization ability [16,17]. Several advantages of the support vector machine method are that it can: solve machine learning problems in the case of small samples, improve generalization performance, solve high-dimensional problems, solve nonlinear problems and avoid neural network structure selection and answer the local minima point question. The SVM originally studied has been used to solve binary classification problems but cannot be directly applied to multi-class classification problems. How to effectively extend it to multi-class classification problems is still a research problem. There are already algorithms to generalize SVM to multi-class classification problems, and these algorithms are collectively referred to as “Multi-Category Support Vector Machines” (M-SVMs) [18,19]. They can be roughly divided into two categories: first, the multi-class classification algorithm based on the improved objective function proposed by [20] in 1998 combines the parameter solutions of multiple classification surfaces into an optimization problem, and solves the optimal problem. The optimization problem achieves multi-class classification “at once”. Second, a series of two-class classifiers can be constructed in some way and combining them achieves multi-class classification. Although the first type of method appears simple, compared to the second method, there are far more variables in the process of solving optimization problems, the training speed is not as good, and it is not dominant in classification accuracy. These problems are more prominent when the number of training samples is very large. For this reason, the second type of method is more commonly used. There are four main branching algorithms in this type of method: one-to-many algorithm, one-to-one algorithm, DAGSVM directed acyclic graph, and ECOC error correction code. Although these methods have a theoretical basis, there is an optimization problem that leads to a lot of time in the training process so they have not been well applied. Only the one-to-one algorithm and the DAGSVM directed acyclic graph are applied in practice. Moreover, since one-to-many SVMs and one-to-one SVMs need to use all classifiers when classifying unknown samples, and the classification results are independent of the order in which the classifiers are used, their combination is unique. There are many ways to combine the directed acyclic graphs in DAGSVM, but experiments have shown that the combination changes have little effect on the classification results and the number of tests of DAGSVM and ECOC is at least N times, so it will not be well applied when there are many categories.
3. Methodology
3.1. Coordination and Dispatching Framework of Renewable-Energy Grid Source and Load Based on Machine Learning
3.1.1. Renewable-Energy Grid Dispatching Optimization Framework
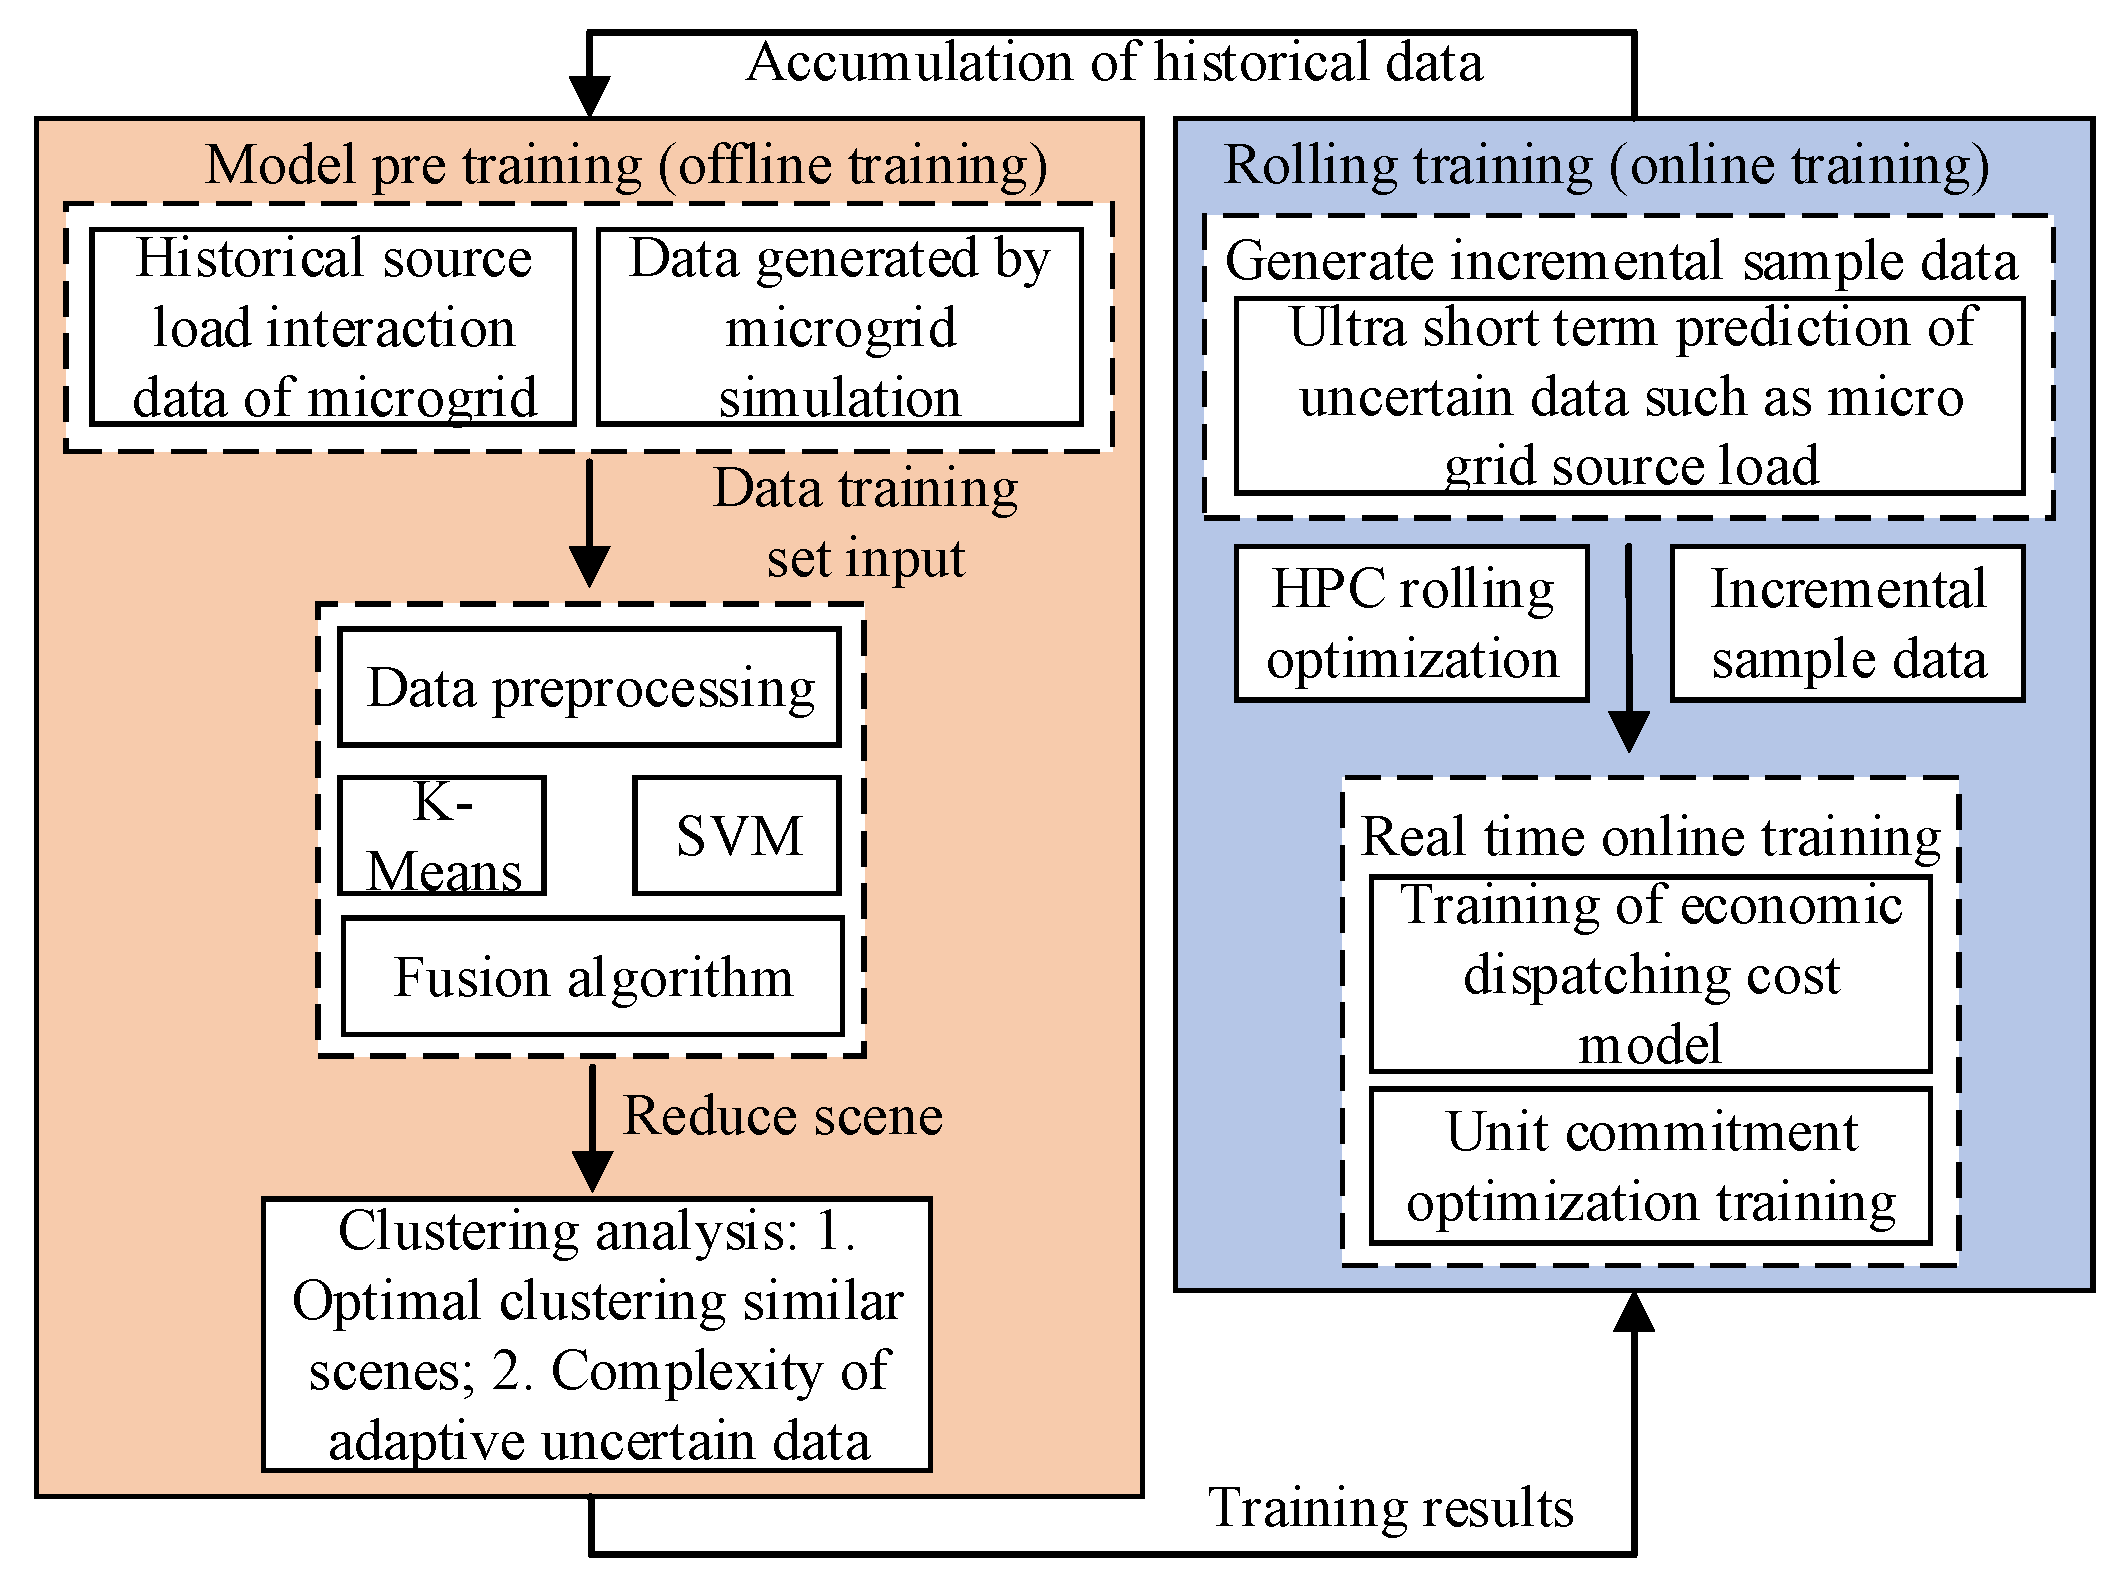
The historical training set has a great influence on the prediction results of the short-term load forecasting model for the renewable-energy grid based on the machine learning proposed in this paper. The historical data extends the time it takes to train models on renewable energy grids. In order to solve the above contradictions, this paper combines two methods of offline training and online training to build a renewable-energy grid optimization scheduling architecture with model pre-training and rolling training, as shown in Figure 2. Fusion algorithm model pre-training is an offline training method. Its working principle is based on the fusion algorithm of semi-supervised K-means clustering and a support vector machine. It uses the idle time before and after the online training of the system to train the historical data of renewable-energy grid sources-and-loads. Furthermore, simulated data, represented by the clustering scenario of similar days with uncertain parameters, and the model’s predictive control algorithm conducts online training on the training data in the offline training pre-dispatching and real-time scheduling stages of the renewable-energy grid to realize real-time rolling training and reduce prediction errors. This provides optimal scheduling results that conform to real-time operating conditions.
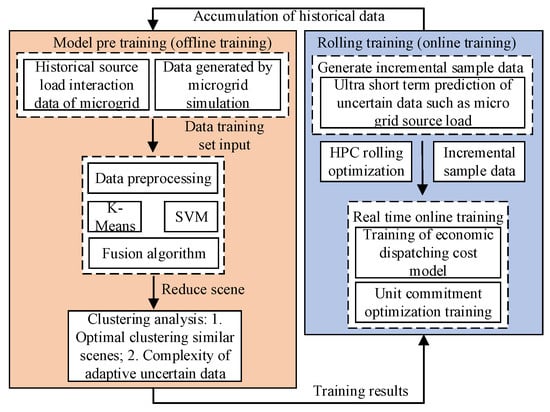
Figure 2.
Microgrid scheduling optimization framework supported by machine learning.
3.1.2. Renewable-Energy Grid Economic Dispatch Optimization Model
This paper considers the renewable-energy grid market reward- and punishment-costs and equipment operation- and maintenance-costs, and uses historical interactive data and wind power load forecasts as the benchmark scenarios to determine the power generation, start and stop of generator sets, charge and discharge of energy storage units and purchase and sale of electricity from the main grid, etc., in order to achieve the source–load dispatching target of the optimal operating cost of the renewable energy grid. The source–load coordination interaction variable is introduced into the economic dispatch model, and a two-layer source–load coordination model is constructed to improve the matching degree of wind power and electricity load and reduce the amount of abandoned wind. The upper model constructed is:
where is the electricity load on the user side and is the wind power output. The constraints of the upper model are:
In the formula, is the electricity load in the period t after the user’s demand response, is the maximum load increase rate, is the load change, and are the peak and valley electricity prices after the response, respectively; and is user satisfaction and its lower limit. The construct of the lower-level model with the goal of minimizing the total operating cost of the renewable energy grid, and inputting the user-load power obtained from the upper-level model into the power balance constraint of the lower-level model, then the lower-level cost objective function is:
where T is the total number of time periods, and T = 24 in the pre-dispatch stage; is the fuel cost of the renewable-energy grid gas turbine; is the operation and maintenance cost of the distributed power generation equipment; is the reward and punishment cost; is the renewable-energy grid and the main grid interaction costs. The expression of each variable in Formula (5) is:
where and are the output and power generation efficiency of the micro-turbine, respectively; is the unit dispatch time; and are the price of natural gas and low calorific value, respectively; and are the unit maintenance cost of the distributed generator set and energy storage equipment, respectively; is the charging and discharging power of the energy storage device; and are the inequality and equality constraints, respectively; and are the current stage and standard energy utilization rate, respectively; is the reward income for improving the unit standard energy utilization rate; is the penalty fee for increasing the unit standard of polluted exhaust gas; and are the amount of polluted exhaust gas discharged during the operation stage and the allowable standard polluted exhaust gas discharge, respectively; and are the penalty factors when the conditions are not met, and are generally used to meet the constraints. Taking the maximum value; is the power purchased and sold by the renewable-energy grid and the main grid, the positive value is the power purchase, and the negative value is the power sale; and are the purchase and sale prices, respectively.
In order to ensure the stable and coordinated operation of all of the energy supplying equipment in the pre-dispatch stage of the renewable energy grid, the paper takes power balance, wind power, unit climbing, landslide power, energy storage equipment and power interaction as model constraints, equality constraints and inequality constraints. The conditional expressions are:
where is the electricity price in the period after the user-side demand response; , and are the output of the wind turbine and its upper and lower limits, respectively; and are the lower limit and upper limit of the ramp rate of the distributed generator set, respectively; and are the minimum and maximum values of the transmission power of the tie line, respectively; and are the minimum and maximum values of the energy storage output, respectively; and are the minimum and maximum values of the energy storage system charge in the period , respectively.
3.2. Short-Term Prediction Method Combining Semi-Supervised K-Means and SVM
The working principles of the semi-supervised K-means algorithm and the SVM algorithm have been described in widely in the literature, so are not repeated here. The aim of the fusion algorithm model based on two kinds of machine learning proposed in this paper is to calculate the similarity between different samples in the sample set, and group the samples with high similarity into a cluster, to realize the division of renewable-energy grid samples. However, the predicted probability results obtained by the semi-supervised K-means and SVM algorithms are not on the same scale, so this paper normalizes the confidence of the two, and finally gives the final clustering result. The probability of the fusion algorithm after normalization is:
where , and are the cluster prediction probability of K-means algorithm, SVM algorithm and fusion algorithm, respectively; HS—K and HSVM are the confidence of the predicted probability of the K-means algorithm and the SVM algorithm, respectively; is the weight adjustment coefficient; and U is the set of samples . First, on the basis of a large amount of historical data, the wind power generation and load demand are screened according to the classical scenario analysis method, and the probability distributions that the actual wind power data and typical data obey in each time period of the day are determined. Second, the probability distribution of scenarios and time periods under different conditions is determined by the roulette method, and the large number of wind power sample scenarios that have been generated are reduced. When using the fusion machine-learning algorithm to reduce the scene, the typical scene is used as the representative of a large number of complex scenes to accurately obtain the branch information. In order to reduce the error between the actual output value of the distributed power supply and the real-time scheduling target value, it is necessary to correct the distributed values. The charging and discharging power of the power supply and the energy storage equipment enhances the adaptability of the renewable-energy grid and ensures the safe, stable and economical operation of the renewable-energy grid. The real-time correction objective function is:
where and are the predicted and corrected values of the renewable-energy grid and the main grid traded electricity in the t period, respectively; and are the predicted and corrected values of the energy storage output in the t period, respectively; and are the output of the distributed power generation equipment in the t period, respectively. The predicted value and revised value; and are the predicted value and revised value of microgrid revenue in t period, respectively; and = 1, 2, 3, 4, 5 are the weight coefficients.
3.3. Model Solution
The renewable energy power grid uses the fusion algorithm to cluster and predict the historical source and load data, so that the source and load can be coordinated and optimally dispatched. In order to further improve the flexibility and accuracy of real-time scheduling of the system, based on the machine learning-prediction algorithm, the deviation between the value and the given actual value is minimal. The optimal criterion formula is:
where and are the sets of training prediction output sequences and expected output sequences, respectively; is a constant, representing the weighted control coefficient; and is the control variable. According to the power balance equation of the renewable-energy grid and the state-of-charge equation of the energy storage equipment, the transaction power , the output of the energy storage equipment, the output of the distributed equipment, the user load and the income r of the renewable-energy grid were selected to form the state variable . The control variable is composed of , and , the disturbance input is composed of distributed power supply, ultra-short-term predicted power increment of load, , , and the output variable is composed of , to establish a multi-disturbance, multi-output state model, as follows:
where , , are coefficient matrices.
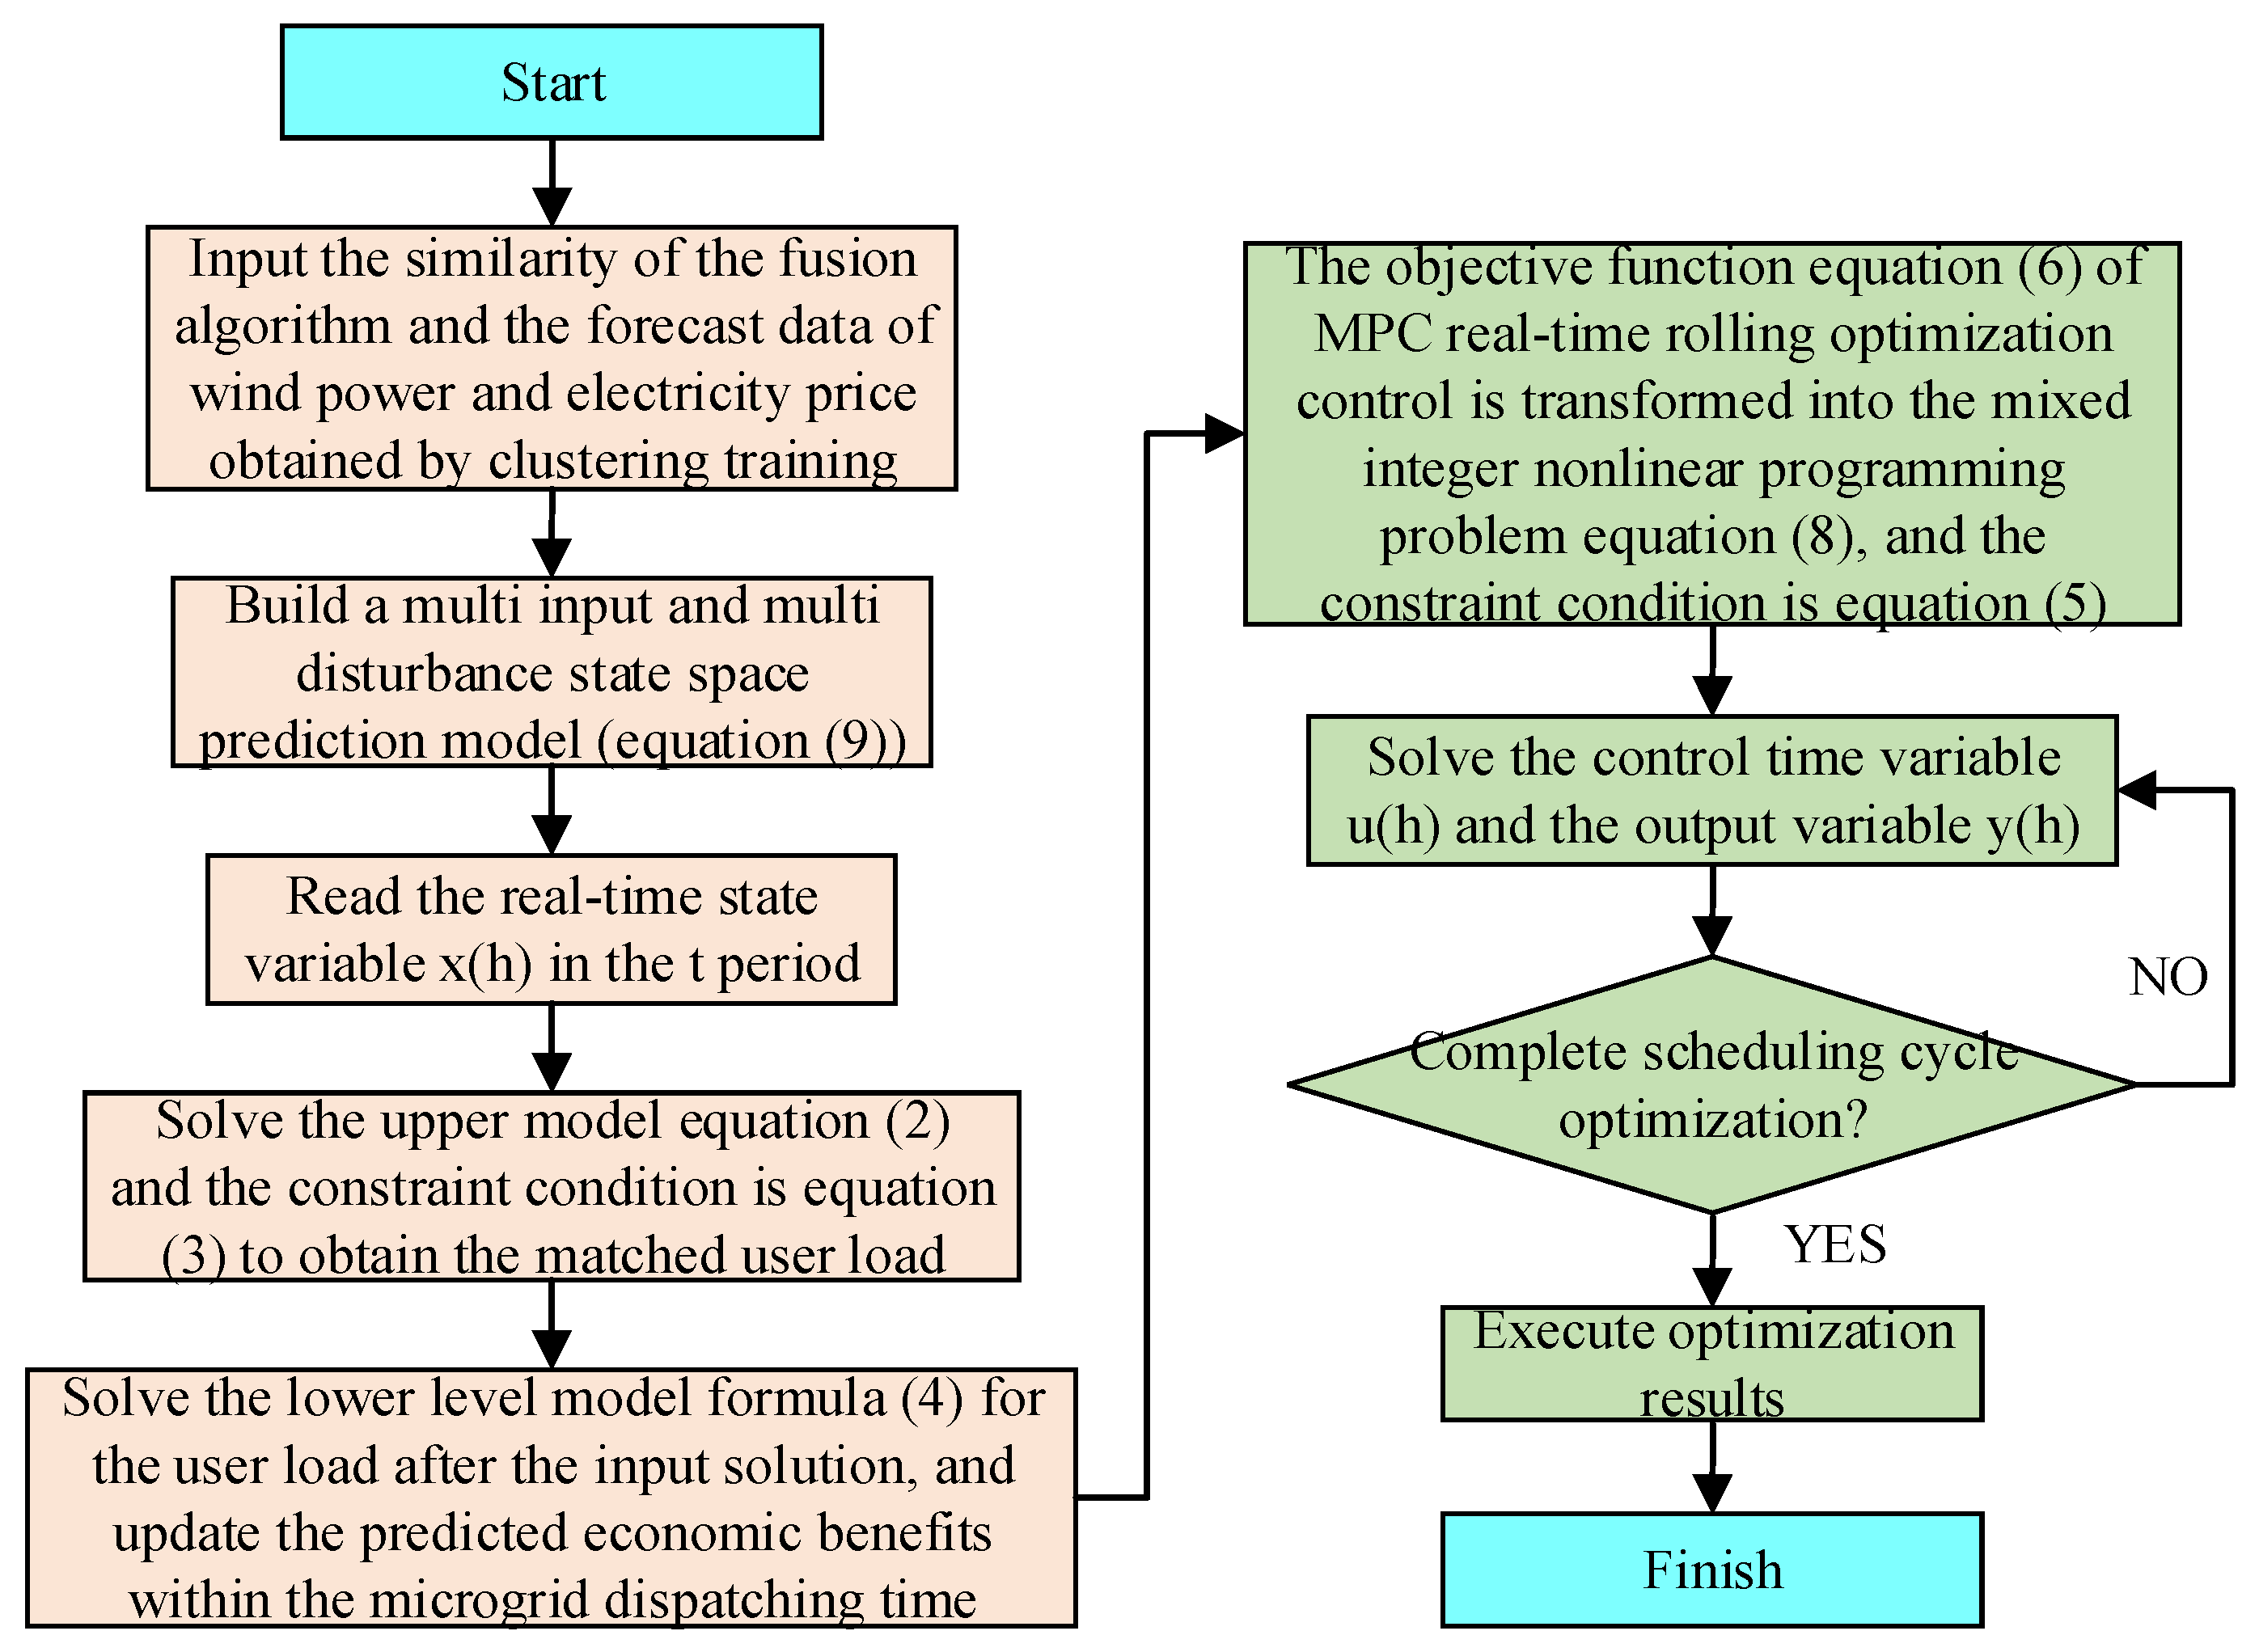
The real-time MPC algorithm has good adaptability and does not require high accuracy in the model. In this paper, the real-time MPC algorithm was used to solve the economic dispatch model. The solution flow based on the MPC prediction model is shown in Figure 3.
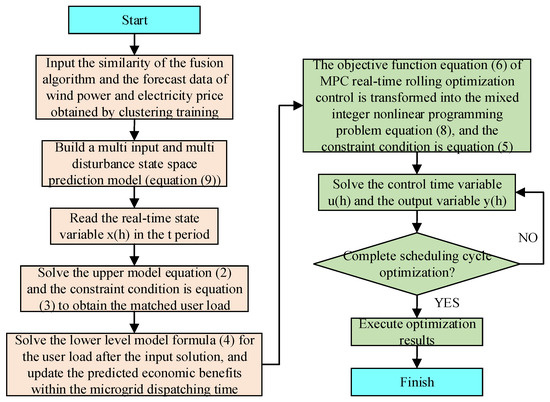
Figure 3.
Solution flow based on MPC prediction model.
4. Experiments
4.1. Simulation Design and Basic Data
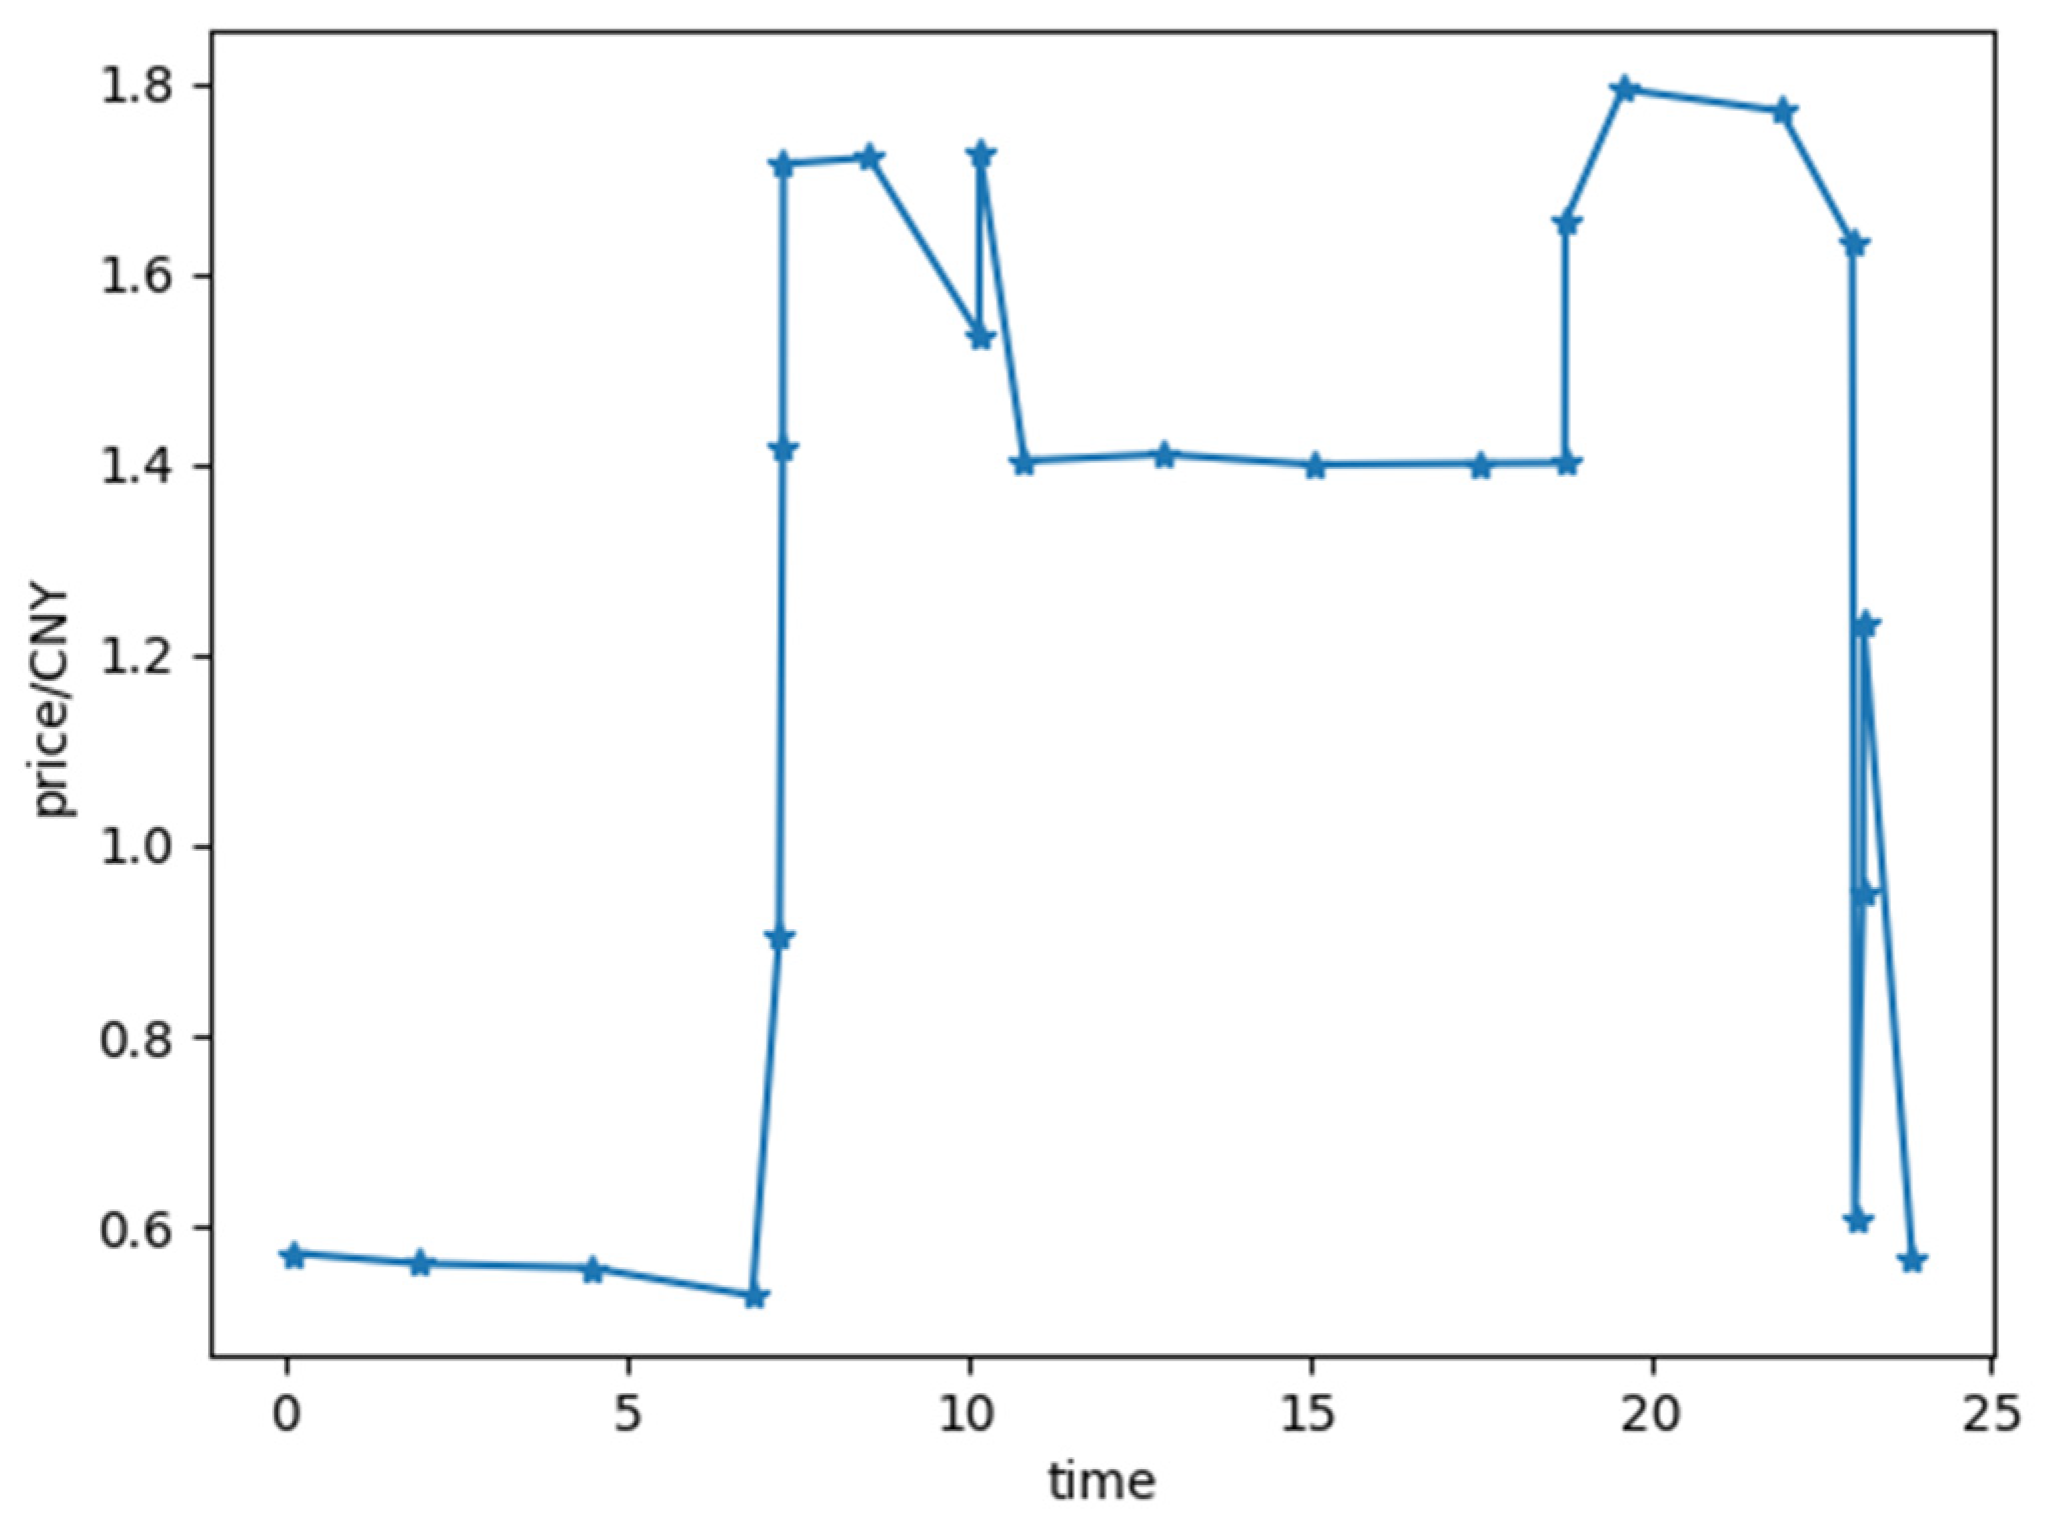
The validity of the economic optimal dispatch of the renewable-energy grid fusion algorithm proposed in this paper was verified using the following steps: select 5 conventional units, 8 fans and 2 energy storage devices, and use Matlab2017b software to solve the problem through CPLEX simulation. The regulated demand response load is introduced, and the parameters of the fan and energy storage equipment are shown in Table 1 and Table 2. Equipment operation cost is shown in Table 3, respectively. The cost of load shedding is assumed to be CNY 2.5 /, and the cost of wind curtailment is CNY 1.5 /. The time-of-use price of electricity traded between the main grid and the renewable-energy grid is shown in Figure 4.

Table 1.
Relevant operating parameters of wind turbines.
Table 2.
Equipment parameters of the two energy storage systems.
Table 3.
Distributed equipment operating costs.
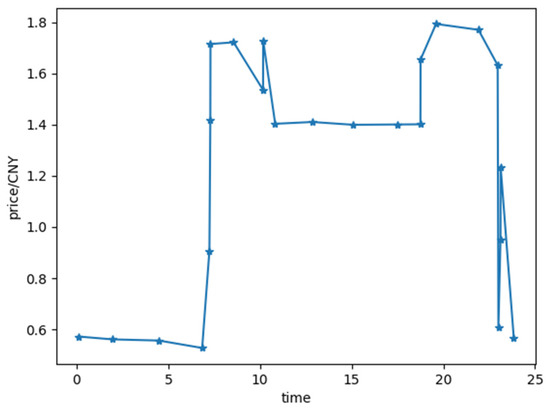
Figure 4.
Time-of-use electricity price for electricity transaction.
4.2. Analysis of Optimization Results
First, 600 scenes were initially selected through the classical scene analysis method, and then further reduced to 10 typical scenes through the fusion algorithm, as shown in Table 4. The probability of each typical scenario is shown in Table 5.
Table 4.
Dataset Information.
Table 5.
Typical scenario probabilities.
We determined the accuracy of the semi supervised k-means algorithm, SVM algorithm and fusion algorithm. It can be seen from Figure 5 that the accuracy of the fusion iterative solution is maximized in the fifth iteration. The initial termination condition of the new iteration proposed in this paper is useful for improving the accuracy of prediction results.
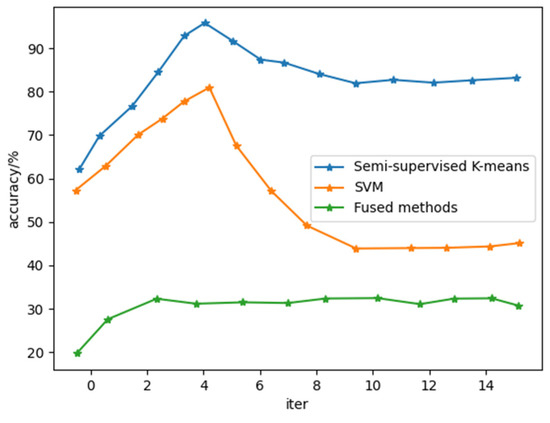
Figure 5.
Comparison of three iterative algorithms.
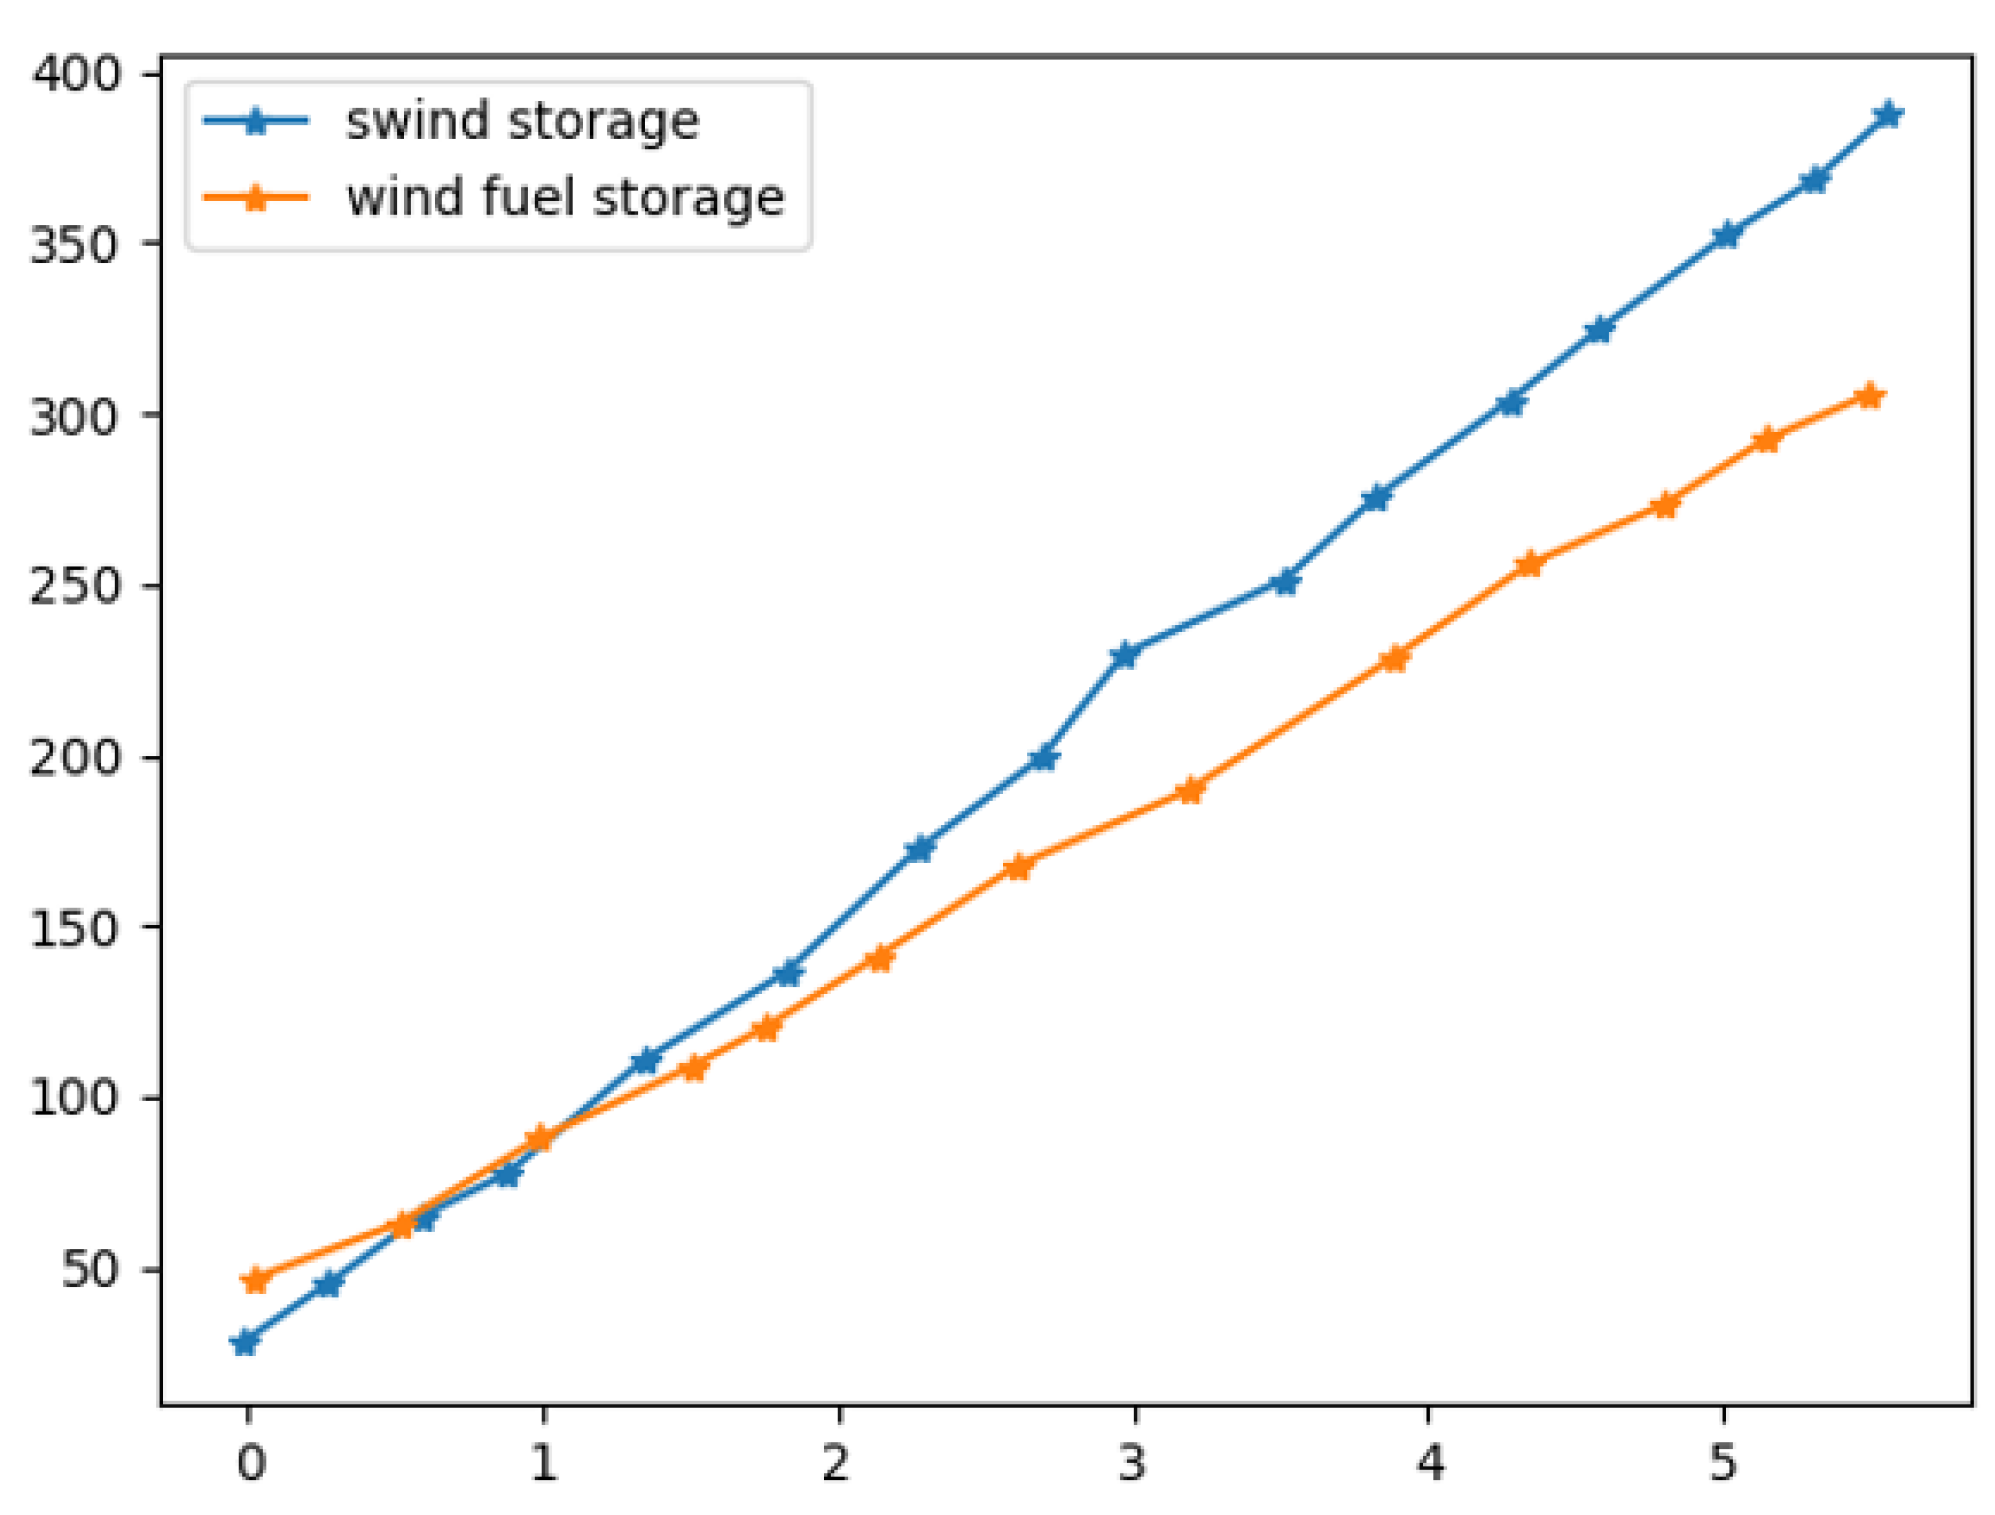
The relationship between gas price and gas-price sensitivity is shown in Figure 6. It can be seen from the comparison of the line chart that, on the general trend, the sensitivity of gas price increases with the increase of gas price, and the adaptability of the total cost of the renewable-energy grid to the sensitivity of gas price gradually decreases, and certain energy storage equipment required to reduce gas consumption, increase the consumption ratio of new energy, provide load support and play the role of peak shaving and valley filling. It can be seen from the comparison that the renewable-energy grid is burning due to energy storage factors.
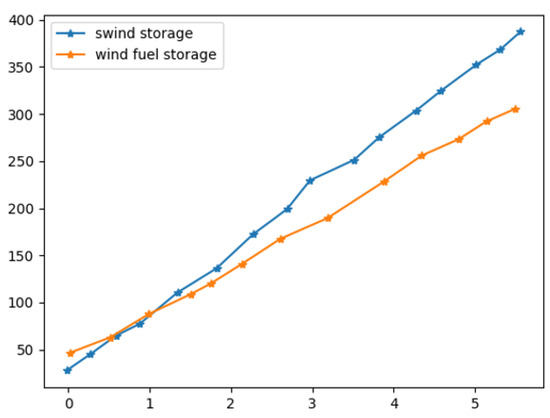
Figure 6.
Relationship between gas price and gas price sensitivity.
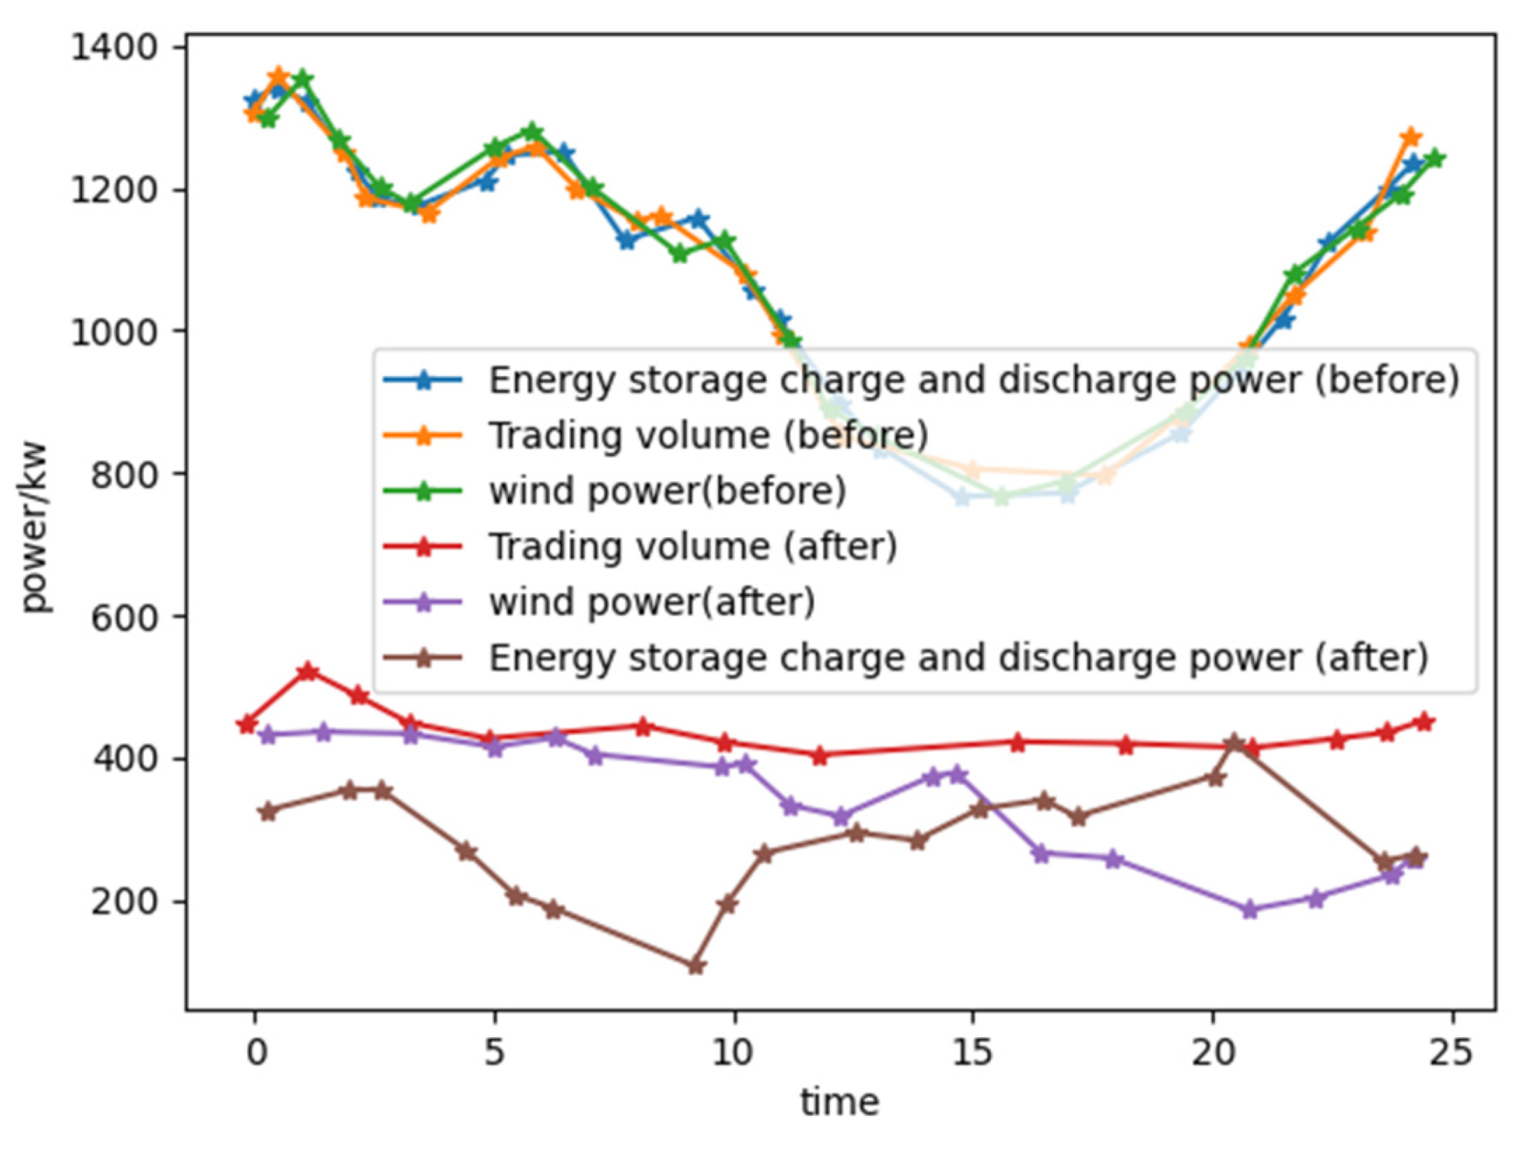
When the sensitivity of fuel prices increases, the adaptability of fuel prices is reduced and the adaptability of renewable-energy grid costs is improved. The comparison of the output of equipment before and after the optimization of renewable-energy grid dispatching is shown in Figure 7. It can be seen from the comparison of the line graphs that, in the overall trend, there is a big difference in the output of each device before and after dispatch optimization. For example, in order to increase the utilization rate of wind power, most of the wind power output curves after dispatch optimization are higher than those before dispatch optimization, which also achieves the purpose of preferential consumption of new energy. During the period from 00:00 to 07:00, the power interaction between the renewable-energy grid and the market is relatively small. It mainly meets the demand for electricity and stabilizes the power system, by absorbing wind power and charging energy storage equipment, around 04:00 due to the uncertainty of wind power output. Due to the limitation of discharge, the discharge is limited when the user’s electricity demand is large, and the output curve of the energy storage equipment is relatively flat during this period. The output of wind power increases significantly during the period of 14:00–23:00, and the renewable-energy grid can import and export electricity to the main grid to improve the energy consumption of the renewable energy grid. The cost comparison of scheduling methods is shown in Table 6.

Figure 7.
Comparison of the output of each device before and after the optimization of microgrid scheduling.
Table 6.
Cost comparison of scheduling methods.
The two-stage total cost obtained by the method proposed in this paper is lower than the total cost of the original dispatch method, indicating that the proposed method can effectively improve the economic benefits of the renewable-energy grid. It can also be seen from Table 6 that the traditional day-ahead scheduling cost method fails to consider the intermittency, volatility and other uncertainties of wind power generation when making plans, resulting in poor adaptability of its pre-dispatch plan and the intraday operation phase. Frequent adjustments increase the running cost of real-time regulation, resulting in a higher final total running cost, so it will not be lower than the method proposed in this paper. The proposed method reduces the amount of abandoned wind and improves the economic benefits of the renewable-energy grid.
5. Conclusions
Given the vitality of the renewable-energy grid market, the optimal allocation of clean energy is crucial. In this paper, the optimization method of renewable-energy grid dispatching based on machine learning is deeply analyzed. The improved K-means clustering algorithm is used to preprocess the source data and historical load data. Secondly, a support vector machine is used to predict the clustered renewable-energy grid resource and load data, and typical scenarios are selected from the prediction results. The matching degree optimization model combines a semi supervised K-means algorithm with SVM algorithm to improve the prediction accuracy of renewable-energy grid source load power. The error between the predicted value and the actual value can improve the wind limit phenomenon caused by the anti-peak regulation of wind power, ensure real-time and flexibility of renewable-energy grid dispatching, improve the energy utilization rate of renewable energy grid and achieve high efficiency.
Author Contributions
Data curation, Y.H.; Resources, Y.L. and Z.Z.; Software, M.W., Q.H. and Z.S. All authors have read and agreed to the published version of the manuscript.
Funding
This work was sponsored by the Ministry of Education, China—111 Project (NO.B17007), Director Funds of the Beijing Key Laboratory of Network System Architecture and Convergence (2017BKL-NSAC-ZJ-01) and State Grid Technology Project (1400-202272230A-1-1-ZN): Research on key technologies of supply chain financial risk management and asset evaluation from the perspective of carbon finance.
Data Availability Statement
The experimental data used to support the findings of this study are available from the corresponding author upon request.
Conflicts of Interest
The authors declared that they have no conflict of interest regarding this work.
References
- Kim, D.; Wang, Z.; Brugger, J.; Blum, D.; Wetter, M.; Hong, T.; Piette, M.A. Site demonstration and performance evaluation of MPC for a large chiller plant with TES for renewable energy integration and grid decarbonization. Appl. Energy 2022, 321, 119343. [Google Scholar] [CrossRef]
- Lipu, M.H.; Miah, M.S.; Ansari, S.; Hannan, M.A.; Hasan, K.; Sarker, M.R.; Mahmud, M.S.; Hussain, A.; Mansor, M. Data-driven hybrid approaches for renewable power prediction toward grid decarbonization: Applications, issues and suggestions. J. Clean. Prod. 2021, 328, 129476. [Google Scholar] [CrossRef]
- Inderwildi, O.; Zhang, C.; Wang, X.; Kraft, M. The impact of intelligent cyber-physical systems on the decarbonization of energy. Energy Environ. Sci. 2020, 13, 744–771. [Google Scholar] [CrossRef]
- Sharifzadeh, M.; Sikinioti-Lock, A.; Shah, N. Machine-learning methods for integrated renewable power generation: A comparative study of artificial neural networks, support vector regression, and Gaussian Process Regression. Renew. Sustain. Energy Rev. 2019, 108, 513–538. [Google Scholar] [CrossRef]
- Xie, X.; Pan, X.; Zhang, W.; An, J. A context hierarchical integrated network for medical image segmentation. Comput. Electr. Eng. 2022, 101, 108029. [Google Scholar] [CrossRef]
- Elavarasan, R.M.; Pugazhendhi, R.; Irfan, M.; Mihet-Popa, L.; Khan, I.A.; Campana, P.E. State-of-the-art sustainable approaches for deeper decarbonization in Europe–An endowment to climate neutral vision. Renew. Sustain. Energy Rev. 2022, 159, 112204. [Google Scholar] [CrossRef]
- Mrówczyńska, M.; Skiba, M.; Leśniak, A.; Bazan-Krzywoszańska, A.; Janowiec, F.; Sztubecka, M.; Grech, R.; Kazak, J.K. A new fuzzy model of multi-criteria decision support based on Bayesian networks for the urban areas’ decarbonization planning. Energy Convers. Manag. 2022, 268, 116035. [Google Scholar] [CrossRef]
- Xie, X.; Pan, X.; Shao, F.; Zhang, W.; An, J. MCI-Net: Multi-scale context integrated network for liver CT image segmentation. Comput. Electr. Eng. 2022, 101, 108085. [Google Scholar] [CrossRef]
- Rosero, D.; Díaz, N.; Trujillo, C. Cloud and machine learning experiments applied to the energy management in a microgrid cluster. Appl. Energy 2021, 304, 117770. [Google Scholar] [CrossRef]
- Waldron, J.; Rodrigues, L.; Gillott, M.; Naylor, S.; Shipman, R. The Role of Electric Vehicle Charging Technologies in the Decarbonisation of the Energy Grid. Energies 2022, 15, 2447. [Google Scholar] [CrossRef]
- Yilmaz, H.; Kimbrough, S.O.; van Dinther, C.; Keles, D. Power-to-gas: Decarbonization of the European electricity system with synthetic methane. Appl. Energy 2022, 323, 119538. [Google Scholar] [CrossRef]
- Xie, X.; Zhang, W.; Wang, H.; Li, L.; Feng, Z.; Wang, Z.; Wang, Z.; Pan, X. Dynamic adaptive residual network for liver CT image segmentation. Comput. Electr. Eng. 2021, 91, 107024. [Google Scholar] [CrossRef]
- Ahmad, T.; Madonski, R.; Zhang, D.; Huang, C.; Mujeeb, A. Data-driven probabilistic machine learning in sustainable smart energy/smart energy systems: Key developments, challenges, and future research opportunities in the context of smart grid paradigm. Renew. Sustain. Energy Rev. 2022, 160, 112128. [Google Scholar] [CrossRef]
- Pinto, G.; Piscitelli, M.S.; Vázquez-Canteli, J.R.; Nagy, Z.; Capozzoli, A. Coordinated energy management for a cluster of buildings through deep reinforcement learning. Energy 2021, 229, 120725. [Google Scholar] [CrossRef]
- Horak, D.; Hainoun, A.; Neugebauer, G.; Stoeglehner, G. A review of spatiotemporal urban energy system modeling for urban decarbonization strategy formulation. Renew. Sustain. Energy Rev. 2022, 162, 112426. [Google Scholar] [CrossRef]
- Avanija, J.; Konduru, S.; Kura, V.; NagaJyothi, G.; Dudi, B.P. Designing a Fuzzy Q-Learning Power Energy System Using Reinforcement Learning. Int. J. Fuzzy Syst. Appl. 2022, 11, 1–12. [Google Scholar] [CrossRef]
- Perera, A.T.D.; Kamalaruban, P. Applications of reinforcement learning in energy systems. Renew. Sustain. Energy Rev. 2021, 137, 110618. [Google Scholar] [CrossRef]
- Wei, T.; Chu, X.; Yang, D.; Ma, H. Power balance control of RES integrated power system by deep reinforcement learning with optimized utilization rate of renewable energy. Energy Rep. 2022, 8, 544–553. [Google Scholar] [CrossRef]
- Hannan, M.A.; Faisal, M.; Ker, P.J.; Begum, R.A.; Dong, Z.Y.; Zhang, C. Review of optimal methods and algorithms for sizing energy storage systems to achieve decarbonization in microgrid applications. Renew. Sustain. Energy Rev. 2020, 131, 110022. [Google Scholar] [CrossRef]
- Taleb, I.; Guerard, G.; Fauberteau, F.; Nguyen, N. A Flexible Deep Learning Method for Energy Forecasting. Energies 2022, 15, 3926. [Google Scholar] [CrossRef]

Publisher’s Note: MDPI stays neutral with regard to jurisdictional claims in published maps and institutional affiliations. |
© 2022 by the authors. Licensee MDPI, Basel, Switzerland. This article is an open access article distributed under the terms and conditions of the Creative Commons Attribution (CC BY) license (https://creativecommons.org/licenses/by/4.0/).