Abstract
In this study, we constructed an Ecopath model of the artificial reef ecosystem in Laizhou Bay, with special emphasis on the stock enhancement opportunities. Laizhou Bay is the largest semi-enclosed bay in the Bohai Sea, China, where multiple factors, especially overfishing, have led to the decline of many commercial marine fish stocks. Artificial oyster reefs were developed in 2011 in this region, providing shelter, feeding, and breeding sites for marine organisms. Additionally, stock enhancement by release can be used to replenish fishery species resources. Ad hoc stock enhancement, however, can fail to bring economic benefits and may impact ecosystem stability. Therefore, we estimated the ecological carrying capacity of the three main economic fish species in Laizhou Bay, including black rockfish (Sebastes schlegelii), fat greening (Hexagrammos otakii), and Chinese seabass (Lateolabrax maculatus) before release to ensure the sustainable use of fishery resources. The Ecopath model in Laizhou Bay was divided into 17 functional groups based on commercial relevance, dietary similarity, and habitat needs of the species present in the area. The ecological parameters, such as the ratio of total primary productivity to total respiration (1.205), connectance index (0.207), and system omnivory index (0.090) indicated that the artificial reef ecosystem in Laizhou Bay has a relatively simple food web structure. The ecological carrying capacities of S. schlegelii, H. otakii, and L. maculatus were assessed at 0.4676 t/km2, 0.5472 t/km2, and 0.3275 t/km2, respectively. This study provides a reference for the formulation of fishery strategies to maintain ecosystem stability and biodiversity and to maximize fishery returns and sustainability in Laizhou Bay.
1. Introduction
Overfishing, water pollution, climate change, and other factors have a significant impact on marine fishery resources [1]. At a global scale, fishery resources have substantially declined. Large fish from the dominant species that occupy a high trophic level have been replaced gradually by low trophic level invertebrates and planktivorous pelagic fish [2]. Many inshore fish populations have been depleted or even collapsed, owing to overexploitation [3]. Therefore, appropriate management measures need to be taken to protect and restore fishery resources.
Marine ranching is a new type of marine economy that plays an important role in enhancing fishery stocks and restoring marine ecosystems [4]. Ocean ranching is an artificial fishery approach based on the principles of marine ecology and modern ocean engineering technology. It makes full use of natural productivity and cultivates and manages fishery resources in specific marine areas [5]. Ocean ranching focuses on artificial reefs and fish releases [6]. Artificial reefs can restore the ecological environment and protect fishery resources by providing shelter, feeding, and breeding sites for marine organisms [7]. Stock enhancement by release is also an important way to restore biological resources. Enhancement refers to the replenishment of species resources and the improvement of the biodiversity of marine areas by releasing the fry of various fish species into the marine ecosystem [8,9].
Although such releases are often implemented to restore fishery resources, a range of potential ecological problems may be associated with this practice [10]. Releases are driven by a production imperative rather than by a fisheries management perspective in many cases [11,12]. As a result, many release activities are ineffective [13]. To ensure the sustainable development of fishery resources, it is necessary to formulate a proper release strategy that balances the economic and ecological benefits. This requires an evaluation of the breeding potential and the ecological carrying capacity of the target species before release [14,15].
The Ecopath model is used to construct the structure of aquatic ecosystems by inputting the ecological parameters of each functional group based on the principle of trophic dynamics. The model quantifies the characteristic parameters of the ecosystem to describe the process of energy flows and nutrient relationships between species and to assess the maturity and stability of the ecosystem [16,17,18,19]. The Ecopath model can also be used to estimate the ecological carrying capacity for a species to maintain a balanced ecosystem [20,21].
Laizhou Bay is as the largest semi-enclosed bay in the Bohai Sea, located on the northwest of the Shandong Peninsula in the southern Bohai Sea, China. The Yellow River is the largest river entering the bay. The river carries a large quantity of nutrients and regulates the salinity and temperature of the sea around its mouth, forming the nearshore water mass of Laizhou Bay, which is characterized by low salinity, plentiful nutrients and moderate water temperatures. This distinctive marine environment makes Laizhou Bay the spawning, breeding, and feeding ground for important fishery resources. The bay is among the most productive fishery areas in China. Many of the fish, cephalopod and large crustacean species occupy a high trophic level in the marine ecosystem and are also the targets of fishing [22]. However, in recent years, multiple factors have caused substantial changes in fishery resources and the ecosystem structure, with a shift from higher to lower trophic levels, and to small-sized and low-quality individual catches, which have reduced fishery productivity [23].
At present, Ecopath-based studies in Laizhou Bay are mainly used to evaluate the ecological carrying capacity of oysters, sea cucumbers, and crustaceans [24,25,26,27]. Few studies have assessed the ecological carrying capacity of fish. Therefore, in the current study, the Ecopath model was used to describe the structure and function of the artificial reef ecosystem in Laizhou Bay, and to evaluate the ecological carrying capacity of three common economic fish species (Sebastes schlegelii, Hexagrammos otakii, and Lateolabrax maculatus).
2. Materials and Methods
2.1. Study Area
The study area was located in the China ocean ranching demonstration zone of Laizhou Bay (Figure 1). Laizhou Bay covers 6966 km2 and has a coastline of 319.6 km. The bay borders the mouth of the Yellow River and receives a large sediment flow from the river. This sediment accumulates rapidly on the seabed, causing the water to become shallower. The sediment of the marine area is muddy sand facies. The current velocity is generally between 0.1 m/s and 0.4 m/s and flows from southwest to northeast. The mean tidal range is 0.89 m. The water depth is 6–8 m, and the average water temperature in spring, summer and autumn is 17.8 °C, 27.2 °C, and 22.0 °C, respectively. There is little difference between the surface and bottom water temperature.
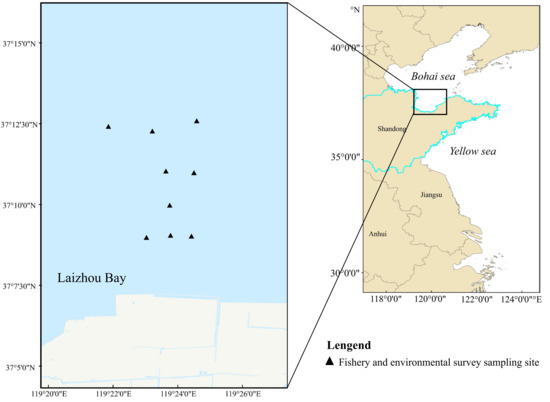
Figure 1.
Laizhou Bay survey station position.
The region’s fish stocks are dwindling because of excessive and illegal fishing. The destruction of the zoobenthos has led to a decrease in the income from the fishery. In 2011, Blue Ocean Ltd. launched artificial reefs in the east of Laizhou Bay, and fishing boats in the area were managed with the aim of protecting and restoring the marine ecological functions of Laizhou Bay [24].
In this study, the water quality and marine fishery resources in the artificial reef area of Laizhou Bay were investigated in July 2020 (summer), November 2020 (autumn), and March 2021 (spring). The modeled artificial reef area was 3333 ha. The survey site (37°14′–37°20′ N, 119°34′–119°42′ E) is shown in Figure 1.
2.2. Ecopath Approach
The food web model was built using EwE, version 6.5. The Ecopath model defines an ecosystem through the similar bioecological characteristics of functional groups. Because all the functional groups in the system should reflect the energy flows of the entire ecosystem [28], the contribution of each functional group to the energy balance model can be established using the formula:
where Bi is the biomass of functional group i; (P/B)i is the ratio of production to the biomass of functional group i; EEi is the ecotrophic efficiency of functional group i, which refers to the extent to which the productivity of a functional group is used by the ecosystem and represents the proportion of the total amount of captured food intake, fish catch, biomass accumulation, and migration, to total productivity. Bj is the biomass of predator j; (Q/B)j represents the ratio of predator j’s consumption to biomass; DCji represents the proportion of prey i in the food composition of predator j; Yi is the fishery catch rate of group i; Ei is the net migration rate of group i; and BAi is the biomass accumulation of group i.
To construct the Ecopath model, the basic parameters required are Bi, (P/B)i, (Q/B)i, EEi, DCij, and catch data. Any one of the first four parameters can be unknown and can be calculated by the model through the other parameters. The last two parameters, namely the food composition matrix DCij and catch data, must be known.
The Ecopath software solves the linear equation shown above, so that the energy flow represented by the equation maintains a balance between each functional group in the ecosystem, and it quantifies the biological parameters of each component of the ecosystem [19].
2.3. Structure of the Model
On the basis of the commercial relevance, dietary similarity, and habitat of the species present in the area, the Ecopath model of the artificial reef ecosystem in Laizhou Bay was divided into 17 functional groups consisting of six fish groups, eight invertebrate groups, phytoplankton, zooplankton, and a detritus group. The main economic fishes in Laizhou Bay (S. schlegelii, H. otakii, and L. maculatus) and other valuable species (e.g., Rapana venosa, Apostichopus japonicus) were set as separate functional groups. We combined oysters (Lamellibranchia) and other mollusks into one group because the biomass of oysters amounted to 99.6% of the total mollusk biomass based on our survey. We did not observe any macrophytes in the study area. The 17 functional groups covered the whole process of ecosystem energy flows (Table 1).

Table 1.
Functional groups included in the trophic model in Laizhou Bay.
2.4. Input Parameters of Functional Groups
The biomass data of most functional groups in this study were obtained through ocean surveys. Fish and crustaceans were investigated by trawling, gill netting, and ground cage fishing. The trawl mouth had a width of 4 m, the ship speed was 2 knots, and each tow lasted 15 min. Because trawling is prohibited in some areas of the artificial reef, we used ground cages and gill nets in those areas. The ground cage mesh size was 2 cm, a string of cages had 24 sections, and there were three strings of ground cages in a group. The gill nets were connected together with mesh sizes of 40 mm, 50 mm, and 60 mm, a total length of 150 m and a net height of 1.2 m. Both the ground cages and gill nets were left in place for 48 h (the calculation method can be seen in Supplementary Materials). The biomass and abundance of A. japonicus and R. venosa were estimated by SCUBA grasping and videos combined with net operations and the area size of quadrats was 0.5 m × 0.5 m. The regional biomass was inferred from the results of the quadrat survey. A shallow water type I plankton net was used to investigate the biomass of zooplankton, and the concentration of chlorophyll a in the phytoplankton was measured in accordance with a standard Turner Fluorometer procedure [29]. The biomass of phytoplankton was calculated using the ratio of chlorophyll content to phytoplankton wet weight [30]. The detritus biomass was calculated as a function of primary production and euphotic depth [28]:
where D is the detrital biomass (g cm−2); PP is the primary production (in g cm−2 year−1); and E represents the euphotic depth in meters.
log (D) = −2.41 + 0.954logPP + 0.863logE
Owing to the lack of data on diet composition and catch (fishing data for S. schlegelii, Charybdis japonica, R. venosa and A. japonicus were provided by Blue Ocean Ltd.), we referred to relevant studies in the same marine area when entering these parameters [24,31] (Table 2). The P/B ratio is equivalent to the instantaneous rate of total mortality (Z) commonly used in fisheries modeling [32], which is the sum of fishing mortality (F) and natural mortality (M) [20]. We used the equation proposed by Banse and Mosher [33] to estimate the value of P/B:
where log a = 0.38, b = −0.26, and Ms is in g wet weight [33].
log (P/B) = log a + blogMs
Table 2.
Input and output (bold) parameters for the Laizhou Bay artificial ecosystem model. * is balanced data.
Q/B ratios were calculated using the empirical equation [19]:
where W∞ = asymptotic fish weight (g), T’ = 1000/(°C + 273), A = aspect ratio of the caudal fin (H2/S, H is the tail height and S is the surface area of the tail), h is a dummy variable expressing food type (1 for herbivores, and 0 for detritivores and carnivores), and d is also a dummy variable expressing food type (1 for detritivores, and 0 for herbivores and carnivores) [20].
log (Q/B) = 7.964 − 0.204logW∞ − 1.965T’ + 0.083A + 0.532h + 0.398d
In this study, we estimated the P/B and Q/B values for S. schlegelii, and H. otakii using the above equations (details of the calculations can be seen in the Supplementary Materials). The P/B and Q/B values of other functional groups referred to relevant studies in the same marine area [24,25,31,34] (Table 2).
2.5. Model Balancing and Uncertainty
The Pedigree Index is used to evaluate model quality and parameter sources. This index categorizes the origin of each parameter and specifies the likely uncertainty associated with these parameters. The quality value ranges between 0 (low) and 1 (high) for each parameter according to the source. After confirming the source, the model averages the quality values of all parameters in all groups to obtain a general synthetic index of data quality [21].
PREBAL diagnostics were performed on the model before debugging to check for potential problems [35]. The PREBAL diagnostics checks the slopes of B, P/B, and Q/B across trophic levels based on ecological principles and some “rules of thumb” [36].
We used the logarithms of B, P/B, and Q/B, using a line with a slope of 10% as a reference (Figure 2). The accuracy and integrity of the data for groups above or below the sloped line were considered [37]. The information in Figure 2a shows that the biomass of R. venosa, A. japonicus and Mollusca might be overestimated in our model, while the biomass data of other functional groups were likely to be underestimated to varying degrees (except the S.schlegelii functional group). The information in Figure 2b shows that annual P/B ratios for L. maculatus, S. schlegelii, H. otakii, C. japonica, R. venosa, other demersal fishes, and sea cucumber (A. japonicus) seemed low, while that of phytoplankton was high. Similarly, annual Q/B ratios (Figure 2c) of R.venosa, other demersal fishes, and A. japonicus seemed low, while those of other fish functional groups, Octopodidae, Oratosquilla oratoria, large crustaceans, and zooplankton seemed high. These estimates were examined before constructing the model to determine whether further analyses and reparameterization were necessary [37]. For some functional groups that deviated significantly from the reference value, parameters were corrected to improve ecological integrity and validity.
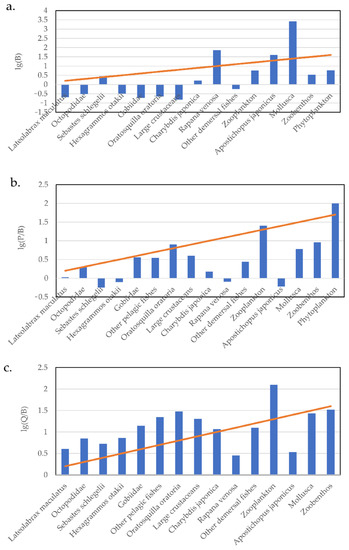
Figure 2.
PREBAL of the Laizhou Bay model plotting: (a) Biomass estimates (t/km2); (b) the production/biomass ratio; and (c) the consumption/biomass on a log scale vs. species ranked by trophic level, from highest to lowest trophic level.
When the Ecopath model is run for the first time, the functional group estimate will give an eventuality of EE > 1, which shows that the energy flow in the ecosystem is out of balance. Thus, the model needs to be debugged by adjusting the input parameter values and eliminating the factors that do not contribute to the model until the model satisfies all the functional groups 0 < EE ≤ 1. This indicates that the balance of the whole system energy flow has been maintained. In addition, the gross food conversion efficiency, which is the ratio of production to consumption (P/Q), should range from 0.05 to 0.3 [19].
2.6. Ecosystem Attributes
Ecopath contains a number of indicators that objectively reflect the current stability and maturity of the ecosystem. Some representative indicators, such as total system throughput (TST), which represents the overall size of the ecosystem flows, are the sum of total consumption, total exports, total respiration, and energy flowing to detritus [19].
Other indicators can reflect ecosystem maturity. For example, the ratio of total primary production to total respiration (TPP/TR) is considered to be an important indicator of ecosystem maturity [16,18]. Values of TPP/TR that are closer to 1 show that the ecosystem is more mature [19]. The ratio of total biomass to total throughput of the system also reflects the maturity of the system to a certain extent. For this ratio, larger values equate to a more mature ecosystem.
The connectance index (CI) and the system omnivory index (SOI) are measures of the complexity of the relationships within the food web. They represent the ratio of actual connections to possible connections in the food web and the log-weighted average of food consumption by all consumers, respectively. More developed ecosystems have a more complex internal food web relationship, which is manifested by CI and SOI values close to 1 [19].
Finn’s cycling index (FCI), and Finn’s mean path length (FML) are also closely related to the maturity and stability of the system [38]. They represent the ratio of the total flow of nutrients re-entering the system for recycling to the total flow of the system and the average length of each cycle through the food chain, respectively. More mature and stable systems usually have a high degree of recycling [18].
Mixed trophic impact (MTI) analysis can measure the impact of changes in the biomass of one functional group on other functional groups [39]. This parameter reflects the direct or indirect interaction between functional groups [19]. If there is a positive effect between the two functional groups, the value is greater than 0, otherwise it is negative. The value ranges from −1 to 1.
2.7. Ecological Carrying Capacity Assessments
In this study, we developed an Ecopath model for the Laizhou Bay ecosystem, and then perturbed it by increasing fish biomass until the model produced unfeasible values for other model components. As additional biomass enters the model, it rebalances the energy accordingly. When the system fails to compensate for any additional biomass, the response shown is usually a value of a functional group of ecological efficiency parameters exceeding 1, which means that there is not enough production to support the increased biomass. This method is analogous to approaches used for estimating shellfish carrying capacity [20], whereby artificially increasing the biomass of farmed mussels represents an increase in farmed scale until the ecological efficiency of any functional group in the system becomes unbalanced [21].
3. Results
3.1. Balancing the Model and Trophic Structure
The food web structure of the artificial reef ecosystem in Laizhou Bay was composed of 17 functional groups and five trophic levels (Figure 3). The trophic levels ranged from 1 (primary producers and detritus) to 4.134 (L. maculatus). The major economic species—S. schlegelii, H. otakii, and L. maculatus—had trophic levels of 4.067, 3.893, and 4.134, respectively. Together, they constituted the top predators in the ecosystem. The EE ranged from 0.005 to 0.977 for all functional groups and the P/Q ratio ranged from 0.093 to 0.286 (Table 2).
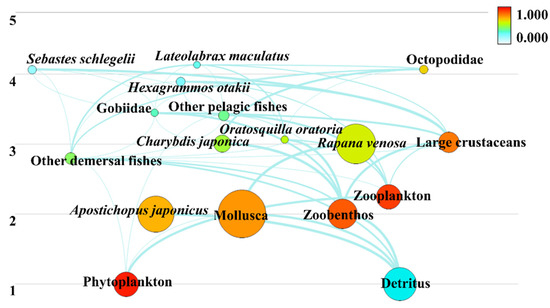
Figure 3.
Ecosystem energy flow diagram of Laizhou Bay.
3.2. Transfer Efficiencies
The artificial reef ecosystem in Laizhou Bay consisted of five main aggregated trophic levels (Figure 4). Most of the energy flow was between trophic levels I and II. The total primary production of ecosystem primary producers was 1041.120 t·km−2·year−1. Approximately 839.8 t·km−2·year−1 was ingested by consumers and flowed into trophic level II and 201.3 t·km−2·year−1 flowed into the detrital pool. The energy inflow into trophic levels II, III, IV, and V accounted for 48.004%, 1.752%, 0.057%, and 0.004% of the total flow of the ecosystem, respectively.
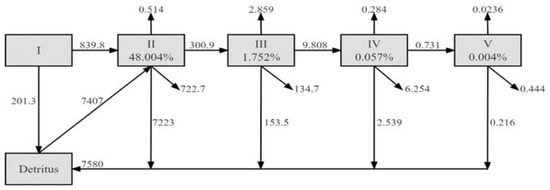
Figure 4.
Lindeman spine flow network of organic matter and transfer efficiency for the artificial reef ecosystem in Laizhou Bay. The horizontal arrows represent the flow between trophic levels; up arrows represent exports; down arrows are the flow to detritus; The downward sloping arrow represents respiration. The numbers on the arrows indicate value of the flow in t· km−2 year−1. Percentage in each box represents proportion of flow to TST at each TL.
We obtained a mean transfer efficiency of 5.307% from detritus and 6.224% from primary producers within the ecosystem. The geometric mean of the trophic transfer efficiencies for the system as a whole was 5.419% (Table 3).
Table 3.
Transfer efficiency of different trophic levels in Laizhou Bay artificial reef ecosystem.
3.3. Mixed Trophic Impacts
The analysis of the mixed trophic impacts among different trophic levels in the ecosystem is shown in Figure 5. All functional groups (except for the detritus group) had some negative effects within the group. For instance, an increase in zooplankton biomass had the greatest negative impact on zooplankton. Predators had a negative effect on the functional group of their prey, while some prey had a positive effect on the functional group of their predators. For example, other demersal fishes had a positive impact on their predators (S. schlegelii, H. otakii, and L. maculatus). Phytoplankton and detritus had positive effects on most functional groups. Phytoplankton had positive effects on other demersal fishes, zooplankton, and other pelagic fishes, and detritus had positive effects on Mollusca, A. japonicus, and zoobenthos. In addition, fishing practices had a negative effect on some economic species, especially S. schlegelii, H. otakii, and R. venosa, but they had a siginificant positive effect on Mollusca.
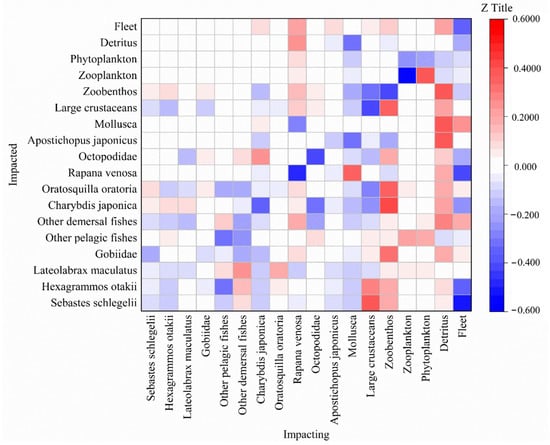
Figure 5.
Mixed trophic impact assessment of the Laizhou Bay.
3.4. Niche Overlap Analysis
Prey and predator overlap indices reflected the niche overlap between functional groups to a certain extent (Figure 6). Among all the functional groups, O. oratoria and large crustaceans had the highest prey overlap index (0.977), followed by S. schlegelii and H. otakii (0.948). This suggested that the food preferences of these functional groups were similar and that interspecific competition among the groups would be more intense than among other functional groups. The functional group with the highest predator overlap index was S. schlegelii and H. otakii (1.000); these fish were targeted by the fleet. Other pelagic fish and O. oratoria also had a high predator overlap index (0.815) because they were hunted by the same predators as L. maculatus, other pelagic fishes, and other demersal fishes.
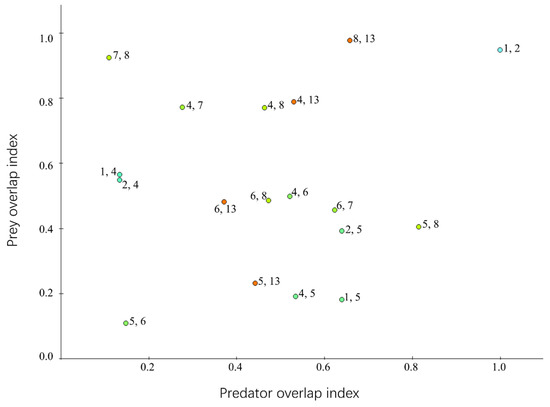
Figure 6.
The niche overlap analysis of the Laizhou Bay ecosystem. The numbers on the diagram represent the numbers of the functional groups.
3.5. Ecosystem Analysis and Indicators
Of the total system throughput of 17,300.57 t·km−2·year−1, 50.2% was due to consumption (8679.232 t·km−2·year−1); 4.99% was due to the respiratory process (864.160 t·km−2·year−1); 43.8% originated in backflows to detritus (7580.222 t·km−2·year−1); and 1.02% was due to export (176.955 t·km−2·year−1). The sum of all production was 3005.624 t·km−2·year−1 (Table 4).
Table 4.
The overall system statistics of the Laizhou Bay artificial reef ecosystem.
The TPP/TR ratio was 1.205, the TPP/Total biomass ratio was 2.539, and the Total biomass/Total system throughput ratio was 0.024. The FCI and the FML were 76.15 and 16.62, respectively, in the artificial reef ecosystem. The total number of pathways and the mean length of pathways were 188 and 5.330, respectively. The CI was 0.207 and the SOI was 0.090 (Table 4).
3.6. Ecological Carrying Capacity Assessment
S. schlegelii, H. otakii, and L. maculatus are common economic species in Laizhou Bay artificial reef areas, and they are also important fishing targets. At present, the biomass of S. schlegelii, H. otakii, and L. maculatus is 0.280 t/km2, 0.322 t/km2, and 0.206 t/km2, respectively. We modeled the effect of increasing the biomass of S. schlegelii, H. otakii, and L. maculatus by 1% based on the current biomass, while the biomass of other functional groups remained unchanged. Increasing the biomass of the three functional groups changed the ecological efficiency of each functional group. When the biomass of S. schlegelii, H. otakii, and L. maculatus increased by 1.67 times, 1.71 times, and 1.59 times, respectively, the EE of the functional groups of Gobiidae and other demersal fish, which form the prey of these three predators, rose above 1 owing to excessive predation pressure. This showed that the model was out of balance, indicating that the reef ecosystem area had reached its ecological carrying capacity (Table 5).
Table 5.
Effects of increased biomass of Sebastes schlegelii, Hexagrammos otakii, and Lateolabrax maculatus on functional groups.
Table 4 shows the state of the ecosystem when the three top predators—S. schlegelii, H. otakii, and L. maculatus—reached their ecological carrying capacity. The total consumption and total system throughput of the ecosystem increased slightly, while the total exports, total flows into detritus, and net system production decreased slightly. In general, most of the ecological characteristics did not change substantially and there was no significant effect on the stability of the artificial reef ecosystem in Laizhou Bay.
4. Discussion
In this study, the Ecopath model was used to characterize the structure and function of the food web of the artificial reef ecosystem in Laizhou Bay and show the ecological carrying capacity of various economic fish species. By analyzing the simulation results, we provide a reference for the enhancement of fish stock through artificial release activities.
In the study area, most fish groups had high EE values, indicating that the utilization rate of fish groups was high. Detritus and phytoplankton serve as food sources for other functional groups, and had high EE values, closely linked to the characteristics of the Laizhou Bay ecosystem. The artificial reef ecosystem in Laizhou Bay is dominated by the filter-feeding oyster species Crassostrea gigas (Mollusca). Owing to the shallow depth of Laizhou Bay and its geographical location, the seawater exchange capacity is low, and accumulation of nutrients can cause persistent pollution [1] and eutrophication of seawater. These factors might explain the frequent occurrence of red tides in Laizhou Bay [40]. However, the deployment of oyster reefs had improved the utilization rate of detritus, delayed the accumulation of organic substances, and allowed more substances to circulate within the system. In this way, the artificial reef played a key role in maintaining the ecosystem stability.
In the ecosystem studied here, 89.0% of the total flow came from detritus, while 11.0% came from primary producers, indicating that the main energy flow of the ecosystem was the detrital food chain. Thus, many primary producers were not immediately used by higher trophic level predators and were able to flow into the detrital pool, which led to low transfer efficiencies in the ecosystem (Table 3). The utilization rate of detritus was high because almost all the organisms in the second trophic level fed on detritus, and the biomass of the second trophic level accounted for 79% of the total biomass. This had a great influence on the ecosystem.
The ecological parameter TST is the sum of all flows in a system, including the sum of all consumption; sum of all exports; sum of all respiration flows; and sum of all flows into detritus. In this study, the functional group of Mollusca made a significant contribution to the TST of the ecosystem. The large number of oysters in the artificial reef ecosystem of Laizhou Bay accounted for a substantial proportion of the consumption, respiration, and flows into the detritus of the whole ecosystem. Compared with previous research [24], the present status of Laizhou Bay ecosystem has been significantly improved (Table 6). This is mainly related to the higher current biomass of oysters (2651 t·km−2), compared with that in 2016 (974 t·km−2). By comparing the simulation results with other artificial Gulf ecosystems along the coast of China, [24], which are important economic locations for fishing and aquaculture (Table 6), the TST of the artificial reef ecosystem in Laizhou Bay was found to be higher than Beibu Gulf [41], Jiaozhou Bay [42] and the Haizhou Bay [43], but lower than Hangzhou Bay [44].
Table 6.
Comparison of system attributes of Laizhou Bay artificial reef model with other Gulf ecosystems.
According to Odum [16], among the 24 parameters for assessing ecosystem maturity, the ratio of TPP/TR is considered an important indicator of ecosystem maturity. When the ratio is closer to 1, the ecosystem is more stable and more able to resist external disturbance. In 2016, the TPP/TR value of the artificial reef ecosystem in Laizhou Bay was 0.52 (Table 6) because only a short time had passed since the construction of the reef ecosystem, and the ecosystem was still in an early development stage [24]. The value of TPP/TR assessed in this study was 1.205. This showed that the ecosystem had matured and stabilized over the 4 years. The value of TPP/TR obtained in this study was closer to 1 than in other Gulf ecosystems, suggesting that the ecosystem was close to a mature status.
The FCI refers to the ratio of recycled energy to total flow in an ecosystem, while the FML refers to the average length of each cycle through the food chain. Longer nutrient flows through the food chain led to a higher proportion of energy being recycled [38]. In this study, the FCI was 76.15%, indicating that 76.15% of the energy in the ecosystem was recycled. The FML was 16.62, and the energy recycling efficiency was higher than that of other artificial reef ecosystems. We consider that this is due to the large number of oysters in the Laizhou Bay ecosystem. Because oysters are filter feeders, they use a substantial proportion of detritus, which then re-enters the system, resulting in a high recycling rate.
The CI and SOI are indicators that reflect the complexity of the internal connections in the ecosystem. More mature ecosystems that have closely related functional groups and a more complex food web structure will have a CI and SOI values that are closer to 1. This indicates that the ecosystem is relatively stable. In this study, the CI and SOI of the artificial reef ecosystem in Laizhou Bay were 0.207 and 0.090, respectively. These values were much less than 1, indicating that the functional groups of the ecosystem were not closely related, and the food web structure was relatively simple. This may increase volatility in response to environmental disturbances and can lead to large fluctuations in fish abundance and catches. The increased volatility also can greatly affect the recovery and conservation of fish species [45].
According to a previous study [23], the fishery resources in Laizhou Bay were dominated by hair tail and small yellow croaker in 1959. Since 1982, small pelagic species, such as half-fin anchovy and anchovy, have become the dominant species, and this trend became more pronounced after 1992. The biomass of some of the more common and economically valuable species at that time is now significantly reduced, or they are not harvested at all. The mean trophic level of catch in the Laizhou Bay ecosystem was estimated to be 2.969, which was significantly lower than the Bohai ecosystem in 1982 (3.69) and 1992 (3.41) [17]. This finding confirms that the fishery resources in Laizhou Bay have been destroyed. In addition, the fish tend to be miniaturized and younger than in previous studies. To this end, the Chinese authorities have introduced a series of policies to restore marine fishery resources, including setting up trawl-prohibition zones, seasonal fishing moratoriums, enhancement and release, and mesh-size control. However, many of these management measures are narrowly focused on the yield of individual species while ignoring the integrity of the ecosystem [45]. It is important to consider the interactions among functional groups, rather than focusing on the production of target species, because the ecosystem reflects dynamic trade-offs within a whole.
MTI analysis may be a useful method to illustrate the effects of interventions among functional groups. It shows how changes in species can affect other species in an ecosystem. Almost all functional groups had some negative effects within the group. This might be related to intraspecific competition for habitat space and food, reflecting density-dependency within functional groups. The MTI indicated that both detritus and phytoplankton had positive effects on most other functional groups because they were at lower trophic levels and provided a food source for other functional groups. As for the top predators of the artificial reef ecosystem in Laizhou Bay, fishing effect had the greatest negative impact on S. schlegelii, and H. otakii because they were the main economic species in the system. The negative effects of fishing on the biomass of top predators resulted in positive effects on their prey, such as, Gobiidae, other demersal fishes, and O. oratoria. In addition, as one of the main economic species, R. venosa, is under great fishing pressure. Increasing the fishing pressure would reduce the pressure of predation of Mollusca by R. venosa, which may explain the positive effect of fishing on Mollusca. As the main reef species in the Laizhou Bay artificial reef area, increasing mollusk biomass will lead to a decrease in the biomass of their food source (detritus) and their competitors (e.g., A. japonicus, zoobenthos). This indicates that mollusks can not only provide habitats for organisms, but also re-recruit organic matter in debris into the system to participate in recycling through feeding. This explains the high EE value of detritus that we obtained in the Ecopath model.
In this study, we estimated the ecological carrying capacities of S. schlegelii, H. otakii, and L. maculatus in the artificial reef area of Laizhou Bay (Table 5). The existing stocks of these three species were shown to be close to the assessed ecological carrying capacities, indicating that the stocks were sufficient. Compared with the ecosystem of Laizhou Bay in 2016 [24], the biomass of fish species has significantly improved, which reflects the effects of enhancement and the attraction of fish to artificial reef areas [46]. The above results are only predicted limits, and decisions should be made based on the actual situation on-site, considering economic, social, and other factors. A suggested precautionary approach is to limit stock enhancement to half the calculated carrying capacity. This value is equivalent to the maximum sustainable yield where the growth rate is high and is an accepted management target for many fin fisheries [47].
5. Conclusions
We assessed the artificial reef ecosystem in Laizhou Bay using the Ecopath model and evaluated the nutrient interactions, energy flows, and ecosystem characteristics among species. We calculated the ecological carrying capacity of S. schlegelii, H. otakii, and L. maculatus. This study showed that (1) the establishment of artificial reefs contributed to the stability and maturation of the ecosystem; (2) artificial reefs had a positive effect on the restoration of biological resources; and (3) at present, the resources of economic fish—S. schlegelii, H. otakii, and L. maculatus—are sufficient in Laizhou Bay. However, the ecological carrying capacity estimated by the Ecopath model is only a predicted upper limit, and the economic and social benefits should be considered as well as the ecological benefits.
Supplementary Materials
The following supporting information can be downloaded at: https://www.mdpi.com/article/10.3390/su142113933/s1, Section S1. Biomass data. Table S1. Diet composition of functional groups in Laizhou Bay. The values in parentheses were modified to fit the mass-balance model. Horizontal groups correspond to the vertical group names. Refs. [19,20,24,25,28,30,31,33,34,48,49,50,51,52] are cited in Supplementary Materials.
Author Contributions
Data analysis and software, writing—original draft preparation Y.Y.; Data curation, J.F.; supervision, project administration, writing—review and editing H.Z. and W.X. All authors have read and agreed to the published version of the manuscript.
Funding
The present work was supported by the National Key Research and Development Project of China (2019YFD0902101), the Youth Innovation Promotion Association Chinese Academy of Sciences (2020211), and National Natural Science Foundation of china, No. (42106102).
Institutional Review Board Statement
Not applicable.
Informed Consent Statement
Not applicable.
Data Availability Statement
All data or models generated or used during the study are available from the corresponding author by request.
Acknowledgments
We would like to thank Yuanchao Wang for his help in the data analysis.
Conflicts of Interest
The authors declare no conflict of interest.
References
- Li, Y.; Yong, C.; Olson, D.; Yu, N.; Chen, L.Q. Evaluating ecosystem structure and functioning of the East China Sea Shelf ecosystem, China. Hydrobiologia 2009, 636, 331–351. [Google Scholar] [CrossRef]
- Pauly, D.; Christensen, V.; Dalsgaard, J.; Froese, R.; Torres, F., Jr. Fishing down marine food webs. Science 1998, 279, 860–863. [Google Scholar] [CrossRef] [PubMed]
- Hutchings, J.A.; Reynolds, J.D. Marine fish population collapses: Consequences for recovery and extinction risk. BioScience 2004, 54, 297–309. [Google Scholar] [CrossRef]
- Yang, H.S.; Da, H.; Xu, Q. Views on modern marine ranching. Oceanol. Limnol. Sin. 2016, 47, 1069–1074. (In Chinese) [Google Scholar] [CrossRef]
- Yang, H.S. Construction of marine ranching in China: Reviews and prospects. J. Fish. China 2016, 40, 1133–1140. (In Chinese) [Google Scholar] [CrossRef]
- Li, Z.Y.; Lin, Q.; Li, J.; Shan, X.J. Present situation and future development of marine ranching construction in China. J. Fish. China 2019, 43, 1870–1880. (In Chinese) [Google Scholar] [CrossRef]
- Myoung, J.G.; Park, Y.J. Monthly changes of fish fauna at experimental artificial reef in Tongyeong marine ranching area, Korea. Ocean Polar Res. 2001, 23, 311–313. [Google Scholar]
- Stottrup, J.G.; Sparrevohn, C.R. Can stock enhancement enhance stocks? J. Sea Res. 2007, 57, 104–113. [Google Scholar] [CrossRef]
- Blaxter, J.H.S. The enhancement of marine fish stocks. Adv. Mar. Biol. 2000, 38, 1–54. [Google Scholar] [CrossRef]
- Einum, S.; Fleming, I.A. Implications of stocking: Ecological interactions between wild and released salmonids. Nordic J. Freshw. Res. 2001, 75, 56–70. [Google Scholar]
- Leber, K.M. Advances in marine stock enhancement: Shifting emphasis to theory and accountability. In Responsible Marine Aquaculture; Stickney, R.R., McVey, J.P., Eds.; CABI Publishing: New York, NY, USA, 2002; pp. 79–90. [Google Scholar]
- Lorenzen, K. Understanding and managing enhancement fisheries systems. Rev. Fish. Sci. 2008, 16, 10–23. [Google Scholar] [CrossRef]
- Bell, J.D.; Laber, K.M.; Blankenship, H.L.; Loneragan, N.R.; Masuda, R. A new era for restocking, stock enhancement and sea ranching of coastal fisheries resources. Rev. Fish. Sci. 2008, 16, 1–9. [Google Scholar] [CrossRef]
- Lorenzen, K.; Agnalt, A.L.; Blankenship, H.L.; Hines, A.H.; Leber, K.M.; Loneragan, N.R.; Taylor, M.D. Evolving context and maturing science: Aquaculture-based enhancement and restoration enter the marine fisheries management toolbox. Rev. Fish. Sci. 2013, 21, 213–221. [Google Scholar] [CrossRef]
- Lorenzen, K.; Leber, K.M.; Blankenship, H.L. Responsible approach to marine stock enhancement: An update. Rev. Fish. Sci. 2010, 18, 189–210. [Google Scholar] [CrossRef]
- Odum, E.P. The strategy of ecosystem development. Science 1969, 164, 262–270. [Google Scholar] [CrossRef]
- Lin, Q.; Jin, X.S.; Zhang, B.; Guo, X.W. Study on the changes of the Bohai Sea ecosystem structure based on Ecopath model between ten years. Acta Ecol. Sin. 2009, 29, 3613–3620. (In Chinese) [Google Scholar] [CrossRef]
- Christensen, V. Ecosystem maturity—Towards quantification. Ecol. Model. 1995, 77, 3–32. [Google Scholar] [CrossRef]
- Christensen, V.; Walters, C.J.; Pauly, D. Ecopath with Ecosim: A User’s Guide; Fisheries Centre, University of British Columbia: Vancouver, BC, Canada, 2005; Volume 154. [Google Scholar]
- Jiang, W.M.; Gibbs, M.T. Predicting the carrying capacity of bivalve shellfish culture using a steady, linear food web model. Aquaculture 2005, 244, 171–185. [Google Scholar] [CrossRef]
- Luis, O.; Carrie, B.; Ronaldo, A. Ecosystem maturity as a proxy of mussel aquaculture carrying capacity in Ria de Arousa (NW Spain): A food web modeling perspective. Aquaculture 2018, 496, 270–284. [Google Scholar] [CrossRef]
- Zhang, H.J.; Liu, S.D.; Liu, Y.J.; Tu, Z.; Zhou, Q.L.; Chen, W.; Sun, W.; Li, F. Community structure of nektons in Laizhou Bay, China. Mar. Sci. 2020, 44, 110–121. (In Chinese) [Google Scholar] [CrossRef]
- Jin, X.S.; Deng, J.Y. Variations in community structure of fishery resources and biodiversity in the Laizhou Bay. Chin. Biodivers. 2000, 8, 65–72. (In Chinese) [Google Scholar] [CrossRef]
- Xu, M.; Qi, L.; Zhang, L.B.; Zhang, T.; Yang, H.S.; Zhang, Y.L. Ecosystem attributes of trophic models before and after construction of artificial oyster reefs using Ecopath. Aquacult. Environ. Interact. 2019, 11, 111–127. [Google Scholar] [CrossRef]
- Lin, Q.; Li, X.S.; Li, Z.Y.; Jin, X.S. Ecological carrying capacity of Chinese shrimp stock enhancement in Laizhou Bay of East China based on Ecopath model. Chin. J. Appl. Ecol. 2013, 24, 1131–1140. Available online: http://www.cjae.net/CN/abstract/abstract10679.shtml (accessed on 12 May 2022). (In Chinese).
- Yang, C.J.; Wu, Z.X.; Liu, H.Y.; Zhang, P.D.; Li, W.T.; Zeng, X.Q.; Zhang, X.M. The fishing strategy of Charybdis japonica and Rapana venosa and the carrying capacity of Apostichopus japonucus in Zhuwang, Laizhou artificial reef ecosystem based on Ecopath model. J. Ocean Univ. China 2016, 46, 168–177. (In Chinese) [Google Scholar] [CrossRef]
- Zhang, M.L.; Leng, Y.S.; Lv, Z.B.; Li, F.; Wang, T.T.; Zhang, A.B. Estimating the ecological carrying capacity of Portunus trituberculatus in Laizhou Bay. Mar. Fish. 2013, 35, 303–308. (In Chinese) [Google Scholar] [CrossRef]
- Christensen, V.; Pauly, D. Trophic Models of Aquatic Ecosystems; ICLARM Conference Proceedings 26; WorldFish: Manila, Philippines, 1993; p. 390. [Google Scholar]
- Sandu, C.; Iacob, R.; Nicolescu, N. Chlorophyll-a determination—A reliable method for phytoplankton biomass assessment. Acta Biol. Hung. 2003, 45, 389–397. [Google Scholar] [CrossRef]
- Jones, J.G. A Guide to Methods for Estimating Microbial Number Sand Biomass in Freshwater; Freshwater Biological Association, Scientific Publication: Ambleside, Cumbria, UK, 1979; p. 108. [Google Scholar]
- Ju, P.L.; Cheung, W.W.L.; Chen, M.; Xian, W.W.; Yang, S.Y.; Xiao, J.M. Comparing marine ecosystems of Laizhou and Haizhou Bays, China, using ecological indicators estimated from food web models. J. Mar. Syst. 2020, 202, 103238. [Google Scholar] [CrossRef]
- Allen, K.R. Relation between production and biomass. Can. J. Fish. Aquat. Sci. 1971, 28, 1573–1581. [Google Scholar] [CrossRef]
- Banse, K.; Mosher, S. Adult body mass and annual production/biomass relationships of field populations. Ecol. Monogr. 1980, 50, 355–379. [Google Scholar] [CrossRef]
- Huang, M.Y.; Xu, S.N.; Liu, Y.; Xiao, Y.Y.; Wang, T.; Li, H.C. Assessment of ecological carrying capacity of Sparus macrocephalus in Daya Bay based on an Ecopath model. J. Fish. Sci. China 2019, 26, 1–13. (In Chinese) [Google Scholar] [CrossRef]
- Link, J.S. Adding rigor to ecological network models by evaluating a set of pre-balance diagnostics: A plea for PREBAL. Ecol. Model. 2010, 221, 1580–1591. [Google Scholar] [CrossRef]
- Heymans, J.J.; Coll, M.; Link, J.S.; Mackinson, S.; Steenbeek, J.; Walters, C.; Christensen, V. Best practice in Ecopath with Ecosim food-web models for ecosystem-based management. Ecol. Model. 2016, 331, 173–184. [Google Scholar] [CrossRef]
- Zeng, Y.; Zhao, Y.W.; Qi, Z.F. Evaluating the ecological state of Chinese Lake Baiyangdian (BYD) based on ecological network analysis. Ecol. Indic. 2021, 127, 107788. [Google Scholar] [CrossRef]
- Finn, J.T. Measures of ecosystem structure and function derived from analysis of flows. J. Theor. Biol. 1976, 56, 363–380. [Google Scholar] [CrossRef]
- Ulanowicz, R.E.; Puccia, C.J. Mixed trophic impacts in ecosystems. Coenoses 1990, 5, 7–16. [Google Scholar]
- Zhang, X.; Zhang, Y.; Sun, H.; Xia, D.X. Changes of hydrological environment and their influences on coastal wetlands in the southern Laizhou Bay, China. Environ. Monit. Assess. 2006, 119, 97–106. [Google Scholar] [CrossRef] [PubMed]
- Chen, Z.Z.; Qiu, Y.S.; Jia, X.P.; Xu, S.N. Using an ecosystem modeling approach to explore possible ecosystem impacts of fishing in the Beibu Gulf, Northern South China Sea. Ecosystems 2008, 11, 1318–1334. [Google Scholar] [CrossRef]
- Han, D.Y.; Xue, Y.; Zhang, C.L.; Ren, Y.P. A mass balanced model of trophic structure and energy flows of a semi-closed marine ecosystem. Acta Oceanol. Sin. 2017, 36, 60–69. [Google Scholar] [CrossRef]
- Wang, T.; Li, Y.K.; Xie, B.; Zhang, H.; Zhang, S. Ecosystem development of Haizhou Bay ecological restoration area from 2003 to 2013. J. Ocean Univ. China 2017, 16, 1126–1132. [Google Scholar] [CrossRef]
- Xu, S.N.; Chen, Z.Z.; Li, S.Y.; He, P.M. Modeling trophic structure and energy flows in a coastal artificial ecosystem using mass-balance Ecopath model. Estuar. Coast. 2011, 34, 351–363. [Google Scholar] [CrossRef]
- Cheng, J.H.; Cheung, W.W.L.; Pitcher, T.J. Mass-balance ecosystem model of the East China Sea. Prog. Nat. Sci. Mater. 2009, 19, 1271–1280. [Google Scholar] [CrossRef]
- Bohnsack, J.A. Are high-densities of fishes at artificial reefs the result of habitat limitation or behavioral preference? Bull. Mar. Sci. 1989, 44, 631–645. [Google Scholar]
- Mace, P.M. A new role for MSY in single-species and ecosystem approaches to fisheries stock assessment and management. Fish Fish. 2001, 2, 2–32. [Google Scholar] [CrossRef]
- Li, X.; Yang, W.; Li, S.; Sun, T.; Bai, J.; Pei, J. Asymmetric responses of spatial variation of different communities to a salinity gradient in coastal wetlands. Mar. Environ. Res. 2020, 158, 105008. [Google Scholar] [CrossRef] [PubMed]
- Li, X.; Yang, W.; Sun, T.; Gaedke, U. Quantitative food web structure and ecosystem functions in a warm-temperate seagrass bed. Mar. Biol. 2021, 168, 74. [Google Scholar] [CrossRef]
- Liu, X.S.; Zhao, R.; Hua, E.; Lu, L.; Zhang, Z.N. Macrofaunal community structure in the Laizhou Bay in summer and the comparison with historical data. Mar. Sci. Bull. 2014, 33, 10. [Google Scholar] [CrossRef]
- Zhuang, L.C.; Ye, Z.J.; Li, J. Age and growth studies of Sebastes schlegelii in Qingdao coastal waters. Period. Ocean Univ. China 2015, 45, 32–37. (In Chinese) [Google Scholar] [CrossRef]
- Ji, D.P. Study on the Fishery Biology of Hexagrammos agrammus and Hexagrammos otakii in Lidao Rongcheng. Ph.D. Theies, China Ocean University, Qingdao, China, 2014. (In Chinese). [Google Scholar]
Publisher’s Note: MDPI stays neutral with regard to jurisdictional claims in published maps and institutional affiliations. |
© 2022 by the authors. Licensee MDPI, Basel, Switzerland. This article is an open access article distributed under the terms and conditions of the Creative Commons Attribution (CC BY) license (https://creativecommons.org/licenses/by/4.0/).