Abstract
The Zhanjiang Formation gray clay has physical properties similar to the muddy clay of other areas, such as a large void ratio and high-water content. At the same time, it also has mechanical properties that differ from muddy clay in other areas, such as high strength and low compressibility. When calculating the foundation settlement, the equation that calculates the foundation settlement as suggested by the code tends to produce values of compression modulus that are too small, which leads to larger calculated values. This study investigated the relationship between the pressure and deformation of Zhanjiang Formation gray clay foundations with different densities, water content, and stress histories by means of a plate loading model test. It revealed the influence of these factors on the deformation modulus, and the quantitative relationship between this modulus and the density of soils, water content, and the over consolidation ratio was established. In doing so, the aforementioned quantitative relationship was applied to the equation which calculated the foundation settlement as suggested by the current code, thereby proposing a pertinent formula relevant to Zhanjiang Formation gray clay foundations. The formula was subsequently applied to two engineering examples, and the settlement amounts output were in agreement with actual measured values, indicating it is reasonable and feasible for practical application. Therefore, it can provide a reference for the calculation of foundation settlements across the coastal area of Beibu Gulf.
1. Introduction
The Zhanjiang Formation gray clay is widely distributed in the coastal area of Beibu Gulf and used as the main carrier of various types of construction (structures). Zhanjiang Formation gray clay possesses an abnormal combination of negative physical properties and positive mechanical properties, such as high void ratio, high water content, high shear strength, and low compressibility. Zhang [1] statistically analyzed the basic physical and mechanical property indexes of the Zhanjiang Formation gray clay in nine different regions, such as the Chikan District, Xiashan District, and the North Port of the Qiongzhou Strait Railway Ferry Project in Zhanjiang City. The differences that were noted between the physical and mechanical properties of clay from other regions of China and the Zhanjiang Formation gray clay were also measured against each other. For example, pertaining to the typical Zhanjiang Formation gray clay, the average void ratio was 1.21, the average natural water content was 45.71%, and the average compression coefficient was 0.33 MPa−1; as for the soft soil in Qingdao, the average void ratio was 1.12, the average natural water content was 43.1%, and the average compression coefficient was 0.94 MPa−1 [2]. The traditional foundation settlement calculation methods are mostly based on the compression modulus obtained from the compression test to calculate the settlement (e.g., the settlement calculation method recommended by the Ministry of Housing and Urban-Rural Development of the People’s Republic of China [3], which shall be referred to as the normative method throughout the rest of this paper). Disturbances such as soil extraction and transportation have a great impact on strong structural soils such as the Zhanjiang Formation gray clay. Furthermore, the compression modulus of the disturbed soil was usually smaller, which in turn led to greater calculated values of foundation settlement. As an example of this, after Zhanjiang Pier One was put into operation, it was found that the actual settlement of the pier far exceeded expectations. The reason was that the foundation soil is a strong structural Zhanjiang Formation gray clay. When the soil structure is not destroyed, the soil compressibility is small, and in contrast, the soil compression modulus is large; however, once the structure is destroyed, the soil compressibility increases and the soil compression modulus decreases, leading to a greater calculated value of foundation settlement when the normative method is used to calculate the settlement of the foundation [4]. Thus, there are applicability problems when adopting the traditional methods for the calculation of foundation settlement, meaning it is necessary to conduct an in-depth study to derive a method specific to the Zhanjiang Formation gray clay foundation.
Currently, the calculation of foundation settlement is conducted by obtaining soil deformation parameters by means of indoor tests [3,5] and in-situ tests [6,7,8], before combining them with various formulae [9,10]. Conducting indoor tests is flawed due to, amongst other factors, being time-consuming [11] and having unavoidable human errors when recording measurements [12], so reported literature has established quantitative relationships between soil and deformation parameters for making necessary predictions for foundation settlement. As early as 1944, Skempton [13] established an empirical formula for the liquid limit and compression index of soils. Sridharan [14] selected ten soil samples for routine consolidation tests and found the compression index and shrinkage index (i.e., the difference between liquid limit and shrinkage limit) are positively correlated. Duncan [15] made the observation that soil type, surrounding pressure, and stress histories are also factors that cannot be ignored with respect to effects on the modulus. Yoon [16] established a linear regression model containing natural water content, natural porosity, and the predicted compression index of the liquid limit, while Hyun [11] used an artificial neural network model to predict the compression index based on seven soil parameters such as natural water content, porosity, liquid limit, plasticity index, and specific gravity. Kirts [12,17] used a support vector machine-based compression model to predict the compression and recompression indices, which included factors that had not been previously considered, such as the dry and wet density of the soil, which improved the prediction’s accuracy. It can be seen that the empirical formula for predicting compression indices should take the effects of multiple factors into consideration. Soil density, moisture content, and stress history all have important effects on soil deformation characteristics. Zhang [18] and Khoury [19] established a quantitative relationship between the water content of soil and the modulus. Wu [20], taking the clay in the Hefei area as the research object, established the linear equation of soil compressibility coefficient and natural water content and density. Additionally, Cao [21] established compression line expressions that can accurately describe normally consolidated clay, over consolidated clay, and sandy soil. Furthermore, Liu [22] proposed a modified equation for calculating soil deformation modulus (based on Janbu’s formula) by considering the effect of stress history on compression modulus. However, there are few reports which establish quantitative relationships for predicting soil compression indices while taking these factors into account.
In China, engineers commonly use the normative method [3]. The method is a simplified and modified layer-wise summation method. The compression modulus obtained from the compression test conducted in a one-dimensional stress state is applied to the layer-wise summation method to calculate the compressive settlement of soils and then multiplied by the empirical coefficient of foundation settlement calculation. Therefore, the normative method that is based on the compression modulus to determine settlement does not consider the settlement caused by lateral deformation. In addition, for soft ground foundation settlement, the effect of lateral deformation cannot be ignored [5,23]. The deformation modulus obtained by using the plate loading test is the ratio of its stress increment to the corresponding strain increment when vertically compressed under partial lateral limit conditions [24], which is a more realistic reflection of the foundation deformation characteristics than the compression modulus obtained by the compression test. Therefore, in this paper, the influence of soil density, water content, and stress history on the deformation modulus is investigated by means of a plate loading test. Subsequently, the quantitative relationships among the soil deformation modulus and density, water content, and over consolidation ratio can be established, and the quantitative relationship is applied to the normative method to propose a calculation formula for foundation settlement of the Zhanjiang Formation gray clay with comprehensive consideration of soil density, water content, and stress history. This provides a reference for the foundation settlement calculation of Zhanjiang Formation gray clay soil in the coastal area of Beibu Gulf.
2. Materials and Methods
2.1. Materials
According to the regional geological data and field survey, a typical sample of Zhanjiang Formation gray clay was selected as the test soil. The parameters of the undisturbed soil are given in Table 1.

Table 1.
Parameters of the undisturbed soil.
ρ is the density of in-situ soil (g/cm3); ω is the water content of in-situ soil; Gs is the specific gravity of in-situ soil particles; ωL is the liquid limit of in-situ soil; ωp is the plastic limit of in-situ soil; and μ is the Poisson’s ratio of in-situ soil.
Gray clays of different densities (1.6 g/cm3, 1.7 g/cm3, 1.8 g/cm3) and different moisture content (37%, 43%, 49%) were prepared as foundation soils in accordance with the standard for geotechnical testing method [25], and a total of nine sets were used. The foundation soils was filled into a custom model box in layers. For each group of foundation soils, different over consolidation ratios OCR (1, 1.5, 4, 6, 12) were set according to the different ratios of maximum consolidation pressure pc to existing overburden pressure p1, which they had been subjected to. The normal consolidation state occurs when the foundation soil with configurated density and water content is step loaded to the proportional limit ps, and pc equals the current overburden pressure p1. Foundation soil in a normal consolidation state was step unloaded to 2/3, 1/4, 1/6, and 1/12 of the proportional limit ps, from which foundations with over consolidation ratios of 1.5, 4, 6, and 12 were obtained, respectively.
2.2. Methods
2.2.1. Test Protocol
Flat plate loading model tests were conducted on foundation soils with different densities, water contents, and over consolidation ratios. The test loading method adopts the step loading maintenance and settlement relative stability method (slow). The settlement was tested once after each level of loading at sequential intervals of 5 min, 5 min, 10 min, 10 min, 15 min, and 15 min. After that, the settlement was tested once every 30 min. When the settlement amount was not more than 0.1 mm per hour for 2 h, the next level of loading was applied. When there was an obvious lateral extrusion, bulging, or cracking, the test was stopped.
2.2.2. Analysis of Test Results
The pressure–settlement relationship curves (p-s curves) for each group of foundation soils under different stress histories were established by recording the magnitude of pressure on each group of foundation soils in real time under different stress histories and their corresponding settlement values, as shown in Figure 1.
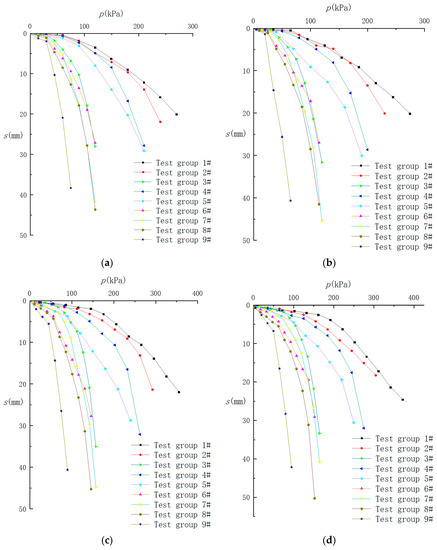
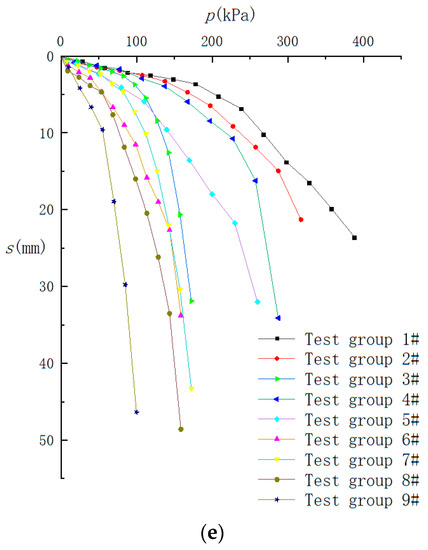
Figure 1.
(a) p-s curve with OCR = 1; (b) p-s curve with OCR = 1.5; (c) p-s curve with OCR = 4; (d) p-s curve with OCR = 6; (e) p-s curve with OCR = 12.
As seen in Figure 1, under the same external load, the deformation of foundation soil generally increases with the decrease in density. The reason is that the smaller the soil density is, the looser the arrangement of soil particles is, and the smaller the friction between soil particles is. As a result, soil particles are more likely to move with each other under the same external load, resulting in greater soil deformation.
Under the same external load, the deformation of foundation soil generally increases with the increase in water content. The reason is that the increase in water content, on the one hand, increases the thickness of water-binding film adsorbed by soil particles and enhances the lubrication between particles; on the other hand, it dissolves more soluble salts between soil particles, reducing the cementation between particles, leading to the reduction in friction and thus increasing soil deformation.
Under the same external load, the deformation of foundation soil generally increases with the increase in over consolidation ratio. The reason is that the foundation soil in the normal consolidation state continues to increase the overburden pressure after the pre-consolidation pressure, the soil particles are arranged more closely, and the friction between soil particles increases. Under the same external load, the soil particles are difficult to move each other, which leads to less soil deformation. With the increase in the over consolidation ratio, the unloading amount of the foundation soil after the pre-consolidation pressure increases, the unloading rebound amount of the foundation soil increases, and the soil void volume increases. Therefore, under the same external load, the compressibility of the soil increases, leading to an increase in soil deformation.
According to the p-s curve, the deformation modulus of each group was determined using the following Equation (1) (with results shown in Table 2):
where i is 1, 2, 3, 4, and 5, which, respectively, represent the deformation modulus E0i (MPa) of foundation soil with an over consolidation ratio of 1, 1.5, 4, 6, and 12, μ is the Poisson’s ratio of the soil, ac is the edge length of the bearing plate (mm) (taken as 150 mm), p is the load value of the linear section of the plate loading test curve (MPa), and s is the settlement corresponding to p (mm).
Table 2.
Test results.
- Relationship between the deformation modulus and the density and water content under normal consolidation conditions.
In accordance with the results from Table 2, the relationship curves between ρ and E01, and ω and E01 when in a normal consolidation state were plotted (see Figure 2 and Figure 3).
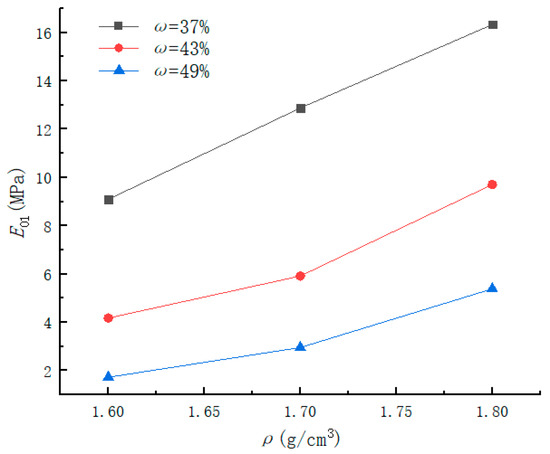
Figure 2.
ρ-E01 curve.
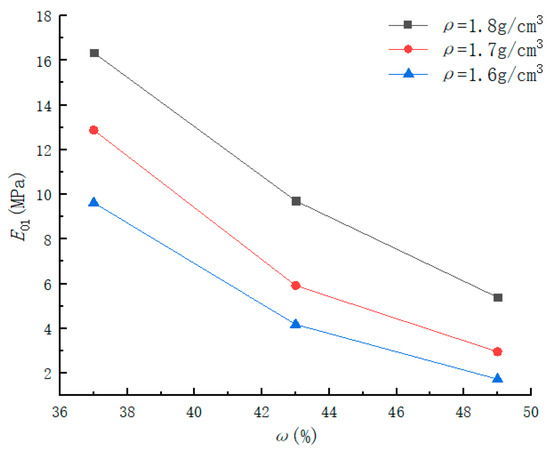
Figure 3.
ω-E01 curve.
As seen in Figure 2, the deformation modulus and soil density share an approximately positive linear correlation. In addition, when the density remains constant, the increase in deformation modulus increases with diminishing water content. For example, at a density of 1.6 g/cm3, the modulus increased by 2.45 MPa and 5.45 MPa when the water content was reduced from 49% to 43% and 43% to 37%, respectively. To explain this trend, the increase in soil density is caused by a decrease in pore volume due to the compact arrangement of soil particles, which leads to greater frictional resistance between particles. The relative displacement among them is reduced under the same external load. Thus, the soil compression decreases and the deformation modulus increases. Under conditions of constant density and diminishing soil water content, the deformation modulus increases exponentially. This is due to the fact that, at high water content (e.g., ω = 49%), the thickness of water-binding film adsorbed by soil particles is large, and the reduction in the water-binding film thickness caused by the decrease in the water content has no significant effect on the mutual movement between soil particles. However, at low water content (e.g., ω = 43%), the thinned water-binding film caused by the lowered water content significantly raises the frictional resistance between soil particles, and their relative displacement is reduced under the same external load. Overall, this results in a larger increase in the deformation modulus at low water content.
As seen in Figure 3, the deformation modulus decreases as the water content of the soil increases. Under the same water content, the reduction in the deformation modulus decreases along with the decrease in density. For example, given a 49% water content, the deformation modulus decreased by 2.43 MPa and 1.23 MPa when the density decreased from 1.8 g/cm3 to 1.7 g/cm3 and 1.7 g/cm3 to 1.6 g/cm3, respectively. This is due to the softening effect of water on soil particles; as the water content increases, the frictional resistance between soil particles decreases, and soil particles are more likely to produce rotation and relative displacement. Therefore, the compression produced under the same external load is greater and the deformation modulus is smaller. Under the same water content, the reduction in the deformation modulus is less as the density of the soil decreases. This occurs because at higher densities (e.g., 1.8 g/cm3), the soil particles are more closely arranged, and the resulting increase in the inter-particle spacing caused by the decrease in density has a significant effect on the reduction in inter-particle frictional resistance. Even so, at smaller densities (e.g., 1.7 g/cm3), the soil particles are more loosely arranged, leading to inter-particle spacing having less of an effect on frictional resistance. Thus, as the soil density decreases, the effect of inter-particle frictional resistance also decreases under the same external load, resulting in a smaller reduction in the reduction in the deformation modulus at low densities.
Considering the effect of soil density and water content on deformation modulus, the relationship between E01 and ρ/ω is curve fitted. as shown in Figure 4.
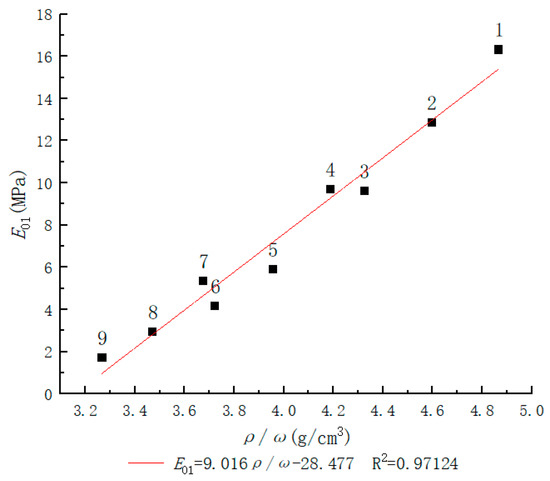
Figure 4.
E01-ρ/ω relation curve.
As evidenced in Figure 4, excluding data points 4 and 7, it was found that the larger the ratio of density to water content, the larger the corresponding soil deformation modulus. E01 has a linear relationship with ρ/ω, so Equation (2) is used for fitting:
where a = 9.016 ± 0.586 (105 cm) and b = 28.477 ± 2.367 (MPa). The unit of parameter a is cm. The parameter a reflects the influence of the side length of the bearing plate on the deformation modulus. The larger parameter a is, the larger the side length of the bearing plate is, and the greater the deformation modulus is. Zhang [26] has obtained the same conclusion through plate load tests of different sizes. On the other hand, the unit of parameter b is MPa. Parameter b reflects the influence of overburden pressure on the deformation modulus. The larger parameter b is, the greater the overburden pressure is, and the smaller E01 is. ρ is the density of the foundation soil (g/cm3), and ω is the water content of the foundation soil; ρ/ω > 3.16 ensures that E01 > 0.
- Relationship between deformation modulus and over consolidation ratio in the over consolidation state.
According to Table 2, the relationship curves between E0i (i = 2, 3, 4, 5) and OCR were plotted for different groups, as shown in Figure 5.
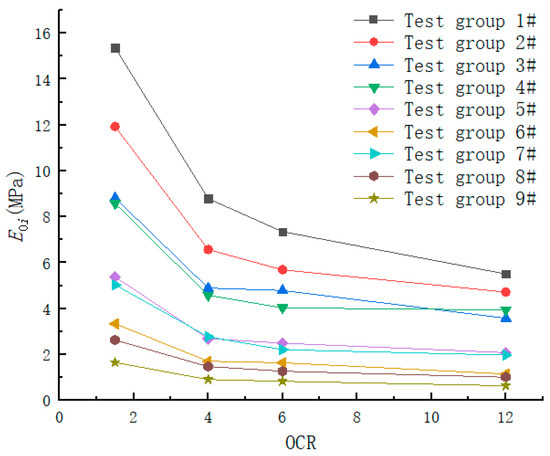
Figure 5.
E0i-OCR curve.
As shown in Figure 5 (except for the third group of data), although the density and water content are different, the variation law for each curve is the same, and the larger the over consolidation ratio is, the smaller the deformation modulus is. Zhang [27] also reached a similar conclusion. Due to the large dispersion of each group’s E0i-OCR curves, a dimensionless treatment of Figure 5 was done. E0i of each group of the foundation was divided by E01 to obtain the E0i/E01-OCR curve, which is illustrated in Figure 6.
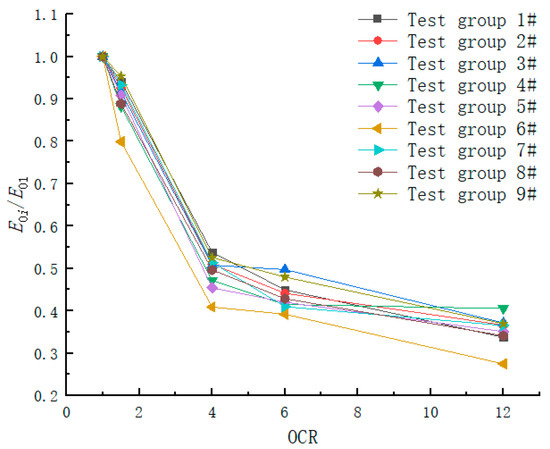
Figure 6.
E0i/E01-OCR curve.
As can be seen in Figure 6, excluding the third group of data, the ratio of E0i/E01 decreases with the increase in the over consolidation ratio. In addition, when the over consolidation ratio is low (OCR = 1~4), the rate of decrease increases, and as it increases (OCR = 4~12), the rate of decrease diminishes before eventually stabilizing.
Each group produced curves that are close to each other, which can be expressed by their mean curves, and they were close to power functions in form. Therefore, the power function was used to fit them with the results listed in Figure 7.
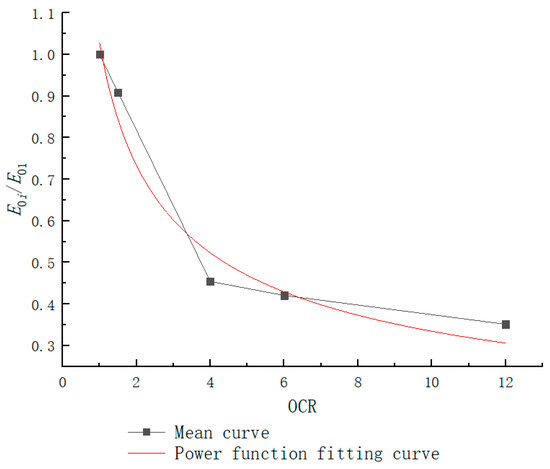
Figure 7.
Power function fitting mean curve.
E0i/E01 can be determined by the following equation, with the correlation coefficient being R2 = 0.96769:
where A = 1.028 ± 0.053 and B = −0.487 ± 0.058 are dimensionless. Parameter B is the influence coefficient of the over consolidation ratio of foundation soil. The larger parameter B is, the greater the influence of the over consolidation ratio of foundation soil is. Parameter A is the comprehensive influence coefficient on E0i/E01 except for the influence of the over consolidation ratio. OCR stands for the over consolidation ratio of the foundation soil, 1 < OCR.
By determining E01 using Equation (2) and substituting it into Equation (3), E0i can be calculated as below:
In summary, when the over consolidation ratio equals 1, Equation (2) is used to calculate the deformation modulus. When it is greater than 1, Equation (4) is used instead to carry out the calculation. This can be combined as Equation (5):
3. Results
3.1. Establishment of a Calculation Formula for Foundation Settlement of Zhanjiang Formation Gray Clay Considering the Influence of Multiple Factors
3.1.1. Correction of Deformation Modulus
Equation (5) determines the deformation modulus of the remolded soil. Because of the structural nature of the Zhanjiang Formation gray clay, there is a difference between the deformation modulus and that of the undisturbed soil. Therefore, the deformation modulus needs to be corrected when it is used for the actual foundation settlement calculation. Both the deformation modulus of remolded and undisturbed soil can be determined by Equation (1) via the plate loading test. Firstly, let the undisturbed soil deformation modulus be and that of the remolded soil be . Then, if loads of the linear section of the undisturbed and remolded soil plate loading test curves are and , respectively, then the corresponding settlements are and . When , the following applies:
From Equation (6), the ratio of the modulus of deformation of undisturbed soil to that of remolded soil can be expressed by the analogous ratio, which corresponds to the same load in the linear section of the plate loading test curve. Xie [28] proposed that, for structurally sensitive clay, the structural magnitude can be reflected by the following formula:
where mp is the integrated structural potential of the soil, and and are the deformation of the remolded sample and the undisturbed sample under the same pressure, respectively.
The magnitude of soil structural properties is also often expressed by sensitivity St:
where and are the unconfined compressive strength of the undisturbed and remolded soil, respectively.
From the definitions of mp and St, it is known that for remolded soils, both mp and St are equal to 1. When soil structural properties are incrementally enhanced, both mp and St increase linearly. Therefore, the relationship between mp and St exists as follows:
where k is the parameter related to soil properties. According to the analysis of the data of this flat loading model test and the in-situ test data of the gray clay of a steel base in Zhanjiang, the k value of the Zhanjiang Formation gray clay ranges from 0.5 to 1.5.
Moreover, substituting Equations (7) and (9) into Equation (6) results in:
where can be expressed as E0 from Equation (5).
Therefore, the deformation modulus of the undisturbed Zhanjiang Formation gray clay can be approximated as:
3.1.2. Calculation Formula for Foundation Settlement of Zhanjiang Formation Gray Clay Considering the Influence of Multiple Factors
The deformation modulus determined by Equation (11) can be used to replace the compression modulus (derived from the normative method) as the optimal means to obtain the formula that calculates the foundation settlement while taking into account the effects of soil density, water content, and stress history.
Consequently, the final settlement of the foundation is calculated according to the following:
In Equation (12), s is the final settlement of the foundation (mm); ψs represents the settlement calculation of the empirical coefficient, and it is comprehensively determined by the equivalent value of compression modulus (here replaced by that of the deformation modulus) and the additional pressure of the foundation; n is the number of soil layers within the range of the foundation settlement calculation depth; pa is the additional pressure of the foundation (MPa); Esm is the mth layer of the soil compression modulus (MPa) below the foundation (here replaced by the modulus of deformation confirmed by Equation (11)); and are the average additional stress coefficients within the range of the bottom of the mth and (m − 1)th soil layers to the foundation surface, respectively, which were comprehensively determined by the length-to-width ratio, the vertical distance between the calculation point and foundation surface, and the foundation width ratio; and zm and zm−1 are the distances from the bottom of the mth and (m − 1)th soil layers to the foundation surface, respectively (mm).
In summary, Equation (12) not only retains the theoretical framework of the normative method, but also takes into account the influence of lateral deformation of the foundation on settlement. At the same time, the formula comprehensively considers the influence of such factors as the density, water content, and stress history of the foundation soil, and the required calculation parameters are easy to obtain. What we proposed is a simple formula applicable to the gray clay foundation of the Zhanjiang Formation, which can additionally provide a reference for foundation settlement calculation in the coastal area of Beibu Gulf.
4. Discussion
4.1. Engineering Verification
4.1.1. Engineering Example 1
To verify the suitability of the proposed formula, it was analyzed with respect to existing studies [29]. The strip foundation of the Zhanjiang Formation gray clay is 1 m wide, the additional pressure at the foundation is 0.3 MPa, and the settlement calculation depth is 6400 mm. The parameters of the soil layer are listed in Table 3.
Table 3.
Parameters of foundation soil layer.
The foundation settlement amount is calculated using Equation (12), which follows the steps: under the foundation is a single soil layer, i.e., n = 1; since the value of k in Equation (11) ranges from 0.5 to 1.5, and k = 1 was taken in this case to determine ; pa is set as greater than or equal to the foundation bearing capacity characteristic value fak, ψs = 1.11. This results in a foundation settlement of 168.06 mm. Calculated results and measured results from measurements are compared in Table 4.
Table 4.
Comparison of settlement calculation results.
From Table 4, it is proven that the values of foundation settlement of the Zhanjiang Formation gray clay calculated by both methods are close to the actual measured value. The relative error between the measured value and the calculated value using the method in reference [29] is 15.6%, and the relative error between the measured value and the calculated value using the formula in this paper is 10.9%. This shows that both methods can accurately calculate the foundation settlement.
4.1.2. Engineering Example 2
To further verify the reliability of the proposed formula, the settlement of soil at a stockpile yard in Zhanjiang was calculated. The foundation of the stockpile yard was buried at a depth of 2.5 m, and it measured 550 m long and 200 m wide. According to the ground investigation report, the gray clay layer was under the bottom slab, with a small amount of the coarse sand layer containing clay. The suggested value of the compressive modulus of Zhanjiang gray clay was 7.8 MPa, and the suggested characteristic value of the bearing capacity of the foundation was 170 MPa. The applicable parameters of Zhanjiang gray clay are shown in Table 5. Additionally, the additional pressure on the foundation caused by the stockpile was 0.12 MPa.
Table 5.
Parameters of foundation soil layer.
As previously done, the foundation settlement was calculated using Equation (12). Take a soil layer with a thickness of ∆z above the settlement calculation depth. If the calculated settlement of the selected soil layer is less than or equal to 0.025 times the total calculated settlement within the settlement calculation depth range, , the settlement calculation depth can be determined as 40,000 mm. Assuming there was a single soil layer under the foundation, it can be assumed that n = 1. Since the value of k in Equation (11) ranges from 0.5 to 1.5, and k = 1 was taken in this case to determine , pa ≤ 0.75fak, and ψs = 0.45, the foundation settlement was calculated to be 156.97 mm. Table 6 provides a comparison of the results obtained from Formula (12) with the calculated and measured values achieved via the normative method.
Table 6.
Comparison of settlement calculation results.
As can be concluded from Table 6, the calculation results using the proposed formula are similar to the measured settlement. The relative error between the measured value and the calculated value using the normative method is 183.4%, and the relative error between the measured value and the calculated value using the formula of this paper is 8.0%. This proves that when using the formula in this paper, the calculated value is closer to the actual measured value. The difference between calculated results using the normative method and the formula in this paper is significant. This is most likely due to the compression modulus used in the normative method destroying the structure of the foundation soil as a result of the disturbance of sampling and transportation. As the subsequent calculation was not corrected, the compression modulus did not truly reflect the deformation of the foundation soil, resulting in significant differences between the calculated values of the normative method and the formula in this paper.
Through the calculation of the foundation settlement of the two engineering examples, the formula’s reliability and feasibility for practical application, i.e., to calculate the foundation settlement of Zhanjiang Formation gray clay, is proven.
5. Conclusions
By applying the plate loading model test on Zhanjiang Formation gray clay foundations with different densities, water contents, and stress histories, it was concluded that E01 has a good linear relationship with ρ/ω under normal consolidation conditions, with a positive correlation with ρ/ω. Additionally, E0i/E01 has a power function relationship with OCR, and there is a negative correlation between E0i/E01 and OCR. Based on the above trends, the relationship between E0 and ρ, ω, and OCR can be fitted, yielding the quantitative relationships between soil deformation modulus and density, water content, and the over consolidation ratio.
Next, by analyzing the deformation moduli of undisturbed and remolded soil, this modulus can be modified, allowing it to replace the modulus of compression derived from the normative method, giving rise to a proposed formula for calculating the foundation settlement, which integrates the factors of soil density, water content, and stress history.
Finally, the calculation and analysis of two engineering examples show the proposed formula, which is used to calculate the foundation settlement of the Zhanjiang Formation gray clay, is reliable and feasible for practical use.
Author Contributions
Conceptualization, B.T. and X.Y.; investigation, Y.S.; data curation, Y.S. and X.Y.; writing—original draft preparation, Y.S.; writing—review and editing, B.T. and Y.S.; funding acquisition, B.T. All authors have read and agreed to the published version of the manuscript.
Funding
This research was funded by the National Natural Science Foundation of China, grant number 41867035, and the Guangxi Natural Science Foundation, grant number 2020GXNSFAA297199.
Institutional Review Board Statement
Not applicable.
Informed Consent Statement
Not applicable.
Data Availability Statement
The data presented in this study are available upon request from the author via e-mail: 2120200693@glut.edu.cn.
Acknowledgments
The Funders are gratefully acknowledged.
Conflicts of Interest
The authors declare no conflict of interest.
References
- Zhang, X.W.; Kong, L.W.; Guo, A.G.; Tuo, Y.F. Physical and mechanical indexes and correlation analysis of clay with noticeable structures in Zhanjiang area. J. Eng. Geol. 2011, 19, 447–454. [Google Scholar] [CrossRef]
- Zhang, X.W.; Wang, C.M.; Li, Z.S.; Ji, J. Contrasting study on fundamental properties of structural soft clay in different areas. Geotech. Investig. Surv. 2010, 38, 6–10, 93. [Google Scholar]
- Teng, Y.J.; Huang, X.L.; Wang, S.G.; Gong, J.F.; Wang, W.D.; Wang, X.N.; Wang, G.S.; Bai, X.H.; Ren, Q.Y.; Liu, S.Y.; et al. Code for Design of Building Foundation; China Architecture & Building Press: Beijing, China, 2011; pp. 26–30. ISBN 978-7-112-16920-7.
- Zhang, H.C. The effect of structural clay on the displacement of Zhanjiang No.1 quay. Hydro. Sci. Eng. 1985, 3, 123–132. [Google Scholar] [CrossRef]
- Li, Y.; Xie, Y.; Liu, B. Application of Modified Secant Modulus Method in Settlement Calculation. J. Highw. Transp. Res. Dev. 2009, 4, 35–39. [Google Scholar] [CrossRef]
- Anderson, J.B.; Townsend, F.C.; Rahelison, L. Load Testing and Settlement Prediction of Shallow Foundation. J. Geotech. Geoenviron. Eng. 2007, 133, 1494–1502. [Google Scholar] [CrossRef]
- Fu, Z.; Chen, S.; Liu, S. Discrete Element Simulations of Shallow Plate-Load Tests. Int. J. Geomech. 2016, 16, 04015077. [Google Scholar] [CrossRef]
- MolaAbasi, H.; Saberian, M.; Khajeh, A.; Li, J.; Chenari, R.J. Settlement predictions of shallow foundations for non-cohesive soils based on CPT records-polynomial model. Comput. Geotech. 2020, 128, 103811. [Google Scholar] [CrossRef]
- Schmertmann, J.H.; Hartman, J.P.; Brown, P.R. Improved Strain Influence Factor Diagrams. J. Geotech. Eng. Div. 1978, 104, 1131–1135. [Google Scholar] [CrossRef]
- Valikhah, F.; Eslami, A. CPT-Based Nonlinear Stress–Strain Approach for Evaluating Foundation Settlement: Analytical and Numerical Analysis. Arab. J. Sci. Eng. 2019, 44, 8819–8834. [Google Scholar] [CrossRef]
- Hyun, I.P.; Seung, R.L.; Brown, P.R. Evaluation of the compression index of soils using an artificial neural network. Comput. Geotech. 2011, 38, 472–481. [Google Scholar] [CrossRef]
- Kirts, S.; Nam, B.H.; Panagopoulos, O.P.; Xanthopoulos, P. Settlement Prediction Using Support Vector Machine (SVM)-Based Compressibility Models: A Case Study. Int. J. Civ. Eng. 2019, 17, 1547–1557. [Google Scholar] [CrossRef]
- Skempton, A.W.; Jones, O.T. Notes on the compressibility of clays. Q. J. Geol. Soc. 1944, 100, 119–135. [Google Scholar] [CrossRef]
- Sridharan, A.; Nagaraj, H.B. Compressibility behaviour of remoulded, fine-grained soils and correlation with index properties. Can. Geotech. J. 2000, 37, 712–722. [Google Scholar] [CrossRef]
- Duncan, J.M.; Bursey, A. Soil modulus correlations. In Proceedings of the American Society of Civil Engineers Geo-Congress 2013, San Diego, CA, USA, 3–7 March 2013; pp. 321–336. [Google Scholar] [CrossRef]
- Yoon, G.L.; Kim, B.T.; Jeon, S.S. Empirical correlations of compression index for marine clay from regression analysis. Can. Geotech. J. 2004, 41, 1213–1221. [Google Scholar] [CrossRef]
- Kirts, S.; Panagopoulos, O.P.; Xanthopoulos, P.; Nam, B.H. Soil-Compressibility Prediction Models Using Machine Learning. J. Comput. Civ. Eng. 2018, 32, 04017067. [Google Scholar] [CrossRef]
- Zhang, D.W.; Liu, S.Y.; Zhang, T. Water content and modulus relationship of a compacted unsaturated soil. J. Southeast Univ. 2012, 28, 209–214. [Google Scholar] [CrossRef]
- Khoury, N.; Brooks, R.; Boeni, S.Y.; Yada, D. Variation of resilient modulus, strength, and modulus of elasticity of stabilized soils with postcompaction moisture contents. J. Mater. Civ. Eng. 2013, 25, 160–166. [Google Scholar] [CrossRef]
- Wu, L.N.; Xie, Q.Q.; Fang, Y.Y. Correlation analysis of the physica-l mechanical indexes of cohesive soil in Hefei area. Hydrogeol. Eng. Geol. 2002, 29, 43–45. [Google Scholar] [CrossRef]
- Cao, Y.Q.; Wu, Y.; An, X.Y.; Su, X.X.; Fan, X.Y.; Gong, T.Z. Calculation method for oedometric modulus of soil with effects of stress history and stress level. J. Eng. Geol. 2019, 27, 760–765. [Google Scholar] [CrossRef]
- Liu, Q.Y.; Liang, J.G.; Feng, H.P. The Settlement and Deformation of Foundation Under High Stress. J. Water Resour. Archit. 2018, 16, 111–115. [Google Scholar]
- Yu, C.; Pan, L.Y.; Du, G.Y.; Lei, C.; He, X.; Xie, H.; Kang, Y. Numerical simulations on the lateral deformation in soft ground under embankments. In Proceedings of the SPIE International Conference on Experimental Mechnics 2008 and Seventh Asian Conference on Experimental Mechanics, Nanjing, China, 8 November 2008; Volume 7375, pp. 1–5. [Google Scholar] [CrossRef]
- Antipov, V.V.; Ofrikhter, V.G. Transition factor between elastic and deformation moduli for dispersive soils. Mag. Civ. Eng. 2020, 99, 9907. [Google Scholar] [CrossRef]
- Cai, Z.Y.; Wang, F.; Gao, C.S.; He, N.; Liu, X.S.; Gong, B.W.; Wu, Q.B.; Li, P.; Hu, Z.Q.; Ling, H.; et al. Standard For Geotechnical Testing Method; China Planning Press: Beijing, China, 2019; pp. 8–20, 241–246.
- Zhang, W.; Zhang, H.; Chen, G.; Liu, K. Plate loading test of fine silty sand ground in Inner Mongolia. Chin. J. Geotech. Eng. 2010, 32, 492–495. [Google Scholar]
- Zhang, Q.; Liu, J.; Zheng, G. Experimental studies on influence of pit dewatering and excavation on soils at different depths below excavation base. Sci. Technol. Eng. 2016, 16, 75–82. [Google Scholar] [CrossRef]
- Xie, D.Y.; Qi, J.L. Soil structure characteristics and new approach in research on its quantitative parameter. Chin. J. Geotech. Eng. 1999, 21, 651–656. [Google Scholar]
- He, C.B.; Zhao, M.H.; Ma, B.H.; Chen, Q.N. A nonlinear settlement computation method for soft soil foundation considering its structural characteristic. Build. Struct. 2015, 45, 82–86. [Google Scholar] [CrossRef]
Publisher’s Note: MDPI stays neutral with regard to jurisdictional claims in published maps and institutional affiliations. |
© 2022 by the authors. Licensee MDPI, Basel, Switzerland. This article is an open access article distributed under the terms and conditions of the Creative Commons Attribution (CC BY) license (https://creativecommons.org/licenses/by/4.0/).