Abstract
Provincial economic development in the VUCA era (V: volatility; U: uncertainty; C: complexity; A: ambiguity) is facing great challenges. Comprehensively measuring the provincial ecological niche and giving enhancement strategies are significant for the implementation of the Yellow River Strategy. By constructing the S–R–F (Status–Relationship–Function) provincial ecological niche measurement framework using the SEM model (the structural equation modeling), this paper calculated the provincial ecological niche of the Yellow River Basin from 2005 to 2019 using an ecological niche width model, an ecological niche overlap model and an ecological niche suitability model and gave improvement strategies through spatial positioning. Results: (1) The ecological niche breadth in the Yellow River Basin is uneven, showing a spatial pattern of “low in the upper reaches, high in the lower reaches”. The ecological niche overlap changes from synchronous competition to hierarchical differentiation. The ecological niche suitability shows a transformation of “overall homogeneity but local variation”. (2) Qinghai and Gansu belong to subspace I of ecological niches; the strategies of ecological niche specialization, potential ecological niche and ecological niche synergy are appropriate. Shanxi, Inner Mongolia and Ningxia belong to subspace III; the strategies of ecological niche specialization, ecological niche separation, potential ecological niche and ecological niche synergy are suitable. Shandong belongs to subspace VI; the strategies of ecological niche generalization and ecological niche synergy are fitting. Henan, Sichuan and Shaanxi belong to subspace VIII; it is advisable to choose ecological niche generalization, ecological niche separation and ecological niche synergy strategies. The possible marginal contributions of this paper are: (1) applying the idea of fitting optimization to guide the construction of a provincial ecological status indicator system, applying the validation analysis in the SEM model to test the suitability and validity of a provincial ecological status indicator system and improving the scientificity and objectivity of the indicator system construction. (2) Correlating the measurement model with the connotation (state–relationship–function) of the provincial ecological niche, the perspective of ecological niche research and improving the theoretical support for the construction of a multidimensional measurement model. (3) Spatial positioning of provincial ecological niches to improve the relevance and effectiveness of strategies.
1. Introduction
In the 21st century, the volatility, uncertainty, complexity and ambiguity of the VUCA era have become increasingly prominent, and the risks and challenges faced by provincial economic development are unprecedented, so it is necessary to scientifically measure the provincial ecological niche and improve its fitness to the environment. The Yellow River Basin has the strategic orientation of “balancing the north and south, coordinating the east and west”, so how to construct an excellent evaluation system and give improvement strategies through spatial positioning is an important part to realizing its high-quality development in the VUCA era.
The concept of ecological niche was proposed and refined by Johnson and Grinnell [1,2]; it emphasizes the survival environmental requirements across the geographic distribution of species [3,4] and the interactions between communities [5]. As research progressed, the ecological niche gradually developed from a functional definition to a geometric one of the environmental capacity or ecological space occupied by a species [6]. Wang Gang, a Chinese scholar, combined with Grinnell, Elton and others’ discussions of the concept, suggested that the ecological niche includes the relationship between species and the environment as well as the interspecific relationship of species, and in a broad sense, the interspecific dynamic relationship is also the relationship between species and the environment [7]. Based on the concept, domestic researchers have conducted extensive studies on ecological niches, including its definition [8,9], ecological niche posture theory [10] and ecological niche measurement [10,11]. In addition, the interdisciplinary application of ecological niche theory has derived various paradigms of composite ecological niches, such as urban ecological niches [12,13,14,15], industrial ecological niches [16,17], tourism ecological niches [18,19,20], corporate ecological niches [21,22], corporate cultural ecological niches [23] and composite ecosystem ecological niches [24,25]. Researchers also quantified the connotation of ecological niche from different perspectives. Various measurement methods such as the ecological niche suitability model [26], ecological niche breadth model [1,27,28,29] and ecological niche overlap model [27] have been explored. Ecological niche research has received widespread attention and has yielded fruitful research results. However, due to the relatively short time that the ecological niche theory has been in the field of regional development, there are still some urgent needs for improvement. First, there is a lack of analysis of the ecological niche status, internal ecological niche differences and evolutionary patterns by provincial units. Second, although current research methods on ecological niche measurement focus on resource acquisition and resource occupation, few studies have combined the ecological niche “Status–Relationship–Function” model with the ecological niche “state” model. Third, most studies focus on the analysis of the current situation and evolution, but few use them to guide the development of provinces. There is a lack of research on the use of provincial ecological niches to guide the development of provincial ecological niche improvement strategies.
Based on the ecological niche theory, this paper optimizes the ecological niche index system through the SEM model and constructs a three-dimensional measurement framework integrating the location state of the province on the regional resource gradient (S), the ecological network relationship formed by the province in the process of regional ecological spatial resource flow (R) and the functional attributes of the province for the suitability of human production and living activities (F). The framework is used to measure the ecological niche of the Yellow River Basin and to propose strategies to improve the ecological niche of each province through the ecological niche spatial positioning.
2. Materials and Methods
2.1. Provincial Ecological Niche Index System Constructing Path
A scientific and rational indicator system depends on whether the indicators can visualize the abstract concepts and express the characteristics of them. Therefore, it is not reasonable to select indicators qualitatively from the theory, and it is necessary to check quantitatively whether the initial indicators can reflect the affiliation of each dimension and the correspondence degree between the indicator system and the real situation. This paper uses structural equation modeling (SEM) to optimize the index system (the SEM model has applicability to the optimization of the index system [30]). The optimization path is shown in Figure 1.
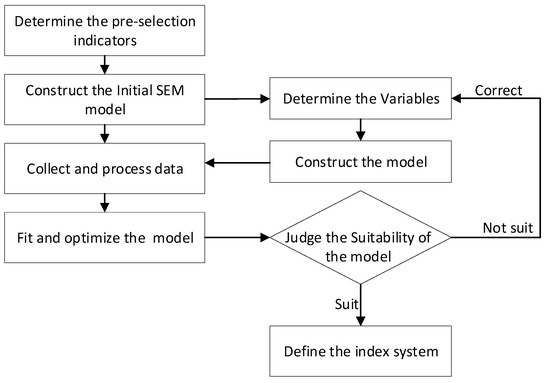
Figure 1.
The optimization process of the indicator system based on the SEM model.
2.2. Determination of the Indicator System
2.2.1. Primary Selection of Indicators
Academics often select ecological niche indicators from the dimensions of social economy [3,14,31], resources and environment, [12,29,31], population size and urban development [1,30]. In this paper, the indicator system contains the provincial environmental ecological niche, provincial resource ecological niche and provincial economic ecological niche, and the provincial social ecological niche is constructed from four perspectives: economic power, social development, resource abundance and environmental quality. Finally, we determined a pre-selected indicator set containing 40 observable indicators (Table 1).

Table 1.
Preliminary selection of provincial ecological niche indicators.
2.2.2. Initial Construction of the SEM Model
The provincial ecological position (G) is an endogenous latent variable; the secondary indicators economic ecological niche (A), social ecological niche (B), resource ecological niche (C) and environmental ecological niche (D) are exogenous latent variables; the tertiary indicators are all observed indicators, i.e., exogenous explicit variables. This paper uses AMOS 20.0 to construct the initial SEM model (Figure 2).
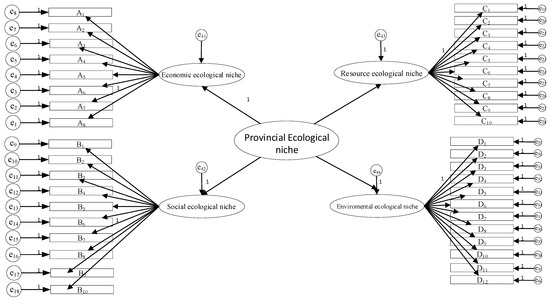
Figure 2.
Total path diagram of the initial model.
2.2.3. Data Collection and Process
- (1)
- Questionnaire design and data collection
In this paper, experts of the Yellow River Basin development (including government, universities and research institutions) were the main survey subjects. The survey lasted for 3 months. A total of 500 questionnaires were distributed and 474 were returned, with a recovery rate of 94.8%, of which 448 questionnaires were valid, with a valid rate of 94.51%. The sample structure of the survey is shown in Table 2.
Table 2.
Survey sample structure.
- (2)
- Reliability and Validity test
In this paper, Cronbach’s alpha is used to measure the questionnaire’s reliability. As can be seen from Table 3, the reliability of all four variables is above 0.8, which means that the reliability is qualified.
Table 3.
Reliability analysis.
In this paper, KMO and Bartlett’s sphericity tests were conducted on the questionnaire data by SPSS 24.0. As can be seen from Table 4, the KMO values are all greater than 0.9, and the Bartlett’s sphericities all reach the significance level, indicating that the items are significantly correlated and are suitable for factor analysis.
Table 4.
KMO and Bartlett’s test.
2.2.4. Model Optimization
In this paper, AMOS 20.0 was used to analyze the structural equation model (the standardized path is shown in Figure 3, and the fit indices are shown in Table 5). The initial model’s NFI value of 0.869 < 0.90 failed the test; the GFI value of 0.877 < 0.90 failed the test; the PGFI value of 0.43 < 0.50 failed the test. It can be concluded that the total fitting effect of the model needs to be improved. Through factor tracing, the payloads of share of fixed asset investment in GDP (A3), Engel coefficient (B3), number of college students per 10,000 people (C8), technology contract turnover (C3), sandy land area (D3) and forest disaster control rate (D11) are 0.232, 0.272, 0.259, 0.288, 0.249 and 0.337, which are significantly lower than the acceptable value of 0.431. Therefore, these indicators should be excluded.
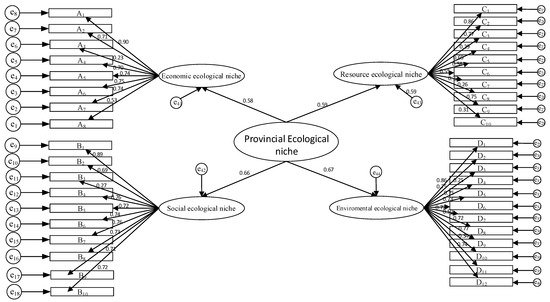
Figure 3.
Initial model normalization path diagram.
Table 5.
Initial overall fit evaluation table.
After excluding some indicators, the model is fitted for the second time. The result shows that the model still needs to be adjusted, and when the fitness index does not meet the requirements, we should consider the existence of multiple covariance [31]. In this paper, D8 and D10 both reflect the level of regional living pollution management, C5 and C4 both reflect the degree of ecological greening, the A8 index contains the level of industrialization reflected by A6 and C6 and C9 both reflect the level of R&D investment in high-tech. So, indicators after the second fitting have the problem of multicollinearity. In this paper, the correlation indexes whose factor loadings are relatively low were eliminated from the correlation index group. After the correction, the model was fitted for the third time, and the indices all reached the requirements (Table 6). The standardized path is shown in Figure 4.
Table 6.
Modified overall goodness-of-fit evaluation table.
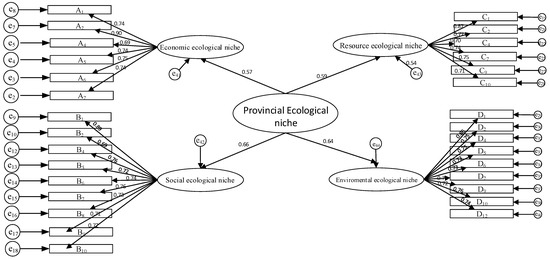
Figure 4.
Modified normalized path diagram.
The factor weights are calculated by comparing the values of different factor normalized action path coefficients with the help of the normalization algorithm (Table 7).
Table 7.
Provincial ecological status index system and weights.
2.3. Framework of the Measurement and Empirical Data
- (1)
- Design of the “ecological niche S-R-F” measurement framework
This paper is based on the theories of ecological niche posture, interspecific relationships and ecological niche suitability and evolution. The ecological niche posture theory emphasizes the specific status on the gradient of ecological factors in the spatial range and its influence on the surrounding environment, which can characterize the status of the province on the regional resource gradient (S); the interspecific relationships theory emphasizes the relationship network formed by the subject directly influencing the limited demand of other subjects, which can characterize the ecological network relationship formed by the province in the process of regional ecological space resource flow (R); the theory of ecological niche suitability and evolution emphasizes the proactive adaptation of the species to the environment in order to achieve their survival and sustainable development, and it can characterize the functional attributes (F) of the suitability of the province for human production and living activities. Based on these theories, a theoretical framework for measuring ecological niches in the Yellow River Basin (Figure 5) is constructed, and the ecological niche breadth, ecological niche overlap and ecological niche suitability models are selected to measure the relevant indexes.
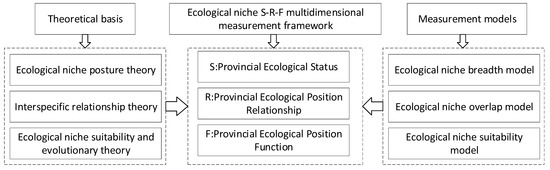
Figure 5.
Framework of the S–R–F measurement model of provincial ecological position.
- (2)
- Study area and Data sources
As shown in Figure 6, the Yellow River Basin is located between 96~119° E and 32~42° N. The whole area from the Qinghai-Tibet Plateau, from west to east, covering a total of nine provinces (regions) in Qinghai, Sichuan, Gansu, Ningxia, Inner Mongolia, Shaanxi, Shanxi, Henan and Shandong, is a biological corridor linking the Qinghai-Tibet Plateau, Loess Plateau and North China Plain, and it has an important role in China’s energy use, chemical production and raw material supply. It has a very important strategic position in terms of economic and social development and ecological security. The 2021 basin gross domestic product reached CNY 286,851,167, accounting for 25.08% of that of the country. The total regional population is 421.2 million people, accounting for 29.84% of the country.
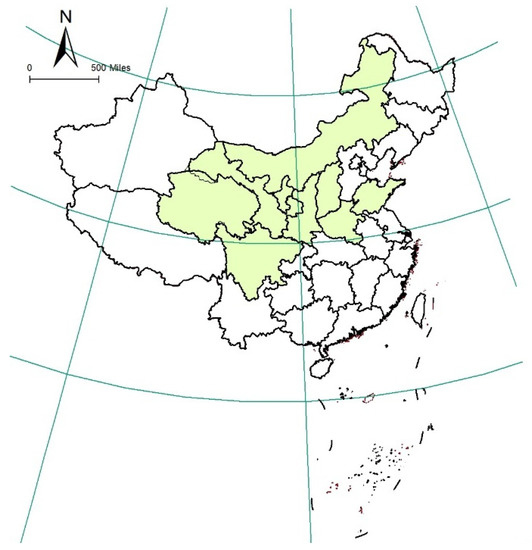
Figure 6.
Location of the study area in China.
The research time period is 2005–2019. The data were obtained from the statistical yearbooks of the provinces in the Yellow River Basin, the Chinese Environmental Statistical Yearbook, the statistical bulletins on the national economic and social operation of the provinces and the environmental statistical bulletins. Some of the missing data are completed by using the interpolation method and the neighboring years data. Furthermore, the research time sequence is divided into three stages: 2005–2009, 2010–2014 and 2015–2019.
2.4. Measurement Models
2.4.1. Status Dimension (S): Measurement of the Provincial Ecological Niche Breadth
The present ecological niche breadth depends on the status of the resources it can access, while the upcoming ecological niche breadth depends on the potential of the resources (the rate of change of the stock of each ecological factor) and the passage of time. The combination of “status” and “potential” reflects the size of the provincial ecological niche breadth, i.e., the position status (S) of the province on the sequence of the ecological factor gradients, which can be expressed as follows (Levin, 1968).
Ni: the ecological niche of each indicator factor; Si: the status of the factor i; Pi: the potential of the factor i; Ai and Aj are the scale conversion coefficients; ωi: the weight.
Using Equation (2), the ecological niche breadth of each dimension can be calculated, and Mk denotes the ecological niche breadth of the economy, society, resource and environment. The larger the ecological niche breadth is, the stronger the access of the province to resources is.
2.4.2. Relationship Dimension (R): Measurement of Provincial Ecological Niche Overlap
Considering provinces as ecological units in regional ecosystems, there exists ecological niche overlaps among provinces due to the proximity of locational conditions, the linkage of elements and the integrated utilization of resources. In this paper, the Pianka model is used to calculate the provincial ecological niche overlaps (Schoener, 1974).
: the overlap of the provincial ecological niche between provinces a and b (i = 1, 2, 3..., n); Xai, Ybi: the ecological niche value of the i-th measurement indicator of provinces a and b. The overlap is usually between 0 and 1. Since the four dimensions of provincial economic, social, resource and environmental ecological niches are interlinked to form a provincial composite ecosystem, the sum-alpha method is used to calculate the degree of overlap of ecological niches within the provincial unit.
: the integrated ecological niche overlap degree of provinces i and j; : the overlap degree of provinces i and j on the r-th resource. When calculating the degree of overlap of ecological niches in each province, the degree of overlap is independent, so it is appropriate to use the “product alpha” method.
di: comprehensive ecological niche overlap degree of province i; : ecological niche overlap value between provinces i and j.
2.4.3. Function Dimension (F): Measurement of Provincial Ecological Niche Suitability
The closeness of the real ecological niche to the optimal one reflects the functional attributes of the provincial ecological niche, the size of the provincial competitiveness and the ability of sustainable development at the same time (Hurlbert, 1978).
: the ecological niche suitability value of the i-th province; ωj: the weight of the j-th ecological factor; : the realistic ecological niche (standardized value);: the optimal ecological niche (standardized value); ε: the model parameter, which is usually estimated; this paper refers to Li Zizhen’s measure for the ε value. It is assumed that (), and note that the minimum, maximum and mean values of are: , , . Assuming , the parameter ε can be estimated from , i.e., . The smaller the gap between the real ecological niche and the optimal ecological niche is, the larger the is.
The best ecological niche of indicators such as the excellent air quality rate and harmless disposal rate of domestic waste is the theoretical extreme value of 100; the best ecological niche of the import and export trade volume as a proportion of GDP, the ratio of the added value of tertiary industry and the added value of GDP per capita is the average value of domestic first-tier cities; the best ecological niche of the per capita water resources and arable land area ratio is the integrated planning value of the Yellow River Basin. Regarding the remaining indicators, we take the maximum value of 2005–2019 in the Yellow River Basin region as the best ecological niche.
3. Results
3.1. The Measurement of the Provincial Ecological Niche Breadth
This paper uses the average value of each stage of the statistical data of the Yellow River Basin provinces as the “status”, the average growth of each indicator in the adjacent years as the “potential” and 0.2 as the conversion coefficient. The breadth of the four dimensions and the provincial ecological niches are shown in Table 8.
Table 8.
Breadth and ranking of ecological niches in the Yellow River Basin provinces.
3.2. The Measurement of the Provincial Ecological Niche Overlap
In this paper, we take the average value of the ecological niche overlap of each ecological factor in a 5-year time scale and calculate the overlap of the economic ecological niche, social ecological niche, resource ecological niche and environmental ecological niche of the nine provinces in the three stages, respectively. The sum-alpha method was used to compute the ecological niche overlap matrix of the Yellow River Basin (Table 9).
Table 9.
Matrix of the overlap of the ecological niches in the Yellow River Basin provinces.
To further analyze the characteristics of the overlapping relationships of the ecological niches in different provinces, the three-stage provincial ecological niches overlap in the Yellow River Basin was measured by the product alpha method according to the provincial ecological niches overlap matrix (Table 10).
Table 10.
Comprehensive three-stage overlap degree and ranking of the provincial ecological niche.
3.3. The Measurement of Provincial Ecological Niche Suitability
Using Equation (6), the suitability of ecological niches in the Yellow River Basin provinces from 2005 to 2019 can be calculated (Table 11).
Table 11.
Suitability and ranking of ecological niches in the Yellow River Basin provinces.
4. Improvement Strategies
4.1. Spatial Positioning
Based on the mean value of each dimension, it can be divided into “high ecological niche” and “low ecological niche” and, further, into eight ecological niche subspaces, using point Ni (Si, Ri, Fi) to represent the ecological niche of each province—Si is the ecological niche breadth of province i, Ri is the ecological niche overlap of province i and Fi is the ecological niche suitability of province i. (Figure 7) By positioning, we can clarify the position of province i in the ecological niche space of the whole Yellow River Basin and help it choose the optimal ecological niche development space.
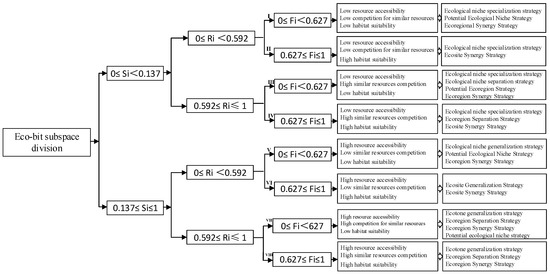
Figure 7.
Subspace division of ecological niches based on the S–R–F 3D model and its enhancement strategy.
The mean value of the provincial ecological niche width (0.137), the mean value of the provincial ecological niche overlap (0.592) and the mean value of the provincial ecological niche suitability (0.627) are used as the boundaries to distinguish the ecological niche rank intervals in this dimension, which can be divided into [0, mean] and [mean, 1], according to which each dimension will be further subdivided into two parts, and the three dimensions can be combined into eight different spaces. Thus, the subdivision of the S–R–F three-dimensional model into eight eco-location subspaces with differentiated characteristics is realized.
Based on the measurement results and the specific reality of the Yellow River Basin, we have developed several ecological niche enhancement strategies to choose from, and the specific practice methods of each strategy are as follows. The ecological niche generalization strategy requests the expansion of ecological factor resource space and ecological niche factors in each dimension of the provincial ecological niche; the ecological niche specialization strategy requests the expansion of the ecological niche of certain superior ecological factors in the province with certain specific resources or an adaptive capacity to improve the core competitiveness; the ecological niche separation strategy requests the formation of a provincial niche different from that of competitors according to its own resource advantages and location conditions; the ecological niche segregation strategy requests the formation of an optimal ecological niche space with a “staggered structure and heterogeneous functions” by complementing the advantages of two or more provinces; the potential ecological niche strategy requests the exploration of industries and core competitiveness that are not occupied or do not exist at present.
4.2. Improvement Strategies
According to the mean values of the ecological niche in different dimensions of each province, the spatial positioning can be obtained with reference to Table 12, and the ecological position enhancement strategy of each province can be selected accordingly.
Table 12.
Spatial positioning of the ecological niches in the Yellow River Basin provinces.
Qinghai and Gansu belong to subspace I; they should expand their own competitive eco-factor resource capacity through the ecological niche specialization strategy, consolidate their own position in the regional scope and, at the same time, fully utilize their own advantages to actively capture the potential niche in the dynamic spatial structure to form a new core competitiveness.
Shanxi, Inner Mongolia and Ningxia belong to subspace III and should give full play to their strong resource acquisition ability to continuously expand an ecological niche in each dimension, while they should avoid occupying similar resources under the premise that their own provincial development level and real resource suitability are low. The three can discover the most suitable ecological niche space and structure for their development mode through the potential ecological niche strategy.
Shandong belongs to subspace VI; it has a complete range of industries, rich human resources and a high abundance of marine resources, so it can use its strong comprehensive strength to further extend its ecological niche spatial scope. It is adjacent to the Yellow and Bohai Seas in the east, the Yellow River Basin in the west, Beijing, Tianjin and Hebei in the north and the Yangtze River Economic Belt in the south, which is an extremely advantageous geographical location. So, it should further strengthen the synergy and promote the orderly flow of resources so that it can play a leading role in the coordinated development of the region.
Henan, Sichuan and Shaanxi belong to subspace VIII. First, they should make full use of their advantages in acquiring resources to further generalize their ecological factors and continuously expand their ecological niches in various dimensions. Second, the ecological niche separation strategy should be adopted to alleviate the competitive ecological factor resource market. The Henan, Sichuan and Shaanxi regions are adjacent to each other, and their provincial development always receives challenges and contrasts from neighboring provinces, which is very likely to cause mutual competition for superior resources. Finally, the ecological niche synergy strategy should be adopted to acquire more resources so that they can occupy the leading position in the synergistic development of the regional provincial settlement economic belt.
5. Discussion
5.1. Discussion about the Provincial Ecological Niche Breadth
From the whole view, the characteristics of the provincial ecological niche breadth in the Yellow River Basin are: (1) The ecological niche of most provinces is below the average level (0.15118) in 2005–2019, the provincial ecological niche breadth values of Qinghai and Gansu are significantly different from the average and the ecological niche breadth of Shandong province is significantly ahead of that of other provinces. (2) The polarization of the provincial ecological niche breadth is obvious, and the gap between Shandong and Gansu, which are located at the two ends, is large, with the ecological niche breadth of Shandong reaching 0.17114 in 2015–2019, while that of Gansu is only 0.11927, with an extreme ratio of 43.49%. (3) The provincial ecological niche breadth in the Yellow River Basin is uneven, with an overall pattern of “low in the upstream, high in the downstream”, but the unevenness is slightly weakened from 2005 to 2019, with a ratio of 52.11% in 2005–2009, 45.20% in 2010–2014 and 43.49% in 2015–2019.
From each stage view, the differentiation of the provincial ecological niche breadth in the Yellow River Basin from 2005 to 2009 is significant, and the position of each province on the regional ecological factor resource gradient is more dispersed. The ranking of the ecological niche breadth was: Shandong, Henan, Shaanxi, Sichuan, Shanxi, Inner Mongolia, Qinghai, Ningxia and Gansu, in order. From 2009 to 2014, the ecological niche breadth turned to balanced development, and the gap between provinces narrowed. The ranking of the ecological niche breadth was: Shandong, Henan, Shaanxi, Sichuan, Inner Mongolia, Shanxi, Ningxia, Qinghai and Gansu, in order. From 2015 to 2019, the gap between provinces in the Yellow River Basin was further narrowed, and the ranking was: Shandong, Henan, Sichuan, Shaanxi, Inner Mongolia, Shanxi, Ningxia, Qinghai and Gansu, in order.
5.2. Discussion about Provincial Ecological Niche Overlaps
The range of provincial ecological niche overlaps from 2005 to 2009 was (0.82520, 0.98172), with the mean of 0.92905, and there were 20 groups with overlap degrees greater than the mean. At this stage, the comprehensive overlap is ranked as follows: Shanxi, Inner Mongolia, Shaanxi, Sichuan, Henan, Gansu, Ningxia and Shandong, and those above the mean value (0.56056) are Inner Mongolia, Gansu, Shaanxi, Shanxi, Henan and Sichuan, indicating that the ecological niche of these six provinces is in the state of “largely overlapping”. That means the provincial development is more competitive. On the contrary, the Qinghai, Ningxia and Shandong provinces have a lower-than-average ecological niche overlap, with a state of “smally overlap”, and the degree of competition in provincial development is relatively moderate.
From 2010 to 2014, the overlap of provincial ecological niches ranged from 0.83737 to 0.98961, with a mean of 0.93785, and there were 22 groups whose overlaps were greater than the mean, which is an increase compared with the first stage, indicating that the rapid development of provincial regions is accompanied by increased competition for resource occupation. The rank of the comprehensive overlap in this stage is: Shanxi, Ningxia, Sichuan, Inner Mongolia, Henan, Shaanxi, Gansu and Shandong. The overlap degree in Shanxi, Inner Mongolia and Sichuan is higher than the average level (0.60437) in three stages, indicating that there is a greater occupation of similar resources between these provinces and other provinces, so the plans of such provinces need to pay attention to their own differentiated development and avoid homogeneous competition.
The range of provincial ecological niche overlap in 2015–2019 was (0.84054, 0.98562), with a mean of 0.93544, and there are 19 groups that are greater than the mean, which is alleviated to the second stage. The rank of the comprehensive overlap degree in this stage is: Shanxi, Ningxia, Inner Mongolia, Henan, Shaanxi, Sichuan, Shandong and Gansu. Compared with the first two stages, the small degree of comprehensive competition of provincial ecological niches in the third stage indicates that the provincial development may produce a hierarchical differentiation. The strong provinces develop rapidly due to the continuous acquisition and utilization of resources, while the weak provinces develop slowly due to the weak access. The shortcomings are gradually exposed in the fierce competition with the appearance of the overall “Matthew Effect”.
5.3. Discussion about the Provincial Ecological Niche Suitability
The ecological suitability characteristics of the Yellow River Basin are as follows: (1) From 2005 to 2019, the ecological suitability of each province is in an increasing trend—the average value is 0.53320 from 2005 to 2009, 0.56657 from 2010 to 2014 and 0.62668 from 2015 to 2019. This indicates that the Yellow River Basin provinces are on a benign development track. (2) The degree of polarization is obvious, and the gap between Shandong and Shanxi, which are located at the two ends, was large in 2005–2009, with the former being 1.22 times larger than the latter. In 2010–2014 and 2015–2019, the number became 1.18 and 1.33. (3) The ecological suitability of the Yellow River Basin shows an unbalanced development, with a pattern of “low in the upper reaches and high in the lower reaches”. The degree of imbalance fluctuated from 2005 to 2019, contracting in the second stage and rebounding in the third stage. In order to visualize the change, we used ArcGIS10.2 to map the three-stage spatial pattern of ecological suitability in the Yellow River Basin (Figure 8).
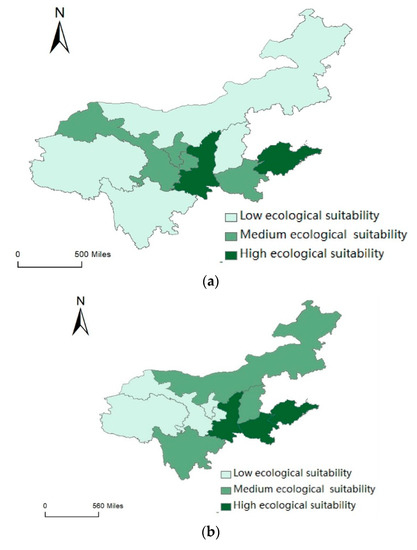
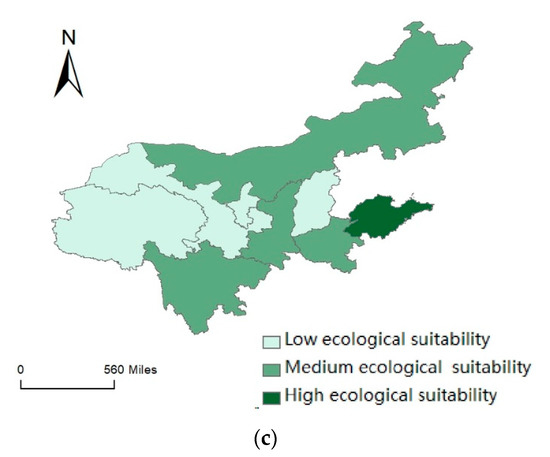
Figure 8.
(a) Spatial pattern of suitability of ecological niches in the Yellow River Basin provinces from 2005 to 2009. (b) Spatial pattern of ecological niche suitability in the Yellow River Basin provinces from 2010 to 2014. (c) Spatial pattern of suitability of ecological niches in the Yellow River Basin provinces, 2015–2019.
It can be seen that the spatial pattern of ecological suitability in the Yellow River Basin evolves over time, with the characteristics of “overall homogeneity, local variation”. Shandong and Qinghai have not changed significantly. Shandong’s economic operation is generally stable and shows structural optimization and quality improvement, and its development potential is accumulating. Qinghai’s location advantage is inferior to that of Shaanxi and Gansu, and its socio-economic development is difficult to leverage on the ecological environment, with insufficient endogenous power for economic growth and a lack of innovation capacity, resulting in its provincial ecological suitability stagnating at a low level. The remaining seven provinces have all experienced varying degrees of change in their ecological suitability levels.
5.4. Contributions and Limitations
5.4.1. Contributions
Compared with the existing studies, the possible marginal contributions of this paper are: (1) applying the idea of fitting optimization to guide the construction of a provincial ecological status indicator system, applying the validation analysis in the SEM model to test the suitability and validity of the provincial ecological status indicator system and improving the scientificity and objectivity of the indicator system construction. (2) Correlating the measurement model with the connotation (state–relationship–function) of the provincial ecological niche, enriching the perspective of ecological niche research and improving the theoretical support for the construction of a multidimensional measurement model. (3) The spatial positioning of provincial ecological niches to improve the relevance and effectiveness of strategies.
5.4.2. Limitations
This paper improved the scientificity of the construction of the ecological niche index system, but the Yellow River Basin spans three regions in China, and the applicability on different regions still needs to be refined. In addition, the provincial ecological niche subspaces constructed in this paper were not all occupied in the spatial positioning. Whether there is a more suitable method for the construction of a provincial ecological niche space is worth being further explored.
6. Conclusions
This paper measured the multidimensional provincial ecological niches of the Yellow River Basin and proposed strategies to improve the ecological niches according to the differentiated characteristics of the ecological niches of each province.
(1) Ecological niche is a concept with a rich connotation and wide application, the measurement of ecological niche in socio-economics needs to build a scientific and reasonable multi-dimensional index system and SEM can play an important role in the process of index screening and index system construction.
(2) The provincial ecological niche breadths in the Yellow River Basin are clearly differentiated at two levels, showing a pattern of “low in the upper reaches and high in the lower reaches”, but the unevenness is slightly weakened; the provincial ecological niche overlaps gradually form a hierarchical differentiation from synchronous competition to stage III, which gradually shows the “Matthew effect”. Provincial ecological suitability is in an increasing trend, and Shandong is significantly ahead of other provinces.
(3) Qinghai and Gansu belong to I; it is appropriate to choose the eco-location specialization strategy, potential ecological niche strategy and ecological niche synergy strategy. Shanxi, Inner Mongolia and Ningxia belong to subspace III, and it is appropriate to choose the ecological niche specialization strategy, eco-location separation strategy, potential eco-location strategy and ecological niche synergy strategy. Shandong belongs to subspace VI; it is advisable to choose the ecological niche generalization strategy and ecological niche synergy strategy. Henan, Sichuan and Shaanxi belong to subspace VIII, and it is appropriate to choose the ecological niche generalization strategy, ecological niche separation strategy and ecological niche synergy strategy.
Author Contributions
Conceptualization, Y.W.; methodology, S.Y.; software, S.Y.; formal analysis, S.Y.; investigation, S.Y. and Y.L.; data curation, S.Y.; writing—original draft preparation, S.Y. and Y.L.; writing—review and editing, S.Y.; visualization, Y.L.; supervision, Y.W. All authors have read and agreed to the published version of the manuscript.
Funding
Annual Project of National Social Science Foundation of China: “Research on Ecological Security Assessment, Early Warning and Realization Mechanism of Yellow River Basin in New Development Stage” (21BJY169).
Informed Consent Statement
Informed consent was obtained from all subjects involved in the study.
Data Availability Statement
Not applicable.
Acknowledgments
The authors gratefully acknowledge the financial support of the National Office for Philosophy and Social Sciences and all the authors of all references. Without your help, we would not have finished the paper. Thank you!
Conflicts of Interest
The funders had no role in the design of the study; in the collection, analyses or interpretation of the data; in the writing of the manuscript; or in the decision to publish the results.
References
- Johnson, R.H. Determinate Evolution in the Color-Pattern of the Lady-Beetles; Carnegie Institution of Washington: Washington, DC, USA, 1910. [Google Scholar]
- Rodríguez, B.E.G.; Guevara, R.; Angulo, D.F.; Ruiz Domínguez, C.R.; Sosa, V. Ecological niches, endemism and conservation of the species in Selenicereus (Hylocereeae, Cactaceae). Braz. J. Bot. 2022, 45, 2205–2225. [Google Scholar]
- Grinnell, J. The niche-relationships of the California Thrasher. Auk 1917, 34, 427–433. [Google Scholar] [CrossRef]
- Grinnell, J. Geography and evolution. Ecology 1924, 5, 225–229. [Google Scholar] [CrossRef]
- Elton, C.S. Animal Ecology; University of Chicago Press: Chicago, IL, USA, 2001. [Google Scholar]
- Hutchinson, G.E. Some Concluding Remarks. Cold Spring Harb. Symp. Quant. Biol. 1957, 22, 415–427. [Google Scholar] [CrossRef]
- Wang, G.; Zhao, S.-L.; Zhang, P.-Y.; Chen, Q.-C. A study on the definition of ecological niche and the improvement of ecological niche overlap measurement formula. J. Ecol. 1984, 2, 119–127. [Google Scholar]
- Yang, X.W.; Ma, J.S. A review of the definition and formulae for calculating ecological niches. J. Ecol. 1992, 2, 46–51+37. [Google Scholar]
- Peng, W.J.; Wang, X.M. The development of the concept and connotation of ecological niche and its positioning in ecology. J. Appl. Ecol. 2016, 27, 327–334. [Google Scholar]
- Chunquan, Z. Ecological niche posture theory and expansion hypothesis. J. Ecol. 1997, 3, 324–332. [Google Scholar]
- Jin, X.; Guo, Y. Study on the ecological position measurement of high-quality development of manufacturing industry in the Yellow River Basin. Ecol. Econ. 2020, 36, 50–55. [Google Scholar]
- Nie, X.; Shi, P. Research on the competing relationship of county cities in Hexi Corridor based on ecological niche theory. J. Ecol. 2018, 38, 841–851. [Google Scholar]
- Hu, C.; Xiao, L. Application of ecological niche theory and methods in urban research. Geogr. Res. Dev. 2004, 2, 13–16. [Google Scholar]
- Suo, G. Research on the evaluation of ecological position of cities in the Bohai Sea Economic Circle. Ecol. Econ. 2010, 2, 138–140. [Google Scholar]
- Xu, Z.; Zhang, J. Study on the spatial functional competitiveness of Beijing-Tianjin-Hebei urban agglomeration based on ecological position. China Agric. Resour. Zoning 2018, 39, 167–175. [Google Scholar]
- Guan, J.; Xu, X. A study on the measurement of industrial ecological position in the formation of competitive relationship between industrial sectors in input-output network. China Popul. -Resour. Environ. 2017, 27, 191–194. [Google Scholar]
- Li, J.; Yuan, W. Urban cultural industry eco-location measurement and spatial network effect. Econ. Geogr. 2018, 38, 116–123. [Google Scholar]
- Tang, L. Research on the competition of tourism cities in Fujian Province based on ecological position theory. J. Cent. South Univ. For. Sci. Technol. 2017, 37, 189–194. [Google Scholar]
- Pu, X.; Xue, D. Study on the spatial pattern of tourism cities in Guan Zhong region based on tourism eco-location measurement. Arid. Zone Resour. Environ. 2014, 28, 189–194. [Google Scholar]
- Peng, Y.; Yan, L. Competitive development strategies of tourist cities in Zhejiang Province based on ecological niche theory. J. Ecol. 2015, 35, 2195–2205. [Google Scholar]
- Fang, X.; Li, J.H. Research on the principle and model of corporate ecological niche. China Soft Sci. 2005, 5, 130–139. [Google Scholar]
- Guo, Y.; Xu, X. A review of corporate eco-location research: Concept, measurement and strategic application. Ind. Econ. Rev. 2009, 8, 105–119. [Google Scholar]
- Cheng, Y.; Zhao, G. The ecological position measurement system of corporate culture: Scale development and base model construction. Res. Manag. 2021, 42, 35–45. [Google Scholar]
- Wang, J.; Song, P. A model for evaluating ecological niches of social-economic-natural composite ecosystems--Sichuan as an example. J. Ecol. 2016, 36, 6628–6635. [Google Scholar]
- Huang, H.; Xiao, Y. Evaluation of ecological status of social-economic-natural composite ecosystem in Chengdu-Chongqing urban agglomeration. Soft Sci. 2018, 32, 113–117. [Google Scholar]
- Liu, V.; Zhang, J. Research on regional innovation ecosystem health evaluation based on improved ecological niche suitability model. Sci. Technol. Manag. Res. 2019, 39, 1–10. [Google Scholar]
- Bian, W.; Liu, W. Research on the method of measuring the ecological position of the population of science and technology entrepreneurial enterprises. Sci. Technol. Manag. 2014, 35, 148–157. [Google Scholar]
- Wu, Y.; Li, Y. Measurement of ecological urbanization level in the Yellow River Basin. Environ. Sci. Technol. 2020, 43, 224–236. [Google Scholar]
- Lorenzo, D.D.P. Assessing the Effectiveness of Correlative Ecological Niche Model Temporal Projection through Floristic Data. Biology 2022, 11, 1219. [Google Scholar]
- Sun, C.; Li, L.; Dong, X.; Qin, F.; Yang, Z. Variations and Factors Characterizing Ecological Niches of Understory Herbaceous Species in Plantation Forests. Sustainability 2022, 14, 10719. [Google Scholar] [CrossRef]
- Pratap, S.S.; Ankita, M.; Bhanu, K.; Dibyendu, A.; Sharad, S.; Kanta, B.S. Identification of potential cultivation areas for centelloside-specific elite chemotypes of Centella asiatica (L.) using ecological niche modeling. Ind. Crops Prod. 2022, 188, 115657. [Google Scholar]
- Lislie, S.; Mayumi, V.; Monserrat, V.; Ernesto, S.M. Ecological niche modeling of interactions in a buzz-pollinated invasive weed. Glob. Ecol. Conserv. 2022, 39, e02279. [Google Scholar]
Publisher’s Note: MDPI stays neutral with regard to jurisdictional claims in published maps and institutional affiliations. |
© 2022 by the authors. Licensee MDPI, Basel, Switzerland. This article is an open access article distributed under the terms and conditions of the Creative Commons Attribution (CC BY) license (https://creativecommons.org/licenses/by/4.0/).