Article

Assessment of Soil Physical Quality and Water Flow Regulation under Straw Removal Management in Sugarcane Production Fields

by
Martha Lustosa Carvalho
1,*,
Felipe Bonini da Luz
1,
Renato Paiva de Lima
1,
Karina Maria Vieira Cavalieri-Polizeli
2,
João Luís Nunes Carvalho
3 and
Maurício Roberto Cherubin
1,*
1
Department of Soil Science, “Luiz de Queiroz” College of Agriculture, University of São Paulo, Piracicaba 13418-900, Brazil
2
Department of Soils and Agricultural Engineering, Federal University of Paraná, Curitiba 80035-050, Brazil
3
Brazilian Biorenewables National Laboratory (LNBR), Brazilian Center for Research in Energy and Materials (CNPEM), Campinas 13083-100, Brazil
*
Authors to whom correspondence should be addressed.
Sustainability 2022, 14(2), 841; https://doi.org/10.3390/su14020841
Submission received: 14 December 2021 / Revised: 4 January 2022 / Accepted: 7 January 2022 / Published: 12 January 2022
(This article belongs to the Special Issue Soil Quality and Soil Management)

Abstract

:
Removing sugarcane straw to increase bioenergy production can generate significant income to the industry. However, straw contributes to the regulation of soil functions and consequently supports the provision of ecosystem services, such as water flow regulation. Thus, straw removal may hinder the provision of these services, especially in mechanized sugarcane production systems, which have soil compaction problems due to machinery traffic. In this study, we assess a six-year experiment in Brazil with four rates of straw removal: 0 Mg ha−1 (TR), 5 Mg ha−1 (HR), 10 Mg ha−1 (LR), and 15 Mg ha−1 (NR) remaining straw. Using attributes, such as soil bulk density, porosity, water infiltration, runoff, saturated hydraulic conductivity and available water-holding capacity, as indicators of key soil functions, we calculated a soil-related ecosystem service (ES) index for water flow regulation provision. The ES index revealed that water flow regulation was low regardless of the straw management (0.56, 0.63, 0.64 and 0.60 for TR, HR, LR and NR, respectively). It can be a consequence of soil compaction caused by machinery traffic throughout the successive cycle, whose straw was unable to mitigate this issue. Thus, by the end of the sugarcane cycle (sixth ratoon), straw removal had little effect on soil physical and hydraulic indicators, and consequently had little impact on the provision of the soil-related ES associated with water flow regulation. Nevertheless, straw management should be planned to consider other functions and soil-related ES benefited by straw retention.

1. Introduction

The impacts of worldwide logistic mishaps on energy production and distribution are felt across all other sectors of economic activity. Therefore, local, reliable, and renewable potential sources of energy, such as crop residue, are of great interest to the industry that directly produces them and to consumers in general [1,2]. In the global ethanol industry, sugarcane (Saccharum spp.) is one of the main crops, which produces an abundant amount of crop residue commonly denominated as “sugarcane straw” [3]. The high availability of sugarcane straw is a result of the transition from a manual burnt-cane system to a mechanized green-cane system in high-yield sugarcane systems worldwide. Mechanized harvesting results in the addition of 10–20 Mg ha−1 year−1 of straw over the soil [4,5,6], which corresponds to one-third of the total energy potential of the crop [7]. Therefore, in addition to the benefits to human health and the environment, the transition to mechanized harvesting creates the possibility of using crop residues as feedstock for the production of cellulosic ethanol [8], other biomaterials [9], or as fuel to increase cogeneration of electricity [9,10,11,12], which can be economically positive for mills [13,14].
Although it is a market opportunity, the trade-offs associated with sugarcane straw removal from the field cannot be neglected. Recent studies indicate that indiscriminate straw removal for bioenergy production can cause a series of negative effects on soil functions [5,10,15,16]. Many deleterious effects on the soil functions are related to the reduction in physical quality caused by machinery traffic [17,18,19,20], which can reduce the capacity of the soil to adequately provide soil-related ecosystem services, such as water flow regulation. In addition, mostly sugarcane management keeps soil without crop rotation for 5–6 years, which does not provide the root diversification that is very important for soil structuring and functioning [21,22]. Under high straw removal management, the deterioration of the soil structure by compaction as a result of machinery traffic reduces the size, continuity, and functionality of the pores, and consequently negatively impacts the water flow in the soil [17]. Increasing surface sealing [23] and reducing soil porosity, water infiltration is restricted, runoff increases, and, consequently, decreases soil water retention [24]. Water availability to the crop is then affected, which can be a serious problem for sugarcane, a semi-perennial crop that is subject to several periods of water deficit during its cultivation cycle. Ultimately, several studies have indicated that water deficit along the crop cycle is one of the main causes of the yield losses in sugarcane fields [25,26,27].
Reconciling the industrial and agri-environmental applications of sugarcane straw, therefore, implies identifying the amount of straw that can be removed from the field for the production of bioenergy without compromising the capacity of the soil to provide ecosystem services, such as water flow regulation. Some recent short-term studies have indicated that the amount of straw required to fully cover the soil surface is ~7 Mg ha−1 [28] and that keeping up to 10 Mg ha−1 of straw on the soil surface is sufficient to sustain productivity levels [6,29] and prevent soil structural degradation [17,18]. Thus, in areas with a high productive potential that result in a large amount of straw left on the soil surface, the removal of this surplus to generate bioenergy may be a viable alternative. However, the intensity of the changes catalyzed by the management of straw removal is specific to the situations evaluated [11]. Therefore, it is still necessary to understand how the mechanisms of water regulation are affected by the removal of straw to develop appropriate management recommendations. Modifications in soil functions correlated with straw removal can be monitored using soil parameters used as indicators/proxies related to the soil structure, since the physical degradation mechanisms are strongly linked to the soil structure [30]. By this approach, it is possible to correlate the indicators with soil functions, and finally infer about services provided by the soil, e.g., water flow regulation [30,31,32], as outlined in Figure 1.
To determine whether straw removal is a suitable strategy to increase energy output without compromising the sustainability of sugarcane crop, we hypothesize that the indiscriminate removal of sugarcane straw from the soil surface would catalyze soil physical degradation caused by machinery traffic and reduce the soil’s capacity to regulate water flow. To test this hypothesis, we assess a six-year field experiment in southeastern Brazil to determine the effect of straw removal on soil physical and hydraulic properties, and then, in the capacity of the soil to provide the water flow regulation service.

2. Materials and Methods

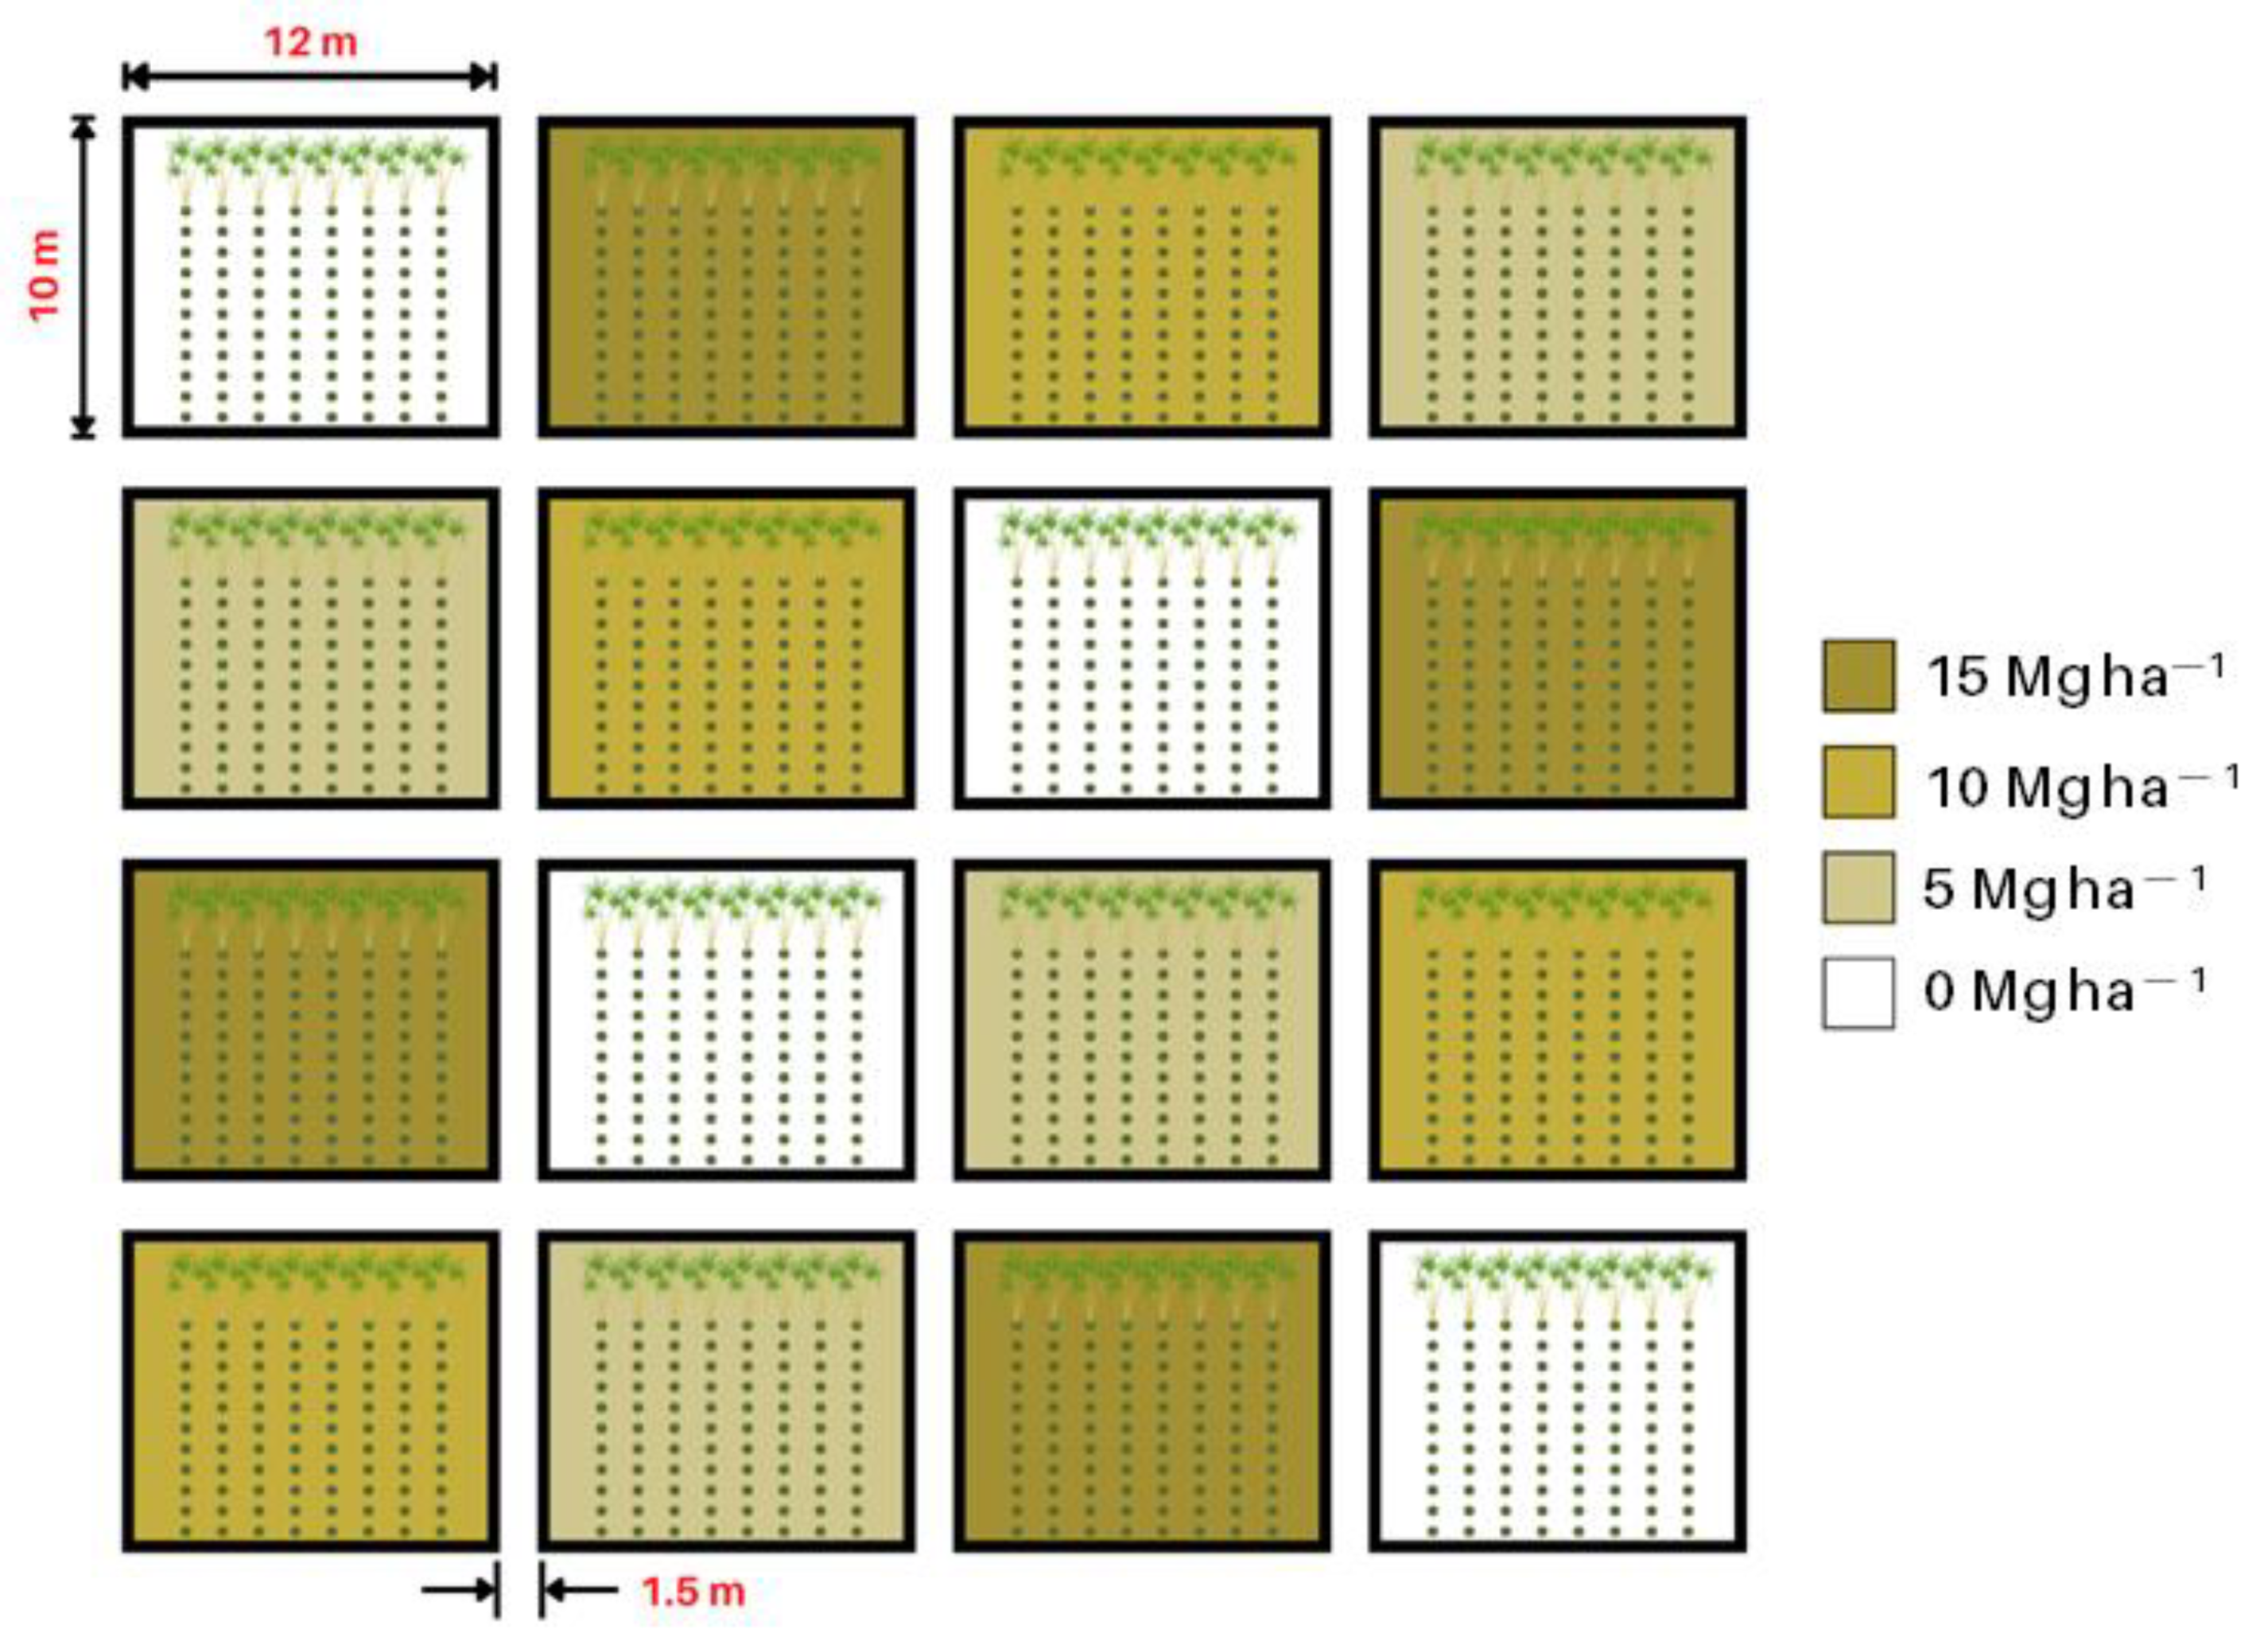
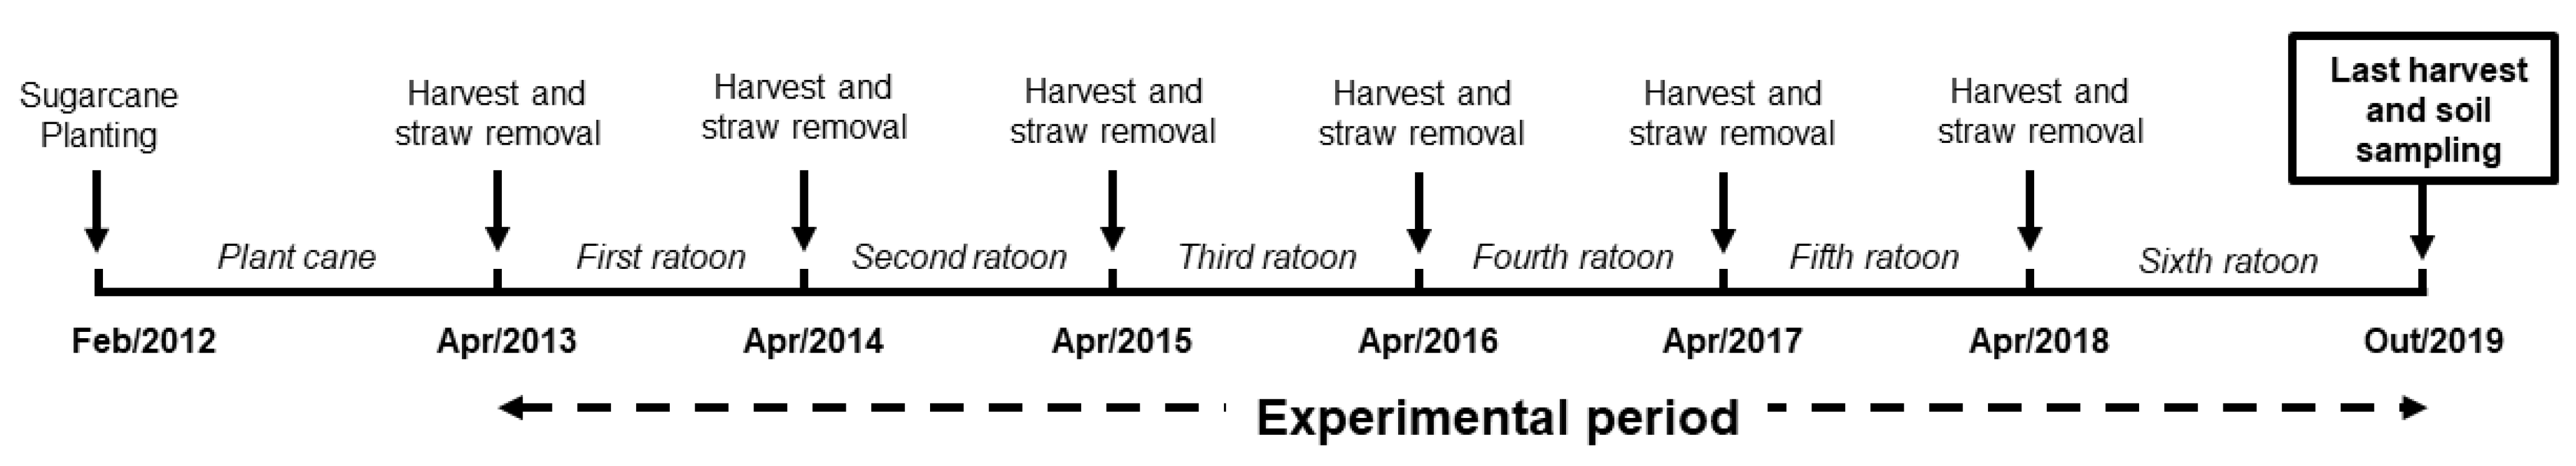
2.1. Study Area and Original Experiment

A field experiment of sugarcane straw removal was established in a sugarcane plantation in the Iracemápolis municipality (22°36′ S–47°34′ W), in the São Paulo state, the largest sugarcane producing region in Brazil. The selected area has been cultivated with sugarcane for over 50 years and has a history of frequent applications of organic residues, such as vinasse and filter cake, and the harvesting system has been mechanized and unburnt for approximately 15 years. The area has an altitude of 613 m above sea level, a mean annual rainfall of 1420 mm, a mean annual temperature of 20.4 °C, and the climate type, following Köppen’s climate classification, is Cwa (humid subtropical with dry winter) [33]. The soil of the area is classified as an Oxisol (Rhodic Eutrudox) [34], with 584, 597, and 626 g kg−1 of clay content in the 0.0–0.1 m, 0.1–0.2 m, and 0.2–0.4 m soil layers, respectively. The soil chemical and physical characterization was conducted before the experiment installation and can be found in the “Clayey 2” column in “Table 1” of Castioni et al. [18].
The field experiment was installed in April 2013 in a randomized block design with 4 treatments and 4 repetitions, 16 experimental plots in total. Each plot had 10 m × 12 m, with eight sugarcane rows at a 1.5 m spacing (Figure 2). After each harvest, the straw left on the field was quantified by a 0.25 m² metallic frame randomly thrown ten times. Straw moisture measurements were taken in the field using a hay moisture meter with a coupled electrode. After quantifying the straw dry mass, the four straw removal rates (i.e., the treatments) were established: total removal (TR—0 Mg ha−1), high removal (HR– maintenance of 5 Mg ha−1 in the field), low removal (LR—maintenance of 10 Mg ha−1 in the field), and no removal (NR—maintenance of 15 Mg ha−1 in the field). The correct amount of dry straw deposited within each plot was adjusted manually, with rakes and forks. This procedure, firstly performed after the plant-cane harvest (2013), was repeated after the harvesting of each ratoon (Figure 3).

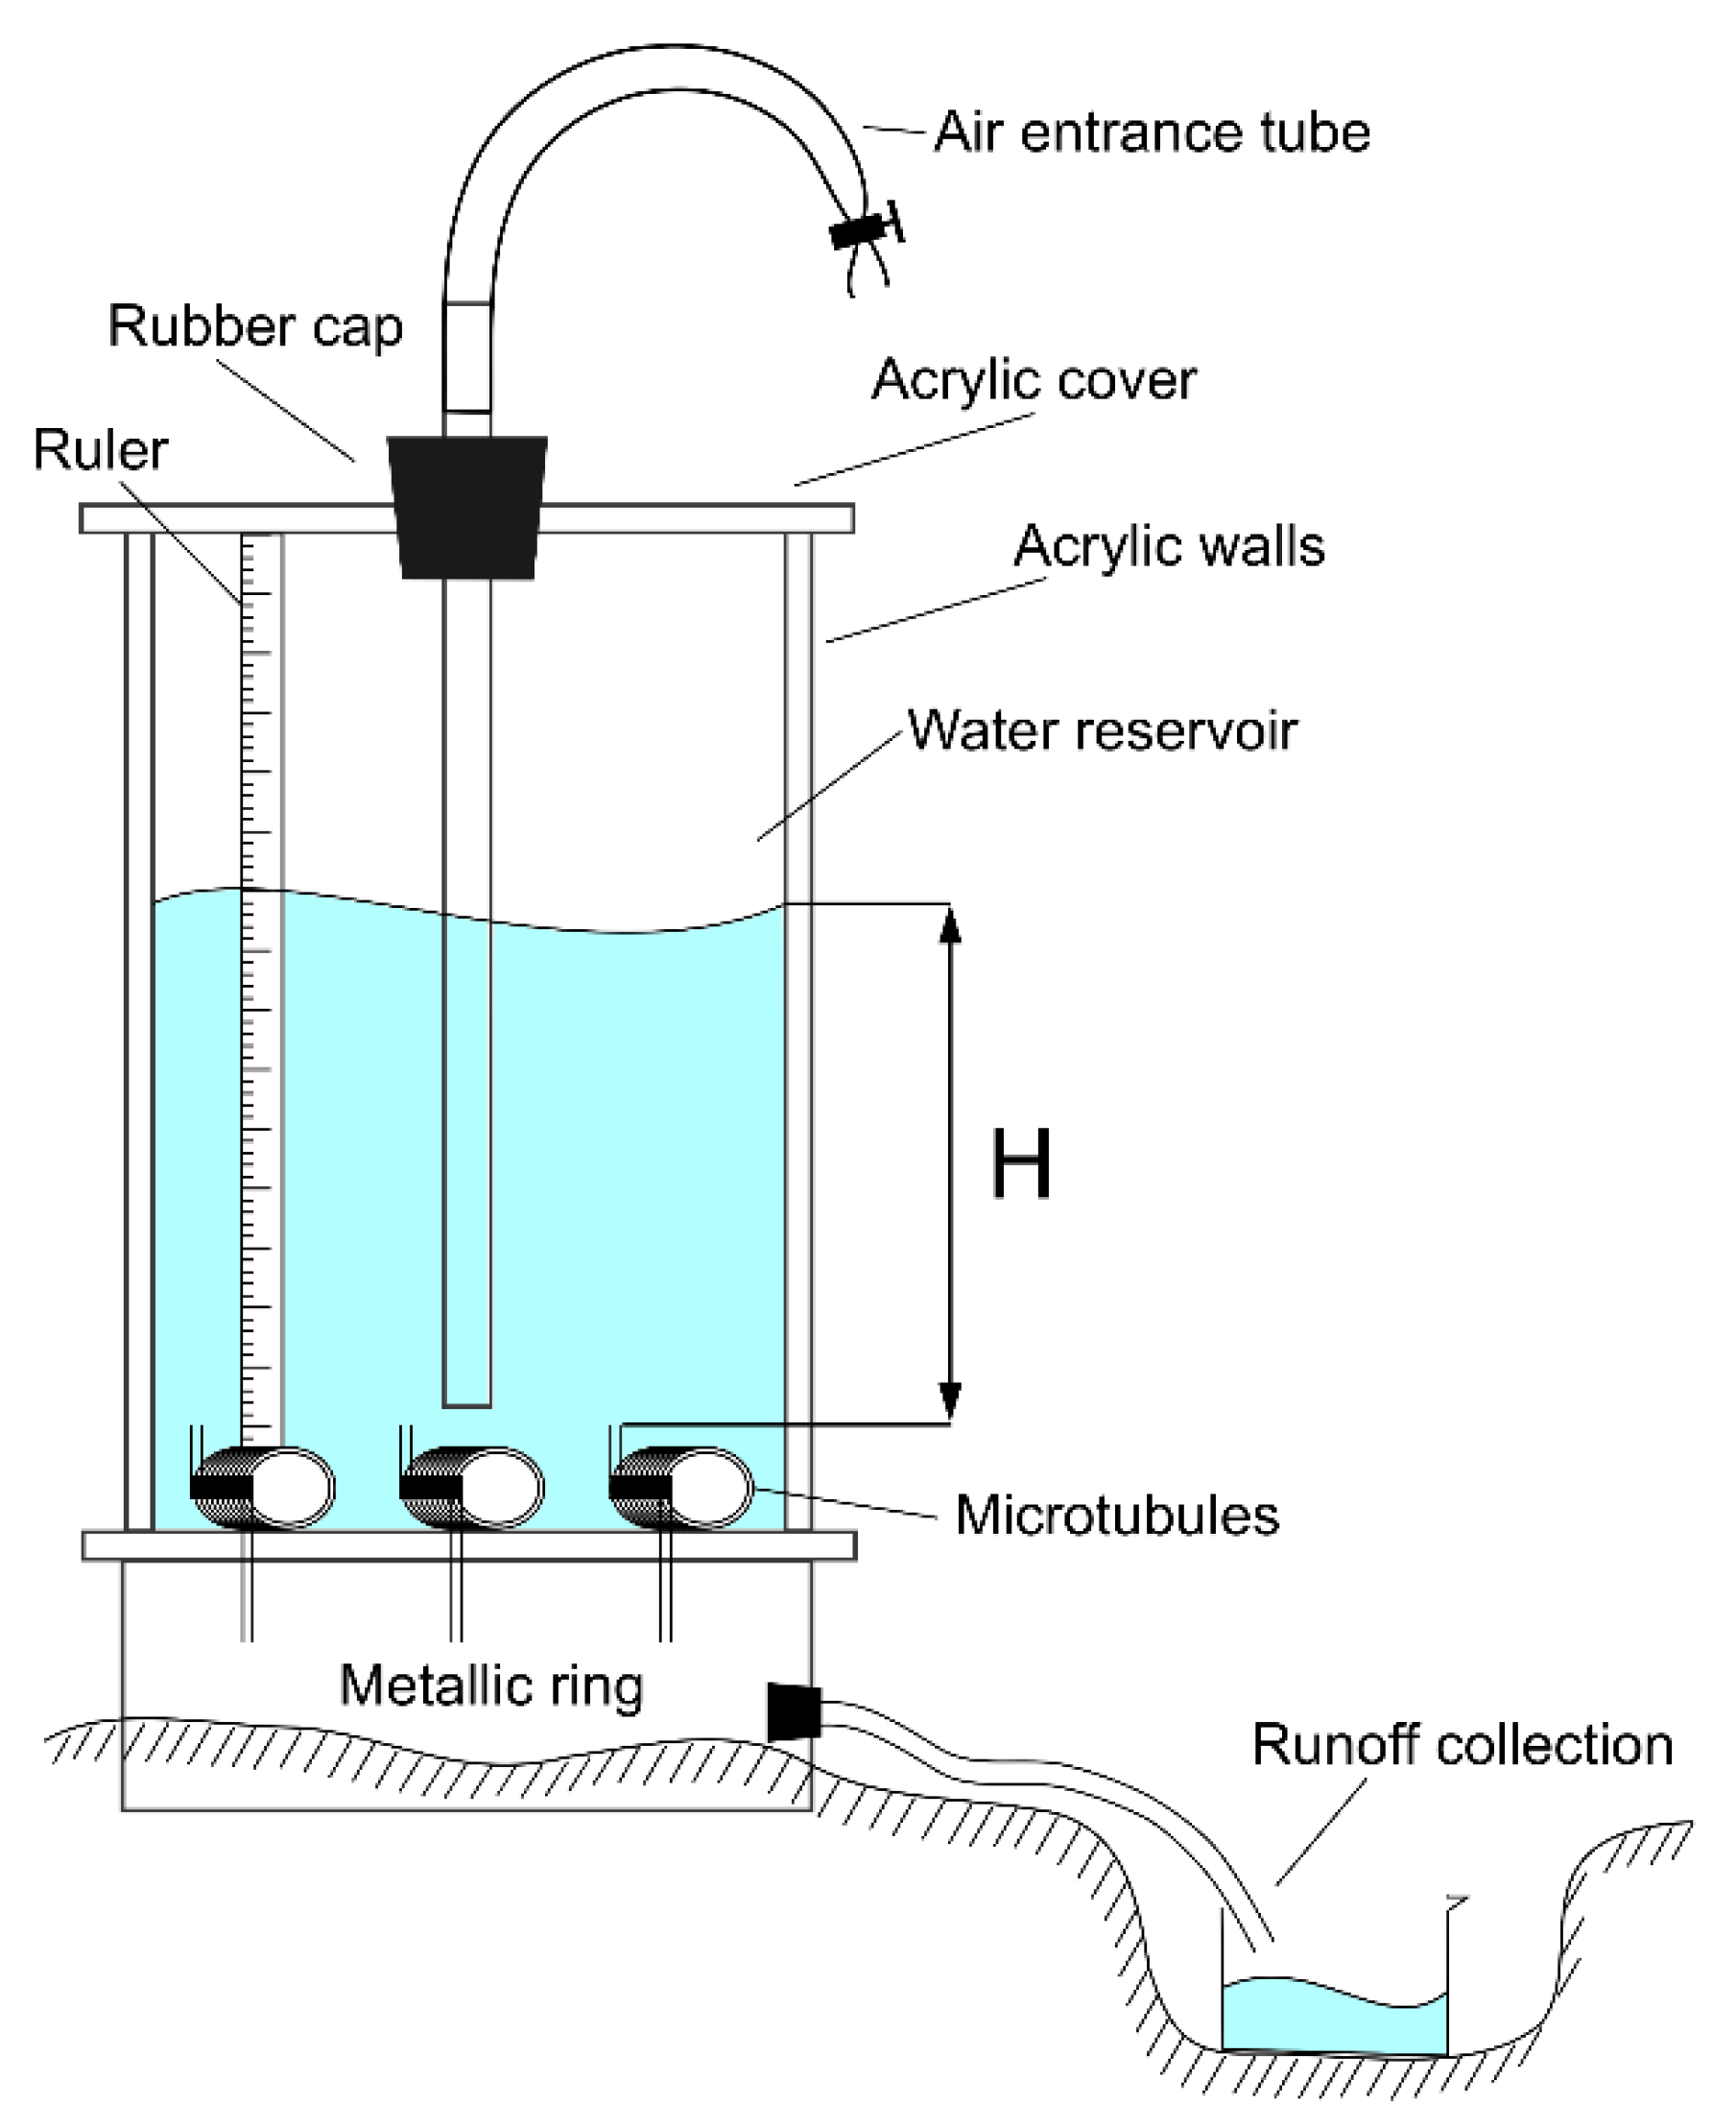
2.2. Field Assessments of Soil Indicators

Infiltration and runoff rates were measured using a Cornell sprinkle infiltrometer [35]. The Cornell infiltrometer is a portable rain simulator (Figure 4) and consists of a transparent acrylic reservoir with an approximate capacity of 20 L, and 69 microtubules measuring 0.063 cm in diameter and 19 cm in length at the bottom. A ruler glued to the inner wall of the reservoir allowed reading the height of the water, which was used for the infiltration calculations, according to the methodology proposed by Ogden et al. [35]. To operate it, the sugarcane straw was removed from the soil surface and the infiltrometer was mounted on a 24 cm diameter metal ring set on the ground and leveled. This ring contains an opening in which a hose was inserted to lead the water resulting from surface runoff to a beaker for measuring the runoff volume. We calibrated the equipment’s rain intensity in a preliminary test, using its air intake regulation system, at an average rain intensity of 300 mm h−1. The high rain intensity was chosen to induce runoff since we expected the soil to have a high infiltration rate due to its microstructure. The readings of water height and runoff volume were taken every 2 minutes, for 40 min, in three repetitions for each treatment (i.e., three out of four plots for each treatment were assessed). The onset of runoff was determined from the outlet of a continuous stream of water from the collecting hose, and the volume collected in a beaker was measured in a graduated cylinder.
The rate of simulated rainfall (r, constant during the experiment) was determined by Equation (1), and the runoff rate (rot) was calculated by Equation (2), according to Ogden et al. [35].
r = (H1H2)/Tf
where: H1 is the water height reading at the beginning of the measurement, in cm; H2 is the water height reading at the end of the measurement, in cm; and Tf is the measurement time interval, in minutes.
rot = Vt/457.3 × t
where: Vt is the volume of the collected water, in mL; 457.3 is the area of the standard ring used, in cm2; and t is the time interval during which the water was collected, in minutes.
The infiltration rate (it) is determined as the difference between the rate of simulated rainfall and the runoff rate (Equation (3)):
it = rrot
The measured infiltration and runoff rates data for each treatment were used to fit infiltration and runoff curves. For infiltration, we fitted a power model as the one proposed by Kostiakov [36]. For runoff, the best fit was achieved as a logistic model. The basic infiltration rate (steady-state infiltration) for each treatment was calculated from the curves as the mean infiltration rate between the 50 to 60 min interval.

2.3. Soil Sampling

We collected soil samples in October 2019, immediately after the harvest of the 6th sugarcane ratoon, during the end of the dry season. From the 0–0.05, 0.05–0.10, 0.10–0.20, and 0.20–0.40 m layers, undisturbed soil samples were collected in volumetric rings (~100 cm3) for the evaluation of soil physical quality indicators in the laboratory (e.g., soil porosity and bulk density). We collected all samples from trenches dug in the middle of the sugarcane inter-row. Data on soil chemical characterization, organic matter, and organic carbon content for these samples can be found in the Supplementary Materials (Table S1) [37].

2.4. Laboratory Assessments of Soil Indicators

2.4.1. Soil Hydraulic Parameters, Porosity, and Bulk Density

The soil samples collected in volumetric cylinders were saturated by capillarity with distilled water and after being weighed. Then, they were subjected to water drainage in the following matric potentials: −6, −10, and −1500 kPa, in pressure plate extractors (Richards chambers). After reaching the hydraulic equilibrium at each potential, the soil samples were weighed, and then, all soil samples were oven-dried at 105 ° C for 72 h, to quantify the mass of the dry soil and determine soil bulk density (BD, Mg m−3), and the volumetric soil water content (m3 m−3). Additionally, soil particle density (PD, Mg m−3) was determined with a gas pycnometer using disturbed soil samples previously oven-dried at 105. The parameters extracted from the measured data were total porosity (TP, m3 m−3), calculated as shown in Equation (4); macroporosity (MaP, m3 m−3), calculated as the difference between soil volumetric water content at saturation and soil volumetric water content at the −6 kPa potential; and microporosity (MiP, m3 m−3), calculated as the soil volumetric water content at the −6 kPa matric potential. Field capacity (FC, water potential at −10 kPa, as by Haise et al. [38]), and the permanent wilting point (PWP, water potential at −1500 kPa, as by Richards and Weaver [39]) were used to calculate the available water-holding capacity (AWC, m3 m−3), as the difference between the water content in FC and PWP (Equation (5)), and the soil water (SWSC) and air (SAC) storage capacity indices, as proposed by Reynolds et al. [40]. The soil water storage capacity (SWSC) is the ratio between water content in FC and TP (Equation (6)), and the SAC index is the ratio between drained pores at the −10 kPa (CAt) potential and TP (Equation (7)).
TP = 1 − (BD/PD)
AWC = FC − PWP
SWSC = FC/TP
SAC = CAt/TP

2.4.2. Soil Saturated Hydraulic Conductivity

Saturated soil hydraulic conductivity (Ks) was determined using a constant head permeameter, with a Mariotte bottle supplying a constant water flow (40 mm in depth) to the rings containing soil samples with the preserved structure. The water that flowed through the cores was collected in recipients and the volume was measured in a graduated cylinder every two minutes. The soil saturated hydraulic conductivity (Ks, measured in cm min−1) was calculated by Equation (8) [41]:
Ks = Q × L/A × (L + h)
where:
Q is the water flow rate, in cm3 min−1; L is the sample’s height, in cm; A is the cross-sectional area of the sample (cm²); h is the constant head of water maintained on the soil surface [41].

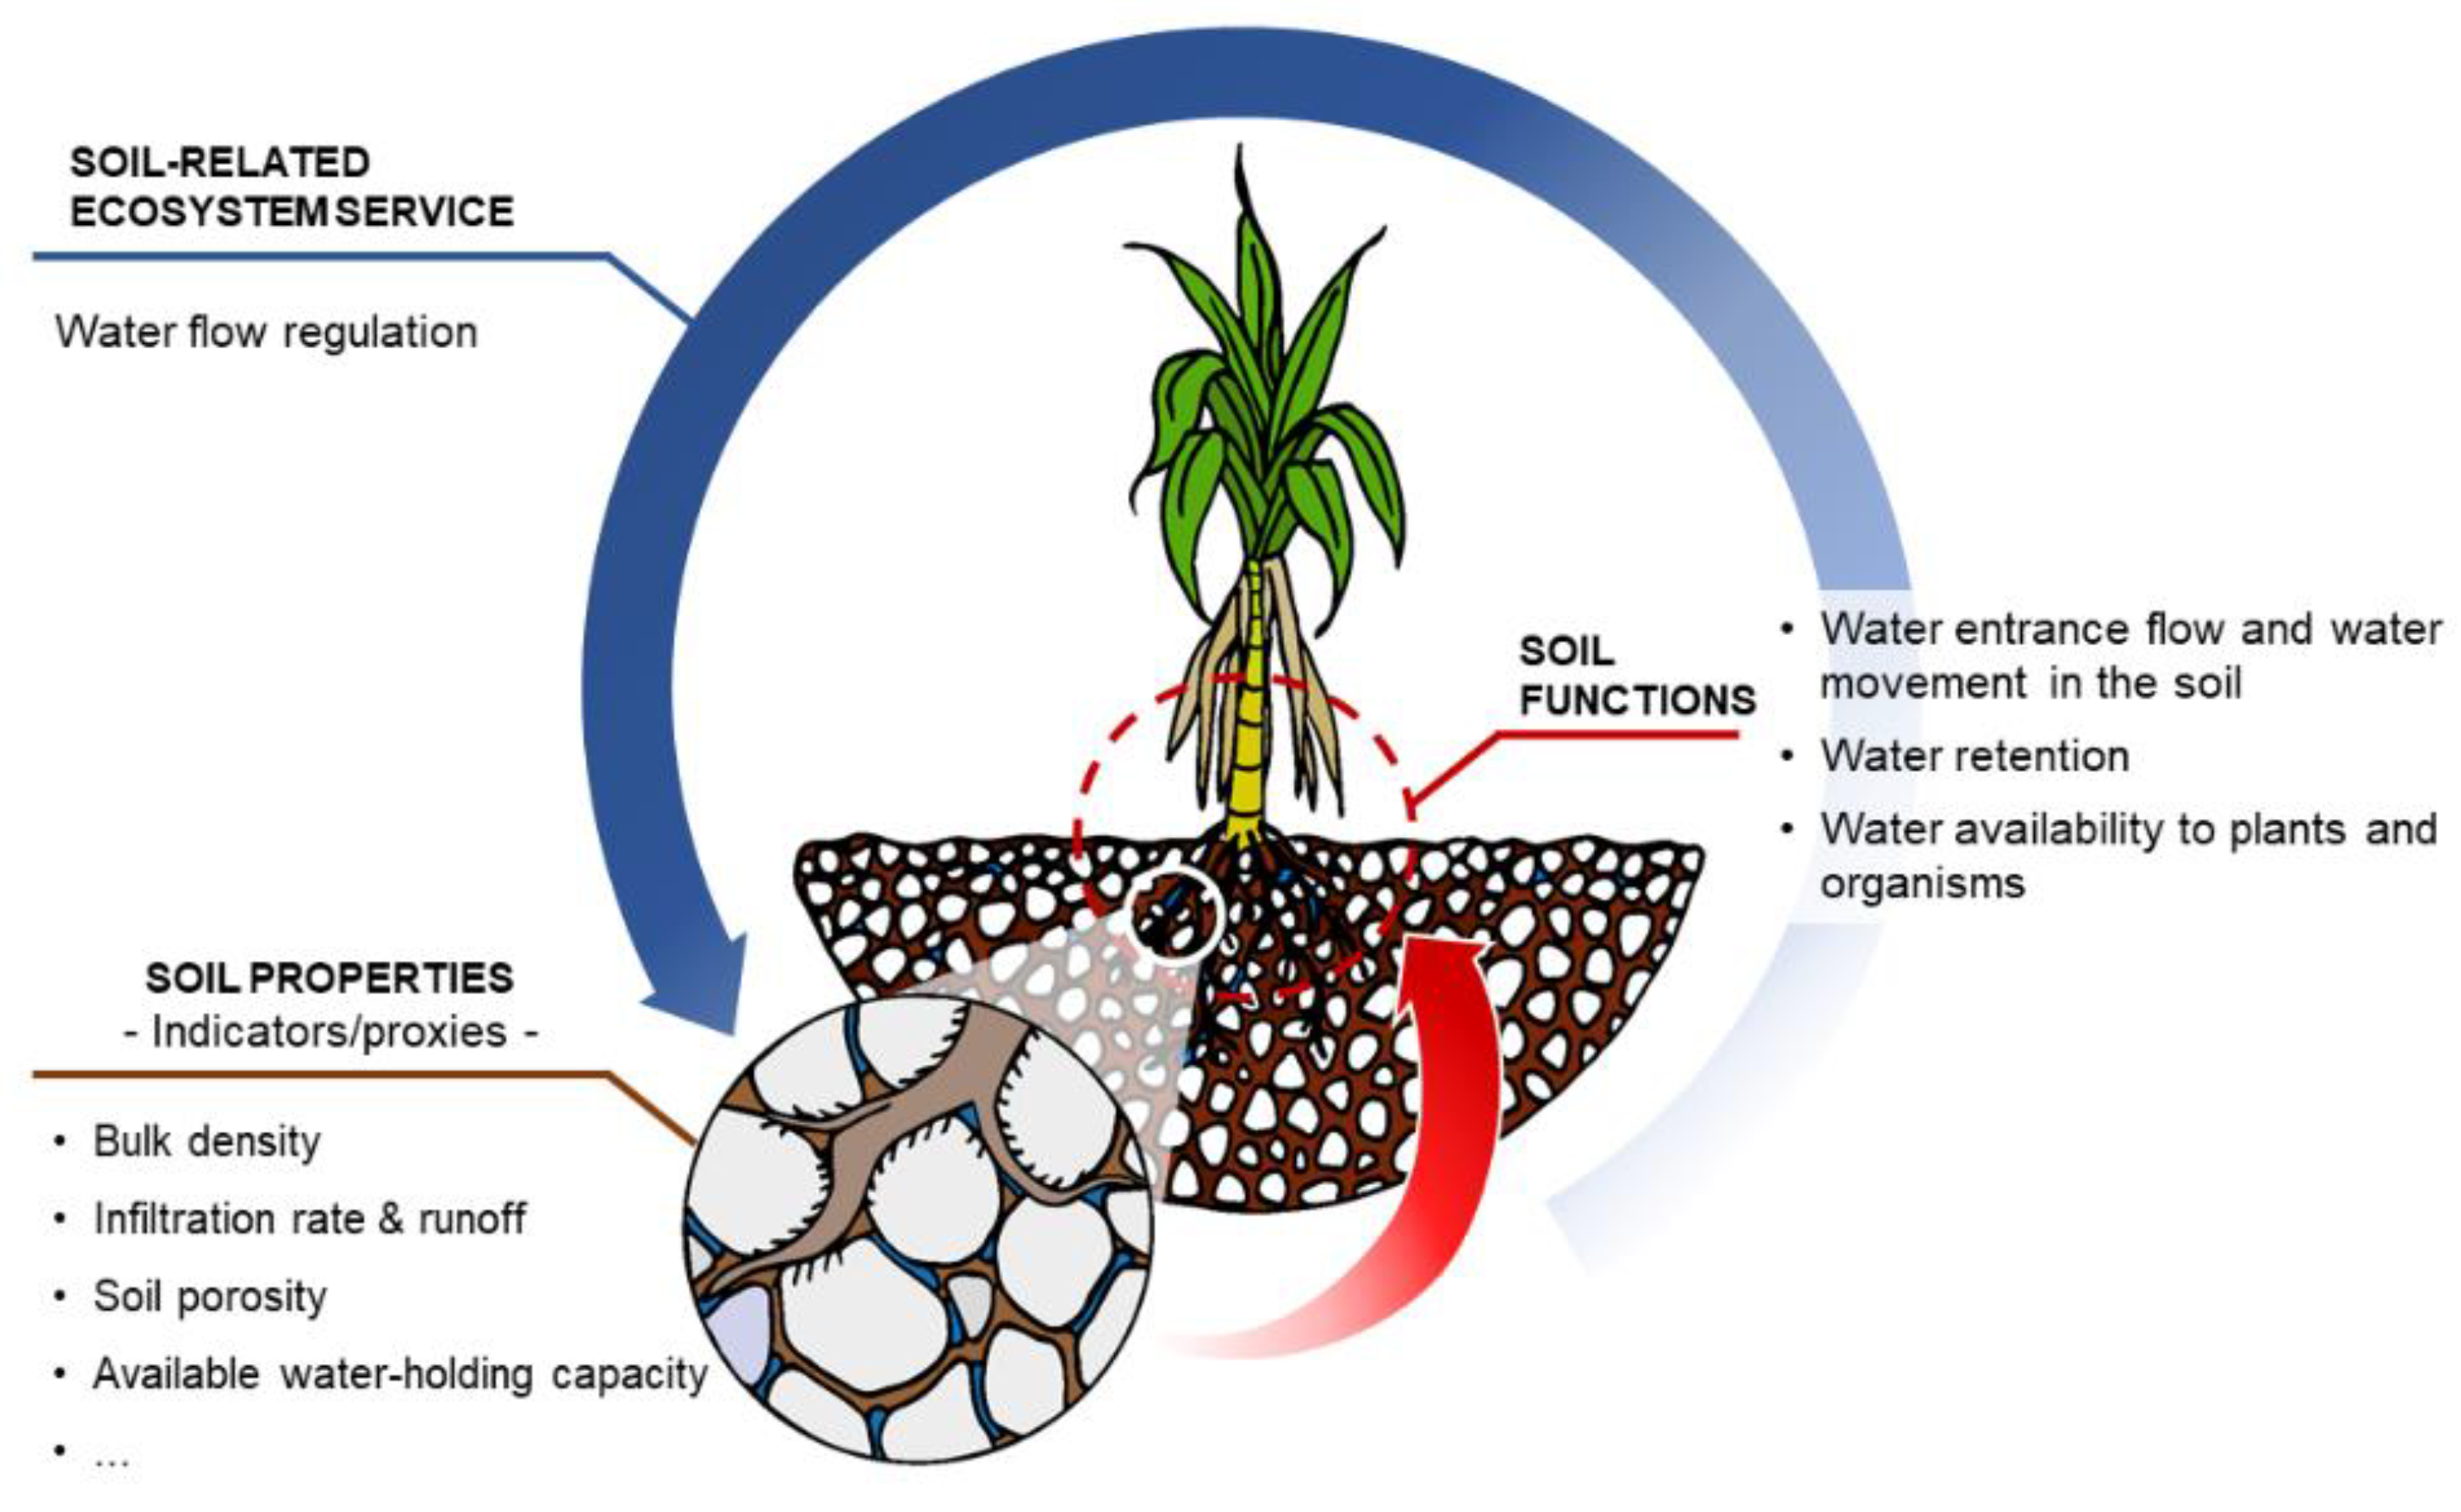
2.5. Soil-Related Ecosystem Service Assessement

The removal of sugarcane straw affects soil water flow regulation since it reduces soil cover, increases surface sealing and runoff, reduces carbon input, depletes resources for the soil food web and decreases soil resilience to physical degradation. For the integrated assessment of the impact of sugarcane straw removal on the physical functions of the soil and the provision of the water flow regulation ecosystem service, we used the methodology proposed by Cherubin et al. [42] to evaluate soil physical quality and expanded by Oliveira et al. [43] to include soil-related ecosystem services. The methodology consisted of four steps to calculate an index for assessing the provision of soil-related ecosystem services (ISES). The first step was to define the soil functions to be evaluated, and their corresponding weight in the final index. The selected soil functions were related to the mechanisms that regulate soil water flow. The second step was the selection of a minimum set of indicators (minimum dataset) that represents the soil functions related to the provision of the water flow regulation service (Table 1).
In the third step, the data from the indicators were interpreted, and the measured values of each indicator were transformed into dimensionless values between 0 and 1. The transformations were performed using linear equations, where each indicator was ranked according to the type of specific scoring curve for each soil function. The specific scoring curves were: (i) “more is better”—i.e., as the measured values increased, the higher (better) was the score (water infiltration, soil saturated hydraulic conductivity, available water-holding capacity, macro- and microporosity); (ii) “less is the better”—i.e., as the measured values increased, the lower (worse) was the assigned score (runoff); (iii) “optimum point”—i.e., the optimal measured value received the highest score, and all observed values lower or higher than this optimum point received lower scores (SWSC index—the optimum point being 0.66). In the fourth step, the values obtained in the third step were integrated and transformed into a single, dimensionless value, composing the ISES that expresses the provision of the water flow regulation service.
The water flow index scores for each treatment were calculated using the weighted method in which weights were assigned to indicators and soil functions according to the number of indicators that compose each function (Equation (9)), and the number of functions that compose the final index. Within each function, all the indicators had the same weight.
I SES = i = 1 n p ( i )   ×   w e i g h t ( i )  
where:
p(i) refers to the scores for each indicator; n is the number of indicators included in the index; and weight(i) is the weight attributed to each indicator.
The data for infiltration rate and runoff rate had to be normalized by the drip rate (it/r; and rot/r, respectively) to compose the index and allow comparisons between treatments. The data for all the other indicators were used as measured or calculated.

2.6. Data Analysis

The data of the indicators were initially subjected to Shapiro–Wilk’s test for normality analysis, then to Levene’s test for homogeneity of variance analysis. The data that met ANOVA’s assumptions were then subjected to Fisher’s ANOVA to test the effects of sugarcane straw removal as a management strategy. As data for soil bulk density, the hydraulic parameters (FC, PWP, and AWC) and soil porosity (TP, MiP, and MaP) for the first soil layer (0.0–0.05 m) was found by Levene’s test to not be homoscedastic, we subjected these data to Welch’s ANOVA [44]. For the results analyzed by Fisher’s ANOVA, when found significant by the F test (p < 0.05), the means were compared using Tukey’s (p < 0.10) post hoc test. For the integration of the data of soil-related ecosystem service, the analytical strategies outlined in Cherubin et al. [42] and Oliveira et al. [43] were used as described above.

3. Results

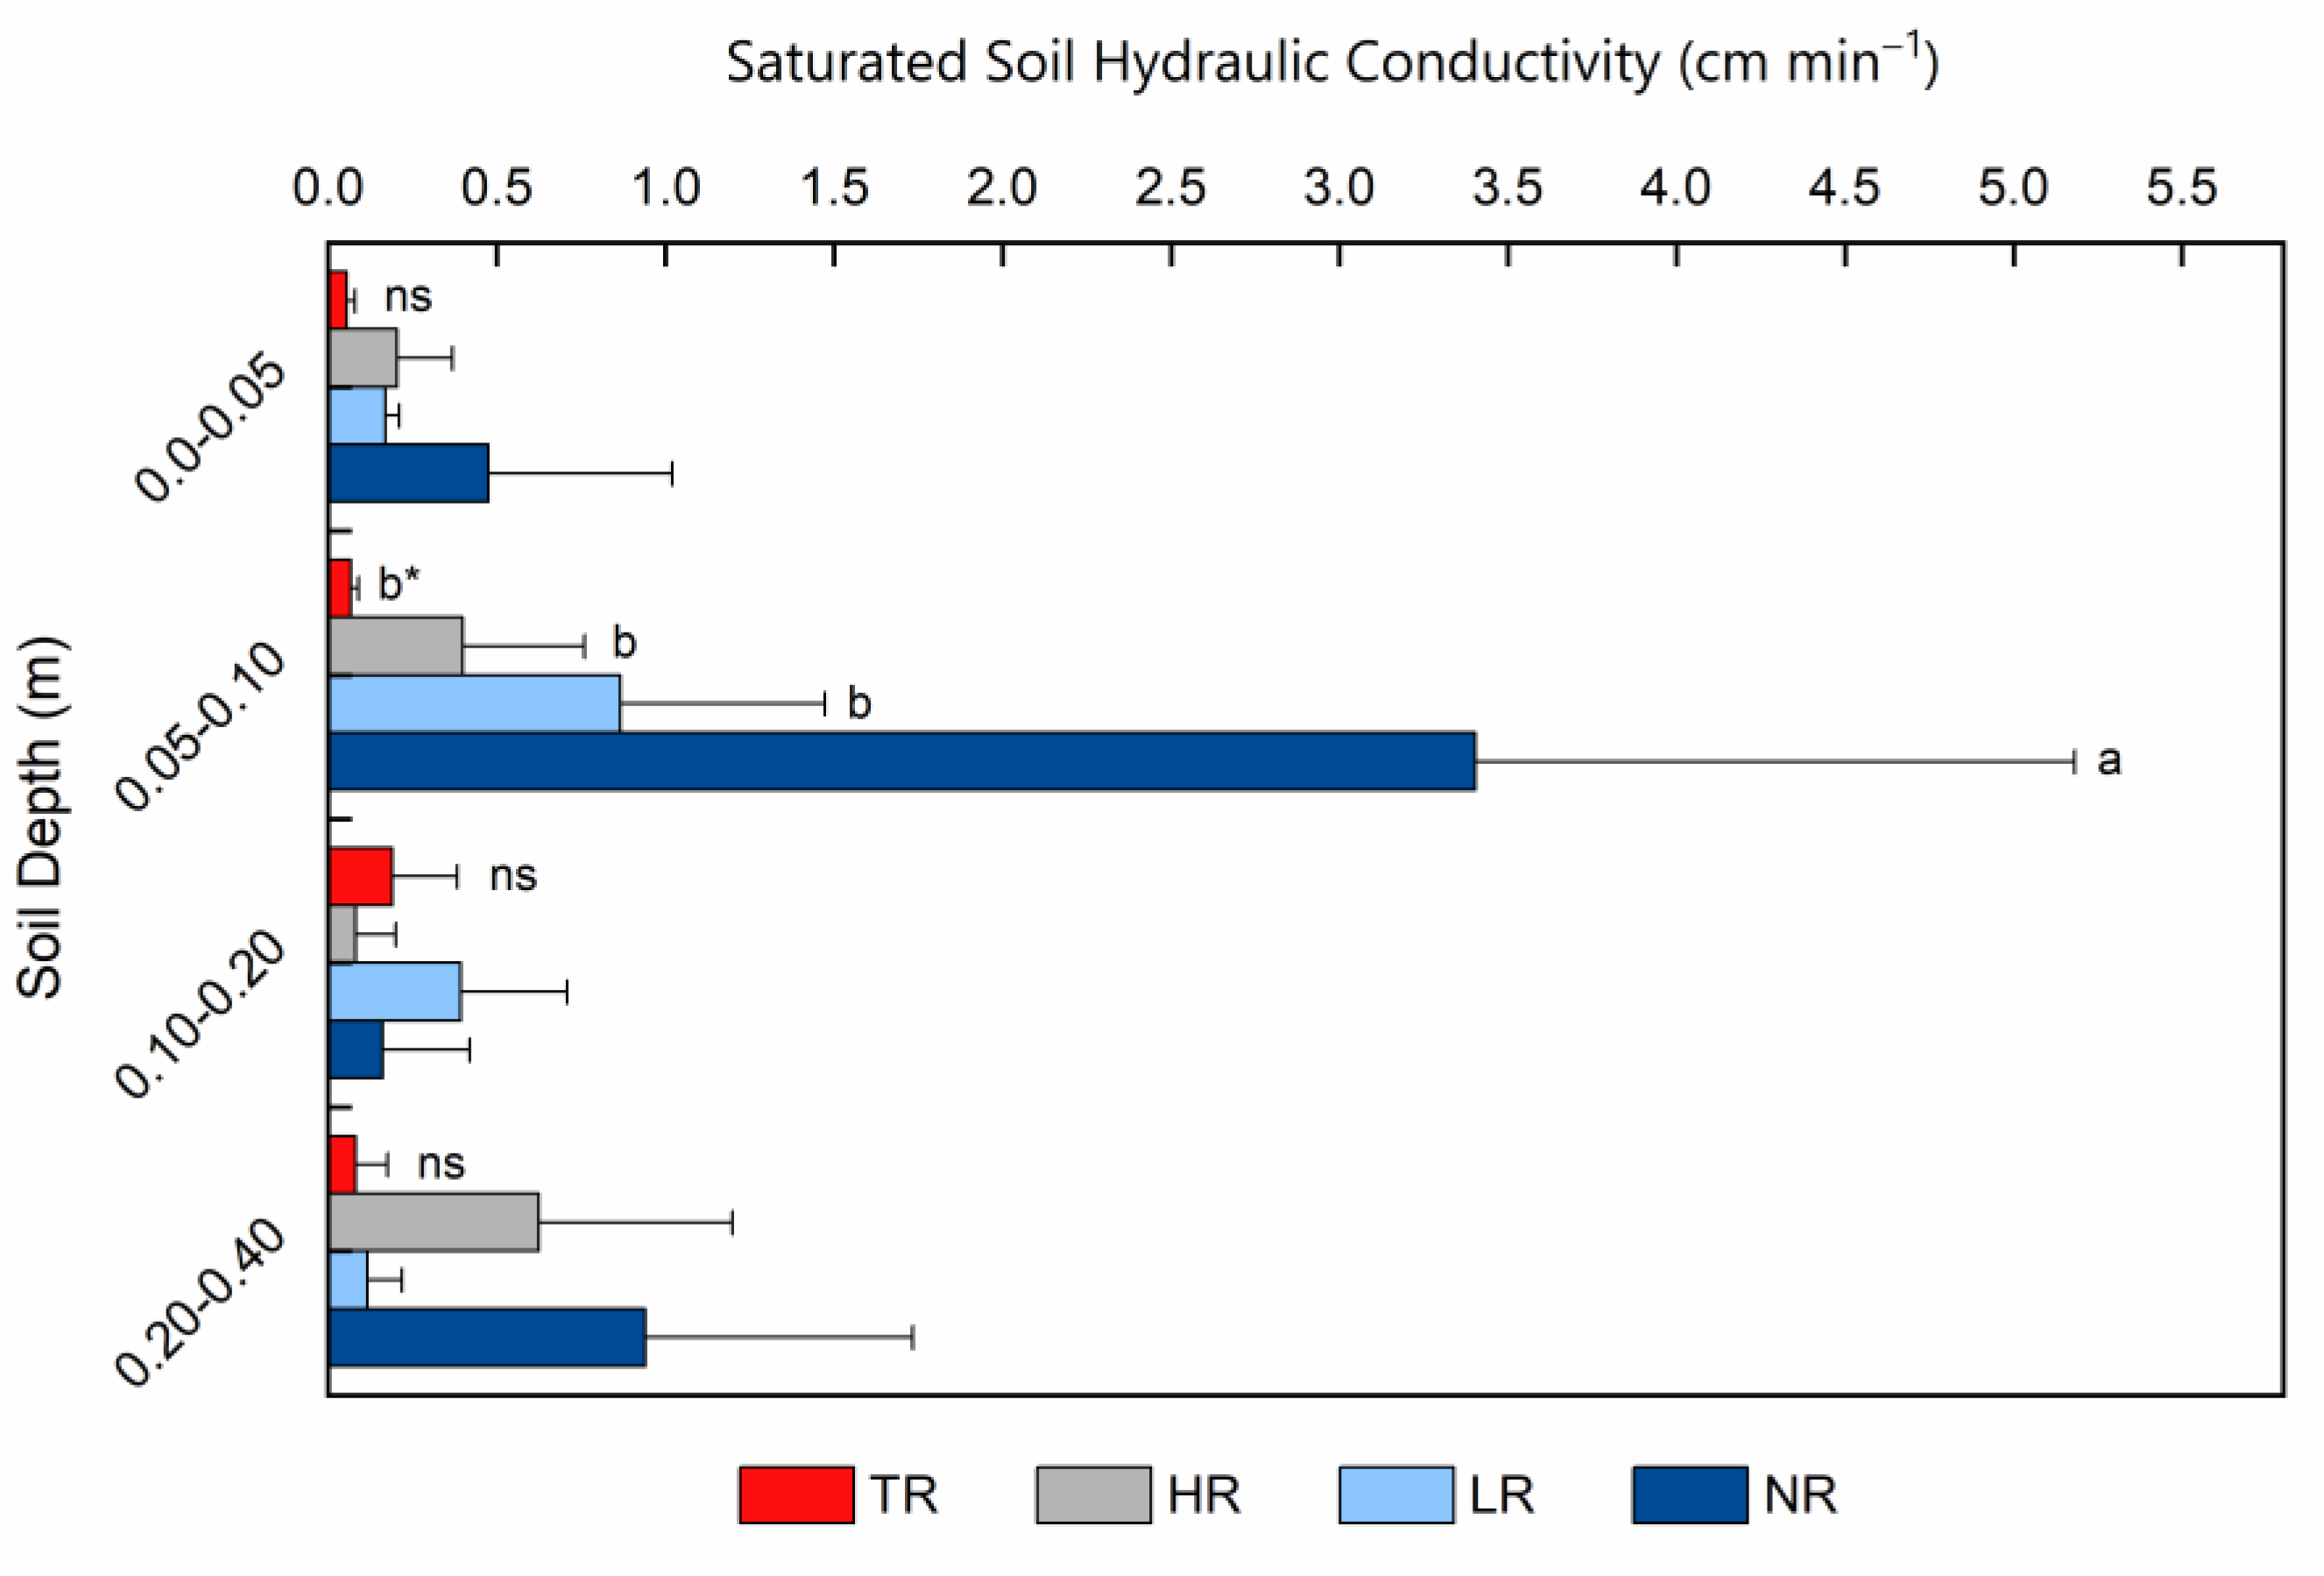
3.1. Soil Physical and Hydraulic Indicators

3.1.1. Bulk Density, Porosity, and Hydraulic Parameters

No differences were observed among treatments for soil bulk density values (Welch’s t = 0.709, 0.396, 0.707, and 0.220, respectively by soil layer). Considering all the soil layers (0–0.05, 0.05–0.10, 0.10–0.20, and 0.20–0.40 m), the mean soil bulk density values for all treatments reached around 1.5 Mg m−3 (Table 2).
Straw management also did not impact soil porosity within each layer (Welch’s p < 0.10). The mean total porosity in the 0.05–0.10 m layer was lower than the mean of the 0.0–0.05 m layer (~12%) for all straw removal rates, and macroporosity was lower for the TR, HR, and LR treatments, as compared to the other layers. All treatments in all soil depths showed MaP levels around or below 0.10 m3 m−3, a value considered a limiting threshold for adequate soil aeration [45] (Table 2).
We found no differences in AWC induced by straw management (Welch’s t = 0.306, 0.245, 0.490, and 0.787, respectively by soil layer). In general, the measured values were around 0.1 m3 m−3. The AWC values showed high variation in the first two soil layers, with coefficients of variance reaching up to 100%. Overall, no changes to SWSC and SAC induced by straw management were observed (Fisher’s ANOVA, p = 0.603, 0.200, 0.480, and 0.437, respectively by soil layer) (Figure 5). In the 0–0.05 m soil layer, the HR and TR treatments were close to the ideal ratio as per Reynolds et al. [40], with average SWSC values of 0.68 and 0.62. The other two treatments showed SWSC values above the ideal ratio (LR with 0.85, and NR with 0.78). In the 0.05–0.10 m soil layer, NR values were lower than the ideal ratio (0.55), whereas LR on average had SAC values trending to 0 (SWSC of 1.0), and the SWSC values for the TR and HR treatments were higher than the ideal ratio (0.91 and 0.90, respectively), severely compromising soil aeration. The layers 0.10–0.20 m and 0.20–0.40 m exhibited a similar pattern, where all treatments had SWSC values higher than the ideal ratio (Figure 5).
The total water infiltration for the time (40 min each measurement) was similar between the straw removal rates (TR ~4100 mm, LR ~5100 mm, and NR ~4800 mm), except for the HR treatment (~8400 mm). The basic infiltration rates, except for the HR, increased with the amount of straw left on the soil (Figure 6). The runoff interception time for the HR treatment (~23.9 min) was considerably higher than other treatments (TR ~7.8 min, LR ~7.1 min, NR ~3.6 min). Total runoff volume for the time varied among treatments, which is to be expected since the drip rate is not fixed. The HR treatment showed the lowest runoff value among treatments, with ~5500 mm, followed by TR with a runoff volume of approximately 7400 mm. The treatments with more straw had higher drip rates, and consequently showed higher total runoff values, LR with ~9700 mm and NR with ~10,130 mm.
Soil saturated hydraulic conductivity (Ks) was not significantly affected by straw removal rates, except for a specific change observed in the 0.05–0.10 m layer (Figure 7). For this specific layer (0.05–0.10 m) average Ks values reached 3.4 cm min−1 in the NR treatment, which was 74, 88, and 98% higher than LR, HR, and NR treatments, respectively. In the other soil layers, however, straw removal did not affect Ks (Fisher’s p < 0.05). We detected a high variation in Ks measurements, which is typically observed for this attribute.

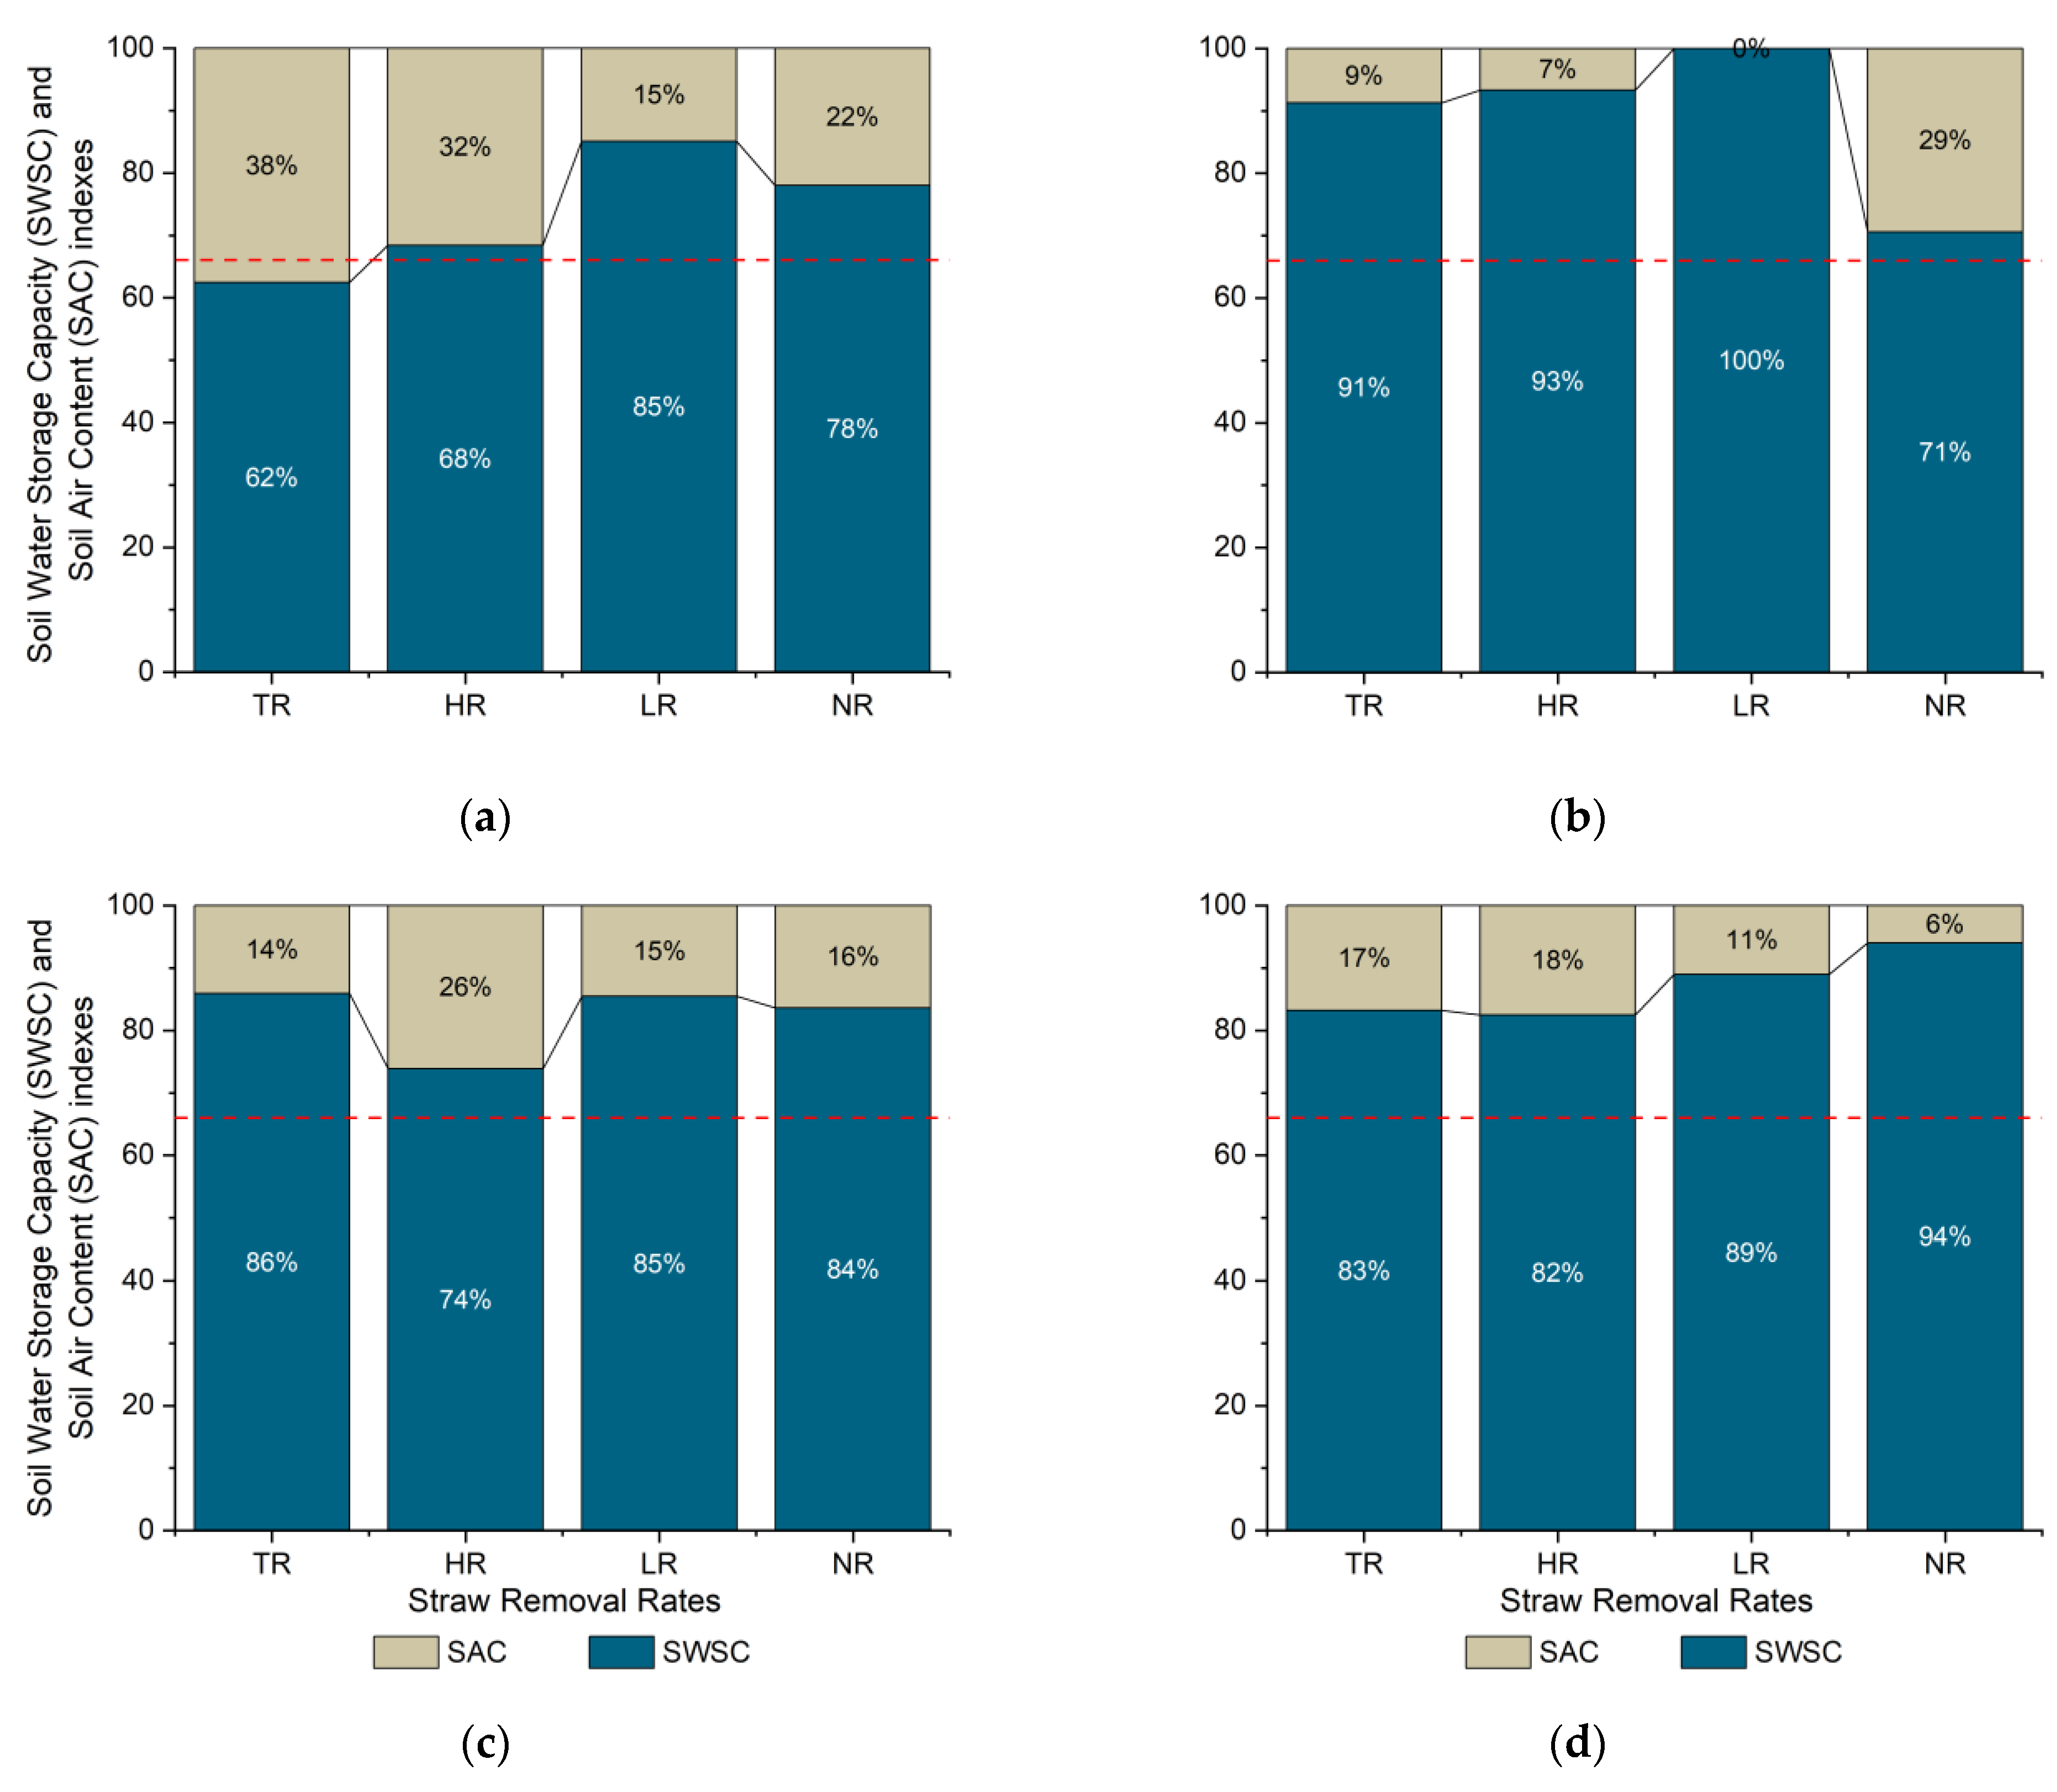
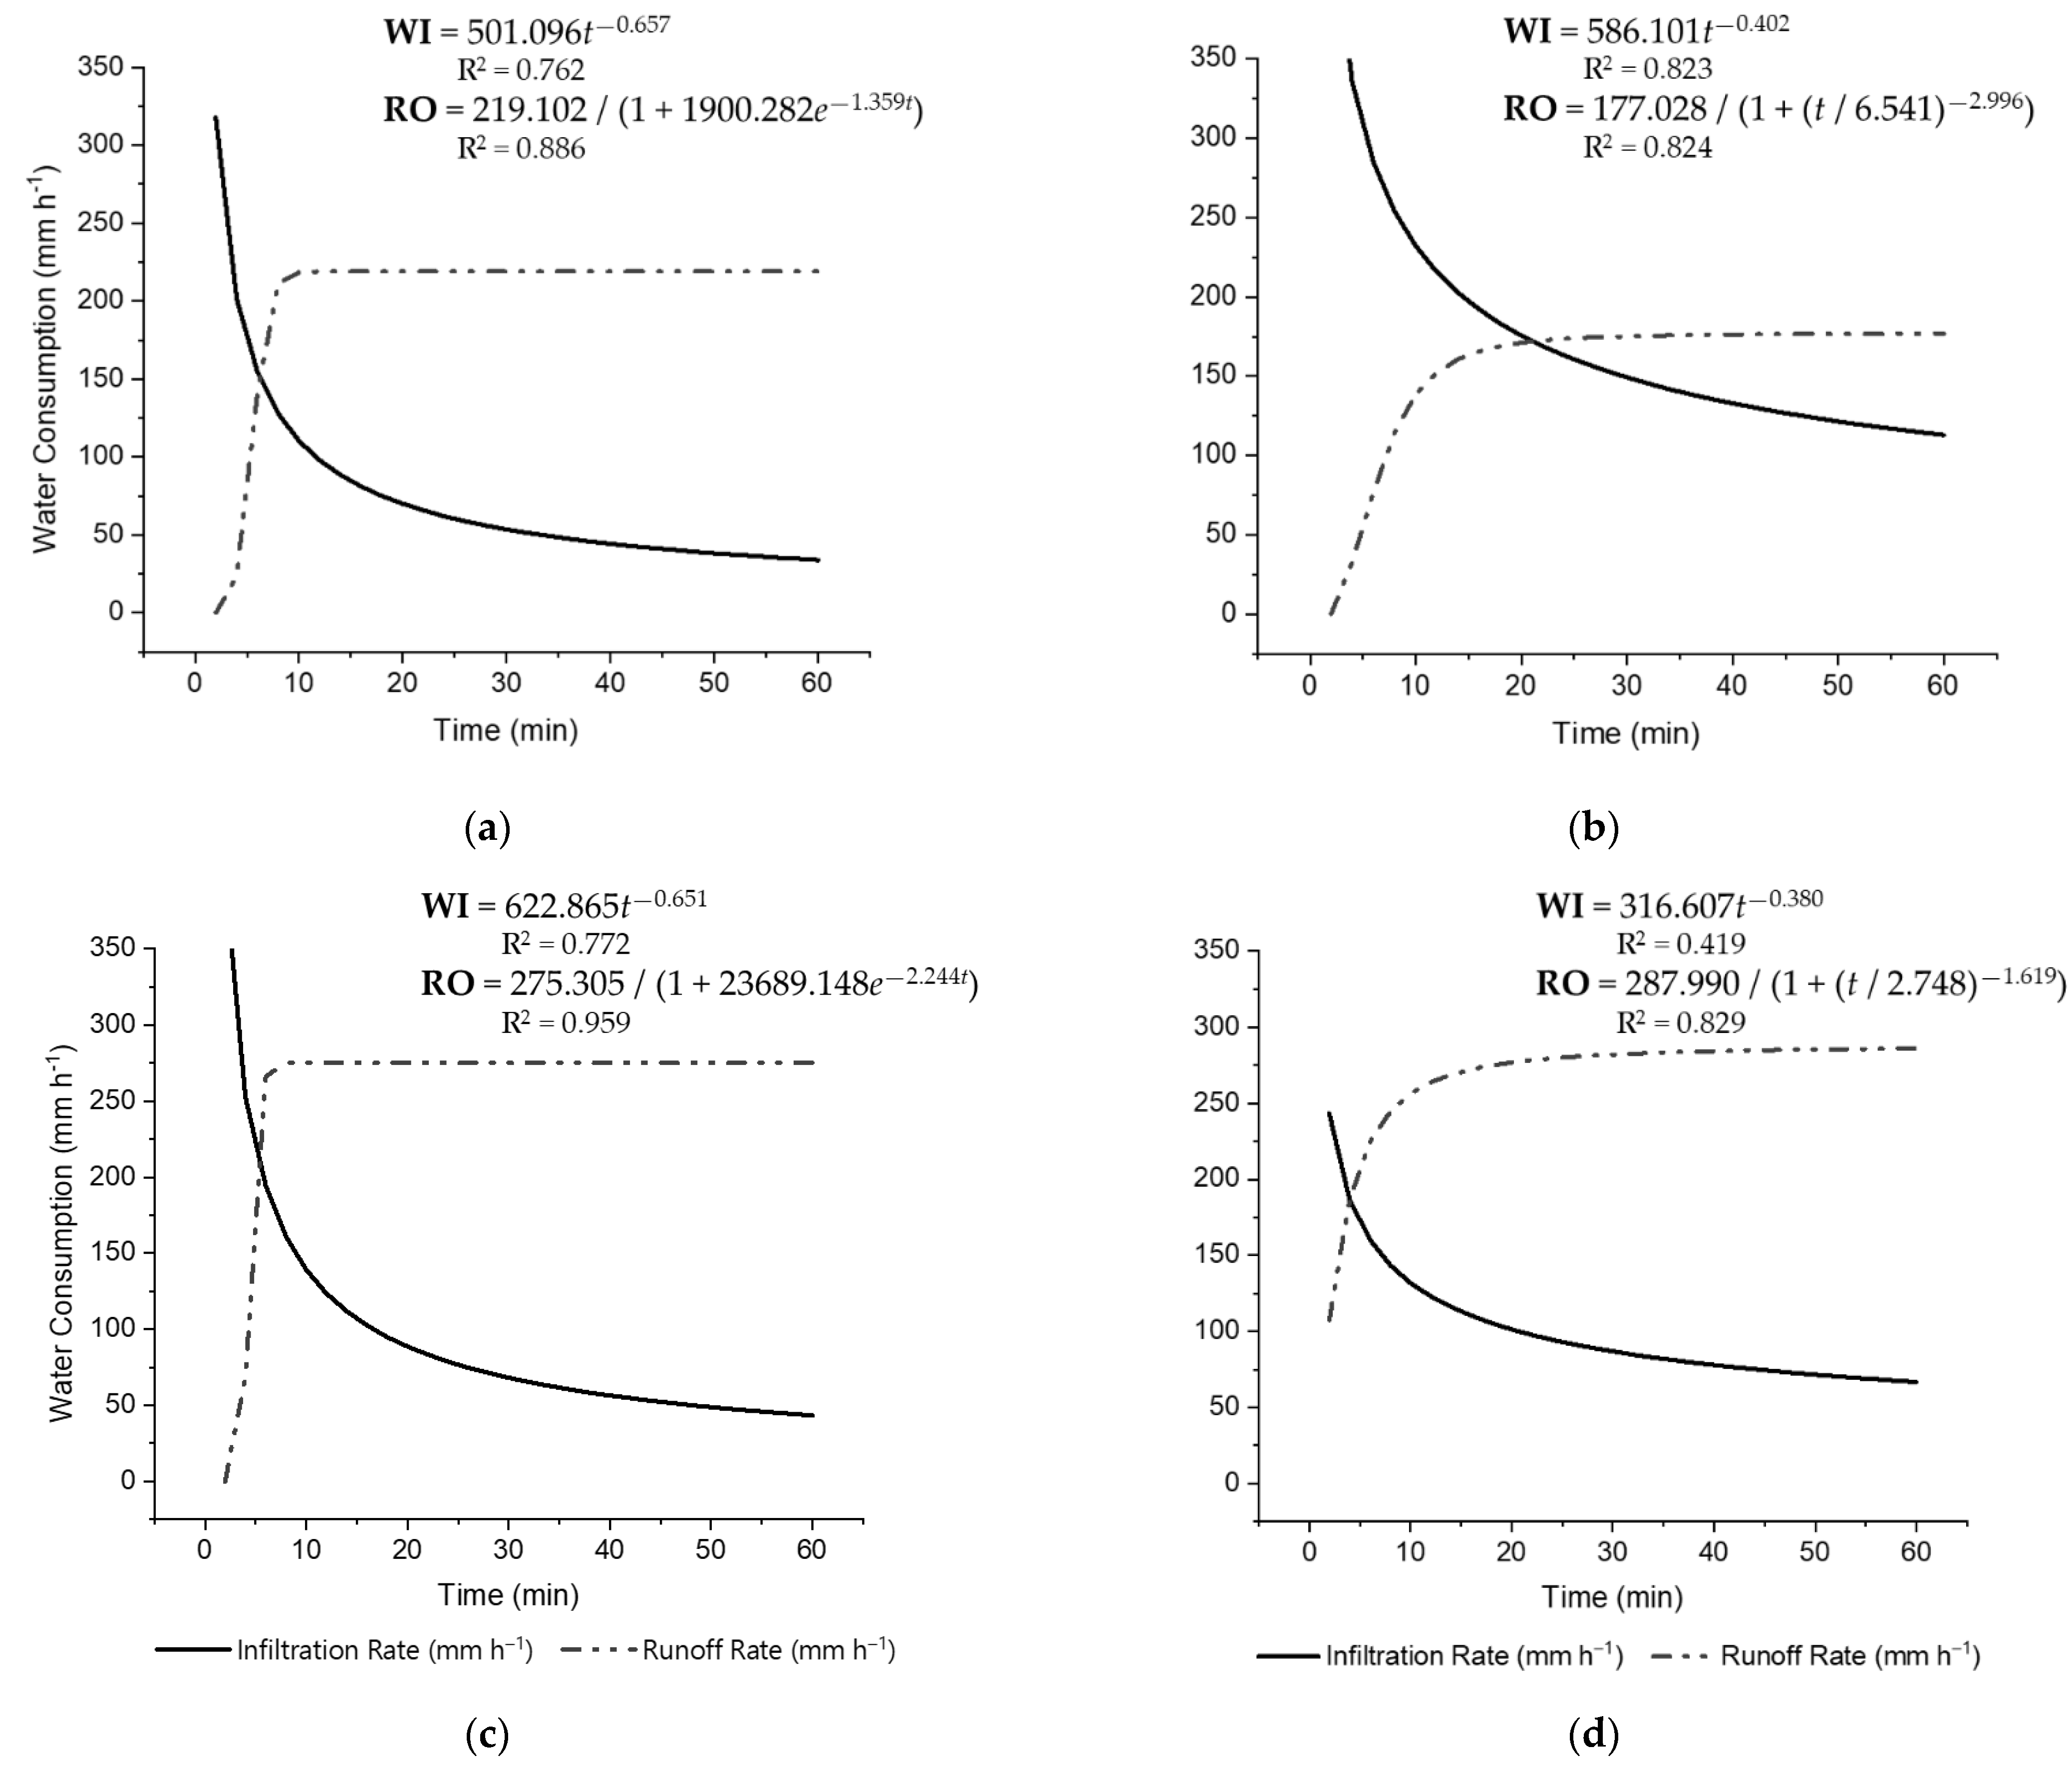
3.1.2. Soil-Related Ecosystem Service Assessment

The soil-related ecosystem service index associated with soil water regulation (ISES) was calculated based on three correlated soil functions (Figure 8). For the first soil function, concerning the infiltration and water movement, HR was the treatment with the best score (0.217), whilst TR and LR had lower scores. The NR scores did not differ from the other two groups for the first function (i.e., water infiltration flux and water movement in soil). For the second function, measuring water retention, no differences between treatments were found. On the other hand, for the third soil function, water availability to plants, LR had the best scores, followed by TR, and finally, the treatments with the lowest scores were NR and HR. By integrating the scores from the three functions, we observed that the overall ISES was not impacted by the straw management (Fisher’s ANOVA, p = 0.317) (Figure 8). The ISES values ranged from 0.56 for the TR treatment (lowest score) to 0.64 for the LR treatment (highest score), indicating soil degradation across all treatments, with a medium-to-low provision of this soil-related ecosystem service (Figure 8).

4. Discussion

4.1. Impact of Straw Removal on Physical and Hydraulic Indicators

Soil physical degradation by compaction as a result of heavy machinery traffic is a well-documented problem in mechanized sugarcane systems [46,47,48,49]. The high tire-soil contact stress and heavy axle loads of the tractors, harvesters, and wagons increase soil bulk density and reduce total porosity [50,51]. Consequently, water infiltration and the soil available water-holding capacity are reduced. On the other hand, mechanized sugarcane systems have the advantage of maintaining a layer of crop residue over the soil, which has an important role in maintaining overall soil health [15]. As sugarcane mills began to adopt straw removal as a management strategy to increase bioenergy production in the last decade, the adverse consequences of mechanized traffic may be increased [17], due to the loss of the protection provided by the straw layer. As straw is linked to several soil processes that favor the strengthening of soil structure and porosity (e.g., soil cover, soil C inputs, and aggregation), our initial hypothesis was that indiscriminate straw removal (i.e., TR and HR rates) would exacerbate the issues caused by compaction and further reduce soil physical quality, which was not confirmed. Our findings indicated that, by the end of the sugarcane cultivation cycle, straw removal had little effect on the process of soil degradation that resulted in the loss of soil physical quality and the ecosystem service related to the water flux regulation. This result is likely associated with repetitive heavy traffics that diminishes soil resilience, suggesting that under weathering clayey soils the benefits of sugarcane straw are not enough to sustain or recover the soil structure over the crop cycle.
The mean bulk density value we found by the end of one sugarcane cycle was 1.55 Mg m−3, whereas the bulk density of the soil in 2013 (measured before the establishment of the experiment) was 1.40 Mg m−3 [18]. The increase in soil bulk density reflects alterations in soil porosity that led to the low available water-holding capacity and aeration. Our data showed that soil porosity degradation has occurred over the sugarcane cycle, regardless of the straw removal rate. Soil compaction occurs mainly in the soil layer up to 0.40 m depth and can severely restrict the soil functions linked to gases exchange and water storage, and thus restrict root development [49,52]. By comparing soil porosity values with those reported by Castioni et al. [18], collected on the fourth year of the same experiment, we observed that porosity was altered as a consequence of further soil compaction caused by machinery traffic during the two-year gap between the studies. There was a reduction in MaP (i.e., from an average MaP of 0.167 in the fourth year to 0.078 in the sixth) coupled with an increase in MiP (i.e., from an average MiP of 0.218 in the fourth year to 0.391 in the sixth), in all soil layers. In addition to high soil bulk density, we observed high mean values of water content at PWP, in which smaller pores are responsible for water retention in this potential. It negatively affected AWC, which presented very low values mainly at layers below 0.10 m. According to van der Berg et al. [53], soils with high bulk densities present a larger surface area that is available to retain water at low potentials. These results suggest that the soil could hold a smaller volume of water in its pores, and a great portion of this water is not available for plants. Gmach et al. [24] also observed values of water retention capacity lower than the limiting range, though, for the sandy clay loam Oxisol that was evaluated in that study, low straw removal rates mitigated this effect.
The effect of organic matter on soil physical quality can be verified by the S index and is higher in sandy soils as compared to clayey soils [54]. In this way, it is possible to infer that the straw effect in clayey soils has less impact on soil aggregation, and consequently soil porosity, and AWC, than in sandy soils. The SWSC/SAC ratios exhibit this imbalance of water availability and aeration due to porosity changes. Though the majority of the SWSC ratios found were higher than the ideal ratio, indicating more water-filled pore space, in this situation most of the water is retained under high matric energy in micropores and is inaccessible to plant roots, i.e., water content below the PWP. The alteration in porosity compromised soil aeration at the layer where a large portion of the sugarcane root system is located, i.e., down to 0.20 m deep [55,56]. In addition to the reduction in AWC, the lack of adequate aeration shown by low SAC also constitutes an obstacle for root growth and plant development and can reduce sugarcane yield, as reported by Castioni et al. [18] and Cherubin et al. [15]. The authors of both studies observed a direct correlation between soil structural degradation and losses in sugarcane yield.
As an isolated strategy, maintaining straw on the soil surface is not effective to mitigate the loss of soil macroporosity caused by compaction, regardless of the amount of straw under clayey soil. Castioni et al. [17] reported that macroporosity was not significantly affected by straw removal rates after four years of successive sugarcane harvests. In the same way, we verified that macroporosity was uniformly reduced by the sixth ratoon in the present study. Other authors have reported similar bulk density increase and macroporosity reduction in soils under sugarcane without straw removal (i.e., all the straw kept on the soil surface), especially at the end of the cultivation cycle, after five to six years of machinery traffic [42,57,58]. Other management practices, such as controlled traffic and or double row spacing [59,60,61,62], and reduced tillage [47,63] seem to have a higher impact on the mitigation of soil structural and physical degradation. In addition, in a recent study, Cherubin et al. [64] concluded that the “damper” effect of sugarcane straw left on the soil surface is very subtle (i.e., increased 15 kPa in soil load-bearing capacity), and is thus presumably insufficient to diminish the risk of soil compaction caused by successive stresses promoted by heavy machinery traffic along the sugarcane production cycles.
Soil water infiltration and runoff were more associated with the inherent characteristics of the soil and, therefore, these parameters were less intensively impacted by straw removal. The high-water infiltration and hydraulic conductivity rates observed in the Oxisol evaluated in this study are strongly correlated to the soil’s granular microstructure, and the high amount of microaggregates with high inter-aggregate porosity, rather than management practices [65,66]. In natural conditions, these soils have a bimodal pore distribution as a result of microaggregation, with a high total pore volume composed of drainable pores (diameter > 50 µm), responsible for the soil’s high permeability, and small pores (diameter < 0.2 µm), which can retain water with very high energy [67,68]. The infiltration value for the HR treatment was not in line with the data found for the other three straw removal rates. We believe that this discrepancy is a result of the presence of biopores created by soil fauna, which could have increased the infiltration of water. Although it was not measured, we observed the presence of both Coleoptera larvae and earthworm individuals in the plots where the infiltration measurements were taken. Nevertheless, although some of the results for infiltration and runoff were discrepant, it is still possible to see differences in the basic infiltration rate for the straw removal rates (Figure 6). The treatment without removal had an infiltration rate more similar to the expected from this soil type, while the other treatments had basic infiltration rates 48% (for TR) and 33% (for LR) lower than NR. This could not be related to the higher hydraulic conductivity seen for the NR treatment in the 5–10 cm layer. The results for saturated water conductivity were lower than the values found in other studies with soils from the same class [65]. This can be explained by the high variability typically observed in Ks data, especially in highly disturbed soils [69], by the limitations of the laboratory methodology used, and by the extremely low MaP volume (<0.03 m3 m−3) at 0.05–0.10 m of depth, found at TR, HR, and LR. Soil saturated hydraulic conductivity data were also uneven between soil layers (Figure 7). Uneven hydraulic conductivity can lead to water accumulation on top of the layer with lower conductivity, which can lead, in seasons of high rainfall, to an increased risk of hypoxia [70], accelerated root decomposition [56], and also increase the risk of soil erosion.

4.2. Soil Water Flow Regulation under Straw Removal Management

In certain conditions, crop residue has a notable effect on the regulation of the soil’s capacity to provide the soil-related ecosystem service of water flow regulation since it can increase water infiltration [71] and retention [72], and mitigate water loss through evaporation by reducing high soil temperature variations [27,73,74]. The organic matter input through crop residue is fundamental for carbon sequestration [75], soil aggregation [76,77], and, consequently, soil porosity, which in turn regulates soil water flow. Thus, removing the straw from the soil surface could contribute to a loss of the soil’s capacity to provide this ecosystem service. Based on our assessment, the soil was providing the water flow regulation ecosystem service at 56 to 64% of its full capacity under sugarcane cultivation (Figure 8), indicating a loss of soil functions and the soil-related ecosystem service provision, as a result of physical degradation. Nevertheless, we did not detect the direct influence of straw removal on the loss of function and service provision. The main driver for degradation appears to be compaction caused by heavy machinery traffic throughout the years of cultivation [42,62]. In addition, straw removal seems to have less impact on soil functions in clayey soils when compared to sandy soils, as soil organic matter has more influence on the hydraulic parameters of sandy soils as opposed to clays [78]. Cherubin et al. [15] conducted an assessment in 12 field experiments using the Soil Management Assessment Framework (SMAF) to investigate the broad impact of straw removal on soil health and found that sandy soils were more prone to degradation under high straw removal rates, especially because of soil organic carbon decline. Therefore, to preserve soil functions, straw management decisions have to consider the inherent characteristics of the soil of each specific region or sugarcane field.
The loss of soil physical functions by degradation under sugarcane cultivation is not exclusive to the systems with mechanized harvest. Cavalcanti et al. [79], evaluating a sandy loam Ultisol in Northeastern Brazil, in an area where sugarcane is burned, manually harvested, and mechanically collected with wagons, found soil functions reduced from 88% of its full capacity in the native forest to 67% in the sugarcane ratoon. In this case, total straw removal by burning reduced soil organic carbon and aggregate stability, degrading soil structure, which can partially explain the loss of soil physical functions. In addition, compaction is also high in this system, since traffic is not oriented in lines, and the entire area is trampled by both workers and loaders [52]. In addition, recent studies indicate that indiscriminate straw removal reduces the input of carbon to the soil and consequently reduces soil carbon stocks [16,75,80] and undermine soil physical quality as a consequence [15]. It is therefore important to underline that the maintenance of a thick layer of straw on soil surface results in several well-reported benefits to the soil–plant system (as mentioned before), but by itself, straw is not enough to mitigate the problems caused by intense and disorderly machinery traffic in sugarcane fields. In the present study, intensive machinery traffic during six years (without any tillage practices) caused severe soil physical degradation and nullified any potential positive effect on soil physical quality induced by the maintenance of straw on the soil surface along the crop cycle. Our data represent a case study evaluating the six-year effect of straw removal on soil physical quality and water flow in a clayey soil with a long history of sugarcane cultivation. We advocate that new studies should be performed considering areas under distinct edaphoclimatic conditions to provide a broader basis for management recommendations.
The loss of soil functions is not only an ecological problem, but also an agronomic and economic one. Several studies investigated the effect of soil quality over sugarcane yield from different perspectives, with the conclusion that soil degradation leads to losses in yield and, consequently, in food and bioenergy production, finally reducing profitability [6,15,16,29,59]. Therefore, it is important to include the state of soil health and soil functions in yield predictions and economic decision-making processes.

5. Conclusions

At the end of the sugarcane cultivation cycle, straw removal had a minor effect on the aggravation of soil physical degradation and the consequential loss of soil-related ecosystem service of water flow regulation. Soil compaction by successive mechanized harvests was the major driver of the physical changes in the soil, for which straw has a limited mitigating effect. Therefore, rational straw removal for bioenergy production at the end of the cultivation cycle is a strategy that can be implemented in soils with high structural stability without compromising water flow regulation. However, it is important to emphasize that the soil provides several other vital ecosystem services (e.g., climate regulation, support for biodiversity, nutrient cycling, and food-energy production) whose provision may be impacted by straw removal and thus require integrated evaluations in further studies.

Supplementary Materials

The following are available online at https://www.mdpi.com/article/10.3390/su14020841/s1: Table S1: Soil chemical characterization for soil samples collected in October 2019 from an experiment with four sugarcane straw removal rates in a clayey soil in Iracemápolis, São Paulo, Brazil.

Author Contributions

Conceptualization, M.L.C. and M.R.C.; methodology, M.L.C., F.B.d.L. and M.R.C.; formal analysis, M.L.C., F.B.d.L. and R.P.d.L.; investigation, M.L.C. and M.R.C.; resources, J.L.N.C. and M.R.C.; data curation, M.L.C.; writing—original draft preparation, M.L.C. and M.R.C.; writing—review and editing, M.L.C., F.B.d.L., R.P.d.L., K.M.V.C.-P., J.L.N.C. and M.R.C.; visualization, M.L.C. and R.P.d.L.; supervision, M.R.C.; project administration, M.R.C.; funding acquisition, M.R.C. All authors have read and agreed to the published version of the manuscript.

Funding

This research was funded by the São Paulo Research Foundation (2018/09845-7) and the Brazilian National Council for Scientific and Technological Development (427170/2018-4).

Institutional Review Board Statement

Not applicable.

Informed Consent Statement

Not applicable.

Data Availability Statement

Not applicable.

Acknowledgments

M.L.C. thanks the Brazilian National Council for Scientific and Technological Development (CNPq) for the scholarship received for the duration of a Master’s degree during which this research was carried out. We thank our colleagues at the National Laboratory for Biorenewables (LNBR) for assisting us in our evaluation of their original experiment in Iracemápolis, São Paulo. We also thank our colleagues of the Soil Health & Management Research Group (SOHMA) at ESALQ/USP for their support with field and laboratory work.

Conflicts of Interest

The authors declare no conflict of interest. The funders had no role in the design of the study; in the collection, analyses, or interpretation of data; in the writing of the manuscript, or in the decision to publish the results.

References

  1. Lal, R. Is Crop Residue a Waste? J. Soil Water Conserv. 2004, 59, 136A. [Google Scholar]
  2. Jiang, Y.; Havrysh, V.; Klymchuk, O.; Nitsenko, V.; Balezentis, T.; Streimikiene, D. Utilization of Crop Residue for Power Generation: The Case of Ukraine. Sustainability 2019, 11, 7004. [Google Scholar] [CrossRef] [Green Version]
  3. Aguiar, A.; Milessi, T.S.; Mulinari, D.R.; Lopes, M.S.; da Costa, S.M.; Candido, R.G. Sugarcane Straw as a Potential Second Generation Feedstock for Biorefinery and White Biotechnology Applications. Biomass Bioenergy 2021, 144, 105896. [Google Scholar] [CrossRef]
  4. Menandro, L.; Cantarella, H.; Franco, H.; Kölln, O.; Pimenta, M.; Sanches, G.; Rabelo, S.; Carvalho, J. Comprehensive Assessment of Sugarcane Straw: Implications for Biomass and Bioenergy Production. Biofuels Bioprod. Biorefin. 2017, 11, 488–504. [Google Scholar] [CrossRef]
  5. Cherubin, M.R.; Oliveira, D.M.d.S.; Feigl, B.J.; Pimentel, L.G.; Lisboa, I.P.; Gmach, M.R.; Varanda, L.L.; Morais, M.C.; Satiro, L.S.; Popin, G.V.; et al. Crop Residue Harvest for Bioenergy Production and Its Implications on Soil Functioning and Plant Growth: A Review. Sci. Agric. 2018, 75, 255–272. [Google Scholar] [CrossRef] [Green Version]
  6. Lisboa, I.; Cherubin, M.; de Lima, R.; Cerri, C.; Satiro, L.; Wienhold, B.; Schmer, M.; Jin, V.; Cerri, C.E. Sugarcane Straw Removal Effects on Plant Growth and Stalk Yield. Ind. Crops Prod. 2018, 111, 794–806. [Google Scholar] [CrossRef]
  7. Leal, M.R.L.V.; Galdos, M.V.; Scarpare, F.V.; Seabra, J.E.A.; Walter, A.; Oliveira, C.O.F. Sugarcane Straw Availability, Quality, Recovery and Energy Use: A Literature Review. Biomass Bioenergy 2013, 53, 11–19. [Google Scholar] [CrossRef]
  8. Bezerra, P.X.O.; De Farias Silva, C.E.; Soletti, J.I.; de Carvalho, S.H.V. Cellulosic Ethanol from Sugarcane Straw: A Discussion Based on Industrial Experience in the Northeast of Brazil. Bioenergy Res. 2021, 14, 761–773. [Google Scholar] [CrossRef]
  9. Alves, M.; Ponce, G.H.S.F.; Silva, M.A.; Ensinas, A.V. Surplus Electricity Production in Sugarcane Mills Using Residual Bagasse and Straw as Fuel. Energy 2015, 91, 751–757. [Google Scholar] [CrossRef]
  10. Carvalho, J.L.N.; Nogueirol, R.C.; Menandro, L.M.S.; Bordonal, R.d.O.; Borges, C.D.; Cantarella, H.; Franco, H.C.J. Agronomic and Environmental Implications of Sugarcane Straw Removal: A Major Review. GCB Bioenergy 2017, 9, 1181–1195. [Google Scholar] [CrossRef]
  11. Carvalho, J.L.N.; Menandro, L.M.S.; de Castro, S.G.Q.; Cherubin, M.R.; Bordonal, R.d.O.; Barbosa, L.C.; Gonzaga, L.C.; Tenelli, S.; Franco, H.C.J.; Kolln, O.T.; et al. Multilocation Straw Removal Effects on Sugarcane Yield in South-Central Brazil. Bioenergy Res. 2019, 12, 813–829. [Google Scholar] [CrossRef] [Green Version]
  12. Cervi, W.R.; Lamparelli, R.A.C.; Seabra, J.E.A.; Junginger, M.; Hilst, F. van der Bioelectricity Potential from Ecologically Available Sugarcane Straw in Brazil: A Spatially Explicit Assessment. Biomass Bioenergy 2019, 122, 391–399. [Google Scholar] [CrossRef]
  13. Sampaio, I.L.M.; Cardoso, T.F.; Souza, N.R.D.; Watanabe, M.D.B.; Carvalho, D.J.; Bonomi, A.; Junqueira, T.L. Electricity Production from Sugarcane Straw Recovered Through Bale System: Assessment of Retrofit Projects. Bioenergy Res. 2019, 12, 865–877. [Google Scholar] [CrossRef] [Green Version]
  14. Formann, S.; Hahn, A.; Janke, L.; Stinner, W.; Sträuber, H.; Logroño, W.; Nikolausz, M. Beyond Sugar and Ethanol Production: Value Generation Opportunities Through Sugarcane Residues. Front. Energy Res. 2020, 8, 267. [Google Scholar] [CrossRef]
  15. Cherubin, M.R.; Bordonal, R.O.; Castioni, G.A.; Guimarães, E.M.; Lisboa, I.P.; Moraes, L.A.A.; Menandro, L.M.S.; Tenelli, S.; Cerri, C.E.P.; Karlen, D.L.; et al. Soil Health Response to Sugarcane Straw Removal in Brazil. Ind. Crops Prod. 2021, 163, 113315. [Google Scholar] [CrossRef]
  16. Bordonal, R.d.O.; Menandro, L.M.S.; Barbosa, L.C.; Lal, R.; Milori, D.M.B.P.; Kolln, O.T.; Franco, H.C.J.; Carvalho, J.L.N. Sugarcane Yield and Soil Carbon Response to Straw Removal in South-Central Brazil. Geoderma 2018, 328, 79–90. [Google Scholar] [CrossRef]
  17. Castioni, G.A.; Cherubin, M.R.; Menandro, L.M.S.; Sanches, G.M.; Bordonal, R.d.O.; Barbosa, L.C.; Franco, H.C.J.; Carvalho, J.L.N. Soil Physical Quality Response to Sugarcane Straw Removal in Brazil: A Multi-Approach Assessment. Soil Tillage Res. 2018, 184, 301–309. [Google Scholar] [CrossRef]
  18. Castioni, G.A.F.; Cherubin, M.R.; Bordonal, R.d.O.; Barbosa, L.C.; Menandro, L.M.S.; Carvalho, J.L.N. Straw Removal Affects Soil Physical Quality and Sugarcane Yield in Brazil. Bioenergy Res. 2019, 12, 789–800. [Google Scholar] [CrossRef]
  19. Lisboa, I.; Cherubin, M.; Satiro, L.; Neto, M.; de Lima, R.; Gmach, M.R.; Wienhold, B.; Schmer, M.; Jin, V.; Cerri, C.; et al. Applying Soil Management Assessment Framework (SMAF) on Short-Term Sugarcane Straw Removal in Brazil. Ind. Crops Prod. 2019, 129, 175–184. [Google Scholar] [CrossRef]
  20. Cherubin, M.R.; Carvalho, J.L.N.; Cerri, C.E.P.; Nogueira, L.A.H.; Souza, G.M.; Cantarella, H. Land Use and Management Effects on Sustainable Sugarcane-Derived Bioenergy. Land 2021, 10, 72. [Google Scholar] [CrossRef]
  21. Bronick, C.J.; Lal, R. Soil Structure and Management: A Review. Geoderma 2005, 124, 3–22. [Google Scholar] [CrossRef]
  22. Gould, I.J.; Quinton, J.N.; Weigelt, A.; De Deyn, G.B.; Bardgett, R.D. Plant Diversity and Root Traits Benefit Physical Properties Key to Soil Function in Grasslands. Ecol. Lett. 2016, 19, 1140–1149. [Google Scholar] [CrossRef] [PubMed]
  23. da Silva, G.R.V.; de Souza, Z.M.; Martins Filho, M.V.; Barbosa, R.S.; de Souza, G.S. Soil, Water and Nutrient Losses by Interrill Erosion from Green Cane Cultivation. Rev. Bras. Ciênc. Solo 2012, 36, 963–970. [Google Scholar] [CrossRef] [Green Version]
  24. Gmach, M.R.; Scarpare, F.V.; Cherubin, M.R.; Lisboa, I.P.; dos Santos, A.K.B.; Cerri, C.E.P.; Cerri, C.C. Sugarcane Straw Removal Effects on Soil Water Storage and Drainage in Southeastern Brazil. J. Soil Water Conserv. 2019, 74, 466–476. [Google Scholar] [CrossRef]
  25. Guo, J.; Ling, H.; Wu, Q.; Xu, L.; Que, Y. The Choice of Reference Genes for Assessing Gene Expression in Sugarcane under Salinity and Drought Stresses. Sci. Rep. 2014, 4, 7042. [Google Scholar] [CrossRef] [Green Version]
  26. Dias, H.B.; Sentelhas, P.C. Sugarcane Yield Gap Analysis in Brazil—A Multi-Model Approach for Determining Magnitudes and Causes. Sci. Total. Environ. 2018, 637–638, 1127–1136. [Google Scholar] [CrossRef] [PubMed]
  27. Ruiz Corrêa, S.T.; Barbosa, L.C.; Menandro, L.M.S.; Scarpare, F.V.; Reichardt, K.; de Moraes, L.O.; Hernandes, T.A.D.; Franco, H.C.J.; Carvalho, J.L.N. Straw Removal Effects on Soil Water Dynamics, Soil Temperature, and Sugarcane Yield in South-Central Brazil. Bioenergy Res. 2019, 12, 749–763. [Google Scholar] [CrossRef]
  28. Silva, A.G.B.; Lisboa, I.P.; Cherubin, M.R.; Cerri, C.E.P. How Much Sugarcane Straw Is Needed for Covering the Soil? Bioenergy Res. 2019, 12, 858–864. [Google Scholar] [CrossRef]
  29. de Aquino, G.S.; de Conti Medina, C.; Shahab, M.; Santiago, A.D.; Cunha, A.C.B.; Kussaba, D.A.O.; Carvalho, J.B.; Moreira, A. Does Straw Mulch Partial-Removal from Soil Interfere in Yield and Industrial Quality Sugarcane? A Long Term Study. Ind. Crops Prod. 2018, 111, 573–578. [Google Scholar] [CrossRef] [Green Version]
  30. Rabot, E.; Wiesmeier, M.; Schlüter, S.; Vogel, H.-J. Soil Structure as an Indicator of Soil Functions: A Review. Geoderma 2018, 314, 122–137. [Google Scholar] [CrossRef]
  31. Greiner, L.; Keller, A.; Grêt-Regamey, A.; Papritz, A. Soil Function Assessment: Review of Methods for Quantifying the Contributions of Soils to Ecosystem Services. Land Use Policy 2017, 69, 224–237. [Google Scholar] [CrossRef]
  32. Bünemann, E.K.; Bongiorno, G.; Bai, Z.; Creamer, R.E.; De Deyn, G.; de Goede, R.; Fleskens, L.; Geissen, V.; Kuyper, T.W.; Mäder, P.; et al. Soil Quality—A Critical Review. Soil Biol. Biochem. 2018, 120, 105–125. [Google Scholar] [CrossRef]
  33. Alvares, C.A.; Stape, J.L.; Sentelhas, P.C. Köppen’s Climate Classification Map for Brazil. Meteorol. Z. 2013, 22, 711–728. [Google Scholar] [CrossRef]
  34. Soil Survey Staff. Keys to Soil Taxonomy, 12th ed.; USDA-Natural Resources Conservation Service: Washington, DC, USA, 2014. [Google Scholar]
  35. Ogden, C.; van Es, H.; Schindelbeck, R. Miniature Rain Simulator for Field Measurement of Soil Infiltration. Soil Sci. Soc. Am. J. 1997, 61, 1041–1043. [Google Scholar] [CrossRef]
  36. Kostiakov, A.N. On the Dynamics of the Coefficient of Water Percolation in Soils and the Necessity of Studying It from the Dynamic Point of View for the Purposes of Amelioration. Trans. Sixth Comm. Int. Soc. Soil Sci. 1932, 1, 7–21. [Google Scholar]
  37. Bresciani, L. Effects of Soil Coverage upon the Structuring and Functioning of Soil Microbiome. Master’s Dissertation, University of São Paulo, Piracicaba, Brazil, 2021. [Google Scholar]
  38. Haise, H.R.; Haas, H.J.; Jensen, L.R. Soil Moisture Studies of Some Great Plains Soils: II. Field Capacity as Related to 1/3-Atmosphere Percentage, and “Minimum Point” as Related to 15- and 26-Atmosphere Percentages. Soil Sci. Soc. Am. J. 1955, 19, 20–25. [Google Scholar] [CrossRef]
  39. Richards, L.A.; Weaver, L.R. Fifteen-Atmosphere Percentage as Related to the Permanent Wilting Point. Soil Sci. 1943, 56, 331–340. [Google Scholar] [CrossRef]
  40. Reynolds, W.D.; Bowman, B.T.; Drury, C.F.; Tan, C.S.; Lu, X. Indicators of Good Soil Physical Quality: Density and Storage Parameters. Geoderma 2002, 110, 131–146. [Google Scholar] [CrossRef]
  41. Klute, A. Laboratory Measurement of Hydraulic Conductivity of Saturated Soil. In Methods of Soil Analysis; John Wiley & Sons, Ltd.: Hoboken, NJ, USA, 1965; pp. 210–221. ISBN 978-0-89118-203-0. [Google Scholar]
  42. Cherubin, M.R.; Karlen, D.L.; Franco, A.L.C.; Tormena, C.A.; Cerri, C.E.P.; Davies, C.A.; Cerri, C.C. Soil Physical Quality Response to Sugarcane Expansion in Brazil. Geoderma 2016, 267, 156–168. [Google Scholar] [CrossRef]
  43. Oliveira, D.M.S.; Cherubin, M.R.; Franco, A.L.C.; Santos, A.S.; Gelain, J.G.; Dias, N.M.S.; Diniz, T.R.; Almeida, A.N.; Feigl, B.J.; Davies, C.A.; et al. Is the Expansion of Sugarcane over Pasturelands a Sustainable Strategy for Brazil’s Bioenergy Industry? Renew. Sustain. Energy Rev. 2019, 102, 346–355. [Google Scholar] [CrossRef] [Green Version]
  44. Tomarken, A.J.; Serlin, R.C. Comparison of ANOVA Alternatives under Variance Heterogeneity and Specific Noncentrality Structures. Psychol. Bull. 1986, 99, 90. [Google Scholar] [CrossRef]
  45. Erickson, A.E. Tillage Effects on Soil Aeration. In Predicting Tillage Effects on Soil Physical Properties and Processes; John Wiley & Sons, Ltd.: Hoboken, NJ, USA, 1982; pp. 91–104. ISBN 978-0-89118-310-5. [Google Scholar]
  46. Lozano, N.; Rolim, M.M.; Oliveira, V.S.; Tavares, U.E.; Pedrosa, E.M.R. Evaluation of Soil Compaction by Modeling Field Vehicle Traffic with SoilFlex during Sugarcane Harvest. Soil Tillage Res. 2013, 129, 61–68. [Google Scholar] [CrossRef]
  47. Barbosa, L.C.; Magalhães, P.S.G.; Bordonal, R.O.; Cherubin, M.R.; Castioni, G.A.F.; Tenelli, S.; Franco, H.C.J.; Carvalho, J.L.N. Soil Physical Quality Associated with Tillage Practices during Sugarcane Planting in South-Central Brazil. Soil Tillage Res. 2019, 195, 104383. [Google Scholar] [CrossRef]
  48. Guimarães Júnnyor, W.d.S.; Diserens, E.; De Maria, I.C.; Araujo-Junior, C.F.; Farhate, C.V.V.; de Souza, Z.M. Prediction of Soil Stresses and Compaction Due to Agricultural Machines in Sugarcane Cultivation Systems with and without Crop Rotation. Sci. Total Environ. 2019, 681, 424–434. [Google Scholar] [CrossRef]
  49. Jimenez, K.J.; Rolim, M.M.; Gomes, I.F.; de Lima, R.P.; Berrío, L.L.A.; Ortiz, P.F.S. Numerical Analysis Applied to the Study of Soil Stress and Compaction Due to Mechanised Sugarcane Harvest. Soil Tillage Res. 2021, 206, 104847. [Google Scholar] [CrossRef]
  50. Antille, D.L.; Ansorge, D.; Dresser, M.L.; Godwin, R.J. Soil Displacement and Soil Bulk Density Changes as Affected by Tire Size. Trans. ASABE 2013, 56, 1683–1693. [Google Scholar] [CrossRef] [Green Version]
  51. Castioni, G.A.F.; de Lima, R.P.; Cherubin, M.R.; Bordonal, R.O.; Rolim, M.M.; Carvalho, J.L.N. Machinery Traffic in Sugarcane Straw Removal Operation: Stress Transmitted and Soil Compaction. Soil Tillage Res. 2021, 213, 105122. [Google Scholar] [CrossRef]
  52. Cavalcanti, R.Q.; Rolim, M.M.; de Lima, R.P.; Tavares, U.E.; Pedrosa, E.M.R.; Gomes, I.F. Soil Physical and Mechanical Attributes in Response to Successive Harvests under Sugarcane Cultivation in Northeastern Brazil. Soil Tillage Res. 2019, 189, 140–147. [Google Scholar] [CrossRef]
  53. van den Berg, M.; Klamt, E.; van Reeuwijk, L.P.; Sombroek, W.G. Pedotransfer Functions for the Estimation of Moisture Retention Characteristics of Ferralsols and Related Soils. Geoderma 1997, 78, 161–180. [Google Scholar] [CrossRef]
  54. Dexter, A.R. Soil Physical Quality: Part I. Theory, Effects of Soil Texture, Density, and Organic Matter, and Effects on Root Growth. Geoderma 2004, 120, 201–214. [Google Scholar] [CrossRef]
  55. Otto, R.; Silva, A.P.; Franco, H.C.J.; Oliveira, E.C.A.; Trivelin, P.C.O. High Soil Penetration Resistance Reduces Sugarcane Root System Development. Soil Tillage Res. 2011, 117, 201–210. [Google Scholar] [CrossRef]
  56. Lovera, L.H.; de Souza, Z.M.; Esteban, D.A.A.; de Oliveira, I.N.; Farhate, C.V.V.; Lima, E.d.S.; Panosso, A.R. Sugarcane Root System: Variation over Three Cycles under Different Soil Tillage Systems and Cover Crops. Soil Tillage Res. 2021, 208, 104866. [Google Scholar] [CrossRef]
  57. de Oliveira, I.N.; de Souza, Z.M.; Lovera, L.H.; Vieira Farhate, C.V.; De Souza Lima, E.; Aguilera Esteban, D.A.; Fracarolli, J.A. Least Limiting Water Range as Influenced by Tillage and Cover Crop. Agric. Water. Manag. 2019, 225, 105777. [Google Scholar] [CrossRef]
  58. Jimenez, K.J.; Rolim, M.M.; de Lima, R.P.; Cavalcanti, R.Q.; Silva, Ê.F.F.; Pedrosa, E.M.R. Soil Physical Indicators of a Sugarcane Field Subjected to Successive Mechanised Harvests. Sugar Tech. 2021, 23, 811–818. [Google Scholar] [CrossRef]
  59. de Souza, G.S.; de Souza, Z.M.; da Silva, R.B.; Barbosa, R.S.; Araújo, F.S. Effects of Traffic Control on the Soil Physical Quality and the Cultivation of Sugarcane. Rev. Bras. Ciênc. Solo 2014, 38, 135–146. [Google Scholar] [CrossRef] [Green Version]
  60. de Souza, G.S.; de Souza, Z.M.; Cooper, M.; Tormena, C.A. Controlled Traffic and Soil Physical Quality of an Oxisol under Sugarcane Cultivation. Sci. Agric. 2015, 72, 270–277. [Google Scholar] [CrossRef] [Green Version]
  61. Esteban, D.A.A.; de Souza, Z.M.; Tormena, C.A.; Lovera, L.H.; Lima, E.d.S.; de Oliveira, I.N.; Ribeiro, N.d.P. Soil Compaction, Root System and Productivity of Sugarcane under Different Row Spacing and Controlled Traffic at Harvest. Soil Tillage Res. 2019, 187, 60–71. [Google Scholar] [CrossRef]
  62. Barbosa, L.C.; Magalhães, P.S.G.; Bordonal, R.O.; Cherubin, M.R.; Castioni, G.A.; Rossi Neto, J.; Franco, H.C.J.; Carvalho, J.L.N. Untrafficked Furrowed Seedbed Sustains Soil Physical Quality in Sugarcane Mechanized Fields. Eur. J. Soil Sci. 2021, 72, 2150–2164. [Google Scholar] [CrossRef]
  63. Shukla, S.K.; Jaiswal, V.P.; Sharma, L.; Pathak, A.D.; Singh, A.K.; Gupta, R.; Awasthi, S.K.; Gaur, A.; Zubair, A.; Tiwari, R. Sugarcane Yield Using Minimum Tillage Technology Through Subsoiling: Beneficial Impact on Soil Compaction, Carbon Conservation and Activity of Soil Enzymes. Sugar Tech. 2020, 22, 987–1006. [Google Scholar] [CrossRef]
  64. Cherubin, M.R.; Franchi, M.R.A.; de Lima, R.P.; de Moraes, M.T.; da Luz, F.B. Sugarcane Straw Effects on Soil Compaction Susceptibility. Soil Tillage Res. 2021, 212, 105066. [Google Scholar] [CrossRef]
  65. da Silva, V.R.; Reichert, J.M.; Reinert, D.J.; Bortoluzzi, E.C. Soil Water Dynamics Related to the Degree of Compaction of Two Brazilian Oxisols under No-Tillage. Rev. Bras. Ciênc. Solo 2009, 33, 1097–1104. [Google Scholar] [CrossRef] [Green Version]
  66. Martinez, P.; Souza, I.F. Genesis of Pseudo-Sand Structure in Oxisols from Brazil—A Review. Geoderma Reg. 2020, 22, e00292. [Google Scholar] [CrossRef]
  67. Klein, V.A.; Libardi, P.L. Densidade e distribuição do diâmetro dos poros de um latossolo vermelho, sob diferentes sistemas de uso e manejo. Rev. Bras. Ciênc. Solo 2002, 26, 857–867. [Google Scholar] [CrossRef] [Green Version]
  68. de Lima, R.P.; Rolim, M.M.; Toledo, M.P.S.; Tormena, C.A.; da Silva, A.R.; e Silva, I.A.C.; Pedrosa, E.M.R. Texture and Degree of Compactness Effect on the Pore Size Distribution in Weathered Tropical Soils. Soil Tillage Res. 2022, 215, 105215. [Google Scholar] [CrossRef]
  69. Zimmermann, B.; Helmut, E. Spatial and Temporal Variability of Soil Saturated Hydraulic Conductivity in Gradients of Disturbance. J. Hydrol. 2008, 361, 78–95. [Google Scholar] [CrossRef] [Green Version]
  70. Turner, F.T.; Sij, J.W.; McCauley, G.N.; Chen, C.C. Soybean Seedling Response to Anaerobiosis. Crop Sci. 1983, 23, 40–44. [Google Scholar] [CrossRef]
  71. Johnson, J.M.F.; Strock, J.S.; Tallaksen, J.E.; Reese, M. Corn Stover Harvest Changes Soil Hydrology and Soil Aggregation. Soil Tillage Res. 2016, 161, 106–115. [Google Scholar] [CrossRef] [Green Version]
  72. Page, K.L.; Dang, Y.P.; Dalal, R.C.; Reeves, S.; Thomas, G.; Wang, W.; Thompson, J.P. Changes in Soil Water Storage with No-Tillage and Crop Residue Retention on a Vertisol: Impact on Productivity and Profitability over a 50 Year Period. Soil Tillage Res. 2019, 194, 104319. [Google Scholar] [CrossRef]
  73. Yang, H.; Wu, G.; Mo, P.; Chen, S.; Wang, S.; Xiao, Y.; Ang Ma, H.; Wen, T.; Guo, X.; Fan, G. The Combined Effects of Maize Straw Mulch and No-Tillage on Grain Yield and Water and Nitrogen Use Efficiency of Dry-Land Winter Wheat (Triticum aestivum L.). Soil Tillage Res. 2020, 197, 104485. [Google Scholar] [CrossRef]
  74. dos Santos, A.K.B.; Popin, G.V.; Gmach, M.R.; Cherubin, M.R.; Siqueira Neto, M.; Cerri, C.E.P. Changes in Soil Temperature and Moisture Due to Sugarcane Straw Removal in Central-Southern Brazil. Sci. Agric. 2022, 79, 1–12. [Google Scholar] [CrossRef]
  75. Tenelli, S.; Bordonal, R.O.; Cherubin, M.R.; Cerri, C.E.P.; Carvalho, J.L.N. Multilocation Changes in Soil Carbon Stocks from Sugarcane Straw Removal for Bioenergy Production in Brazil. GCB Bioenergy 2021, 13, 1099–1111. [Google Scholar] [CrossRef]
  76. Tisdall, J.M.; Oades, J.M. Organic Matter and Water-Stable Aggregates in Soils. J. Soil Sci. 1982, 33, 141–163. [Google Scholar] [CrossRef]
  77. Blanco-Canqui, H.; Lal, R. Crop Residue Removal Impacts on Soil Productivity and Environmental Quality. Crit. Rev. Plant Sci. 2009, 28, 139–163. [Google Scholar] [CrossRef]
  78. Minasny, B.; McBratney, A.B. Limited Effect of Organic Matter on Soil Available Water Capacity. Eur. J. Soil Sci. 2018, 69, 39–47. [Google Scholar] [CrossRef] [Green Version]
  79. Cavalcanti, R.Q.; Rolim, M.M.; de Lima, R.P.; Tavares, U.E.; Pedrosa, E.M.R.; Cherubin, M.R. Soil Physical Changes Induced by Sugarcane Cultivation in the Atlantic Forest Biome, Northeastern Brazil. Geoderma 2020, 370, 114353. [Google Scholar] [CrossRef]
  80. Gmach, M.R.; Kaiser, K.; Cherubin, M.R.; Cerri, C.E.P.; Lisboa, I.P.; Vasconcelos, A.L.S.; Siqueira-Neto, M. Soil Dissolved Organic Carbon Responses to Sugarcane Straw Removal. Soil Use Manag. 2021, 37, 126–137. [Google Scholar] [CrossRef]
Figure 1. The theoretical framework applied in this study, which links soil physical and hydraulic properties to soil physical functions and then to one soil-related ecosystem service (water flow regulation).
Sustainability 14 00841 g001
Figure 2. Layout of the experimental plots with four straw removal rates in Iracemápolis, São Paulo, Brazil.
Sustainability 14 00841 g002
Figure 3. Timeline and activities during the experimental period (e.g., setting up of straw removal rates and soil sampling).
Sustainability 14 00841 g003
Figure 4. Diagram of the profile of a Cornell infiltrometer. H is the height of the water measured during the tests to calculate the intensity of the rain, infiltration rate, and runoff.
Sustainability 14 00841 g004
Figure 5. Percentage of soil water storage capacity (SWSC) and soil air content (SAC) in four soil depths ((a) = 0–0.05 m; (b) = 0.05–0.10 m; (c) = 0.10–0.20 m; (d) = 0.20–0.40 m) for four sugarcane straw removal rates in a clayey soil in Iracemápolis, São Paulo, Brazil. TR = 0 Mg ha−1; HR = 5 Mg ha−1; LR = 10 Mg ha−1; NR = 15 Mg ha−1. The dashed red lines indicate the critical limit of water and air ratio to root growth, as proposed by Reynolds et al. [40] (ideal ratio: SAC ~0.33, and SWSC ~0.66).
Sustainability 14 00841 g005
Figure 6. Soil water infiltration and runoff rates modeled from field data measured with a Cornell sprinkle infiltrometer for four sugarcane straw removal rates: (a) Total removal, equivalent to 0 Mg ha−1; (b) High removal, equivalent to 5 Mg ha−1; (c) Low removal, equivalent to 10 Mg ha−1; (d) No removal, equivalent to 15 Mg ha−1; in a clayey soil in Iracemápolis, São Paulo, Brazil. WI = Water infiltration rate. RO = runoff rate. t = elapsed time (minutes).
Sustainability 14 00841 g006
Figure 7. Soil saturated hydraulic conductivity measured with a constant head permeameter in four soil depths for four sugarcane straw removal rates in a clayey soil in Iracemápolis, São Paulo, Brazil. TR = 0 Mg ha1; HR = 5 Mg ha1; LR = Mg ha1; NR = 15 Mg ha1. * Means within each soil depth followed by the same letters did not differ significantly among themselves according to Tukey’s test (p < 0.1). ns, not significant (p > 0.1).
Sustainability 14 00841 g007
Figure 8. Scores of the individual indicators (spider graphic), soil functions, and water flow regulation index (ISES) for four sugarcane straw removal rates in a clayey soil in Iracemápolis, São Paulo, Brazil. TR = 0 Mg ha−1; HR = 5 Mg ha−1; LR = 10 Mg ha−1; NR = 15 Mg ha−1. Infiltration = water infiltration; Runoff = water runoff; Ks = saturated hydraulic conductivity; MiP = microporosity; SWSC = soil water storage capacity index (Reynolds et al. [40]); AWC = available water-holding capacity; f(i) = Water infiltration flux and water movement in soil; f(ii) = Water retention; f(iii) = Water availability to plants. * Means within each soil physical function followed by the same letters did not differ significantly among themselves according to Tukey’s test (p < 0.1). ns, not significant (p > 0.1).
Sustainability 14 00841 g008
Table 1. Soil indicators and functions were selected to compose the index for the provision of the water flow regulation ecosystem service for four sugarcane straw removal rates in clayey soil in Iracemápolis, São Paulo, Brazil.
Soil-Related Ecosystem ServiceSoil FunctionsIndicators (Proxies)
ISES—Water flow regulationf(i)—Water entrance flow and water movement in the soilp(i)—Infiltration rate;
p(ii)—Runoff rate;
p(iii)—Soil saturated hydraulic conductivity;
p(iv)—Macroporosity
f(ii)—Water retentionp(i)—Microporosity
f(iii)—Water availability to plants and organismsp(i)—Available water-holding capacity;
p(ii)—SWSC
Table 2. Soil bulk density, porosity, available water capacity for four soil depths and four sugarcane straw removal rates in a clayey soil in Iracemápolis, São Paulo, Brazil.
Straw Removal Rates PorosityWater Parameters
BDTPMiPMaPAWC
Mg m−3m3 m−3
0.0–0.05 m
TR *1.521 ns0.482 ns ± 0.0130.307 ns ± 0.1650.176 ns ± 0.1530.121 ns ± 0.055
HR1.5110.467 ± 0.0170.357 ± 0.0610.109 ± 0.0600.080 ± 0.049
LR1.4260.483 ± 0.0330.437 ± 0.0640.046 ± 0.0330.196 ± 0.151
NR1.5210.457 ± 0.0140.376 ± 0.0630.091 ± 0.0630.063 ± 0.063
0.05–0.1 m
TR1.694 ns0.401 ns ± 0.0150.385 ns ± 0.0260.016 ns ± 0.0160.129 ns ± 0.093
HR1.7130.402 ± 0.0090.368 ± 0.0200.034 ± 0.0290.085 ± 0.058
LR1.6040.438 ± 0.0430.436 ± 0.0420.002 ± 0.0030.268 ± 0.133
NR1.6450.428 ± 0.0320.333 ± 0.0790.127 ± 0.0690.115 ± 0.057
0.1–0.2 m
TR1.520 ns0.497 ns ± 0.0080.430 ns ± 0.0230.068 ns ± 0.0310.093 ns ± 0.011
HR1.4620.515 ± 0.0290.388 ± 0.0090.127 ± 0.0190.081 ± 0.010
LR1.5880.471 ± 0.0330.391 ± 0.0220.107 ± 0.0550.08 ± 0.025
NR1.4830.483 ± 0.0190.409 ± 0.0150.074 ± 0.0310.082 ± 0.011
0.2–0.4 m
TR1.514 ns0.493 ns ± 0.0060.430 ns ± 0.0190.062 ns ± 0.0240.099 ns ± 0.017
HR1.4410.487 ± 0.0400.416 ± 0.0210.071 ± 0.0560.088 ± 0.017
LR1.5550.453 ± 0.0440.394 ± 0.0030.078 ± 0.0440.102 ± 0.024
NR1.6570.451 ± 0.0240.393 ± 0.0170.058 ± 0.0410.093 ± 0.015
* Sugarcane straw removal rates: TR = 0 Mg ha−1; HR = 5 Mg ha−1; LR = 10 Mg ha−1; NR = 15 Mg ha−1. ns, not significant (p > 0.1).
Publisher’s Note: MDPI stays neutral with regard to jurisdictional claims in published maps and institutional affiliations.

