Article

Assessing Relations between Cultural Ecosystem Services, Physical Landscape Features and Accessibility in Central-Eastern Europe: A PPGIS Empirical Study from Hungary

by
István Valánszki
1,*,
Lone Søderkvist Kristensen
2,
Sándor Jombach
3,
Márta Ladányi
4,
Krisztina Filepné Kovács
3 and
Albert Fekete
5
1
Department of Landscape Protection and Reclamation, Institute of Landscape Architecture, Urban Planning and Garden Art, Hungarian University of Agriculture and Life Sciences, 1118 Budapest, Hungary
2
Department of Geosciences and Natural Resource Management, University of Copenhagen, 1958 Frederiksberg C, Denmark
3
Department of Landscape Planning and Regional Development, Institute of Landscape Architecture, Urban Planning and Garden Art, Hungarian University of Agriculture and Life Sciences, 1118 Budapest, Hungary
4
Department of Applied Statistics, Institute of Mathematics and Basic Science, Hungarian University of Agriculture and Life Sciences, 1118 Budapest, Hungary
5
Department of Garden Art, Institute of Landscape Architecture, Urban Planning and Garden Art, Hungarian University of Agriculture and Life Sciences, 1118 Budapest, Hungary
*
Author to whom correspondence should be addressed.
Sustainability 2022, 14(2), 754; https://doi.org/10.3390/su14020754
Submission received: 24 December 2021 / Revised: 5 January 2022 / Accepted: 7 January 2022 / Published: 11 January 2022

Abstract

:
Despite the growing quantity of ecosystem-services-related research, there is still a lack of deeper understanding on cultural ecosystem services (CES). This is mainly due to the perception of CES, which can vary by geographic location and population. In this study, we present a Public Participation Geographic Information System (PPGIS) method in a Hungarian microregion. Our goal is to increase understanding on how cultural services are perceived in this geographical context and level, and how this relative importance is related to biophysical landscape features. We also consider the influence of accessibility on the perceived landscape and compare our findings with the results of other studies with different sociocultural backgrounds. The research consists of participatory mapping with 184 persons that were digitized and analyzed with GIS and statistical software. During the analysis, we identified CES hotspots and compared CES with landscape features, as well as CES perception with accessibility. Our results showed positive correlation of CES with land covers related to built-up areas, as well as aesthetic and recreational services with water bodies. Compared to other studies, we found different spatial relationships in the case of spiritual services, and higher importance of agricultural land covers during the CES perception, thanks to the Central-Eastern European (CEE) sociocultural background. Our study highlights the effect of accessibility on CES perception; nevertheless, these relationships varied by different infrastructural elements. We conclude by discussing the implications and limitations of our study and encouraging future landscape research to apply the PPGIS method in this geographical context.

1. Introduction

Surveys of people’s perceptions, attitudes and values oriented by the landscape have taken place for decades, often with the purpose of satisfying demand for public participation in policy making and planning [1]. Since the introduction of ecosystem services in the 1990s, the concept has become significant in environmental decision making [2] as well as in guiding surveys of people’s perception of landscape values and environmental resource issues. Cultural ecosystem services (CES), defined as nonmaterial benefits obtained from ecosystems which influence quality of life and human well-being, have received increased attention in recent years [3,4].
However, despite a growing number of ecosystem-services-related research, there is still (1) a lack of deeper understanding of CES [5], (2) challenges in relation to its assessment and evaluation [6] and (3) challenges in relation to its integration in policy and planning [7].
Understanding CES better is challenging (1), as they can be identified and described universally; however, the relative importance of them varies geographically [8,9] and the perception of CES differs according to the sociocultural background of the communities and individuals [4,10]. In addition to the location (space), time is also a dimension that has to be considered, since some CES can appear and disappear over time in relation with people’s perceptions, driven by social and cultural changes [7]. CES assessment requires either indicator measures using existing databases (e.g., tourist attraction/m2) or empirical research approaches. In the latter, data collection is mainly carried out by specific surveys (e.g., extensive questionnaire surveys, in-depth interviews), often using participatory mapping [10,11]. Participatory mapping (PPGIS) is a general term used to define a set of techniques that merge modern cartographic methods with participatory methods to record and represent spatial knowledge of local communities. By such an approach, spatially explicit biophysical and perception-based data can be linked [12].
Participatory mapping has received increased attention in the last decade and reviews have been carried out in order to give an overview about the existing methods and main results of participatory mapping research [11,12,13]. These reviews showed the geographical pattern of existing studies; the majority of them are located in North America (e.g., [14]), Oceania (e.g., [15]), Northern Europe (e.g., [16]) and Western Europe (e.g., [17]). Recently an increasing number of studies have been published from Central-Eastern Europe (CEE), mainly focusing on local urban areas (e.g., [18,19]); however, we see a significant lack of CEE PPGIS studies on a regional/landscape scale. Such studies are especially important if we consider the geographical variation and the place and social background-dependent aspects of CES. After World War II, many CEE countries became members of the Eastern Bloc, where nationalization and centrally planned economies were the norm [20,21], with significant economic, political and social changes [22] including forced industrialization and agricultural collectivization. Following the collapse of the USSR, the sociopolitical transformation (in 1989–1990) also caused substantial effects on these countries [20,23], such as collapsing economies and the first steps of liberal democracies. 15 years later, EU membership influences the economic and political systems of many CEE countries (with the effects of new EU subsidies, rules and requirements). Finally, during the last decade, some countries of the eastern half of Europe have started to build up a hybrid form of governmentality that combines neoliberalism with illiberal logic [24].
In order to better analyze and evaluate CES (2), one of the most important tasks—and the greatest challenge—is to detect the relationship between services and biophysical features [25]. Land cover as physical dataset has been used most frequently in relation with CES, but other features have also been analyzed, such as roads, other built infrastructure, and protected areas [13]. Further, several research papers have analyzed the spatial correlation between clustered CES and biophysical features of landscapes [4,6,12]. Researchers refer these clustered services as ecosystem service bundles [26]. In recent decades, several studies have been published from very different locations, analyzing relationships between CES and landscape features [4,27,28,29]. Similarly, CES bundles have also been studied in various geographical contexts, mainly in North America (e.g., [26]) as well as in Northern and Western Europe (e.g., [30]). Despite many similarities, results also show differences that vary by geography [12]. CEE is still missing in CES evaluation studies, though we must expect differences in results compared to western countries due to differences in sociocultural characteristics.
During the identification and evaluation of CES, the role of accessibility emerged as highly important [10,31]. In relation with accessibility, especially recreational [32] and aesthetical [31] services have been commonly analyzed. The increasing number of studies in this field indicated significant effects of infrastructural elements on the perception of CES; however, the level and direction of effects vary among different types of elements (e.g., secondary roads, hiking paths) and landscapes with different biophysical and socioeconomic contexts [12]. These sophisticated differences among various elements are still less studied.
The motivation to apply PPGIS and assess CES and values is most often to inform and improve landscape planning and management (3) [27]. More specifically, CES assessments have been carried out in order to improve the planning and management of land uses [33], protected areas [15], urban green infrastructure [18], rural areas [34], forest management [35], recreational planning [32] and coastal areas [36]. Despite the increasing number of PPGIS applications, workshops and publications [36], CES mapping is still underdeveloped [5] and the integration of them in planning and other policy areas is weak [37,38].
The main reason for the lack of integration policy and planning is the lack of deeper understanding on what is actually being mapped [39]. The mapping process can influence the outcomes, and in this way limits their utilization in decision making, because the process depends on the participants’ acquaintance with the area and their familiarity with the mapping procedure [39]. It is also unclear how the outcomes fit into the ecosystem services cascade model, which makes a clear distinction between the ecological structures, processes, functions, ecosystem services and the benefits and values that people derive from services [4,40]. This model presents the elements that need to be considered in ES analysis and the relationships among services. However, compared to the other services, in the cases of CES the levels of services and benefits are hardly distinguishable [7].
The aim of our study is twofold: (i) to increase the understanding on how CES, on a regional landscape level, are perceived in a CEE geographical context, including how CES are clustered and related to biophysical landscape features; and (ii) to compare our findings with the results of other studies to detect the differences and similarities in relation with various socioeconomic backgrounds. To explore these issues, we took Hungary as one of the most suitable examples in the CEE region. We hypothesized that all of the CEE-specific historical milestones have an effect not only on general political, economic and social systems, but also on the locals’ perception and appreciation of the various landscape features, and in this way on CES. Our study can help to better understand the effects of national/regional culture and political structure on CES perception by discovering differences and similarities with other works. We hypothesized that there are some universally true regularities in the perception of CES; however, we can discover differences due to the aforementioned historical, social and political systems, which show some specificity for the CEE region. In relation to the integration of CES perceptions in planning and policy, our results contribute to a deeper understanding of what and why things are being mapped through analysis of the relationships between CES and land cover, how CES tend to cluster spatially and the influence of accessibility on CES perception. Compared to existing studies, the latter is new, and according to our hypothesis, in this case accessibility (roads, motorways, railways, and also hiking trails and bike roads) has a strong positive influence on the CES perception.

2. Materials and Methods
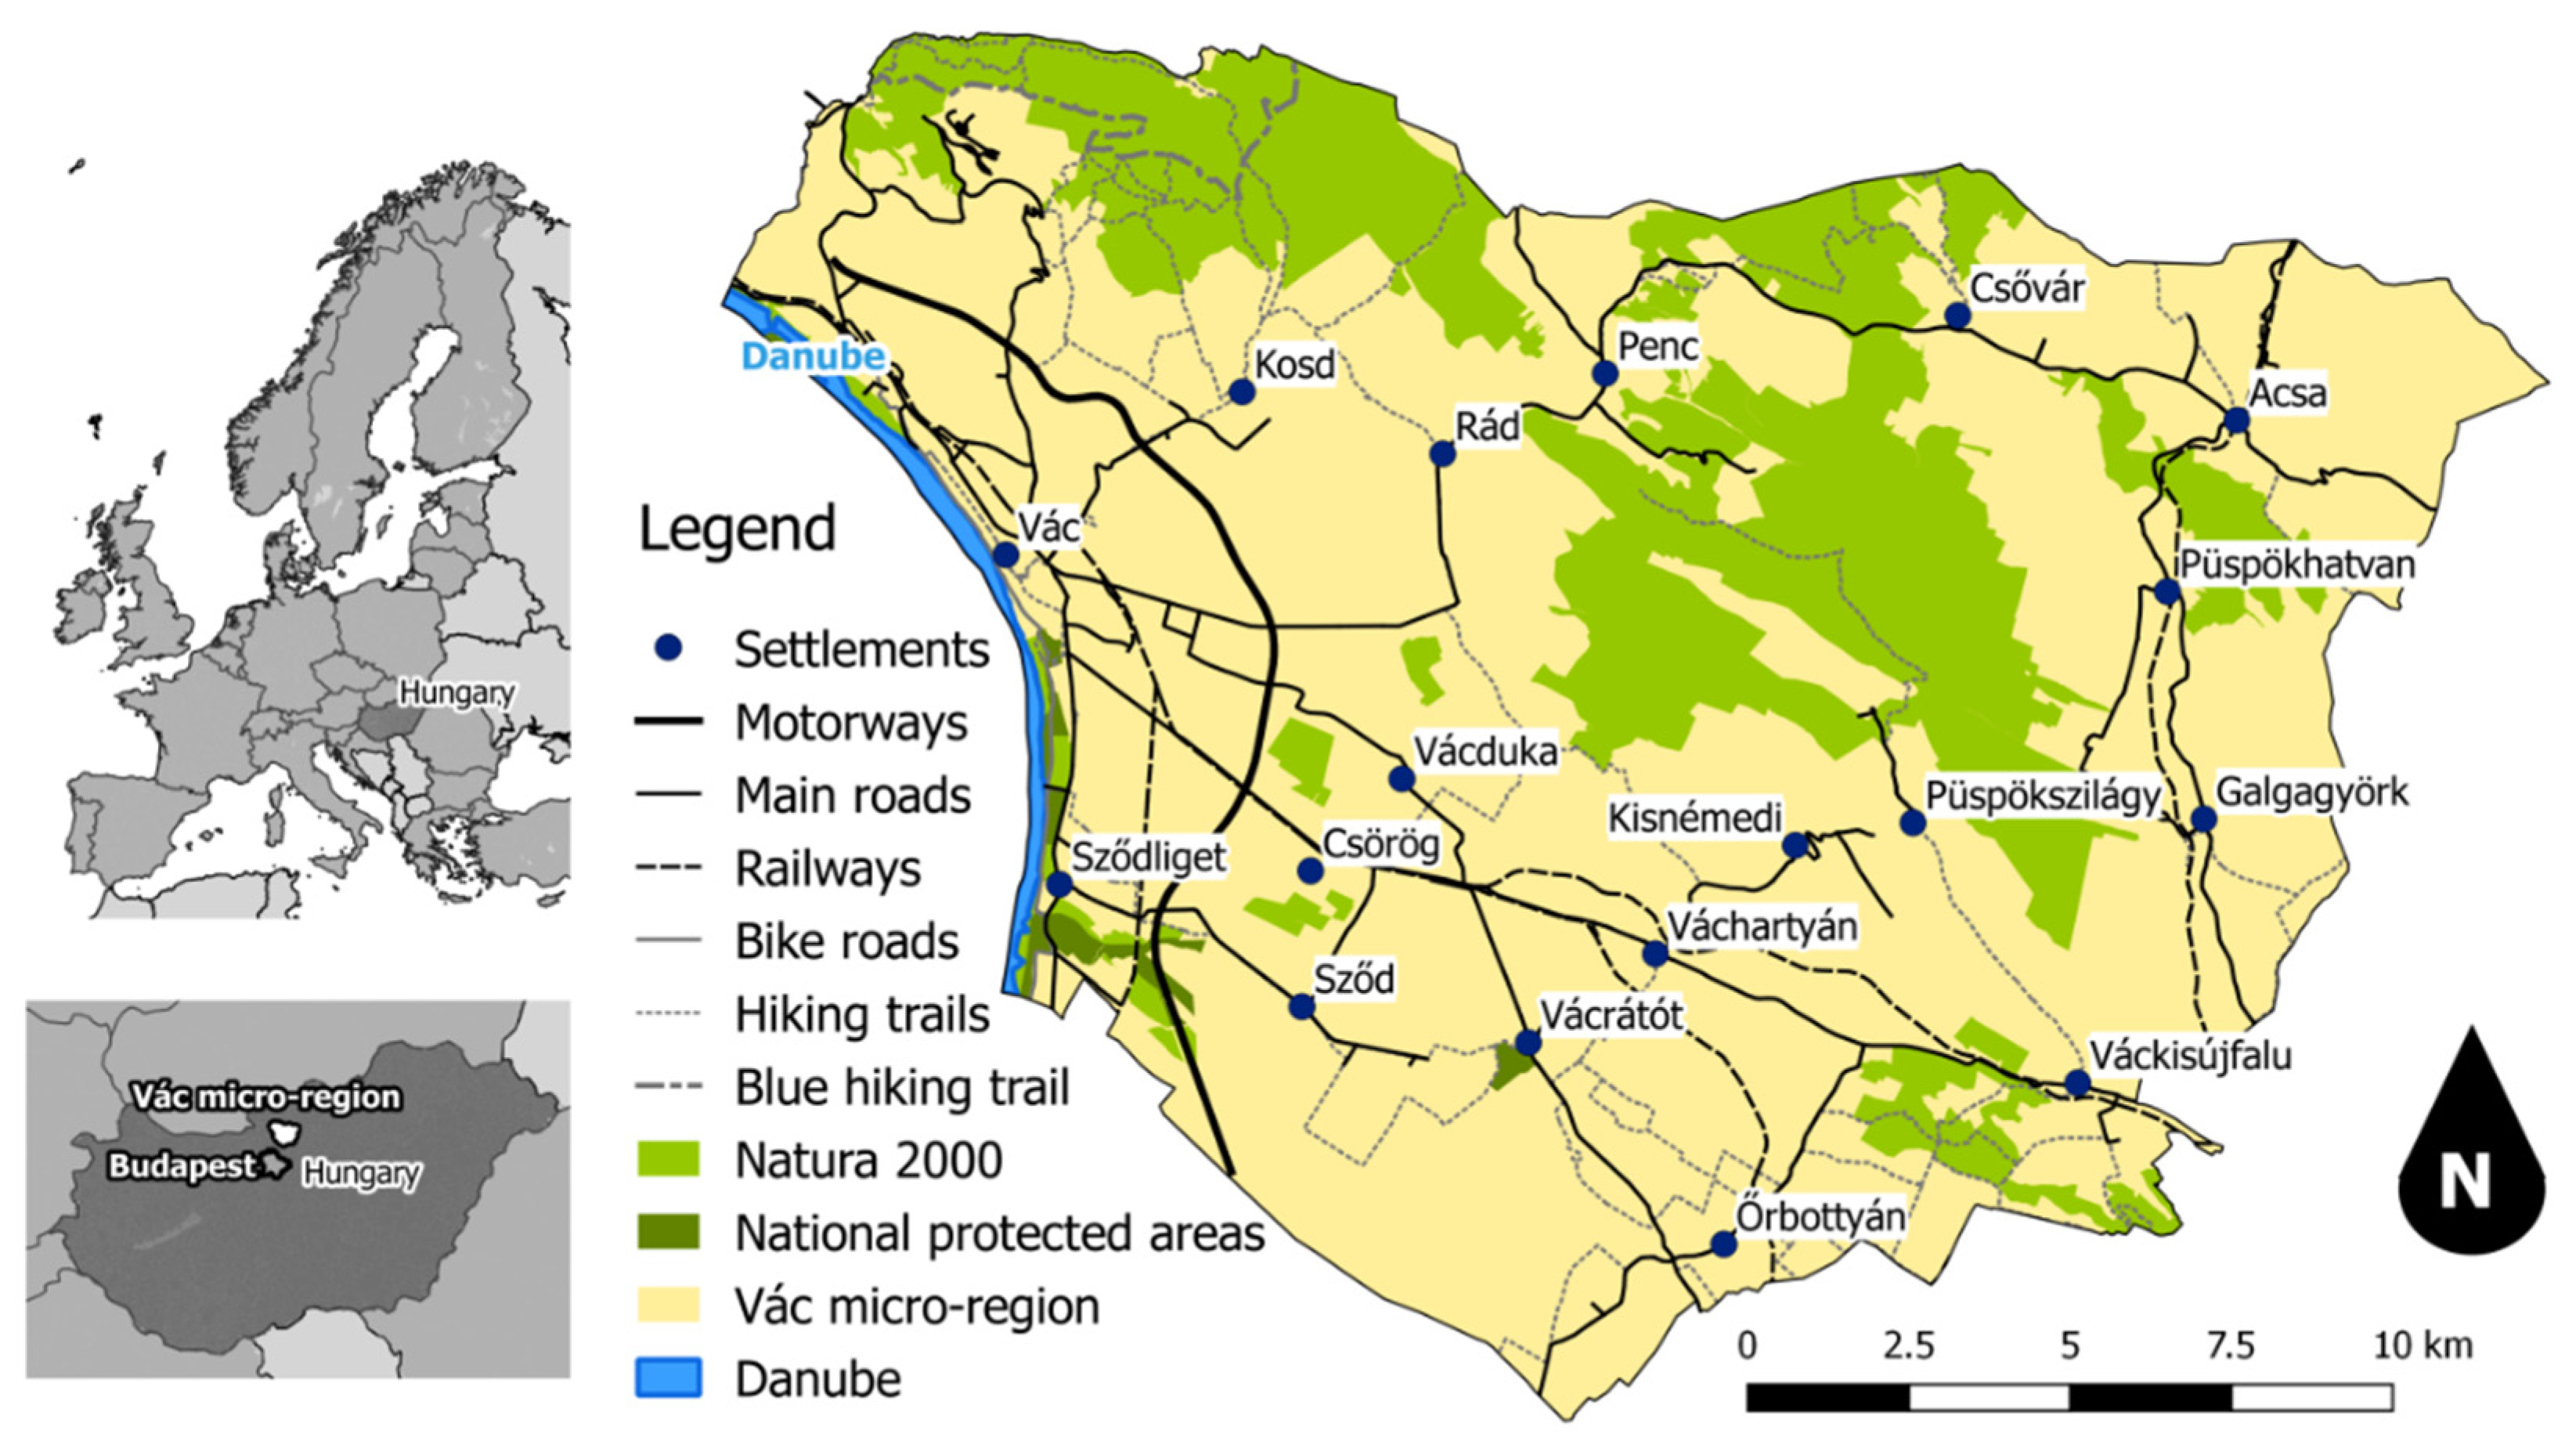
2.1. Study Area

The research was carried out in the microregion of Vác, located in central Hungary, at the very edge of the Budapest Agglomeration Region. Microregions in Hungary represent the level of the Local Administrative Unit (LAU) level 1 in the statistical system of Eurostat. The LAUs are administrative for reasons such as the availability of data and policy implementation capacity [41]. Covering a total area of 36,208 ha and having 69,100 inhabitants [42], the study area contains 18 municipalities: two towns (Őrbottyán, Vác), and sixteen villages (Figure 1). The center of the microregion and the largest settlement is the town of Vác (extent: 6156 ha; 34,298 inhabitants), while the village of Sződliget has the smallest area (728 ha; 4605 inhabitants), and the village of Váckisújfalu has the lowest number of inhabitants (1069 ha; 480 inhabitants) [42].
The study area comprises a wide range of land cover types, dominated by arable land (38%), forests (mainly broadleaved and mixed forests) (26%), heterogeneous agricultural areas (11%) and urban fabric with industrial, commercial and transport units (9%) [43] (Figure 2). 24% of the study area is under international protection (Natura 2000 Network of protected areas) [44], and 0.7% is under national protection [42]. The climate is typically moderate continental, with an annual rainfall around 600 mm and an average temperature of 10 °C. The landscape is diverse, with the river Danube, located on the western border of the study area, and the Naszály Mountain, with the highest point of the microregion (652 m), as the most dominant elements.
The suburbanization and agglomeration effects of Budapest are most significant in the western (around the microregional center, Vác) and southwestern parts (e.g., commuting effect, strong service and industry sectors, high proportion of built-up area, highly developed transport system) while the eastern part of the study region is a typical rural area (small villages, significant natural values, high proportion of agricultural and forest land uses). It should also be stressed that agglomeration pressure is still less noticeable in a large part of the study area (two-thirds of it is not administratively part of the Budapest Agglomeration Region). However, it is also true that in the future (with the growth of agglomeration) the process is expected to be more remarkable throughout the whole study area. The most significant cultural values are concentrated in the historical town center of Vác; however, there are small castles, castle ruins, and study trails also in the East of the area. The most important infrastructural elements are the highway M2 crossing the western side of the study region, and parallel with this, the main railway line along the river Danube.

2.2. Typology and Indicators of CES

The CES typology used in this study follows the existing participatory research-related service and value classifications [4,45,46,47]. However, considering discussions with researchers and practitioners from Hungary and abroad, we decided to leave out some services (e.g., inspiration, intrinsic, wilderness) since they could not be simply transformed into well-understandable and meaningful questions for the participants. Finally, five CES were selected: aesthetic, recreation, spiritual, historic and educational services (Table 1). Inspired by Plieninger et al. (2013) [4] and Fagerholm et al. (2016) [47], the indicators of cultural services were developed using an operational description per service in order to guide the participants to response.

2.3. Data Collection and Sampling Approach

Data collection took place in September 2017 and in April 2018 involving bachelor’s and master’s students of Szent István University, Faculty of Landscape Architecture and Urbanism. A map and a basic questionnaire about the participants written in Hungarian were used during the interviews. In advance, the clarity and usability of them were discussed and pretested by colleagues and bachelor students of landscape architecture [4].
During the face-to-face interviews, we used paper maps (A3 format, at 1:120,000) in order to reach the highest rate of responses [34], and for the involvement of wide range of social groups. The chosen method was appropriate for avoiding potential mistakes, since having close interaction with the interviewed meant that unclear issues could be easily resolved. As a base map, a VHR satellite of Google Earth was employed that is also easily understandable for non-professionals [48]. The borders of the study area and the names of the settlements were marked on the map for an easier orientation. We asked the participants to use the more effective and simple point markers [49]. These could also fit better in the base map because of the regional scale of the study area. In all types of CES, three markers were employed in order to keep an easily mappable number of points, but not to force the involved locals to use only one important point per category.
Each inquiry took 15–20 min, starting with the questions on basic sociodemographic characteristics (home settlement, age and gender) of the participants [29] followed by the mapping process. During the survey, we paid attention to the geographical balance, including how the number of inquiries varied according to the size and population of the settlements [47]. Participants were approached in many different public locations, such as cafes, parks, railway stations, bus stops, health care centers, schools and shopping centers, to make contact with a high number of persons representing a wide range of the local population [47].

2.4. Spatial Data Preparation

The assigned CES were digitized in Quantum GIS (ver. 2.18) software. The database contains the geographical location of the services and the associated data (types of services, sociodemographic characteristics of participants, etc.). We used layers of CORINE Land Cover [43], Natura 2000 areas [44], nationally protected areas [50], roads, railways, hiking trails and bicycle paths [51] in the overlay analyses. CORINE land cover categories were merged into 11 categories suitable for the geographical context of the study area; we merged the urban fabric with the industrial, commercial and transport units, and we excluded two irrelevant categories in this region (maritime wetlands and marine waters) (Figure 2). For the accessibility analyses, distance bands were generated along the infrastructural elements within distances of 200 [12,47], 500, 1000 and 1500 m. Similarly, in cases of two land cover classes (forests, water bodies), 200 m of distance bands were elaborated [47].
All layers were clipped to the boundaries of the Vác microregion study area and spatially intersected with the marked CES. This way, every point of cultural services had an associated land cover class similar to Brown et al., 2015 [6]. The protected area data and the elaborated distance bands, along the infrastructural elements, were also overlaid with all types of CES [38,47].
In order to indicate proportional under- or over-representation of CES, the area of land cover types, protected areas and distance bands were calculated by Quantum GIS (ver. 2.18) software [38,47]. To determine CES bundles, a 2 km vector grid (fishnet) was overlaid with the study area [52]. The number and type of CES, as well as the proportion of each land cover class, were tabulated within every grid cell [6].

2.5. Data Analyses

The analyses contained identification of hotspots, comparison of CES and landscape features, identification of CES bundles and comparison of CES perception and accessibility. During the comparisons, all the points marked by different CES types were analyzed separately. In the statistical analyses, Excel 2016 and IBM SPSS (ver. 25) software were used.

2.5.1. Identifying of CES Hotspots

Kernel quadratic function was used in order to create a continuous intensity surface from the mapped CES points layer [53]. This analysis is commonly employed in PPGIS studies to present the spatial intensity of cultural services [11,28,54]. The applied Kernel density radius of 500 m with grid cell size 50 m was suitable to the scale of the study area. In this way, we could identify the areas with a higher density of points and define the CES hotspots considering the results of similar research [11,12,54].

2.5.2. Analyses of Relationship between CES and Landscape Features

In order to examine the relationship between CES and landscape features (CORINE land cover classes, protected areas, buffers of forests and water bodies), two types of statistical methods were used. In the first step, cross-tabulations, chi-square statistics, and the adjusted standardized residuals were generated. These methods are commonly employed in PPGIS-related research to examine the distribution of services by landscape features (e.g., [6,38]). Chi-square test was performed to determine the independency between CES types and land cover classes, as well as to detect significant correlation between category-type variables. We used adjusted standardized residuals to define whether the number of mapped cultural services were over- or under-represented in a land cover class or protected area, with the criteria of the adjusted standardized residual being above 1.96 or below −1.96, respectively [55]. This method does not consider the areal proportion of CORINE land cover classes within the study area. During the first step, three land cover classes (mine, dump construction; permanent crops; wetlands) were excluded because of their very small number of tabulated CES points.
As a second step, Z-test for proportion comparison was performed in order to define whether the mapped CES type scores were distributed similarly to the landscape feature proportions [6]. Z-scores higher than +1.96 (two-tailed test, α = 0.05) showed that the proportion of CES located within a given landscape feature were significantly higher than expected, while Z-scores lower than −1.96 showed the proportion of CES that were significantly lower than expected [6].

2.5.3. Assessment of Spatial Bundles of CES

Several methods were applied to determine the spatial relation between pairs of CES. The 2 km vector grid resulted in n = 117 cells, from which the cells without any point were excluded; finally, therefore, we calculated with n = 84 grid cells. In the cases, located at the border of the study area, the size of grid cells was smaller than 4 km2. To make the cell scores comparable, in these cells the numbers of tabulated points were scaled in proportion of 4 km2 unit. The numbers of the assigned points of the five CES types were recoded into five categories in order to make them suitable for nonparametric methods: 0 » 0; from 1 to 5 » 2; from 6 to 10 » 3; from 11 to 25 » 4; above 25 » 5. In the same way, the numbers of the assigned points of the 11 land use types were recoded: 0 » 0; from 1 to 10 » 2; from 11 to 25 » 3; from 26 to 60 » 4; above 60 » 5. These recoded scores were then used for statistical analyses. We performed hierarchical cluster analysis based on squared Euclidean distance with the Ward method [56]. Pairwise Spearman’s rank correlation coefficient was also calculated for all CES type pairs [4,12]. Moreover, the proportions of land cover classes were also calculated in each grid cells [6]. Correlation coefficients ranged from −1 to +1, with the strongest correlations approaching either end of the gradient, and a value of 0 showed a random pattern [52,57]. We filtered the most important land use categories arising in cells where a pair of CES types had either medium or high values (≥3).

2.5.4. Accessibility and CES Perception

For accessibility analyses, different methods were used inspired by previous PPGIS-related research (e.g., [12,38,54]). To examine the distribution of CES in the elaborated distance bands of infrastructural elements, we used proportional analysis [38]. Z-scores were generated in every distance band for each type of infrastructural element separately (motorways, roads, railways, bicycle paths, hiking trails). During this analysis, the same critical values were used as in the case of correlation analysis between CES and land cover classes.

3. Results

3.1. Participants Characteristics

The total number of participants was 184, balanced according to the population of the 18 settlements (Table 2). The highest number of involved locals lived in the biggest town and the center of the study area (Vác–14.1%). Almost 10% of the respondents came from one of the other three bigger settlements (Acsa–8.7%, Őrbottyán–8.2%, Sződliget–8.2%), while the lowest numbers of participants (2.7% of each) came from the smallest villages (Kisnémedi, Váchartyán, Püspökszilágy, Vácrátót). Women were over-represented with 67.4%, while men were 32.6% of the involved locals (average of the region: men–48.3%; women–51.7%) [42]. Only 9.2% of participants were under 25 years old, while 32.6% were above 55, and 58.2% were between 25 and 55. In total, 2700 CES points were mapped and digitized.

3.2. Spatial Patterns of Mapped CES and Distribution of Hotspots

The spatial distribution of services hotspots differs among the analyzed CES types (Figure 3). The most significant and only common hotspot among CES is the historical downtown of Vác, the biggest settlement of the study area. Aesthetic services are mostly concentrated along the river Danube (at the western border of the region), in the highest mountain (Naszály, located in the northwest areas), and around the ruins of Csővár Castle (northeast). Most marks of recreation services were allocated along the river Danube, around small water surfaces (southwest and northeast parts), at the Arboretum of Vácrátót (south), and at the swimming pool of Acsa (northeast area). The spatial patterns of spiritual and historic hotspots are likely similar; the highest intensity of services was observed in downtown Vác; at the churches and centers of bigger settlements; as well as around the smaller castle of the study area (e.g., in Acsa). The most significant difference between hotspots of these two services is at the ruins of Csővár Castle, which was important only from a historic point of view for the locals. Considering educational services, we found hotspots in downtown Vác, and around the Arboretum of Vácrátót. A lower intensity of marks was observed at the study trails of the region (e.g., in Naszály mountain; southwest areas).

3.3. Mapped CES and Their Spatial Relationship to Land Cover Classes and Protected Areas

The distribution of CES by land cover was examined using proportional analysis. As Table 3 shows, Z-scores are positive and significant for all CES in land covers related to built-up areas (urban fabric; artificial, non-agricultural vegetated areas) with the only exception being spiritual services, where no significant spatial association was found with the artificial, non-agricultural vegetated areas. Further, water bodies have significant positive correlation with aesthetic and recreational services, while significantly higher-than-expected aesthetic marks were identified in mine, dump and construction land cover type. The highest Z-scores were for historic, spiritual and educational services in urban fabric. In all the other land cover classes, the mapped values were under-represented or there was no significant correlation.
We also calculated the Chi-square association that does not assume that CES are distributed proportional to land cover area. The Chi-square adjusted standardized residuals are presented in Table 4. Similarly to the proportional analysis, historic, spiritual and educational services were significantly over-represented in urban fabric. Several points of recreational and educational services were found in artificial, non-agricultural vegetated areas. The adjusted standardized residual values were also positive and significant in water bodies for aesthetic and recreational services. However, in almost all the other land cover classes, the results of aesthetic and recreational services were different than in the proportional analysis. They were significantly over-represented in arable land, heterogeneous agricultural areas and forests. The highest adjusted standardized residual was observed for aesthetic service in forests, pointing out significant positive correlation. We could not find any spatial association of CES in grasslands and pastures while historic, spiritual and educational services were mainly significantly under-represented in non-built-up areas.
The relation between protected areas and mapped CES was also examined separately. Z-scores are significant and positive for aesthetic services, both in international and in national protected areas (Appendix A). The highest Z-scores were found in the cases of recreational and educational services in national protected areas. We had the same results applying adjusted standardized residual analysis, with the only exception being aesthetic services, which was significantly under-represented in national protected areas (Appendix B).

3.4. Assessment of Spatial Clustering and Bundles of CES

The hierarchical cluster analysis based on squared Euclidean distance with the Ward method showed very similar results to the Spearman’s rank correlation (Appendix C). The strongest and most significant spatial Spearman correlation was found between the pairs of historic–spiritual (0.67; p < 0.001) and educational–spiritual services (0.66; p < 0.001). Further, the pair of aesthetic and recreational services also showed a strong significant correlation (0.62; p < 0.001). Based on these pairs, as the dendrogram of Ward Linkage shows (Appendix C) that we can identify two bundles of the analyzed CES: one is the historic–spiritual–educational; the other is the aesthetic–recreational. In addition, recreational services are usually perceived together with historic and educational services, which is proved also by significant Spearman correlations (recreational–historic: 0.52; p < 0.001; recreational–educational: 0.42; p < 0.001). However, the weakest still-significant correlation was found between aesthetic and spiritual services (0.23; p < 0.05).
The five identified pairs of CES (Aesthetic–Recreational; Recreational–Educational; Recreational–Historical; Historical–Spiritual; Spiritual–Educational) were compared using the coded scores of land cover classes. We filtered the cells for which both members of the pair had more than five CES marks (with codes >= 3) and called them “highly double-marked cells”. For these filtered cells, we ordered the land cover types of the cells by their average coded land cover ratio scores (see 2.5.3) to find out the main land cover types of these cells. All the highly double-marked cells resulted in the same four land cover types in the first four places. The urban fabric and arable land were found as the first and second in this order (with their average code scores ranging from 1.96 to 2.53 and from 1.91 to 2.38, respectively). Forests and heterogeneous agricultural areas came in the third and fourth places (with their average code scores ranging from 1.56 to 1.77 and from 1.3 to 1.77, respectively).

3.5. Distribution of CES by Accessibility (Roads, Motorways, Railways, Biking Paths, Hiking Trails)

Z-scores of CES by distance bands showed an interesting pattern (Table 5). We found that roads, railways, bicycle paths and hiking trails had a significant positive effect on the perception of all analyzed CES. However, this effect varied by types of infrastructural elements. The proportion of mapped CES along roads and railways were significantly greater than expected for the closest 2–3 distance bands. The range of this effect along bicycle paths was similar; however, the Z-scores were much higher in the closest band. Similar significant positive spatial correlations were found in the case of hiking trails; nevertheless, the effect was detected only in the closest zone of the trails. Insignificant or significant negative correlation was found in distance bands above 200 m. Analyzing the National blue hiking trail separately, only the mapped aesthetic services were significantly greater than expected; however, in this case the effect was detected in a wide buffer zone (up to 1500 m). Our results show in almost all cases significant negative spatial correlation along motorways for bands below 1500 m. Parallel with this, we found significant positive correlation beyond a 1500 m distance of motorways.

4. Discussion

4.1. Mapping Outcomes and CES Hotspots

In comparison with other studies, our findings confirmed the following: the CES types appear in spatial patterns and they are concentrated in hotspots (e.g., [12]); these patterns differ among CES types (e.g., [54]); the spatial concentrations of recreation and historic services are higher than other services (e.g., [47]); the importance of water surfaces and diverse topography related to aesthetic and recreational services (e.g., [58]); the relevance of the surrounding environment and visibility of a characteristic landscape element [31].
Contrary to other studies [12,25], the distribution of spiritual services clustered highly in our case. These services included mainly bigger religious assets such as churches, whereas smaller sacred objects (e.g., crucifixes) showed less or no significant impact on the locals. An explanation of the clustered spiritual services may be the active Christian tradition in Hungary, as many people still use the service of the churches, whereas the lower-scale sacred objects are unknown by most people. Compared to many other CEE countries, during the socialist era in the Hungarian countryside, Christian traditions were able to stay relatively strong. Nowadays, the new direction of governmentality with illiberal logic and strong national identity [24] in many CEE countries (e.g., Hungary, Poland) also supports Christianity. Based on our results, the non-religious side of spirituality (e.g., nature, wilderness) does not play as important a role as in many other regions of the world (e.g., Northern Europe).
The importance of local small-scale recreational infrastructure was also highlighted (e.g., swimming pool of Acsa). Landscape perception theoretical frameworks can explain these results. As Morin (2020) [59] highlighted, landscape perception is based on identity and subjectivity, but also on various aspects of social systems (e.g., social class, religiosity). During this process, the importance of feelings and their recognition are crucial [60]. These feelings can be enforced by those landscape elements, which can provide new workplaces and diversify social/recreational activities [61]. This is of particular importance in the study area, as it is located in the vicinity of the Budapest Metropolitan Area, from where it is easily accessible for tourists and recreation seekers. The importance of this potential has increased in recent years thanks to the COVID pandemic (easily accessible, yet close to nature and less crowded). Local people identify this potential during the perception of recreational assets, since these can have a positive impact on the local economy. In many cases, the hotspots reflected those places, which were popularized by local representatives or decision makers (e.g., swimming pool in a village), rather than places, where the participants had own experiences. Our results showed that among the factors influencing participatory map outcomes, the culture of participants is more important in countries with a strong role of the state/government (e.g., in many CEE countries), than in Western European and North American societies with long traditions of liberal democracy. The understanding of culture in this case covers shared values, knowledge and practices of local representatives [39].
Increasing agglomeration pressure in the near future is expected to affect CES in the study area in different ways. One part of them may become more valuable (e.g., recreational services), as one of the main motivations for people moving out of the nearby capital is to seek these values in their daily lives. However, several researchers highlight that more attention should be paid to peri-urban ecosystem services in order to elaborate the most effective resource management and policies to decrease the negative demographic and land use impacts [62,63]. One of the most important negative impacts of this process on CES can be that despite of its many economic and cultural advantages, it can destroy the relationship between places and people [64].

4.2. Bundles and Role of Land Cover in Perception of CES

With the statistical analysis, we found the following similarities with previous studies: the built-up areas are associated with all types of CES (e.g., [29]); forests provide high levels of aesthetic and recreational services (e.g., [6]); grasslands and pastures are not associated with CES (e.g., [58]); with the exception of aesthetic service, international protected areas also have no spatial association with perceived CES (e.g., [47]); a proven aesthetic–recreational bundle (e.g., [12]); CES bundles and pairs appear mainly in or around settlements (e.g., [65]). Further, green areas (artificial, non-agricultural vegetated) such as parks, tree alleys and sport fields located within the settlements provide high levels of CES (especially recreational and educational services). The importance of these areas is expected to increase in the future due to growing suburbanization pressure, even in the peripheries of the agglomeration region. This calls for increased attention on these areas in regional planning and development [10].
Several differences were also found. Surprisingly, aesthetic services were significantly over-represented in mine, dump and construction land cover types. The explanation of this might be the visually important location of the mine site (on the southern slope of the highest mountain) in our study area. We may therefore conclude that a diverse topography is more important than land cover for people’s aesthetic judgment. Other explanations can be that locals prefer the heterogeneous structure of different land covers [47], even if this heterogeneity is caused by an artificial land use.
Interestingly, land cover types related to agriculture, aesthetic and recreational services were significantly over-represented. We found also spatial correlations between CES bundles and the arable land cover type. The explanation could be that hiking trails and water bodies are integrated into the surrounding agricultural landscape; further, open agricultural areas offer the most beautiful views of the surrounding mountains, forests and diverse landscapes. Another explanation is the general preference of the locals for traditionally managed landscapes [25], as the study area is mainly a rural landscape representing the agrarian character and the identity of the country. Despite the importance of agriculture decreasing during the almost half-century-long Communist era, agricultural activities still played a significant role in the Hungarians’ lives. On one hand, many people living in the countryside were working in the agricultural sector. On the other hand, many of those, who had been employed in the industrial sector, also owned small pieces of land for their own use. After many decades, this value of agricultural (especially arable) land still exists in people’s minds. Based on these, one can argue that not only the current political principles, but also the historically common values of societies, have a strong influence on CES perception. On a political level, and in rural development strategies, the development of agriculture has a strong priority, especially those sectors which have a higher added value, as horticulture and wine production form regional identity. However, the facts show a drastic reduction in the number of people employed in agriculture in recent decades due to structural changes [66], a trend which is set to continue in the future. As a result, the sector will not provide any meaningful employment opportunities either for the local population or for the population of the surrounding area (e.g., Budapest Agglomeration Region).
Our internationally protected-areas-related results run counter to research findings in non-European contexts [67]. A reason might be that the study area is dominated by rural landscape and that nature conservation interest is less obvious [12]. Another explanation could be that the implementation of Natura 2000 was not completely successful. As Blicharska et al. (2016) [68] and Maczka et al. (2019) [69] highlighted, stakeholder involvement is a key factor for success. In CEE countries which joined the EU from 2004, the Natura 2000 implementation was too fast, and they have no tradition of a broad stakeholder inclusion and are still characterized by top-down governance [68]. In contrast, our findings related to national protected areas showed highly significant positive spatial association (recreational and educational services). The reason could be that in Hungary, awareness and appreciation of national protection is higher than the international protection, thanks to the awareness-raising activities of public authorities focused on the national protected areas.

4.3. Effect of Accessibility on Perception of CES

Paracchini et al. (2014) [10] highlighted that people prefer places with good accessibility, which was confirmed and detailed further by our findings. The differences between the positive effects of various infrastructural elements can be explained by different user-groups and by different landscape experiences along these elements. Thanks to the construction and spatial design of roads and railways, people can observe and experience the surrounding landscapes for longer distances. However, for the same reason, and thanks to the average speed of vehicles using the roads and railways, the experience cannot be so strong and direct. Compared to these, users of bicycle paths and hiking trails can observe and feel the surrounding landscapes directly and more intensively. Nevertheless, this effect can be witnessed only in closer zones of trails and paths. In contrast, our findings showed significant negative correlations along motorways. This can be explained by the planning and landscape design and speed limit of these artificial elements isolating travelers from the surrounding landscapes, so they cannot realize their values along the motorways.

4.4. Implications for Landscape Planning in CEE

Our study gives practitioners new knowledge on how CES are perceived and valued by locals in CEE. The results (identified hotspots, CES bundles, relationships between CES and land cover types, protected areas, accessibility) help the planners and decision makers to better understand what kind of effects can have their strategies, plans and the general sociopolitical background on people.
Several authors complained about the lack of integration of social values into planning and management (e.g., [12]), and thus stressed a frequent need to link policy development to wider sociocultural factors [4]. Despite these arguments, landscape planning and management in CEE is still based on mainly expert-led approaches. Our results can help to bridge these gaps in order to reach more inclusive plans and strategies. The applied method can connect the different levels of the cascade model, since the services and their benefits are spatially identified and combined by the beneficiaries [61]. These may significantly help in communication among diverse stakeholders, planners and decision makers about future development [69]. The identified hotspots can be also integrated into the strategy-building process in order to provide more efficient protection of cultural values and valuable places. Further, our accessibility-related results can serve as a base for more targeted development plans in order to enhance the landscape experience of locals and tourists. In addition, the application of this method can improve identity and raise the awareness of CES in the region. This effect may build trust and increase the support of future sustainable development projects.
However, since every (social and cultural) context is different, the application of participatory methods is advisable in each situation. On local and regional scales, the PPGIS tool is especially important and useful during the spatial data collection process, assessment of landscape characters, and in discovering the relationships among diverse stakeholders and CES. Our results showed that in CEE countries these relationships are vital, as this knowledge can help to promote acceptance and improve the co-management of developments among locals. In addition to landscape planning and management, these can contribute to a deeper understanding of the current social processes, and by extension to respond them in a targeted manner. Similar implications are possible on higher (e.g., national) scales; furthermore, the discovered CES bundles may narrow the assessment effort by reducing the number of indicators in CES studies [4].

4.5. Challenges and Study Limitations

Among the limitations of our research, it must be noted that we had to tailor the number of involved types of CES to reflect the average socioeconomic and cultural background of the participants in our study site. First, we tested our method with a bigger amount of commonly used CES; however, the participants had difficulties understanding the differences among them, and as it was an on-site survey, this larger quantity of CES caused a deterioration in the accuracy of marks.
During the fieldwork, we paid attention to the geographical balance; nevertheless, we still had sampling bias, mainly on the factor of age. This bias also appears in other PPGIS research [70], and the level of its influence on the results is still uncertain [38]. In relation to the sampling issue, other factors, such as the respondents’ relationship to and knowledge of the study area, are also very important [12]. In our work, we were focusing on local citizens generally; however, we were also aware of the importance of other special stakeholders, e.g., tourists and landowners. These groups may identify CES differently [4] and may slightly modify our results.
Another problematic aspect is the identification of landscape boundaries, which is especially difficult in the case of research focused on CES [2]. In some studies, participants were allowed to put markers outside the study areas [12]; however, to avoid more confusion among participants, we allowed them to mark services only within the administrative borders of the study area, even though we lost some important CES around the site.
We used hard-copy maps in order to produce a higher response rate [71] since some important local groups (e.g., older people) did not use or have access to the internet or smartphones. An increasing number of PPGIS studies are based on web-based surveys [70] which enable a bigger map scale and increase the accuracy of data. Less accuracy of data and a smaller map scale are limitations of this study. Based on our Hungarian experiences, we encourage using manual mapping in addition to web-based surveys. Other limitations are related to the statistical and spatial analyses, since there are many methods and parameter choices used in such studies [72]. These methods and parameters can influence our results; however, our choices were based on careful literature review and the overall background of the study area.
An interesting future research topic is to analyze the relationship between agglomeration location and the perception of CES, which was not part of this work, but has potential for further research. We consider it important to analyze the place attachment, the regional significance and local importance of CES, as well as specific regularities that arise from location, which we plan to carry out in the next phases of our research. It may be of particular interest to examine both the distance from the capital and the location of the subcenter (Vác) within the study area and its relationship with other municipalities in terms of CES perception.

5. Conclusions

In our study, a PPGIS approach was used in order to better understand how CES are perceived in a CEE regional context. Our results showed some similarities with other studies from various countries. We were able to confirm previously discovered CES bundles and spatial relationships between different CES types and biophysical landscape features. However, we found several differences, mostly due to the CEE sociocultural background. Compared to other studies, different spatial relationships were identified related to spiritual services. We also found higher importance of agricultural (especially arable) land cover in relation to the perception of CES, which can be explained by the traditional agricultural-oriented features of Hungarian culture (despite the dramatic reduction in the number of people employed in the sector). Significantly higher appreciation of national protected areas was identified, which can be explained by the fast and weak implementation of Natura 2000 (international protection) in CEE. Our results highlighted that in CEE countries (e.g., Hungary), the historically common values of societies and current political principles have strong influence on CES perception. These also mean that among the factors influencing participatory map outcomes, the shared values, knowledge and practices of local representatives are more important in countries with a strong role of the state/government than in Western European and North American societies with long traditions of liberal democracy. The study demonstrated the significant effect of accessibility on CES perception; however, our findings showed more sophisticated relationships in terms of various infrastructural elements. The analysis presented here has been applied in this Hungarian case study. Further CES-related research in CEE can provide a deeper and more generalizable insight into CES and their role in landscape planning and management in this geographical context.

Author Contributions

Conceptualization, I.V. and L.S.K.; methodology, I.V. and M.L.; software, S.J.; formal analysis, S.J., I.V. and M.L.; resources, I.V. and K.F.K.; writing—original draft preparation, I.V.; writing—review and editing, I.V., L.S.K., A.F. and K.F.K.; visualization, S.J. All authors have read and agreed to the published version of the manuscript.

Funding

This research received no external funding. The publication was supported by Hungarian University of Agriculture and Life Sciences—MATE.

Institutional Review Board Statement

Not applicable.

Informed Consent Statement

Not applicable.

Data Availability Statement

Not applicable.

Conflicts of Interest

The authors declare no conflict of interest.

Appendix A

Z-scores of CES calculated over international and national protected areas. Z-scores greater than +1.96 (pink cells) or less than −1.96 (yellow cells) indicate significant deviations from expected proportions of CES marks.
AestheticRecreationalHistoricSpiritualEducational
International protected areas7.52−2.15−7.96−12.88−8.77
National protected areas13.8236.613.900.2141.37

Appendix B

Observed and expected numbers of CES marks together with adjusted standardized residuals of cultural ecosystem services over international and national protected areas. Shaded cells indicate significantly higher (pink) or lower (yellow) CES marks than expected based on adjusted standardized residuals above 1.96 or below −1.96, respectively.
AestheticRecreationalHistoricSpiritualEducational
International protected areasObserved207.00109.0051.002.0041.00
Expected 83.2182.3082.1582.0080.33
Adjusted Residual16.503.57−4.17−10.73−5.31
National protected areasObserved30.0073.0011.004.0081.00
Expected 40.3939.9539.8739.8038.99
Adjusted Residual−1.906.08−5.31−6.597.80

Appendix C

CES bundles obtained by hierarchical cluster analyses based on Ward method with squared Euclidean distances.
Sustainability 14 00754 g0a1

References

  1. Macnaghten, P.; Urry, J. Contested Natures; Sage Publications: London, UK, 1998. [Google Scholar]
  2. de Groot, R.S.; Alkemade, R.; Braat, L.; Hein, L.; Willemen, L. Challenges in integrating the concept of ecosystem services and values in landscape planning, management and decision making. Ecol. Complex. 2010, 7, 260–272. [Google Scholar] [CrossRef]
  3. Millennium Ecosystem Assessment (MEA). Ecosystems and Human Well-being: A Framework for Assessment; Island Press: Washington, DC, USA, 2005. [Google Scholar]
  4. Plieninger, T.; Dijks, S.; Oteros-Rozas, E.; Bieling, C. Assessing, mapping, and quantifying cultural ecosystem services at community level. Land Use Policy 2013, 33, 118–129. [Google Scholar] [CrossRef] [Green Version]
  5. Oteros-Rozas, E.; Martín-López, B.; Fagerholm, N.; Bieling, C.; Plieninger, T. Using social media photos to explore the relation between cultural ecosystem services and landscape features across five European sites. Ecol. Indic. 2018, 94, 74–86. [Google Scholar] [CrossRef]
  6. Brown, G.; Hausner, V.H.; Lægreid, E. Physical landscape associations with mapped ecosystem values with implications for spatial value transfer: An empirical study from Norway. Ecosyst. Serv. 2015, 15, 19–34. [Google Scholar] [CrossRef] [Green Version]
  7. Blicharska, M.; Smithers, R.J.; Hedblom, M.; Hedenås, H.; Mikusiński, G.; Pedersen, E.; Sandström, P.; Svensson, J. Shades of grey challenge practical application of the cultural ecosystem services concept. Ecosyst. Serv. 2017, 23, 55–70. [Google Scholar] [CrossRef]
  8. Sanna, S.; Eja, P. Recreational cultural ecosystem services: How do people describe the value? Ecosyst. Serv. 2017, 26, 1–9. [Google Scholar] [CrossRef]
  9. Cheng, X.; Van Damme, S.; Li, L.; Uyttenhove, P. Evaluation of cultural ecosystem services: A review of methods. Ecosyst. Serv. 2019, 37, 100925. [Google Scholar] [CrossRef]
  10. Paracchini, M.L.; Zulian, G.; Kopperoinen, L.; Maes, J.; Schägner, J.P.; Termansen, M.; Zandersen, M.; Perez-Soba, M.; Scholefield, P.A.; Bidoglio, G. Mapping cultural ecosystem services: A framework to assess the potential for outdoor recreation across the EU. Ecol. Indic. 2014, 45, 371–385. [Google Scholar] [CrossRef] [Green Version]
  11. Brown, G.; Fagerholm, N. Empirical PPGIS/PGIS mapping of ecosystem services: A review and evaluation. Ecosyst. Serv. 2015, 13, 119–133. [Google Scholar] [CrossRef]
  12. Garcia-Martin, M.; Fagerholm, N.; Bieling, C.; Gounaridis, D.; Kizos, T.; Printsmann, A.; Müller, M.; Lieskovský, J.; Plieninger, T. Participatory mapping of landscape values in a Pan-European perspective. Landsc. Ecol. 2017, 32, 2133–2150. [Google Scholar] [CrossRef]
  13. Brown, G. The relationship between social values for ecosystem services and global land cover: An empirical analysis. Ecosyst. Serv. 2013, 5, 58–68. [Google Scholar] [CrossRef]
  14. Huang, G.; London, J.K. Mapping in and out of “messes”: An adaptive, participatory, and transdisciplinary approach to assessing cumulative environmental justice impacts. Landsc. Urban Plan. 2016, 154, 57–67. [Google Scholar] [CrossRef] [Green Version]
  15. Brown, G.; Weber, D. Public participation GIS: A new method for national park planning. Landsc. Urban Plan. 2011, 102, 1–15. [Google Scholar] [CrossRef]
  16. Samuelsson, K.; Giusti, M.; Peterson, G.D.; Legeby, A.; Brandt, S.A.; Barthel, S. Impact of environment on people’s everyday experiences in Stockholm. Landsc. Urban Plan. 2018, 171, 7–17. [Google Scholar] [CrossRef]
  17. De Valck, J.; Broekx, S.; Liekens, I.; De Nocker, L.; Van Orshoven, J.; Vranken, L. Contrasting collective preferences for outdoor recreation and substitutability of nature areas using hot spot mapping. Landsc. Urban Plan. 2016, 151, 64–78. [Google Scholar] [CrossRef]
  18. Pietrzyk-Kaszyńska, A.; Czepkiewicz, M.; Kronenberg, J. Eliciting non-monetary values of formal and informal urban green spaces using public participation GIS. Landsc. Urban Plan. 2017, 160, 85–95. [Google Scholar] [CrossRef]
  19. Rzeszewski, M.; Kotus, J. Usability and usefulness of internet mapping platforms in participatory spatial planning. Appl. Georg. 2019, 103, 56–69. [Google Scholar] [CrossRef]
  20. Cegielska, K.; Noszczyk, T.; Kukulska, A.; Szylar, M.; Hernik, J.; Dixon-Gough, R.; Jombach, S.; Valánszki, I.; Filepné Kovács, K. Land use and land cover changes in post-socialist countries: Some observations from Hungary and Poland. Land Use Policy 2018, 78, 1–18. [Google Scholar] [CrossRef]
  21. Kohlheb, N.; Krausmann, F. Land use change, biomass production and HANPP: The case of Hungary 1961–2005. Ecol. Econ. 2009, 69, 292–300. [Google Scholar] [CrossRef]
  22. Griffiths, P.; Müller, D.; Kuemmerle, T.; Hostert, P. Agricultural land change in the Carpathian ecoregion after the breakdown of socialism and expansion of the European Union. Environ. Res. Lett. 2013, 8, 1–12. [Google Scholar] [CrossRef]
  23. Csaki, C. Agricultural reforms in Central and Eastern Europe and the former Soviet Union—Status and perspectives. Agric. Econ. 2000, 22, 37–54. [Google Scholar] [CrossRef]
  24. Akçalı, E.; Korkut, U. Urban transformation in Istanbul and Budapest: Neoliberal governmentality in the EU’s semi-periphery and its limits. Political Geogr. 2015, 46, 76–88. [Google Scholar] [CrossRef]
  25. Zoderer, B.A.; Tasser, E.; Erb, K.; Stanghellini, P.S.L.; Tappeiner, U. Identifying and mapping the tourists’ perception of cultural ecosystem services: A case study from an Alpine region. Land Use Policy 2016, 56, 251–261. [Google Scholar] [CrossRef]
  26. Raudsepp-Hearne, C.; Peterson, G.D.; Bennett, E.M. Ecosystem service bundles for analyzing tradeoffs in diverse landscapes. Proc. Natl. Acad. Sci. USA 2010, 107, 5242–5247. [Google Scholar] [CrossRef] [Green Version]
  27. Brown, G.; Brabyn, L. An analysis of the relationships between multiple values and physical landscapes at a regional scale using public participation GIS and landscape character classification. Landsc. Urban Plan. 2012, 107, 317–331. [Google Scholar] [CrossRef]
  28. Van Riper, C.J.; Kyle, G.T. Capturing multiple values of ecosystem services shaped by environmental worldviews: A spatial analysis. J. Environ. Manag. 2014, 145, 374–384. [Google Scholar] [CrossRef]
  29. Palomo, I.; Martín-López, B.; Zorrilla-Miras, P.; Del Amo, D.G.; Montes, C. Deliberative mapping of ecosystem services within and around Doñana National Park (SW Spain) in relation to land use change. Reg. Environ. Chang. 2014, 14, 237–251. [Google Scholar] [CrossRef]
  30. Turner, K.G.; Odgaard, M.V.; Bøcher, P.K.; Dalgaard, T.; Svenning, J.C. Bundling ecosystem services in Denmark: Trade-offs and synergies in a cultural landscape. Landsc. Urban Plan. 2014, 125, 89–104. [Google Scholar] [CrossRef]
  31. Schirpke, U.; Altzinger, A.; Leitinger, G.; Tasser, E. Change from agricultural to touristic use: Effects on the aesthetic value of landscapes over the last 150 years. Landsc. Urban Plan. 2019, 187, 23–35. [Google Scholar] [CrossRef]
  32. Scholte, S.K.S.; Daams, M.; Farjon, H.; Sijtsma, H.J.; van Teeffelen, A.J.A.; Verburg, P.H. Mapping recreation as an ecosystem service: Considering scale, interregional differences and the influence of physical attributes. Landsc. Urban Plan. 2018, 175, 149–160. [Google Scholar] [CrossRef]
  33. Rohrbach, B.; Laube, P.; Weibel, R. Comparing multi-criteria evaluation and participatory mapping to projecting land use. Landsc. Urban Plan. 2018, 176, 38–50. [Google Scholar] [CrossRef]
  34. Pocewicz, A.; Nielsen-Pincus, M.; Brown, G.; Schnitzer, R. An Evaluation of Internet Versus Paper-based Methods for Public Participation Geographic Information Systems (PPGIS). Trans. GIS 2012, 16, 39–53. [Google Scholar] [CrossRef]
  35. Clement, J.M.; Cheng, A.S. Using analyses of public value orientations, attitudes and preferences to inform national forest planning in Colorado and Wyoming. Appl. Geogr. 2010, 31, 393–400. [Google Scholar] [CrossRef]
  36. Brown, G.; Sanders, S.; Reed, P. Using public participatory mapping to inform general land use planning and zoning. Landsc. Urban Plan. 2018, 177, 64–74. [Google Scholar] [CrossRef]
  37. Chan, K.M.; Guerry, A.D.; Balvanera, P.; Klain, S.; Satterfield, T.; Basurto, X.; Bostrom, A.; Chuenpagdee, R.; Gould, R.K.; Halpern, B.S.; et al. Where are cultural and social in ecosystem services? A framework for constructive engagement. BioScience 2012, 62, 744–756. [Google Scholar] [CrossRef]
  38. Brown, G.; Hausner, V.H. An empirical analysis of cultural ecosystem values in coastal landscapes. Ocean Costal Manag. 2017, 142, 49–60. [Google Scholar] [CrossRef] [Green Version]
  39. Nahuelhual, L.; Benra, F.; Rojas, F.; Ignacio Díaz, G.; Carmona, A. Mapping social values of ecosystem services: What is behind the map? Ecol. Soc. 2016, 21, 24. [Google Scholar] [CrossRef] [Green Version]
  40. Haines-Young, R.; Potschin, M. The links between biodiversity, ecosystem services and human well-being. In Ecosystem Ecology: A New Synthesis; Raffaelli, D.G., Frid, C.L.J., Eds.; Cambridge University Press: Cambridge, UK, 2010. [Google Scholar]
  41. Eurostat. NUTS—Nomenclature of Territorial Units for Statistics, Local Administrative Units (LAU). 2016. Available online: https://ec.europa.eu/eurostat/web/nuts/local-administrative-units (accessed on 15 August 2019).
  42. Hungarian Central Statistical Office. Hungarian Information Database of Regional Development and Land Use Planning (TEIR), System of Spatial Statistics. 2017. Available online: www.teir.hu (accessed on 10 August 2019).
  43. Copernicus. Corine Land Cover 2018. 2018. Available online: https://land.copernicus.eu/pan-european/corine-land-cover/clc2018?tab=download (accessed on 19 January 2019).
  44. Natura 2000 Network Viewer. 2019. Available online: http://natura2000.eea.europa.eu/ (accessed on 21 January 2019).
  45. Brown, G.; Reed, P. Validation of a forest values typology for use in national forest planning. For. Sci. 2000, 46, 240–247. [Google Scholar]
  46. Raymond, C.M.; Bryan, B.A.; MacDonald, D.H.; Cast, A.; Strathearn, S.; Grandgirard, A.; Kalivas, T. Mapping community values for natural capital and ecosystem services. Ecol. Econ. 2009, 68, 1301–1315. [Google Scholar] [CrossRef]
  47. Fagerholm, N.; Oteros-Rozas, E.; Raymond, C.M.; Torralba, M.; Moreno, G.; Plieninger, T. Assessing linkages between ecosystem services, land-use and wellbeing in an agroforestry landscape using public participation GIS. Appl. Geogr. 2016, 74, 30–46. [Google Scholar] [CrossRef] [Green Version]
  48. Karimi, A.; Brown, G. Assessing multiple approaches for modelling land-use conflict potential from participatory mapping data. Land Use Policy 2017, 67, 253–267. [Google Scholar] [CrossRef]
  49. Brown, G.; Pullar, D. An evaluation of the use of points versus polygons in Public Participation Geographic Information Systems (PPGIS) using quasi-experimental design and Monte Carlo simulation. Int. J. Geogr. Inf. Sci. 2012, 26, 231–246. [Google Scholar] [CrossRef]
  50. Ministry of Agriculture. National Environmental Information System (OKIR TIR). 2019. Available online: http://web.okir.hu/map/?config=TIR&lang=hu (accessed on 20 January 2019).
  51. Hungarian Hiking Routes. 2015. Available online: http://turistautak.hu/ (accessed on 16 July 2015).
  52. Brown, G.; Strickland-Munro, J.; Kobryn, H.; Moore, S.A. Mixed methods participatory GIS: An evaluation of the validity of qualitative and quantitative mapping methods. Appl. Geogr. 2017, 79, 153–166. [Google Scholar] [CrossRef]
  53. Silverman, B.W. Density Estimation for Statistics and Data Analysis; CRC Press: London, UK, 1986. [Google Scholar]
  54. Schmidt, K.; Martín-López, B.; Phillips, P.M.; Julius, E.; Makan, N.; Walz, A. Key landscape features in the provision of ecosystem services: Insights for management. Land Use Policy 2019, 82, 353–366. [Google Scholar] [CrossRef]
  55. Agresti, A. Categorical Data Analysis, 3rd ed.; Wiley: Hoboken, NJ, USA, 2013. [Google Scholar]
  56. Ward, J.H., Jr. Hierarchical grouping to optimize an objective function. J. Am. Stat. Assoc. 1963, 58, 236–244. [Google Scholar] [CrossRef]
  57. Legendre, P.; Legendre, L. Numerical Ecology; Elsevier: Amsterdam, The Netherlands, 1998. [Google Scholar]
  58. Ridding, L.E.; Redhead, J.W.; Oliver, T.H.; Schmucki, R.; McGinlay, J.; Graves, A.R.; Morris, J.; Bradbury, R.B.; King, H.; Bullock, J.M. The importance of landscape characteristics for the delivery of cultural ecosystem services. J. Environ. Manag. 2018, 206, 1145–1554. [Google Scholar] [CrossRef] [Green Version]
  59. Morin, K.M. Landscape perception. Int. Encycl. Hum. Geogr. 2020, 2, 121–125. [Google Scholar] [CrossRef]
  60. Singh, S.N.; Donavan, D.T.; Mishra, S.; Little, T.D. The latent structure of landscape perception: A mean and covariance structure modeling approach. J. Environ. Psychol. 2008, 28, 339–352. [Google Scholar] [CrossRef]
  61. Dou, Y.; Yu, X.; Bakkers, M.; de Groot, R.; Carsiens, G.J.; Duan, H.; Huang, C. Analysis of the relationship between cross-cultural perceptions of landscapes and cultural ecosystem services in Genheyuan region, Northeast China. Ecosyst. Serv. 2020, 43, 101112. [Google Scholar] [CrossRef]
  62. Derkzen, M.; Nagendra, H.; Van Teeffelen, A.; Purushotham, A.; Verburg, P. Shifts in ecosystem services in deprived urban areas: Understanding people’s responses and consequences for well-being. Ecol. Soc. 2017, 22, 51. [Google Scholar] [CrossRef] [Green Version]
  63. Jaligot, R.; Kemajou, A.; Chenal, J. Cultural ecosystem services provision in response to urbanization in Cameroon. Land Use Policy 2018, 79, 641–649. [Google Scholar] [CrossRef]
  64. Liu, Q.; Fu, W.; Konijnendijk van den Bosch, C.C.; Xiao, Y.; Zhu, Z.; You, D.; Zhu, N.; Huang, Q.; Lan, S. Do Local Landscape Elements Enhance Individuals’ Place Attachment to New Environments? A Cross-Regional Comparative Study in China. Sustainability 2018, 10, 3100. [Google Scholar] [CrossRef] [Green Version]
  65. Fagerholm, N.; Torralba, M.; Moreno, G.; Girardello, M.; Herzog, F.; Aviron, S.; Burgess, P.; Crous-Duran, J.; Ferreiro-Domínguez, N.; Graves, A.; et al. Cross-site analysis of perceived ecosystem service benefits in multifunctional landscapes. Glob. Environ. Chang. 2019, 56, 134–147. [Google Scholar] [CrossRef] [Green Version]
  66. Csatári, B.; Farkas, J.Z.; Lennert, J. Agrarian and Rural Development in Hungary After 1989. In Three Decades of Transformation in the East-Central European Countryside; Bański, J., Ed.; Springer: Cham, Switzerland, 2019. [Google Scholar] [CrossRef]
  67. Brown, G.; Weber, D.; de Bie, K. Assessing the value of public lands using public participation GIS (PPGIS) and social landscape metrics. Appl. Geogr. 2014, 53, 77–89. [Google Scholar] [CrossRef]
  68. Blicharska, M.; Orlikowska, E.H.; Roberge, J.-M.; Grodzinska-Jurczak, M. Contribution of social science to large scale biodiversity conservation: A review of research about the Natura 2000 network. Biol. Conserv. 2016, 199, 110–122. [Google Scholar] [CrossRef]
  69. Maczka, K.; Chmielewski, P.; Jeran, A.; Matczak, P.; van Riper, C.J. The ecosystem services concept as a tool for public participation in management of Poland’s Natura 2000 network. Ecosyst. Serv. 2019, 35, 173–183. [Google Scholar] [CrossRef]
  70. Brown, G.; Kyttä, M. Key issues and research priorities for public participation GIS (PPGIS): A synthesis based on empirical research. Appl. Geogr. 2014, 46, 122–136. [Google Scholar] [CrossRef]
  71. Pocewicz, A.; Schnitzer, R.; Nielsen-Pincus, M. The Social Geography of Southern Wyoming: Important Places, Development, and Natural Resource Management; The Nature Conservancy: Lander, WY, USA, 2010; p. 16. Available online: https://pdfs.semanticscholar.org/fc50/45bdf89c876947c354acbf693207c7aa6372.pdf (accessed on 25 June 2019).
  72. Pietilä, M.; Kangas, K. Examining the relationship between recreation settings and experiences in Oulanka National Park—A spatial approach. J. Outdoor Recreat. Tour. 2015, 9, 26–36. [Google Scholar] [CrossRef]
Figure 1. Location of study area, Vác microregion in Hungary.
Sustainability 14 00754 g001
Figure 2. Spatial distribution of CES mapped over the 11 land cover classes in the study area.
Sustainability 14 00754 g002
Figure 3. CES hotspots in the study region calculated as kernel density surface with 50 m grid cell size and 500 m search radius.
Sustainability 14 00754 g003
Table 1. Selected CES with operational descriptions mapped in the study (adapted from [4,6,48]).
Ecosystem ServicesOperational Description
AestheticAreas of beautiful landscapes
RecreationAreas of importance because they provide recreational opportunities
SpiritualAreas of spiritual, religious meaning
HistoricAreas of importance because of their relevance to local history and culture
EducationalAreas of importance because these provide information about the nature and environment
Table 2. Sociodemographic characteristics of participants (n = 184).
n%
Municipality
Acsa168.7
Csörög116.0
Csővár147.6
Galgagyörk73.8
Kisnémedi52.7
Kosd94.9
Őrbottyán158.2
Penc105.4
Püspökhatvan116.0
Püspökszilágy52.7
Rád94.9
Sződ63.3
Sződliget158.2
Vác2614.1
Vácduka94.9
Váchartyán52.7
Váckisújfalu63.3
Vácrátót52.7
184100.0
Gender
Men6032.6
Women12467.4
184100.0
Age category
≤24 yrs179.2
25–34 yrs2614.1
35–44 yrs3921.2
45–54 yrs4222.8
≥55 yrs6032.6
184100.0
Table 3. Z-scores of CES calculated over land cover classes. Z-scores greater than +1.96 (pink cells) or less than −1.96 (yellow cells) indicate significant positive or negative deviations from expected proportions of CES marks, respectively.
AestheticRecreationalHistoricSpiritualEducational
Urban fabric16.5024.4053.1563.0445.94
Mine, dump, construction10.61−1.49−0.81−1.48−0.78
Artificial, non-agricultural vegetated16.5527.698.301.2527.64
Arable land−13.95−13.03−16.37−16.09−16.06
Permanent crops−3.06−2.71−3.04−2.70−3.01
Grassland and pastures−3.10−2.14−3.76−3.53−2.53
Heterogeneous agricultural areas−1.90−1.26−4.72−4.99−5.02
Forests0.14−5.85−11.19−13.33−9.53
Shrub and/or herbaceous vegetation associations0.35−3.34−1.53−6.43−5.20
Wetlands−0.871.79−0.86−1.52−0.83
Water bodies10.9410.63−2.14−2.13−0.89
Table 4. Observed and expected numbers of CES marks together with adjusted standardized residuals of cultural ecosystem services by land cover class. Shaded cells indicate significantly higher (pink) or lower (yellow) CES marks than expected based on adjusted standardized residuals above 1.96 or below −1.96, respectively.
AestheticRecreationalHistoricSpiritualEducational
Urban fabricObserved162.00214.00407.00473.00354.00
Expected 318.99323.21325.01325.01317.78
Adjusted Residual−15.58−10.788.0814.583.60
Artificial, non-agricultural vegetated areasObserved43.0068.0024.008.0067.00
Expected 41.6142.1642.3942.3941.45
Adjusted Residual0.254.64−3.29−6.164.62
Arable landObserved50.0059.0021.0024.0022.00
Expected 34.8735.3335.5335.5334.74
Adjusted Residual2.964.61−2.82−2.24−2.50
Grassland and pasturesObserved6.0010.003.004.008.00
Expected 6.146.226.266.266.12
Adjusted Residual−0.061.70−1.47−1.020.85
Heterogeneous agricultural areasObserved45.0049.0024.0022.0021.00
Expected 31.9032.3232.5032.5031.78
Adjusted Residual2.673.39−1.72−2.13−2.20
ForestsObserved146.0083.0028.006.0043.00
Expected 60.6361.4361.7761.7760.40
Adjusted Residual13.013.27−5.11−8.44−2.66
Shrub and/or herbaceous vegetation associationsObserved43.0020.0031.001.008.00
Expected 20.4120.6820.7920.7920.33
Adjusted Residual5.70−0.172.56−4.96−3.11
Water bodiesObserved34.0033.001.001.004.00
Expected 14.4614.6514.7414.7414.41
Adjusted Residual5.825.44−4.06−4.06−3.10
Table 5. Z-scores of CES by distance bands of infrastructural elements. Z-scores greater than +1.96 (pink cells) or less than −1.96 (yellow cells) indicate significant deviation from expected proportion of CES marks.
Distance BandsRoadsMotorwaysRailwaysBicycle PathsHiking TrailsNational Blue Hiking Trail
Aesthetic< 200 m5.53−2.19−0.4324.2518.304.57
200–500 m3.51−2.472.758.461.016.27
500–1000 m−0.78−2.592.751.13−5.704.44
1000–1500 m−4.070.72−1.39−0.22−6.532.49
>1500 m−4.323.19−2.36−16.39−7.15−9.01
Recreational< 200 m7.84−3.077.0028.5521.13−1.35
200–500 m8.67−2.194.5311.952.94−1.10
500–1000 m−0.74−2.156.453.36−8.50−3.17
1000–1500 m−6.081.560.060.96−8.58−1.24
>1500 m−10.122.62−10.51−22.09−6.963.65
Historic< 200 m23.54−2.773.6029.2228.78−2.54
200–500 m1.40−3.4216.3716.78−1.03−2.87
500–1000 m−7.51−2.535.062.00−8.79−3.16
1000–1500 m−5.95−2.51−1.16−2.17−10.03−2.27
>1500 m−10.215.81−13.91−22.58−8.865.57
Spiritual< 200 m17.33−2.765.0532.1226.76−2.54
200–500 m10.30−2.929.9516.24−0.70−2.86
500–1000 m−7.40−2.5212.674.48−9.58−3.46
1000–1500 m−9.202.17−4.97−1.02−9.12−2.61
>1500 m−10.642.71−13.69−25.61−7.165.92
Educational< 200 m21.29−2.427.9526.4126.830.31
200–500 m6.33−2.373.0515.330.50−1.04
500–1000 m−8.19−3.223.241.56−9.62−1.93
1000–1500 m−8.49−1.040.670.20−9.79−2.23
>1500 m−10.074.69−8.32−21.48−7.812.66
Publisher’s Note: MDPI stays neutral with regard to jurisdictional claims in published maps and institutional affiliations.

