1. Introduction
The global extreme climate is becoming increasingly more frequent in 2022. In Europe, Rhine River experienced severe drought and in China, the water level of Yangzi River reached a record low. Most of the areas around the world reinforce the abnormal heatwave during summer 2022. Global climate change is a critical challenge for humankind in the 21st century [
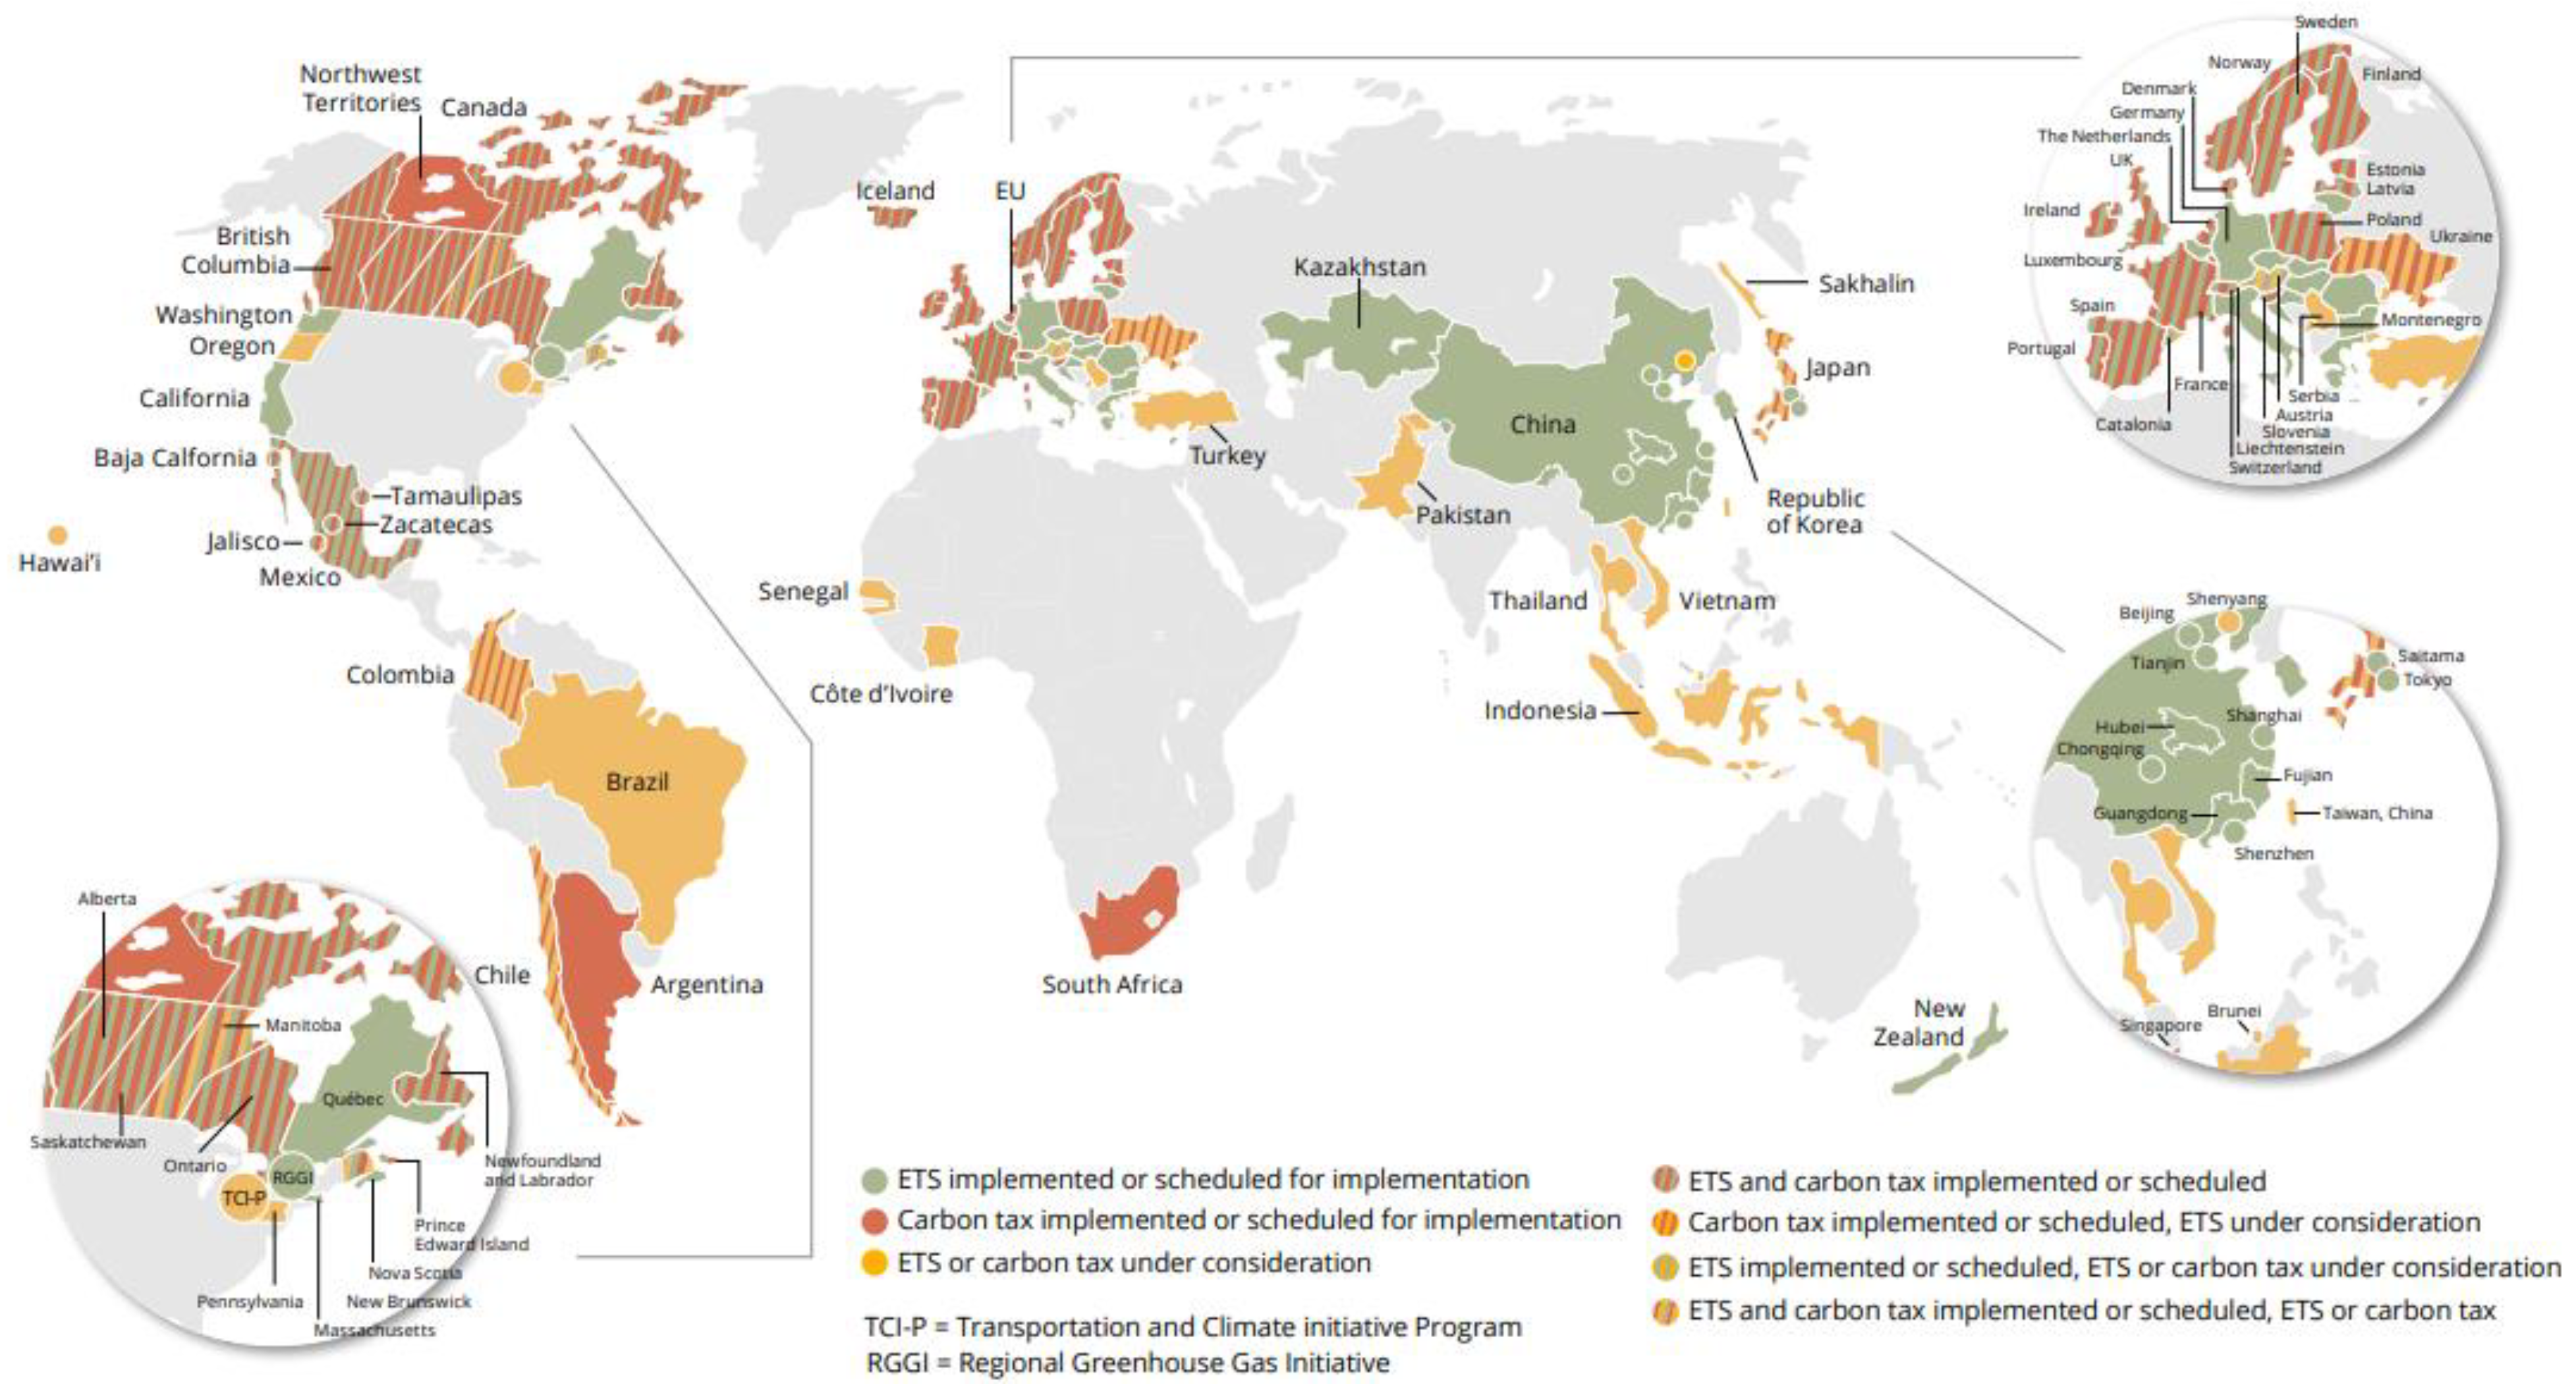
1]. To limit GHG emission, carbon markets are implemented to internalize the external effects of GHG around the world. At present, jurisdictions making up 55% of global GDP are using 33 emission trading systems (ETS), covering 1/3 of global population and 17% of global GHG emission [
2,
3] (
Figure 1). Moreover, 27 countries are using 35 different designed carbon tax policies to internalize the externalities of emission [
3] (
Figure 1).
The carbon market is a recent emerging innovation. Most studies are conducted at the following different points. A complete picture of the research status on carbon peaking and carbon neutrality as well as some suggestions for China’s neutrality were provided by Yiming based on a thorough investigation [
4]. Kollmuss conducted a comprehensive comparison of carbon offset standards for the voluntary carbon market and guided the benefits of carbon offset [
5]. Zhou and Li presented a systematic review of China’s carbon finance and carbon market as well as the major challenges for China to establish a national unified carbon market, in terms of awareness, relevant professionals, sound legal systems, and carbon financial product innovation [
6]. Besides carbon policy studies, carbon price prediction also attracted considerable attention. A second decomposition carbon price prediction model based on the nuclear extreme learning machine, with consideration of both structural and nonstructural influencing factors, was developed by Zhou and Wang and applied to Guangdong and Hubei markets with good performance [
7]. Yan et al. established a novel hybrid model based on feature selection and a multi-objective optimization algorithm was proposed for carbon price forecasting [
8]. Guohui et al. used the OVMD method to construct the prediction model and proved its high accuracy and high operation efficiency [
9]. The interaction between special factors and carbon market has become another hot topic recently. Tavoni et al., Dou et al., and Dong et al. studied the influence of forestry, economic policy, and COVID-19 on carbon market and pointed out the link between carbon price and the special factors [
10,
11,
12].
While the above studies only focus on the carbon market itself and do not provide a comprehensive solution for the Chinese international oil company to achieve carbon neutrality by developing a systematic overall understanding of global carbon market and providing insights into the operation mechanism of different carbon markets and the connections among carbon markets. As the Glasgow Climate Pact was agreed to at the COP 26 summit, the climate target from the Paris Agreement has further confirmed that the temperature increase should be no more than 2 °C by 2050. China strives to achieve the goals of carbon peaking by 2030 and carbon neutrality by 2060. In 2020, China emitted 10.6 billion tons of CO
2 and about 92% were derived from the burning of coal, oil, and gas [
13]. As a result, the Chinese international oil company will face severe carbon cost pressure from both domestic and overseas regulations. For example, Canada will raise its carbon tax to 170 CAD/ton by 2030 [
14]. At the same time, the government in China initialized the carbon trading system for the electricity industry. The domestic self-supply power plant of Chinese traditional oil companies needs to fulfill its carbon emission obligations.
This work provides a systematic landscape of the global carbon market and finds the connections among compulsory and voluntary carbon markets by investigating a large amount of literatures and industrial reports. Furthermore, three levels of carbon trading strategies are developed to help Chinese oil companies to reduce emission costs based on the profound understanding of the abovementioned carbon market and the shadow pricing model for carbon emission rights.
2. Global Carbon Market
As data from IHS shows [
15], the global compliance carbon market covered an estimated 12,000 MMtCO
2e in GHG emissions (22% of global emissions) and raised USD 45 billion in 2019. While the voluntary market total transactions volume reached 104 MMtCO
2e in the same year, corresponding to a market value of approximately USD 320 million. The voluntary market is less than 1% of compliance market in terms both of transactions volume and market value. To help limit global temperature rise within 1.5 °C, it is estimated that the voluntary market needs to grow 15 times by 2030 and 100 times by 2050 [
15]. The voluntary carbon market is more flexible and has various kinds of carbon credit standards around the world. A detailed discussion is provided here.
2.1. The Compliance Carbon Market
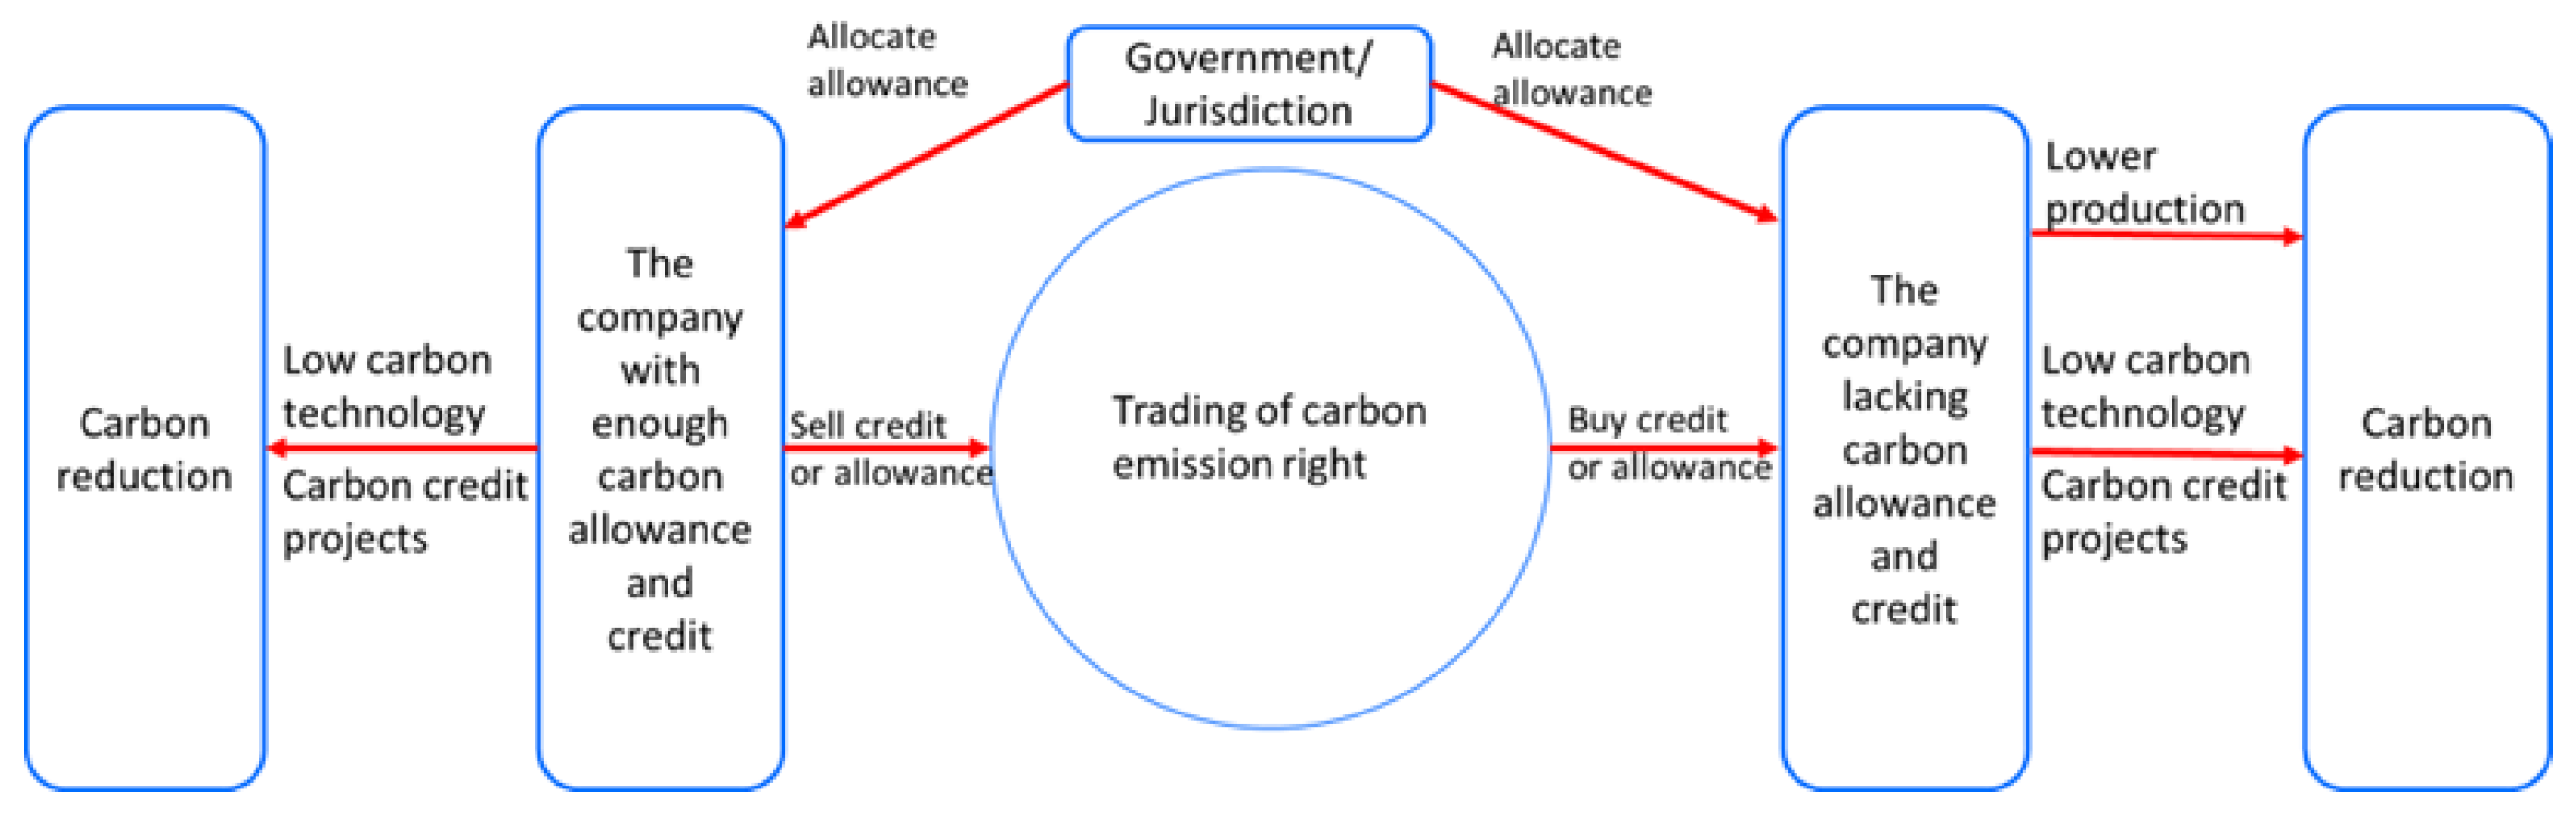
The compliance carbon market comprises a mandate cap-and-trade system and carbon tax policy. The two carbon controlling mechanisms are complementary to each other. The mandate cap-and-trade system is stipulated by government. All the enterprises in the covered industries must obey the regulations that no one can discharge carbon more than its carbon allowance (carbon emission quota allocated by government). Mandate cap-and-trade system will set up and reduce the overall carbon emission scale annually in the covered jurisdictions according to long term emission reduction target and allocate carbon allowance to enterprises freely or by auction [
16]. Enterprises can apply carbon reduction technologies to directly reduce their emission to fulfill the emission obligation or purchase carbon allowance to cover their excessive emission and carbon credit to set off their excessive emission. If an enterprise has surplus carbon allowance or carbon credit, it can sell the spare carbon emission rights to market to make profit. In some bad cases, an enterprise will be punished if it violates the carbon emission stipulation, such as through fines and reducing the next year’s carbon allowance.
Carbon credits (known as carbon offsets) are not the same as carbon allowances (known as carbon permits). A carbon credit is issued by global verification standards and represents a unit of emission reduction or removal of greenhouse gases as a result of nature or technology-based projects (usually the environmentally friendly projects). Clean Development Mechanism, Gold Standard, and Verified Carbon Standard are the popular carbon credit verification standards around the world. Carbon allowances are allocated by government and represent the permitted CO
2 emission volume by government. Companies who do not use up their carbon allowance can market it for profit. Using carbon allowance in the corresponding jurisdiction to fulfill obligations is unencumbered. Whether a carbon credit can be leveraged to set off emission depends on the government’s attitude towards the verification standards and who issued the carbon credit. If carbon credit is accepted, the maximum emission offset ratio is usually in the range of 4~10% of the over-emission volume. The operation mechanism of mandate cap-and-trade system is shown in the below
Figure 2 [
17].
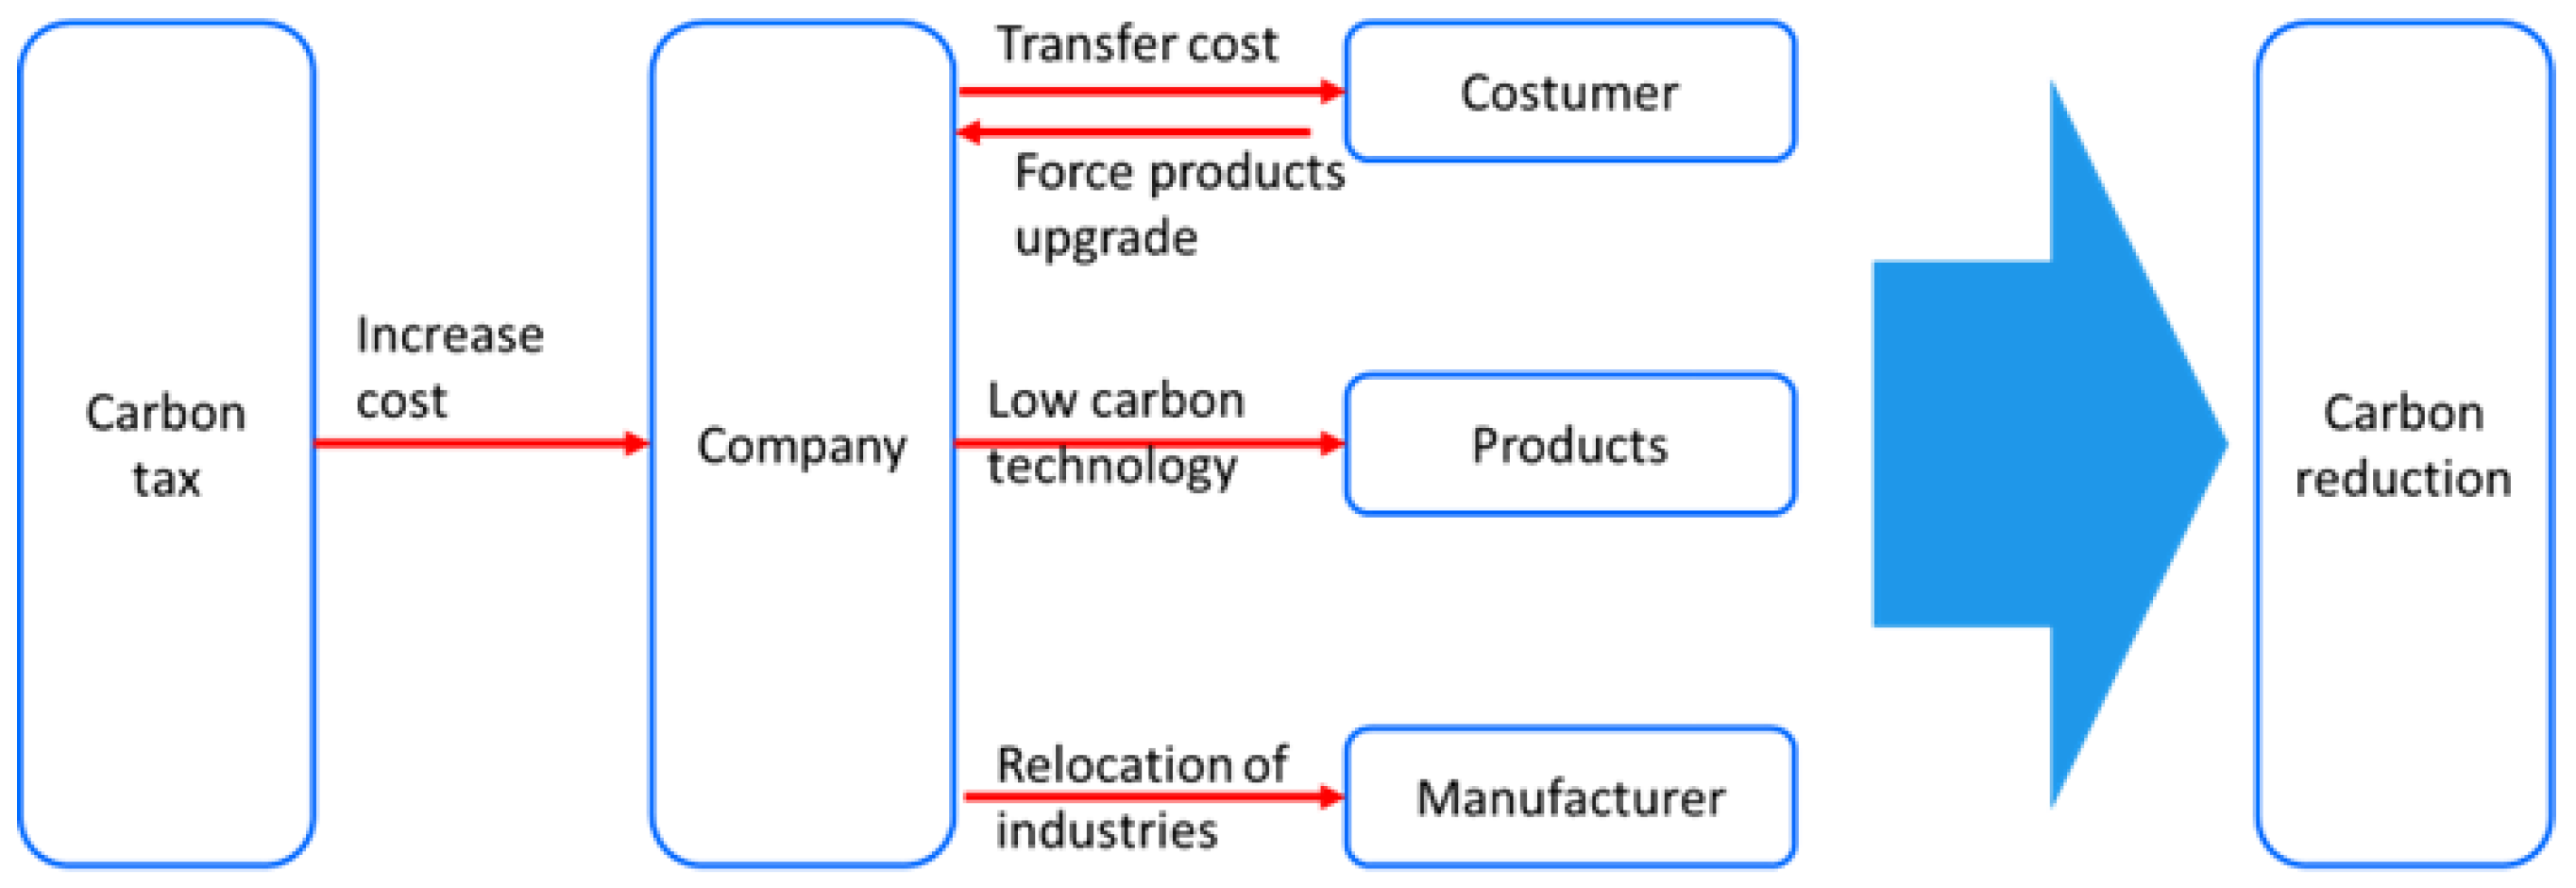
Carbon tax is an important supplementary of Mandate cap-and-trade system in terms of compliance carbon market. A carbon tax is a policy in which the government sets a price that emitters must pay for each ton of greenhouse gases they emit [
18]. The key objective is to incentivize businesses, consumers, and other actors to reduce their emissions to avoid paying the tax. Carbon tax policies are divided into two types: emissions tax and goods tax. In an emissions tax policy, entities must pay carbon tax for the emission of their production. There is no carbon trade. While a goods tax policy creates an emission intensity in each industry. Entities producing goods with higher carbon intensity can fulfill their obligation by paying an emissions tax to the government or by purchasing carbon allowances or credits. The operation mechanism of carbon tax is shown in
Figure 3.
Comparing cap-and-trade system and carbon tax, there are some pros and cons for each. Generally, a cap-and-trade system can control and adjust the overall emission as requirements of the government. However, it is more difficult and expensive to implement. Carbon tax cannot control and adjust the overall emissions for the target needed. Entities can emit as much as possible if they pays for the carbon tax. There is no punishment mechanism for over-emission. However, it is easy and low-cost to carry out.
Table 1 shows the details of the advantages and disadvantages of this system [
19].
2.2. The Voluntary Carbon Market
The voluntary market is not enforced by the government, where some enterprises, non-profit organizations, and stakeholders reach an agreement together to spontaneously establish a cap-and-trade system. Voluntary members trade carbon credit to realize their own carbon neutral transition for 2050. BP, Shell, Total, and other major oil corporations devote themselves to voluntary market and carbon credit projects to achieve their climate ambitions [
20]. The operation mechanism of a voluntary cap-and-trade system is the same as the compliance one. The voluntary market is more flexible and has less limitations to using carbon credits to set off members’ carbon emissions. Various kinds of carbon credits issued by different verifying standards can be accepted (
Table 2).
2.3. The Connection between Carbon Markets
At present, compliance carbon markets all over the world have not been effectively connected together. Different carbon allowances are not mutual acknowledged among different compliance carbon markets. Just some special types of carbon credit are accepted limitedly by compliance carbon markets. However, carbon credit issued by the four standards (
Table 2) is popular in the voluntary market. Thus, carbon credit acts as a critical bridge between the compliance market and the voluntary market as well as between different voluntary markets. With the implementation of Article 6 of the Paris Agreement, top carbon credit may become more and more significant and play a role as an intermediary to connect carbon markets around the world, helping to construct a global carbon market. In addition to the four top standards, Clean Development Mechanism [
21] and Joint Implementation [
22] based on the Kyoto Protocol are also major sources of carbon credit. Companies can develop carbon reduction projects under different verifying standards and apply for corresponding carbon credit issued by the registered standards. Different types of carbon credit are accepted by different compliance markets (
Table 3),similar to different currency circulates in different countries. The carbon credit issued by CDM is most acceptable, followed by VCS. The trading of credits in the voluntary market depends on both parties’ acknowledgment on the type, which means more flexibility and less limitations. China’s carbon market has established the credit issue mechanism Chinese Certified Emission Reduction (CCER), which only circulates in the Chinese market [
23].
2.4. Major Carbon Market Introduction
2.4.1. European ETS Market
European Union ETS market, started in 2005, is the earliest, most influential, effective, and liquid carbon market in the world [
2]. The development of European Union ETS is divided into four stages (
Table 4). In 2021, EU ETS covered 40% of emissions from power generation, manufacturing, and airline business in this area. In 2021, the overall carbon allowance volume was reduced to 1.57 billion tons and the total trading volume including auction, physical, and financial was 11.4 billion tons, where physical trading volume was 62.3 million tons and financial trading volume was 1.07 billion tons. In addition, carbon credit trading volume reaches 791,000 tons. For 2021, with the economic recovery from COVID-19 and the surge price of energy products, carbon prices in the EU increased from 33.56 EUR/ton to 73.28 EUR/ton or 118%. At present, the Carbon Border Adjustment Mechanism (CBAM) [
24,
25] is being designed to function in the EU, which will further increase the demand for carbon allowances and induce a carbon price rally. The CBAM is a carbon tariff that will be implemented in the EU in 2026. Under the new policy, importers purchase carbon certificates in relation to the amount of emissions generated by the production of the goods. The goal of the CBAM is to reduce the risk of carbon leakage and maintenance a fair competition environment for EU market.
2.4.2. Regional Greenhouse Gas Initiative ETS Market
The RGGI carbon market started in 2008 and covers Connecticut, Delaware, Maine, Maryland, Massachusetts, New York, Rhode Island, Vermont, etc. It includes power generation with a scale larger than 25 MW and a fossil fuel ratio more than 50%. This means a coverage of 95% of emissions from power generation in the region. The previous execution term of RGGI was three years. While 2021 initiated a new executive term of 10 years that will end in 2030. The carbon allowance is mainly allocated by auction, which is held quarterly. The total auction volume in 2021 is 96.4 million tons. Additionally, the average price for Dec auction was 13 USD/ton, increasing 75% y-o-y.
2.4.3. California–Quebec ETS Market
There are four stages of the California–Quebec ETS market (
Table 5). A carbon allowance is issued by quarterly auction. The total auction carbon allowance volume was 299.5 million tons in 2021 and the average auction price in Dec was 28.86 USD/ton, increasing 70% y-o-y.
2.4.4. Korea ETS Market
The Korea ETS market started in 2015. By 2021, Korea ETS had reached the third stage, covering 685 entities including construction and transportation business, and it is supposed to cover 73.5% emission of involved entities before 2025. Moreover, third parties such as financial companies and institutions have been allowed to participate in secondary carbon market transactions since 2020. In 2021, the activity of the Korea ETS was significantly promoted. The total trading volume reached 0.05 billion tons with a year-over-year increase of 16%, while the overall carbon allowance volume merely increased by 8% y-o-y. In 2022, the maximum offset volume by carbon credit is about 5% of the over-emission part and the Korean government allows for the use of international carbon credits to set off emissions, which should not surpass 50% of the total carbon credit volume. Affected by the carbon allowance surplus and market-stabilization-measures taken by the government, the carbon price in Korea experienced a ‘V-shape’ trend in 2021. The annual average price is 29 USD/ton, up 40% from the end of 2020.
2.4.5. China ETS Market
The China national ETS market, located in Shanghai, started on 16 July 2021. The national ETS market covers 2162 primary power generation entities and about 4.5 billion tons of emission. By the end of 2021, the total trading volume of CEA in the China national ETS market reached 0.18 billion tons and the annual average carbon price was 42.85 CNY/ton with the accumulated increase of 12.96%.
All carbon allowances are distributed freely and the exact allowance of each entity is calculated by the benchmark method. The spot CEA is transferred in the national ETS market by an agreement transfer, distinguished into listing agreement transaction (lower than 100,000 tons) and block agreement transaction (higher than 100,000 tons). All emission entities shall commit the corresponding carbon obligation before 17:00 on December 31. The primary emission entities are allowed to use Chinese Certified Emission Reduction (CCER) to offset carbon allowance.
3. Low-Carbon Technologies
There are six technological avenues (combine BECCS and CCS as CCUS) that could help fulfill the 2050 climate target of 1.5 °C rally limitation [
26]. Improving energy efficiency and electrification are important parts to decrease carbon emission. However, they only mitigate carbon intensity and do not cut the emission source. Renewables, hydrogen, and CCUS are critical to really remove carbon source, contributing about 55% of carbon emission reduction for net zero (
Figure 4) [
26,
27]. Applying these low-carbon technologies is essential for international oil companies exploring transition strategies for carbon neutrality.
3.1. Wind Energy
In 2021, almost 94 GW of wind generation capacity was added, despite it being the second year of the COVID-19 pandemic [
28]. It brought the global cumulative wind power capacity to 837 GW, showing a y-o-y growth of 12%. The onshore wind capacity added 72.5 GW worldwide and the offshore capacity was increased by 21.5 GW, with the total offshore capacity reaching 57 GW. China is one of the highest contributors of wind energy. In 2021, China added 47.6 GW of capacity, where onshore improved by 30.7 GW and offshore increased by 16.9 GW. To realize the 2050 target, the installation capacity in 2030 needs to be four times that of 2021. Additionally, globally there is a large gap between installation capacity needed and projected new wind capacity based on current growth rate, which means wind generation projects are very welcomed.
The wind industry economically has performed very successfully over the last decade, because it is capable of both scaling up production volumes and capacity installations. The LCOE (levelized cost of electricity) of both onshore and offshore wind dropped dramatically. According to IRENA, the global weighted-average LCOE for onshore wind declined by nearly 60% over the last decade to 0.04 USD/kWh by 2020, while fixed-bottom offshore wind LCOE nearly halved to reach 0.08 USD/kWh [
29]. In addition, the external costs of wind generation are the lowest when compared to other electricity technologies, indicating the low carbon emission and the high carbon credit acquisition potential. Therefore, wind projects can bring in two major cash flows: carbon credit marketing and electricity marketing.
3.2. Solar Energy
Energy production from solar PV will expand quickly in the coming decades. The installed capacity of solar PV is expected to increase seven-fold by 2030 (to nearly 5200 GW) and twenty-fold by 2050 (to exceed 14,000 GW) [
26]. Meeting those targets will involve annual additions of 450 GW over the next decade, most of it in the form of utility-scale installations. The Chinese market is a very strong growth market, with the 2021 growth rate exceeding 20% to about 54.9 GW. The global levelized cost of electricity (LCOE) of newly commissioned utility scale solar PV projects fell by 85% between 2010 and 2020. At present, the LCOE of solar photovoltaic could have an average price of 0.04 USD/kWh, which is around 27% less (0.015 USD/kWh) than the cheapest fossil-fuel competitor, coal-fired plants. Similar to wind generation, solar generation also has low external costs and a high capability to gather carbon credits. The same two cash flows of carbon credit marketing and electricity marketing can generate great profit for the solar projects.
3.3. Hydro Energy
In 2021, the installed global hydropower capacity (excluding pumped hydro) reached 1230 GW, which is 40% of total renewables capacity. Under the 1.5 °C scenario, hydropower’s installed capacity (excluding pumped hydro) will have to grow 30% by 2030 to nearly 1500 GW and will need to double by 2050 to around 2500 GW. This goal will require average annual installations around the globe to be 31 GW over the next decade [
26]. In 2021, China added 23.5 GW and reached 390 GW, which is about a 5.6% increase y-o-y. The LCOE of large-scale hydro projects at high-performing sites can be as low as 0.020 USD/kWh, while average costs of the new capacity added in 2019 was slightly less than 0.050 USD/kWh [
30]. Just like wind generation, the two cash flow sources, carbon credit marketing and electricity marketing, can generate profit for the hydro projects.
3.4. Green Hydrogen
In the 1.5 °C scenario, green and blue hydrogen production will grow from negligible levels to 19 EJ (154 million tons) by 2030 and to over 74 EJ (614 million tons) by 2050 [
26]. Green hydrogen is produced from renewable energy and blue hydrogen is transformed from CH
4. Costs of green and blue hydrogen production depend on the cost of renewable electricity and CCUS. If one country has rich wind, solar, and hydro energy or advanced CCUS technology, its hydrogen economics will perform better [
31]. It is predicted that the potential hydrogen supply can meet the future global hydrogen demand (in all sectors) of 74 EJ/year as well as the total global final energy demand (614 EJ/year) with levelized cost of hydrogen of 0.7 USD/kgH
2 and 0.8 USD/kgH
2, respectively [
31].
3.5. CCUS
CCUS is a very perspective industry for carbon neutrality. The capacity of CCUS was 40 million tons/year in 2020. For the 1.5 °C temperature target in 2050, it is estimated that CCUS capacity shall be 1.6 billion tons/year by 2030 and 5.6 billion tons/year by 2050, corresponding to an investment increment of USD 160 billion by 2030 and of USD 2500–3000 billion by 2050 [
27]. Comparing with energy efficiency and renewable technologies, CCUS has the advantages of high potential of emission reduction and high efficiency to capture about 90% of carbon emissions from power generation and industrial production due to fossil fuel burning (
Table 6) [
32]. Some pioneer companies are exploring CCUS application in different business models. CAPTICO2′s technology can control the total cost of CO
2 capture and mineralization between 30–40 EUR/ton [
33]. In addition, CCUS is widely used in oil and gas field development. Generally, it improves the oil recovery factor by 30~40% more than water flood recovery, increases 75% efficiency for coal-bed gas production, and is helpful for assisting in shale gas development. In China, there are more than 40 projects in commission with total CCUS capacity of 3 million tons/year and the Qilu Petrochemical- Shengli Oil-field CCUS project has reduced million tons of CO
2 with enhanced effects on oil field development. It is predicted that oil production will be improved by 2.96 million tons in total over the next 15 years [
34,
35].
3.6. Lagrange Multiplier Method for Carbon Assets Evaluation
The above low carbon technologies are the main avenues to cut carbon emissions for the fulfillment of 1.5 °C target in 2050. In other words, they are the sources of carbon emission rights (carbon allowance and carbon credit). How to evaluate the value of the carbon emission rights is critical for an entity’s decision on whether to implement the above low-carbon technologies which create an extra cost. Thus, a shadow pricing model for carbon emission rights based on
Lagrange multiplier theory is recommended here [
36].
There are two assumptions: 1. The total permitted emission volume in the market is set as Y. Additionally, the total number of emission companies in the market is n with an initial carbon allowance of Yi (i = 1, 2, 3 …… n). Yi represents the permitted emission volume for company i, thus it is obvious that . 2. The average profit per production for companies in the market is , which equals to the total profit divided by total production volume. Xi is the production volume of each company and the total production volume is . This work assumes that the carbon emission has a linear relation with production scale and the conversion factor is constant r. So, the emission volume of each company can be described as .
According to the above assumptions, every company in the market would pursue the maximum profit with carbon emission less than
Yi. Therefore, the objective function is set up as below:
After applying the
Lagrange multiplier method to Equation (1), the below equation is derived:
where
is the Lagrange multiplier. If we calculate the first partial derivatives of
L with respect to
and require it equal to 0, then Equation (3) is developed:
Then, solve Equation (3) and the value of
is obtained:
Here, is the carbon emission right price in the assumption market. Companies can compare with the cost of the carbon allowance and credits from low-carbon technologies. If the cost of carbon allowance and credits is lower than this indicates that investing in low-carbon projects makes a profit. If the cost is higher than this indicates a loss when investing in low-carbon projects. For the carbon tax market, if there is no carbon trading the comparison shall be conducted between and the unit carbon tax set up by the government.
4. The Carbon Neutral Transition Strategy for Chinese International Oil Company
After COP 26, the global transition to carbon neutrality sped up. The carbon emission cost rallied dramatically worldwide, especially in developed countries. EU ETS price surged to 73.28 EUR/ton by the end of 2021, equivalent to a rise of 118%. RGGI, California–Quebec, Korea, and China ETS in 2021, respectively, increased by 75% y-o-y, 70% y-o-y, 40% y-o-y, and 13% compared to the initial price. The carbon tax has kept the same direction as the ETS price. The Canadian government plans to increase their carbon tax gradually to 170 CAD/ton by 2030. China international oil company is confronted with a great challenge to reduce emission cost. Finding a feasible way to realize its carbon neutrality as soon as possible is a matter of corporate life and death.
As
Figure 4 shows, six critical technological avenues are helpful for reducing emission for an entity. Energy efficiency and electrification can directly reduce carbon emissions. Electrification of an LNG plant is proven to be a good choice for reducing carbon emissions [
37]. Taking an example of an LNG plant with a capacity of 6.25 million tons/year, carbon emissions will reduce by 360,000 tons, corresponding to a 26.4 million EUR/year cost savings on emissions. However, energy efficiency and electrification only focus on the entity itself. The solution choice for emission is limited by the technology progress in a specific industry, which means entities cannot leverage all the low-carbon technologies applied in the global market and as a result cannot enjoy the benefits from low-carbon technologies having comparative advantages. Therefore, the carbon market is created and helps market participants find the most cost-effective method (enjoy the benefits of various kinds of low-carbon technologies that have comparative advantages) for emission reduction. Thus, together with low-carbon technologies, the ETS market is also essential for entities working to complete the neutrality goal. Three levels of trading strategies in the carbon market are recommended here for the Chinese international oil company.
4.1. Develop Low Carbon Projects and Trade in One Jurisdiction
The Chinese international oil company has energy business worldwide and also creates carbon emissions globally. Taking the strategy of developing low-carbon projects and trading in one jurisdiction indicates that the Chinese international oil company only needs to focus on the local carbon markets separately. By comparison, λ, the carbon emission rights price,—with the cost of carbon allowance and credits from low-carbon technologies in one market—the company can decide whether to invest in low-carbon projects in a specific market. If λ is higher, the Chinese international oil company shall develop some low-carbon projects to obtain carbon allowance or credits for sale for profit. In contrast, it can just directly purchase carbon allowances and credits to commit to the obligation.
Different places have different resource endowments [
38]. European, Northeast Asia, North Africa, Coast areas of North America, and southern parts of South America are abundant with wind energy. In terms of solar energy, Northeast Asia, Southeast Asia, South Asia, West Asia, and Africa are rich. In the Americas, parts of the USA and Chile are also sufficient. For hydropower, it is mainly distributed in Northeast Asia, Southeast Asia, South America, and North America. Obviously, the local carbon market has comparative advantages on one or several renewable technologies due to the location resource endowment. Branches of the Chinese international oil company should focus on low-carbon projects that have the most of comparative advantages in the local carbon market, in order to obtain the benefits of low-carbon technologies in local carbon markets.
4.2. Develop Low Carbon Projects and Trade in Different Jurisdictions
Cop 26 approved Article 6 in the Paris Agreement, which sets out a framework for international cooperation enabling countries to meet their climate commitments through the transfer of mitigation outcomes [
39]. As shown in
Table 2, different carbon markets have been slightly connected by carbon credits issued by global top standards. In the near future, the globalization of carbon markets will accelerate under the guidance of Article 6. More and more carbon credit and allowances will be acknowledged by different carbon markets, indicating a strong connection among local carbon markets.
In this case, the Chinese international oil company needs to have a global vision to deploy a carbon neutrality strategy, from which it can enjoy all the benefits from low-carbon technologies worldwide. It shall compare the highest
λ from carbon markets around the world to the lowest cost of carbon allowance and credits worldwide. The arbitrage between carbon markets due to price differences may gradually surpass the profit from local trading. CCUS cost can vary greatly by CO
2 source, from a range of 15–25 USD/ton CO
2 for industrial processes producing “pure” or highly concentrated CO
2 streams to 40–120 USD/ton CO
2 for processes with “dilute” gas streams [
40]. CCUS projects with low cost will become more and more popular worldwide for carbon credit arbitrage.
Close international cooperation among local carbon markets is essential for the globe to realize carbon neutrality in 2050 [
41]. National markets need to be interconnected to accelerate innovation and to set international standards for carbon allowance and credit circulation in order to coordinate the spread of clean technologies. For many rich countries, achieving net zero emissions will be more difficult and expensive without international cooperation. For many developing countries, the path to net zero emissions will be unclear without international assistance. Providing critical technologies, infrastructure, and financial support is necessary for developing countries to reach the same emission reduction progress. If not, carbon neutrality may be delayed to 2090, rather than 2050.
China has already taken both domestic and international measures to commit to its carbon goals.
Belt and Road Initiative has been carried out for 9 years. A total of 136 countries and 30 international organizations—spreading over Asia, Europe, Africa, Latin America, and South Pacific—signed
Belt and Road Initiative cooperation documents with China. With the green development of the
Belt and Road Initiative, ecological protection cooperation is a priority of the
Belt and Road Initiative [
42]. Furthermore,
South–South cooperation is another avenue for China and other developing countries to meet the climate challenge together. The connection between carbon markets according to Article 6 under
Belt and Road Initiative and
South–South cooperation is an irresistible trend [
43]. The Chinese international oil company can leverage the bilateral preferential policies under
Belt and Road Initiative and
South–South cooperation to purchase or produce the lowest cost carbon credits or allowances in a single carbon market connected to the China market. As a result, in terms of a single entity, the Chinese international oil company is capable of realizing carbon neutrality with lower price carbon emission rights. More importantly, in terms of China’s national obligation on carbon emissions, the Chinese international oil company can import sufficient carbon emission rights with less cost and make contributions to national carbon neutrality.
4.3. Trade Carbon Credits or Allowance with Physical Commodities
The above two trading strategies are only focused on carbon itself and forget the synergy between carbon credit/allowance and physical energy commodities such as natural gas, crude oil, H
2, and so forth. The international trading of energy products may cause carbon leakage with the development of global carbon market. Countries with more strict carbon policies usually have high carbon emission costs, which can lead to a competitive disadvantage for goods produced by that country. The EU, US, and Canada are planning to implement CBAM to avoid carbon leakage during international trading. The physical energy commodities accompanied by acceptable carbon allowances and credits should be more popular for importers in areas with CBAM. Recently, carbon neutral products have been created as an innovative concept to help entities realize carbon neutrality, such as carbon neutral LNG [
44], crude oil [
45], and H
2 [
46]. PetroChina International Co., Ltd. is one of the pioneers to deploy carbon neutral LNG business globally. It signed world’s first term contract with Shell for carbon neutral LNG and received the first cargo shipment at Dalian port on 6 July 2021.
Considering the synergy between fuels and carbon credit/allowance is a critical and creative method to ensure carbon emission reduction is a profitable business. In some cases, calculating economics only in terms of carbon trading may run out of money. While considering carbon neutral fuels, trading may be in the money. Compared with other international oil companies, the Chinese international oil company has a privileged advantage in its carbon neutrality due to China’s lack of both fuel and carbon emission rights for climate commitment. China is a major importer of LNG, crude oil, and future H
2 [
26,
47]. Importing international carbon emission rights together with the fuels is an effective way for China to meet its carbon goals. The Chinese international oil company provides carbon neutral fuels to China. Not only can it reduce emissions and make a profit in terms of entity, but it also ensures national energy safety and assists in national carbon goals.
5. Conclusions
With the global acceleration of energy transition, policies to reduce carbon emission have sprung up like mushrooms worldwide. The Chinese international oil company is under severe carbon cost pressure both from domestic and overseas regulations. Most studies on the carbon market focus on theoretical explorations, such as price predicting models, policy analysis, and interactions with critical influence factors (e.g., COVID-19). While this work has high practicability and systematic properties and is devoted to finding a feasible avenue for the Chinese international oil company to realize its carbon neutrality by taking part in the global carbon market. A comprehensive illustration of the global carbon market is provided by comparing compulsory and voluntary markets. It is found that several kinds of popular carbon credits are a critical connection among compulsory and voluntary markets. In addition, a calculation concept for carbon emission rights price λ is introduced for the implementation of carbon trading. Most important of all, based on the profound studies on carbon market, three levels of trading strategies are developed for a cost-effective method for realizing an entity’s carbon neutrality. These are: Developing low-carbon projects and trading in one jurisdiction; developing low-carbon projects and trading in different jurisdictions; and trading carbon credits or allowances with physical commodities. In this order, the complexity increases. However, the flexibility and possibility to make profits are higher. With the three levels of trading strategies, the Chinese international oil companies cannot only fulfill the global carbon neutrality goals in terms of themselves but also assist both in achieving national energy safety and national carbon goals.
While it should be recognized that the present work provides some simplification assumptions on the settings of parameters r and . In the future, more sophisticated and authentic calculation methods will be developed to help the three level trading strategies more successfully contribute to reducing the Chinese international oil companies’ carbon costs.
Author Contributions
Conceptualization, D.W. and J.Y.; methodology, D.W. and J.Y.; investigation, D.W. and J.Y.; data curation, D.W. and J.Y.; writing—original draft preparation, D.W. and J.Y.; writing—review and editing, D.W. and J.Y. All authors have read and agreed to the published version of the manuscript.
Funding
This research received no external funding.
Institutional Review Board Statement
Not applicable.
Informed Consent Statement
Not applicable.
Data Availability Statement
Not applicable.
Conflicts of Interest
The authors declare no conflict of interest.
References
- Wei, Y.-M.; Han, R.; Liang, Q.-M.; Yu, B.-Y.; Yao, Y.-F.; Xue, M.-M.; Zhang, K.; Liu, L.-J.; Peng, J.; Yang, P.; et al. An integrated assessment of INDCs under shared socioeconomic pathways: An implementation of C3IAM. Nat. Hazards 2018, 92, 585–618. [Google Scholar] [CrossRef]
- Luiz, M.; Raquel, B.; Gustavo, S.; Brian, C.; Rachel, G.; Jason, G.; Maureen, H.; Blayne, M.; Jeremy, N.; Amy, N.; et al. Emissions Trading Worldwide; International Carbon Action Partnership: Berlin, Germany, 2022. [Google Scholar]
- Santikarn, M.; Churie Kallhauge, A.N.; Bozcaga, M.O.; Sattler, L.; Mccormick, M.S.; Ferran Torres, A.; Conway, D.; Mongendre, L.; Inclan, C.; Mikolajczyk, S.; et al. State and Trends of Carbon Pricing; The World Bank: Washington, DC, USA, 2021. [Google Scholar]
- Wei, Y.-M.; Chen, K.; Kang, J.-N.; Chen, W.; Wang, X.-Y.; Zhang, X. Policy and management of carbon peaking and carbon neutrality: A literature review. Engineering 2022, in press. [Google Scholar] [CrossRef]
- Kollmuss, A.; Zink, H.; Polycarp, C. Making Sense of the Voluntary Carbon Market: A Comparison of Carbon Offset Standards; WWF Germany: Berlin, Germany, 2008. [Google Scholar]
- Zhou, K.; Li, Y. Carbon finance and carbon market in China: Progress and challenges. J. Clean. Prod. 2019, 214, 536–549. [Google Scholar] [CrossRef]
- Zhou, J.; Wang, S. A carbon price prediction model based on the secondary decomposition algorithm and influencing factors. Energies 2021, 14, 1328. [Google Scholar] [CrossRef]
- Hao, Y.; Tian, C.; Wu, C. Modelling of carbon price in two real carbon trading markets. J. Clean. Prod. 2020, 244, 118556. [Google Scholar] [CrossRef]
- Li, G.; Ning, Z.; Yang, H.; Gao, L. A new carbon price prediction model. Energy 2022, 239, 122324. [Google Scholar] [CrossRef]
- Tavoni, M.; Sohngen, B.; Bosetti, V. Forestry and the carbon market response to stabilize climate. Energy Policy 2007, 35, 5346–5353. [Google Scholar] [CrossRef]
- Dou, Y.; Li, Y.; Dong, K.; Ren, X. Dynamic linkages between economic policy uncertainty and the carbon futures market: Does COVID-19 pandemic matter? Resour. Policy 2022, 75, 102455. [Google Scholar] [CrossRef]
- Dong, F.; Gao, Y.; Li, Y.; Zhu, J.; Hu, M.; Zhang, X. Exploring volatility of carbon price in European Union due to COVID-19 pandemic. Environ. Sci. Pollut. Res. 2022, 29, 8269–8280. [Google Scholar] [CrossRef]
- Zhong, Y.; He, Y.; Wei, Q.; Zhang, Z.; Deng, M.; Tang, X.; Huang, W.; Zhang, W.; Xiang, L.; Zhao, J.; et al. Research Report on the Contribution of Chinese Energy Enterprises to Low-Carbon Development; China Energy News: Beijing, China, 2021; Available online: https://www.dx2025.com/wp-content/uploads/2022/03/research_report_on_the_contribution_of_chinese_energy_enterp.pdf (accessed on 20 August 2022).
- Mildenberger, M.; Lachapelle, E.; Harrison, K.; Stadelmann-Steffen, I. Limited impacts of carbon tax rebate programmes on public support for carbon pricing. Nat. Clim. Chang. 2022, 12, 141–147. [Google Scholar] [CrossRef]
- Peng, Y.; Ellis, A. Why Are Carbon Offsets and Voluntary Carbon Markets Important? IHS Markit: London, UK, 2021. [Google Scholar]
- Hu, Y.-J.; Yang, L.; Duan, F.; Wang, H.; Li, C. A Scientometric Analysis and Review of the Emissions Trading System. Energies 2022, 15, 4423. [Google Scholar] [CrossRef]
- Management Professional Group. Policies and Implications of Carbon Emission Reduction in Major Global Economies—Part of the European Union. 2021. Available online: https://m.thepaper.cn/baijiahao_15222720 (accessed on 20 August 2022).
- Center for Climate and Energy Solutions. Carbon Tax Basics. Available online: https://www.c2es.org/content/carbon-tax-basics/ (accessed on 20 August 2022).
- Liu, W.; Li, Y.; Liu, T.; Liu, M.; Wei, H. How to promote low-carbon economic development? a comprehensive assessment of carbon tax policy in China. Int. J. Environ. Res. Public Health 2021, 18, 10699. [Google Scholar] [CrossRef] [PubMed]
- Peng, Y.; Ellis, A. How Are European IOCs Pricing Carbon in the Energy Transition? IHS Markit: London, UK, 2020. [Google Scholar]
- Cames, M.; Harthan, R.O.; Füssler, J.; Lazarus, M.; Lee, C.M.; Erickson, P.; Spalding-Fecher, R. How Additional Is the Clean Development Mechanism; Analysis of the application of current tools and proposed alternatives; Oeko Institute: Berlin, Germany, 2016. [Google Scholar]
- Kollmuss, A.; Schneider, L.; Zhezherin, V. Has Joint Implementation Reduced GHG Emissions?: Lessons Learned for the Design of Carbon Market Mechanisms; Stockholm Environment Institute: Stockholm, Sweden, 2015. [Google Scholar]
- Li, L.; Ye, F.; Li, Y.; Chang, C.T. How will the Chinese Certified Emission Reduction scheme save cost for the national carbon trading system? J. Environ. Manag. 2019, 244, 99–109. [Google Scholar] [CrossRef]
- Kuusi, T.; Björklund, M.; Kaitila, V.; Kokko, K.; Lehmus, M.; Mechling, M.; Oikarinen, T.; Pohjola, J.; Soimakallio, S.; Wang, M. Carbon Border Adjustment Mechanisms and Their Economic Impact on Finland and the EU; Prime Minister’s Office: Helsinki, Finland, 2020.
- Fragkos, P.; Fragkiadakis, K.; Paroussos, L. Reducing the decarbonisation cost burden for EU energy-intensive industries. Energies 2021, 14, 236. [Google Scholar] [CrossRef]
- Gielen, D.; Gorini, R.; Leme, R.; Prakash, G.; Wagner, N.; Janeiro, L.; Collins, S.; Kadir, M.; Asmelash, E.; Ferroukhi, R.; et al. World Energy Transitions Outlook: 1.5 °C Pathway; IRENA: Masdar City, United Arab Emirates, 2022. [Google Scholar]
- 2022 Global CCUS Technology and Application Special Report; Deeptech: Beijing, China, 2022.
- GWEC Global Wind Report 2019; Global Wind Energy Council: Brussels, Belgium, 2022.
- Renewable Power Generation Costs in 2020; IRENA: Masdar City, United Arab Emirates, 2021.
- Power Generation Costs. IRENA. 2022. Available online: https://www.irena.org/costs/Power-Generation-Costs/Hydropower (accessed on 20 August 2022).
- Global Hydrogen Trade to Meet the 1.5 °C Climate Goal: Part III Green Hydrogen Cost and Potential; IRENA: Masdar City, United Arab Emirates, 2022.
- Mi, J.; Ma, X.F. Development trend analysis of carbon capture, utilization and storage technology in China. Proc. CSEE 2019, 39, 2537–2544. [Google Scholar]
- Mirza, N.; Kearns, D. State of the Art: CCS Technologies 2022; Global CCS Institute: Melbourne, Australia, 2022. [Google Scholar]
- Zhang, F.; Wang, S.; Li, Y.; Yang, J.; Sun, S. Analysis of CO2 emission and countermeasures and suggestions for emission reduction in Chinese manufacturing. Chem. Ind. Eng. Prog. 2021, 41, 1645–1653. [Google Scholar]
- Zhang, S. Molecular dynamics simulation of shale oil occurrence in Dongying Depression. Editor. Dep. Pet. Geol. Recovery Effic. 2021, 28, 74–80. [Google Scholar]
- Wang, Y. The shadow pricing model for carbon assets. China Econ. Trade Her. 2019, 2, 29–30. [Google Scholar]
- Devold, H.; Nestli, T.; Hurter, J. All Electric LNG Plants. Better, Safer, More Reliable-and Profitable; ABB: Oslo, Norway, 2006. [Google Scholar]
- Peng, P.; Dawei, W. Research on Investment Opportunities of Renewable Energy Projects in Belt and ROAD Partnership Countries for Chinese Enterprises; China New Energy Power Investment and Financing Alliance: Beijing, China, 2021. [Google Scholar]
- Sara, G. Carbon Trading Rules under Debate: The Importance to Trading Credits and the Offset Markets of Article 6 under the Paris Agreement; IHS: London, UK, 2021. [Google Scholar]
- Baylin-Stern, A.; Berghout, N. Is Carbon Capture too Expensive? IEA: Paris, France, 2021. [Google Scholar]
- Bouckaert, S.; Pales, A.F.; McGlade, C.; Remme, U.; Wanner, B.; Varro, L.; D’Ambrosio, D.; Spencer, T. Net Zero by 2050: A Roadmap for the Global Energy Sector; IEA: Paris, France, 2021; Available online: https://www.iea.org/reports/net-zero-by-2050 (accessed on 20 August 2022).
- Guidance on Promoting Green Belt and Road; China National Development and Reform Commission: Beijing, China, 2022.
- Pan, C.; Shrestha, A.; Wang, G.; Innes, J.; Wang, K.; Li, N.; Li, J.; He, Y.; Sheng, C.; Niles, J.-O. A linkage framework for the china national emission trading system (CETS): Insight from key global carbon markets. Sustainability 2021, 13, 7459. [Google Scholar] [CrossRef]
- Blanton, E.; Mosis, S. The Carbon-Neutral Lng Market: Creating; Columbia SIPA Center on Global Energy Policy: New York, NY, USA, 2021. [Google Scholar]
- Carlsson, A.S.; Yilmaz, J.L.; Green, A.G.; Stymne, S.; Hofvander, P. Replacing fossil oil with fresh oil–with what and for what? Eur. J. Lipid Sci. Technol. 2011, 113, 812–831. [Google Scholar] [CrossRef]
- Zeman, F.S.; Keith, D.W. Carbon neutral hydrocarbons. Philos. Trans. R. Soc. A Math. Phys. Eng. Sci. 2008, 366, 3901–3918. [Google Scholar] [CrossRef] [PubMed]
- Dudley, B. BP Statistical Review of World Energy; BP Statistical Review: London, UK, 2021. [Google Scholar]
| Publisher’s Note: MDPI stays neutral with regard to jurisdictional claims in published maps and institutional affiliations. |
© 2022 by the authors. Licensee MDPI, Basel, Switzerland. This article is an open access article distributed under the terms and conditions of the Creative Commons Attribution (CC BY) license (https://creativecommons.org/licenses/by/4.0/).


