Abstract
Bats are important reservoir hosts of emerging viruses. Recent viral outbreaks and pandemics have resulted in an increased research focus on the genetic diversity, population structure, and distribution of bat species. Lyle’s flying fox (Pteropus lylei) is widely distributed throughout central Thailand, with most colonies congregating in temples within proximity to humans. A lack of knowledge regarding the genetic connectivity among different colonies hinders the investigation of zoonotic disease epidemiology and wildlife management. In this study, we hypothesized that genetic material may be exchanged between Lyle’s flying fox colonies that live in proximity. We assessed the mitochondrial displacement loop and cytochrome b nucleotide sequences of samples collected from 94 individuals from ten colonies across different roosting sites and detected limited genetic differentiation but increased nucleotide divergence within colonies. This suggests that genetic connectivity among Lyle’s flying fox colonies has experienced frequent and recent gene flow. These findings indicate that this species has maintained demographic equilibrium in a stable population, with a slight expansion event in certain populations. These data provide insights into the dynamics of bat populations, and the genetic knowledge gained presents opportunities for the improved monitoring of bat population structure.
1. Introduction
Natural systems provide numerous ecological services necessary to sustain life. Ecosystem changes resulting from the growing global human population has led to the increased emergence of infectious diseases, such as COVID-19, and loss of biodiversity and fragmentation of habitats [1,2,3]. This progressing urbanization has resulted in the loss of ecosystems, thereby increasing disease and health risks in several species [1,4]. Globally, the majority of infectious diseases in humans are zoonotic, with 70% being wildlife-derived zoonotic diseases, a proportion which continues to increase [5,6,7]. Subsistence bush-meat consumption, wildlife farming, and trade bring people into contact with diverse wildlife and novel pathogens.
Approximately 1400 bat species have been identified globally that are classified into the suborders Megachiroptera and Microchiroptera [8,9]. Bats constitute the second largest group of mammalian species and have been documented as the natural hosts of numerous diverse viruses that cause diseases, including rabies, Nipah, Hendra virus infections, and Marburg virus disease [10]. Bat-borne zoonotic pathogens have gained notoriety as a leading factor contributing in the emergence of diseases transmitted directly from bats to humans or via intermediate livestock, companion animal hosts, or parasites, which may lead to epidemics [11]. Bats are predisposed to the acquisition and maintenance of viruses due to the large size of their social groups [11]. Several novel coronaviruses, which have caused various outbreaks of human diseases such as severe acute respiratory syndrome (SARS), Middle East respiratory syndrome (MERS), and severe acute respiratory syndrome coronavirus 2 (SARS-CoV-2), have been discovered in a wide variety of bat species [12]. Virus shedding and transmission between populations and species have been reported during the peripartum period from the mothers in the whole colony [13]. Therefore, understanding their genetic connectivity and the transmission of viruses within the population is of high priority with regards to pandemic preparedness [14]. Despite the potentially serious consequences of epidemics caused by bat-derived viruses, current understanding of the biology and distribution of the bat reservoir population is inadequate.
Flying fox bats (Pteropus, Pteropodidae, Megachiroptera) are widely distributed in the tropical forests of south Asia, southeast Asia, Australia, and east Africa. All flying foxes feed primarily on a combination of fruit, nectar, and pollen [15]. The genus Pteropus comprises 65 species of flying fox and is by far the largest genus in the family Pteropodidae [16,17]. From 1998 to 1999, in Malaysia and Singapore, Pteropus spp. was a reservoir for the Nipah virus, which is a zoonotic paramyxovirus identified as the cause of an encephalitis outbreak in humans [18]. Lyle’s flying fox (Pteropus lylei) is largely distributed throughout Cambodia, Thailand, and Vietnam, and each colony is composed of 100 to 1000 individuals [19]. Lyle’s flying fox remains relatively conspicuous in some areas; however, most current populations are only a fraction of their former size [15] owing to their rapid decline due to human activities [20]. These bats are frequently sold as a luxury food item in commercial trade, hunted for sport and food, or killed by farmers to protect their orchards. Such activities can facilitate human exposure to zoonotic pathogens [21]. In Thailand, Lyle’s flying fox has been frequently observed near temples. At least 30 colonies of Lyle’s flying fox were located in 16 regions: Phranakhonsiayutthaya, Angthong, Bangkok, Chainat, Kanchanaburi, Nakhonpathom, Nakhonnayok, Saraburi, Singburi, Samutprakan, Samutsongkham, Suphanburi, Sakaeo, Chonburi, Chachoengsao, and Prachinburi [22,23,24]. In Thailand, the largest known colony comprises approximately 8000 individuals, and the total population is estimated at 75,000 [22]. Lyle’s flying fox populations are known to migrate between sites that are 2.2 km to 23.6 km apart [25]. However, the genetic connectivity between the colonies, which is a crucial part of zoonotic epidemiology and wildlife management [26], has not yet been comprehensively researched [25,27].
Hypothetically, there is evidence of exchange of genetic materials between individuals of different colonies and gene flow distribution of bat dispersal throughout the country. Therefore, we examined the genetic diversity and population structure of ten colonies of Lyle’s flying fox using mitochondrial displacement loop (D-loop) and cytochrome b (Cytb) nucleotide sequence analyses to facilitate an understanding of the genetic connectivity among the populations. The mitochondrial D-loop and Cytb sequences are widely used to study bat genetic diversity under different mutation rates [28,29]. Both D-loop and Cytb regions exhibit high levels of variability and a supposed neutral mode of evolution, thereby reflecting demographic effects [30,31]. Understanding the genetic distribution and population characteristics of wild bats in relation to several potential zoonotic pathogens can optimize the management of the biological needs of bats and their habitats and, ultimately, ensure the health of humans, livestock, and wildlife species.
2. Materials and Methods
2.1. Specimen Collection and DNA Extraction
All experimental procedures followed protocols that were approved by the Department of National Parks, Wildlife and Plant Conservation, Thailand (No. 0909.204/2686) and the Chulalongkorn University Animal Care and Use Committee, Bangkok, Thailand (Animal Use Protocol No. 1473001). We collected samples from the roosting sites of Lyle’s flying fox (P. lylei) across central Thailand via several visits between March and June 2014. In total, 94 individuals from ten colonies were captured after 16:00 pm using mist nets. The blood samples were previously studied [32] for genetic relationships among Lyle’s flying fox individuals; however, we performed all molecular experiments with new blood samples in the present study. The bats were kept in soft cloth bags and released after body measurement and blood sample collection. Detailed information on the sampled individuals is presented in Table 1. Immediately following capture, the forearm, hindfoot, ear, head, and body of the bats were measured, and the species were identified using a specific field guide [33]. Individuals were classified as Lyle’s flying fox based on their morphology, behavior, and habitat [15,34,35]. Blood specimens were collected from a blood vessel around the wing base using a 24-gauge needle attached to a 2 mL disposable syringe. For the DNA extraction, a spot of blood was placed on an FTA filter paper (Whatman Asia Pacific Pte. Ltd., Singapore) and allowed to air dry [36], and the filter paper was placed in a Ziploc bag containing a desiccant and maintained at 25 °C. Multiple spots of blood were collected on filter paper for each bat, and a different spot from each bat was used for duplicate experiments. Total genomic DNA was extracted in accordance with the standard salting-out protocol, as described previously [37]. Each blood sample was evaluated by gel electrophoresis, and DNA concentration and quality were measured using NanoDrop™ 2000 (Thermo Fisher Scientific, Waltham, MA, USA) for the presence of high-molecular-weight DNA, and samples were stored at −20 °C until DNA analysis.

Table 1.
Sampled populations of Lyle’s flying fox (Pteropus lylei) at roosting sites in central Thailand (Duengkae et al., 2015) [24,32].
2.2. Mitochondrial D-Loop and Cytb Sequencing
Mitochondrial displacement loop (mt D-loop) and cytochrome b (mt Cytb) nucleotide sequences were selected as candidate regions to evaluate the genetic variability among Lyle’s flying fox individuals, as described previously [28]. The mt D-loop fragments were amplified using the primers RodmtU (5′-GCTGAGGTTCTACTTAAACT3-3′) and RodmtL (5′-GAGATGTCTTATTTAAGGGG-3′), whereas the mt Cytb fragments were amplified using the primers L14724 (5′-CGAAGCTTGATATGAAAAACCATCGTTG-3′) and H15915R (5′-GGAATTCATCTCTCCGGTTTACAAGAC-3′) [28]. PCR amplification was performed using 25 µL of 1 × PCR Gold Buffer (Applied Biosystems, Carlsbad, CA, USA), 2.5 mM MgCl2, 0.8 mM dNTPs, 5.0 μM of each primer (Integrated DNA Technologies, Coralville, IA, USA), 0.125 U AmpliTaq Gold (Applied Biosystems), and 25 ng of genomic DNA. The PCR conditions were as follows: initial denaturation at 98 °C for 1 min, followed by 30 cycles of 98 °C for 10 s, 50 °C for 30 s, 72 °C for 45 s, and a final extension of 72 °C for 10 min. The PCR products were detected using 1% agarose gel electrophoresis. Nucleotide sequences of the DNA fragments were obtained using the Sanger DNA sequencing services of First BASE Laboratories Sdn Bhd (Seri Kembangan, Selangor, Malaysia). The BLASTn (Nucleotide Basic Local Alignment Search Tool) program (http://blast.ncbi.nlm.nih.gov/Blast.cgi, accessed on 18 January 2022) was used to confirm sequence identity against the nucleotide sequences in the National Centre for Biotechnology Information (NCBI) database. All sequences were deposited in the DNA Data Bank of Japan (Table S1).
2.3. Genetic Diversity and Population Structure
Multiple sequence alignment was performed for 94 sequences for each of the mt D-loop and Cytb data sets, all unalignable, gap-containing sites, estimates of haplotype (h) and nucleotide (π) diversity, number of haplotypes, and average number of nucleotide differences using a previous study method, as previously described by Wongtienchai et al., 2021 [4].
Bayesian analysis was performed to estimate the migration rate and effective population size based on the coalescent theory using the mt D-loop and Cytb data sets with the MIGRATE-N software version 4.4.3 (Tallahassee, FL, USA) [38]. Uniform prior distributions were used as the basic DNA sequence model. For the Markov chain Monte Carlo (MCMC) procedure, 5000 steps were recorded for every 100 generations. The first 100,000 generations were discarded as burn-in. Parameters estimated from the genetic data included mutation-scaled immigration rate (M), mutation-scaled population size (θ), and the number of effective migrants per generation (Nm, calculated as θM/2) [39].
The genetic structure of each colony data set was examined in relation to their geographic location using a previous study method, as previously described by Ariyaraphong et al., 2021 [40].
2.4. Demographic History
The statistical parsimony network of the consensus sequences and demographic history were determined using the statistical test of neutrality, as previously described by Wongtienchai et al., 2021 [4].
Bayesian coalescent-based methods were then performed to evaluate the historical demographic fluctuations using a previous study method, as previously described by Ariyaraphong et al., 2021 [39]. For the mean substitution rate, the prior was set as a log-normal distribution with a mean of 5.17% per million years and a standard deviation of 5.00% per million years to match the rate estimated from fossil data [41,42].
3. Results
3.1. Haplotype Diversity and Population Structure
The amplicon and alignment length of the mt D-loop and mt Cytb sequences were 550 bp and 430 bp and 1299 bp and 1110 bp, respectively. The number of haplotypes for the mt D-loop and mt Cytb data set was 13 and 29, respectively. Overall haplotype and nucleotide diversities for the mt D-loop sequences were 0.727 ± 0.034 and 0.017 ± 0.010 (Table 2) and, for the mt Cytb sequences, 0.944 ± 0.010 and 0.006 ± 0.003 (Table 3). A complex haplotype network was constructed from the large number of detected polymorphic sites and haplotypes (Figure 1). Haplotype networks for the mt D-loop and mt Cytb data sets exhibited a star-shaped topology (Figure 1), with the most common haplotype (DL2) of the mt D-loop being from the AY1 colony. Eight haplotypes (DL1, DL2, DL3, DL4, DL5, DL6, DL7, and DL8) were shared among one of the AY1, AY2, AY3, AT1, SB1, PBR1, PBR2, CH1, CH2, or CHS1 colonies (Table 1). The most common haplotype (CL10) of the mt Cytb was from the AY1 colony. Fifteen haplotypes (CL1, CL2, CL3, CL4, CL5, CL6, CL7, CL8, CL9, CL10, CL11, CL12, CL13, CL14, and CL15) were shared in one of the AY1, AY2, AY3, AT1, SB1, PBR1, PBR2, CH1, CH2, or CHS1 colonies.
Table 2.
Mitochondrial D-loop sequence diversity for Lyle’s flying fox (Pteropus lylei) in all sampled colonies.
Table 3.
Cytochrome b sequence diversity for Lyle’s flying fox (Pteropus lylei) in all sampled colonies.
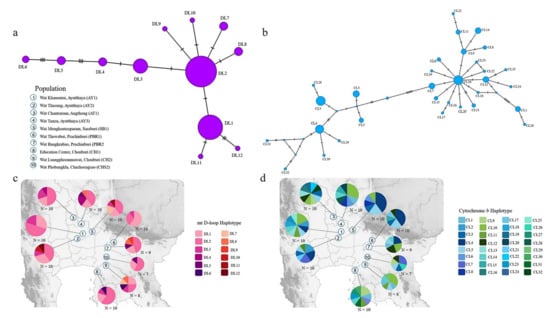
Figure 1.
Haplotype network based on nucleotide sequence data for (a) mt D-loop and (b) mt Cytb of 94 sampled individuals of Lyle’s flying fox (Pteropus lylei). Colors correspond to the ten colonies, and each circle represents a unique DNA sequence (haplotype). Numbers of individuals possessing each haplotype are indicated by different colors inside the circles. Haplotype map of Lyle’s flying fox (Pteropus lylei) for (c) mt D-loop and (d) mt Cytb for 12 and 32 haplotypes identified for the mt D-loop and mt Cytb sequences.
To examine the genetic differentiation between the ten colonies, we calculated FST, GST, ΦST, Nm, Dxy, and Da, which ranged from −0.024 to 0.013, −0.017 to 0.047, 0.010 to 0.066, −8.39 to 13.81, 0.006 to 0.018, and −0.001 to 0.002, respectively, for the mt D-loop and mt Cytb sequences (Tables S2 and S3). The MIGRATE-N were independent runs for each mt D-loop and Cytb sequence. The posterior distributions for each parameter were also well defined (Table S4), thus, facilitating the generation of point estimates and credibility intervals for each parameter. Gene flow estimates were high among all the colonies. The Mantel tests revealed negative correlations between genetic divergence and geographic distance, which demonstrated no spatial genetic patterns with regard to landscape discontinuities from isolation by distance (Tables S2 and S3). The LSI analyses revealed genetic differences, thus, indicating genetically divergent areas for the ten colonies (Figure 2). Relatively high nucleotide diversities were detected in the colonies AY1, AY2, and SB1 (Figure 2). The LSI plots demonstrate a strong correlation between the urban location and high genetic distances, thereby indicating that the genetic distances were greatest between individuals in populations located in areas around temples in urban and highway settings (Figure 2).
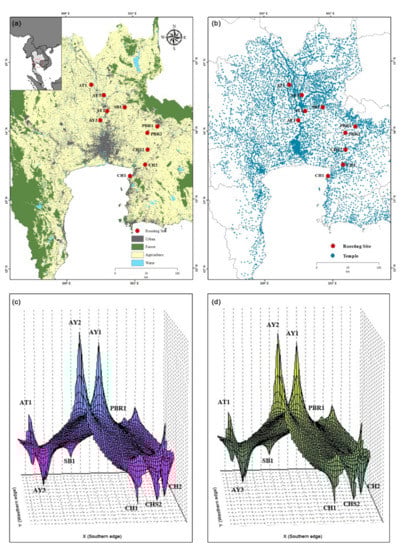
Figure 2.
Analyses of the Pteropus lylei data set. (a) Geographic distribution of the ten P. lylei colonies and (b) geographic distribution of temples in Thailand. Genetic landscape interpolation plots for (c) mt D-loop and (d) mt Cytb, depicting areas with high or low genetic differentiation based on geographic coordinates.
3.2. Demography of the Ten Bat Colonies
Five neutrality tests were used to observe historical population expansion of the sampled populations. Tajima’s D values were non-significant and ranged from −1.695 (p < 0.05) to 1.410 (p = 0.919; the Fu and Li’s F* values were non-significant and ranged from −2.171 (p = 0.186) to 0.740 (p = 0.675); the Fu and Li’s D* values were non-significant and ranged from −2.388 (p = 0.255) to 0.638 (p = 0.638); and the Ramos-Onsins and Rozas’s R2 values ranged from 0.097 to 0.198 for the mt D-loop and mt Cytb sequences (Table 4 and Table 5). The mismatch distribution analysis indicated a multimodal distribution for mt D-loop and mt Cytb sequences, which suggests that Lyle’s flying fox has undergone demographic equilibrium or has a stable population. The raggedness index values ranged from 0.025 (p = 1.000) to 0.686 (p < 0.05). Bayesian skyline plots based on the mt D-loop and mt Cytb sequences detected a slight population expansion event for Lyle’s flying fox (Figure S1). We observed that the population size of Lyle’s flying fox remained constant over a long period of time; however, the population began to expand between 1980 and 1990 (Figure S1).
Table 4.
Neutrality tests of the D-loop sequence for Lyle’s flying fox (Pteropus lylei) from ten colonies.
Table 5.
Neutrality tests of the cytochrome b sequence for Lyle’s flying fox (Pteropus lylei) from ten colonies.
4. Discussion
Lyle’s flying fox is an important reservoir for certain viruses and plays an important role in the transmission of these viruses. Thus, understanding the ecology of the species is important for research on the emergence of infectious diseases [43,44]. Urbanization is characterized by rapid intensification of agriculture, socioeconomic change, and ecological fragmentation and can have profound impacts on the epidemiology of an infectious disease through increased contact between humans and bats [45]. The noise and smell from bat colonies, and concerns about disease transmission, often result in a conflicted relationship with humans [46]. The foraging activities of flying foxes can damage a wide variety of fruit crops and cause considerable economic losses that exacerbate this conflict [47]. In Thailand, populations of Lyle’s flying fox are often observed roosting in trees on temple grounds, where they are safe from being hunted by humans [46,47]. Several bat species are openly hunted in Thailand; however, the Thai temples play an important role in preserving Lyle’s flying fox population dynamics and gene flow at the landscape level, as Thai culture discourages hunting in temples. This custom may generate the rapid expansion of each population, ultimately resulting in large numbers of individuals per population [27].
All FST values of population pairs were less than 0.25, which suggests that genetic differentiation had not occurred between the populations without isolation by distance. Average GST and ΦST values were −0.003 and 0.056, respectively, which indicates that the genetic diversity occurred predominantly within populations. This finding was consistent with the contrasting relationship between the Dxy and Da values and suggests that, although Lyle’s flying fox populations have historically diverged, gene flow is still a frequent occurrence between populations. All tests of genetic differentiation indicated that Lyle’s flying fox populations were not genetically differentiated from each other. Most Nm values were infinity values, which indicates the presence of gene flow between populations. This suggests that high gene flow between populations can slow down or prevent geographic and genetic differentiation.
Mitochondrial Cytb sequences indicated low Nm values between all possible pairs of the colonies AY1, AY2, AT1, AY3, SB1, and PBR1, whereas mt D-loop sequences presented low Nm values between most populations and PBR1. The PBR1 population was probably geographically distant from the other populations (Figure 2), which resulted in decreased genetic connectivity. Individuals in PBR1 may be unable to disperse to other temples due to the human–wildlife-conflict-induced hunting. Human–wildlife conflict may explain the heterogeneous distribution of Lyle’s flying fox by shaping the distribution of bat populations in urban and rural areas [46,47,48,49]. However, this does not explain the fact that the colonies in proximity, PBR1 and PBR2, still experienced minimal gene flow when compared with that of the other colonies. A possible explanation is that, based on the present landscape, interpolation plots, and land use (Figure 2), large agricultural areas with few temples are likely to act as natural barriers to dispersal, in addition to the geographic isolation of colony PBR1. A more uniform distribution of Thai temples could further influence movements involving PBR1, where the gene flow with other populations was relatively low but population density was high [22]. The present results demonstrate the effect of temple distribution on Lyle’s flying fox dispersal and are supported strongly by previous research [49]. Adams (1997) [50] asserted that Lyle’s flying fox adults may move to other habitats to forage for food for their young, which may be the reason for the migration of individuals from colony PBR1 to colony PBR2. Alternatively, two male adults might compete in courtship for a female during the mating season, and the weaker male might subsequently retreat or migrate to another colony to avoid interaction [51]. Thus, social interactions between individuals might critically influence the genetic connectivity between the colonies PBR1 and PBR2.
Neutrality tests for Tajima’s D [52] and Fu’s Fs [53] were conducted to examine the population history of Lyle’s flying fox. These parameters estimate deviation from neutrality based on the expectation of constant population size at mutation–drift equilibrium. In this study, the negative Tajima’s D in most populations suggested an excess of low-frequency polymorphisms relative to expectations, which is indicative of historical population expansion or positive selection [52]. By contrast, positive neutrality tests for colonies AY1, AY2, AT1, SB1, and PBR1 indicated the state of balancing selection [54] and ruled out the possibility of genetic hitchhiking, background selection, and evolutionary forces that produce a pattern similar to historical population expansion [52,55,56]. However, the overall neutrality test statistics in most populations were not statistically significant and were consistent with a population equilibrium. Mismatch distribution plots demonstrated a multimodal and ragged shape in all colonies, which also suggests demographic equilibrium or a stable population [57]. The hypothesis that the observed data fit the sudden expansion model was tested using the raggedness index [58]. The non-significant raggedness values indicated that the population expansion occurred recently [59], which is consistent with the results of network analyses and the star-shaped topology. This finding agrees with the combination of high haplotype diversity and low nucleotide diversity also observed in this study as a signature of rapid demographic expansion from a small effective population size [60]. The π value offers a more reliable reflection of mtDNA diversity in a population when compared to the h value [37], which reflects recent changes in a population [61]. Different demographic histories exhibited by various tests might result from the influence of high gene flow [62]. The limited number of samples analyzed must also be noted [63]. Spatial genetic patterns in Lyle’s flying fox, as revealed by LSI analysis, suggest that the areas differed in the degree of genetic divergence. We observed greater genetic divergence within the colony AY2 compared within AY3. A full complement of temples in urban areas around the bat populations possibly assisted movements. This finding agreed with a previous study [25], which reported a correlation between the abundance of Lyle’s flying foxes and number of temples. High variation in the genetic diversity of Lyle’s flying fox or other bat species can be attributed to landscape discontinuities, such as those in temples or urban areas, that facilitate or impede gene flow or dispersal between adjacent populations [19]. Landscape topography may also influence the flow of population migration. Beneficial genetic variation generally accumulates and is maintained in a rapidly growing population [64], which suggests that the lineage is widespread [59,65,66]. In the present study, the EBSP indicated an increase in the population size, particularly between 1980 and 1990. This finding suggests the possibility that the ten Lyle’s flying fox populations may have arisen from rapid growth, with free gene flow due to geographical contiguity and the absence of forces that lead to population structuring, which has resulted in a multimodal mismatch distribution.
5. Conclusions
Genetic monitoring of Lyle’s flying fox populations provides useful information for future health and conservation management, as well as the planning and monitoring of future bat-borne viruses and bat reservoir populations. This requires intersectoral collaboration, timely and transparent communication, improved capacity, political commitment, and regional and international cooperation within the One Health framework; this might involve individuals with minimal knowledge of the respective topics from the public health, biological, wildlife, forestry, laboratory diagnostic, veterinary, or agricultural sectors. Moreover, as many geographically isolated Lyle’s flying fox colonies are threatened or endangered, identification of genetically distinct lineages [67] is essential for the establishment of priorities in natural populations and conservation management decisions [68]. Bats generally suffer from a poor public image and a lack of documentation on their values and status. To reduce conflict, wildlife staff are facing the challenge of integrating Lyle’s flying fox populations of densities that are more compatible with the ecological and cultural carrying capacities of local residents. Therefore, further comprehensive research is required to determine the factors that affect connectivity among Lyle’s flying fox populations. Destruction and fragmentation of wild habitats owing to the increase in human activity impact the genetic structure, differentiation, and diversity of Lyle’s flying fox populations [69,70]. Bat research must examine these immediate impacts and use the acquired information to optimize the timely implementation of effective measures.
Supplementary Materials
The following supporting information can be downloaded at: https://www.mdpi.com/article/10.3390/su141710791/s1, Figure S1: Coalescent Bayesian skyline analysis output. (a) mt D-loop and (b) mt Cytb of Lyle’s flying fox (Pteropus lylei). The black line is the median estimated effective population size. The two blue areas represent the upper and lower bounds of the 95% higher posterior density interval. The x-axis represents time in years, and the y-axis represents a log scale; Table S1: Populations of Lyle’s flying fox (Pteropus lylei) at roosting sites in Thailand. All sequences were deposited in the DNA Data Bank of Japan (DDBJ); Table S2: Genetic differentiation between the ten colonies of Lyle’s flying fox (Pteropus lylei) for the D-loop sequence. Genetic differentiation coefficient (GST), Wright’s F-statistics for subpopulations within the total population (FST), ΦST, gene flow (Nm) from sequence data and haplotype data, average number of nucleotide substitutions per site between populations (Dxy), net nucleotide substitutions per site between populations (Da), and Mantel test results; Table S3: Genetic differentiation between the ten colonies of Lyle’s flying fox (Pteropus lylei) for the cytochrome b sequence. Genetic differentiation coefficient (GST), Wright’s F-statistics for subpopulations within the total population (FST), ΦST, gene flow (Nm) from sequence data and haplotype data, average number of nucleotide substitutions per site between populations (Dxy), net nucleotide substitutions per site between populations (Da), and Mantel test results; Table S4: Bayesian estimates of mutation-scaled effective population sizes (Θ) and asymmetric migration rates (M) among Pteropus lylei for the mt D-loop and Cytb sequence. Credibility intervals are reported at 95% for each derived migration rate parameter Nem, reflecting the effective number of migrants per generation.
Author Contributions
Conceptualization, P.D. and K.S.; Data curation, K.S.; Formal analysis, A.C., N.A., N.S., K.J., S.F.A. and N.M.; Investigation, K.S.; Methodology, A.C., N.A., N.S., N.M., P.D. and K.S.; Project administration, K.S.; Resources, P.D.; Software, A.C. and T.P., Supervision, K.S.; Validation, N.A., K.J., S.F.A., N.M. and K.S.; Visualization, A.C., T.P. and K.S.; Writing—original draft, A.C., N.A., P.D. and K.S.; Writing—review and editing, A.C., N.A., N.S., K.J., S.F.A., N.L., W.S., T.P., S.D., N.M., S.W., P.D. and K.S. All authors have read and agreed to the published version of the manuscript.
Funding
This study was financially supported by grants from the Biological Threat Reduction Program (BTRP) of the United States Defense Threat Reduction Agency (DTRA; HDTRA1-08-D-0007) awarded to P.D.; the Thailand Research Fund (TRF; No. RSA6180075) awarded to K.S.; a Research Chair Grant (P-13-01091) by the Cluster and Program Management Office (CPMO) (P-15-50535); the Higher Education for Industry Consortium (Hi-FI; No. 6414400777) awarded to N.A.; the Thailand Science Research and Innovation through the Kasetsart University Reinventing University Program 2021 (No. 3/2564) awarded to T.P.; the Wildlife habitat restoration for prey species of tiger in Dong Phayayen-Khao Yai Forest Complex project (No. P-18-51249) of the National Science and Technology Development Agency (NSTDA) awarded to P.D.; and the Office of the Ministry of Higher Education, Science, Research and Innovation. The funders had no role in the design of the study; in the collection, analyses, or interpretation of data; in the writing of the manuscript; or in the decision to publish the results.
Institutional Review Board Statement
All experimental procedures followed protocols approved by the Department of National Parks, Wildlife and Plant Conservation, Thailand (no. 0909.204/2686) and the Chulalongkorn University Animal Care and Use Committee, Bangkok, Thailand (Animal Use Protocol No. 1473001).
Informed Consent Statement
Not applicable.
Data Availability Statement
All sequences were deposited in the DNA Data Bank of Japan (DDBJ).
Acknowledgments
We thank the Department of National Parks, Wildlife and Plant Conservation for assistance with sample collection and knowledge transfer, and the United States Agency for the International Development (USAID) Emerging Pandemic Threats PREDICT program.
Conflicts of Interest
The authors declare no conflict of interest.
References
- Gibb, R.; Redding, D.W.; Chin, K.Q.; Donnelly, C.A.; Blackburn, T.M.; Newbold, T.; Jones, K.E. Zoonotic host diversity increases in human-dominated ecosystems. Nature 2020, 584, 398–402. [Google Scholar] [CrossRef] [PubMed]
- Luo, D.S.; Li, B.; Shen, X.R.; Jiang, R.D.; Zhu, Y.; Wu, J.; Yi, F.; Herve, B.; Ben, H.; Ge, X.Y.; et al. Characterization of novel rhabdoviruses in Chinese bats. Viruses 2021, 13, 64. [Google Scholar] [CrossRef] [PubMed]
- Guo, H.; Hu, B.J.; Yang, X.L.; Zeng, L.P.; Li, B.; Ouyang, S.; Shi, Z.L. Evolutionary arms race between virus and host drives genetic diversity in bat severe acute respiratory syndrome-related coronavirus spike genes. J. Virol. 2020, 94, e00902-20. [Google Scholar] [CrossRef] [PubMed]
- Wongtienchai, P.; Lapbenjakul, S.; Jangtarwan, K.; Areesirisuk, P.; Mahaprom, R.; Subpayakom, N.; Singchat, W.; Sillapaprayoon, S.; Muangmai, N.; Songchan, R.; et al. Genetic management of a water monitor lizard (Varanus salvator macromaculatus) population at Bang Kachao Peninsula as a consequence of urbanization with Varanus Farm Kamphaeng Saen as the first captive research establishment. J. Zool. Syst. Evol. Res. 2021, 59, 484–497. [Google Scholar] [CrossRef]
- Woolhouse, M.E.; Gowtage-Sequeria, S. Host range and emerging and reemerging pathogens. Emerg. Infect. Dis. 2005, 11, 1842. [Google Scholar] [CrossRef] [PubMed]
- Jones, K.E.; Patel, N.G.; Levy, M.A.; Storeygard, A.; Balk, D.; Gittleman, J.L.; Daszak, P. Global trends in emerging infectious diseases. Nature 2008, 451, 990–993. [Google Scholar] [CrossRef]
- Wang, L.F.; Crameri, G. Emerging zoonotic viral diseases. Rev. Sci. Tech. 2014, 33, 569–581. [Google Scholar] [CrossRef]
- Wilson, D.E.; Reeder, D.M. Mammal Species of the World: A Taxonomic and Geographic Reference, 3rd ed.; Johns Hopkins University Press: Baltimore, MD, USA, 2005; p. 2142. [Google Scholar]
- Hutcheon, J.M.; Kirsch, J.A. A moveable face: Deconstructing the Microchiroptera and a new classification of extant bats. Acta Chiropt. 2006, 8, 1–10. [Google Scholar] [CrossRef]
- Letko, M.; Marzi, A.; Munster, V. Functional assessment of cell entry and receptor usage for SARS-CoV-2 and other lineage B betacoronaviruses. Nat. Microbiol. 2020, 5, 562–569. [Google Scholar] [CrossRef]
- Food and Agriculture Organisation of the United Nations. Investigating the Role of Bats in Emerging Zoonoses: Balancing Ecology, Conservation and Public Health Interests; Newman, S.H., Field, H.E., Jong de, C.E., Epstein, J.H., Eds.; FAO Animal Production and Health Manual: Rome, Italy, 2011; p. 12. [Google Scholar]
- Smith, D.R. Review a brief history of coronaviruses in Thailand. J. Virol. Methods. 2020, 289, 114034. [Google Scholar] [CrossRef]
- Wacharapluesadee, S.; Duengkae, P.; Chaiyes, A.; Kaewpom, T.; Rodpan, A.; Yingsakmongkon, S.; Petcharat, S.; Phengsakul, P.; Maneeorn, P.; Hemachudha, T. Longitudinal study of age-specific pattern of coronavirus infection in Lyle’s flying fox (Pteropus lylei) in Thailand. J. Virol. 2018, 15, 38. [Google Scholar] [CrossRef] [PubMed]
- Okada, P.; Buathong, R.; Phuygun, S.; Thanadachakul, T.; Parnmen, S.; Wongboot, W.; Waicharoen, S.; Wacharapluesadee, S.; Uttayamakul, A.; Maurer-Stroh, S.; et al. Early transmission patterns of coronavirus disease 2019 (COVID-19) in travellers from Wuhan to Thailand, January 2020. Eurosurveillance 2020, 25, 2000097. [Google Scholar] [CrossRef] [PubMed]
- Fujita, M.S.; Tuttle, M.D. Flying foxes (Chiroptera: Pteropodidae): Threatened animals of key ecological and economic importance. Conserv. Biol. 1991, 5, 455–463. [Google Scholar] [CrossRef]
- Simmons, N.B. Order Chiroptera. In Mammal Species of the World: A Taxonomic and Geographic Reference, 3rd ed.; Wilson, D.E., Reeder, D.M., Eds.; Johns Hopkins University Press: Baltimore, MD, USA, 2005; pp. 312–529. [Google Scholar]
- Helgen, K.M.; Helgen, L.E.; Wilson, D.E. Pacific flying foxes (Mammalia: Chiroptera): Two new species of Pteropus from Samoa, probably extinct. Am. Mus. Novit. 2009, 2009, 1–37. [Google Scholar] [CrossRef]
- Chua, K.B.; Bellini, W.J.; Rota, P.A.; Harcourt, B.H.; Tamin, A.; Lam, S.K.; Mahy, B.W.J. Nipah virus: A recently emergent deadly paramyxovirus. Science 2000, 288, 1432–1435. [Google Scholar] [CrossRef]
- Bumrungsri, S.; Harbit, A.; Benzie, C.; Carmouche, K.; Sridith, K.; Racey, P. The pollination ecology of two species of Parkia (Mimosaceae) in southern Thailand. J. Trop. Ecol. 2008, 24, 467–475. [Google Scholar] [CrossRef]
- Thanapongtharm, W.; Linard, C.; Wiriyarat, W.; Chinsorn, P.; Kanchanasaka, B.; Xiao, X.; Biradar, C.; Wallace, R.G.; Gilbert, M. Spatial characterization of colonies of the flying fox bat, a carrier of Nipah Virus in Thailand. BMC Vet. Res. 2015, 11, 81. [Google Scholar] [CrossRef]
- Wacharapluesadee, S.; Ruangvejvorachai, P.; Hemachudha, T. A simple method for detection of rabies viral sequences in 16-year old archival brain specimens with one-week fixation in formalin. J. Virol. Methods. 2006, 134, 267–271. [Google Scholar] [CrossRef]
- Chaiyes, A.; Duengkae, P.; Wacharapluesadee, S.; Pongpattananurak, N.; Olival, K.J.; Hemachudha, T. Assessing the distribution, roosting site characteristics, and population of Pteropus lylei in Thailand. Raffles Bull. Zool. 2017, 65, 670–680. [Google Scholar]
- Boonkird, K.; Wanghongsa, S. On the population number and distribution of flying foxes (Pteropus lylei) in central plain. Wildlife Yearbook 2004, 5, 89–100. [Google Scholar]
- Duengkae, P.; Wacharapluesadee, S.; Khumbucha, W.; Srikhunmuang, P.; Phengsakul, P.; Chaiyes, A.; Pongpattananurak, N.; Hemachudha, T. Monitoring roosting sites and population of Lyle’s Flying Fox (Pteropus lylei) in Thailand. Forestry 2015, 1, 121–127. [Google Scholar]
- Weber, N.; Duengkae, P.; Fahr, J.; Dechmann, D.K.; Phengsakul, P.; Khumbucha, W.; Siriaroonrat, B.; Wacharapluesadee, S.; Maneeorn, P.; Newman, S.; et al. High-resolution GPS tracking of Lyle’s flying fox between temples and orchards in central Thailand. J. Wildl. Manag. 2015, 79, 957–968. [Google Scholar] [CrossRef]
- Jeong, J.; McCallum, H. Using stochastic modeling to predict the effect of culling and colony dispersal of bats on zoonotic viral epidemics. Vector Borne Zoonotic Dis. 2021, 21, 369–377. [Google Scholar] [CrossRef] [PubMed]
- Hondo, E.; Inoue, N.; Maeda, K.; Rerkamnuaychoke, W.; Duengkae, P. Movement of Lyle’s flying fox (Pteropus lylei) in Central Thailand. J. Wildl. Manag. 2010, 17, 55–63. [Google Scholar]
- Brown, V.A.; Brooke, A.; Fordyce, J.A.; McCracken, G.F. Genetic analysis of populations of the threatened bat Pteropus mariannus. Conserv. Genet. Resour. 2011, 12, 933–941. [Google Scholar] [CrossRef]
- Larsen, P.A.; Hayes, C.E.; Wilkins, M.A.; Gomard, Y.; Sookhareea, R.; Yoder, A.D.; Goodman, S.M. Population genetics of the Mauritian flying fox, Pteropus niger. Acta Chiropt. 2014, 16, 293–300. [Google Scholar] [CrossRef]
- Harrison, R.G. Animal mitochondrial DNA as a genetic marker in population and evolutionary biology. Trends. Ecol. Evol. 1989, 4, 6–11. [Google Scholar] [CrossRef]
- Roman, J.; Palumbi, S.R. Whales before whaling in the North Atlantic. Science 2003, 301, 508–510. [Google Scholar] [CrossRef]
- Sukgosa, N.; Duangjai, S.; Duengkae, P.; Wacharapluesadee, S.; Songmongkol, P.; Yingsakmongkon, S.; Olival, K.J.; Hemachudha, T. Genetic diversity and relationships among Lyle’s flying fox colonies in Thailand. Agric. Nat. Resour. 2018, 2, 607–611. [Google Scholar] [CrossRef]
- Francis, C.M. A Field Guide to the Mammals of Thailand and South-East Asia: Thailand, Peninsular Malaysia, Singapore, Myanmar, Laos, Vietnam, Cambodia; New Holland Publishers: London, UK, 2008. [Google Scholar]
- Mickleburgh, S.P.; Hutson, A.M.; Racey, P.A. Old World Fruit Bats: An Action Plan for the Family Pteropodidae; Mickleburgh, S.P., Hutson, A.M., Racey, P.A., Eds.; IUCN: Gland, Switzerland, 1992; p. 263. [Google Scholar]
- Mickleburgh, S.; Waylen, K.; Racey, P. Bats as bushmeat: A global review. Oryx 2009, 43, 217–234. [Google Scholar] [CrossRef]
- Song, Y.; Fahs, A.; Feldman, C.; Shah, S.; Gu, Y.; Wang, Y.; Machado, R.F.; Wunderink, R.G.; Chen, J. A reliable and effective method of DNA isolation from old human blood paper cards. Springerplus 2013, 2, 616. [Google Scholar] [CrossRef] [PubMed][Green Version]
- Supikamolseni, A.; Ngaoburanawit, N.; Sumontha, M.; Chanhome, L.; Suntrarachun, S.; Peyachoknagul, S.; Srikulnath, K. Molecular barcoding of venomous snakes and species-specific multiplex PCR assay to identify snake groups for which antivenom is available in Thailand. Genet. Mol. Res. 2015, 14, 13981–13997. [Google Scholar] [CrossRef] [PubMed]
- Beerli, P.; Palczewski, M. Unified framework to evaluate panmixia and migration direction among multiple sampling locations. Genetics 2010, 185, 313–326. [Google Scholar] [CrossRef] [PubMed]
- Beerli, P.; Mashayekhi, S.; Sadeghi, M.; Khodaei, M.; Shaw, K. Population genetic inference with MIGRATE. Curr. Protoc. Bioinformatics 2019, 68, e87. [Google Scholar] [CrossRef] [PubMed]
- Ariyaraphong, N.; Laopichienpong, N.; Singchat, W.; Panthum, T.; Farhan Ahmad, S.; Jattawa, D.; Duengkae, P.; Muangmai, N.; Suwanasopee, T.; Koonawootrittriron, S.; et al. High-level gene flow restricts genetic differentiation in dairy cattle populations in Thailand: Insights from large-scale mt D-loop sequencing. Animals 2021, 11, 1680. [Google Scholar] [CrossRef]
- Ruedi, M.; Mayer, F. Molecular systematics of bats of the genus Myotis (Vespertilionidae) suggests deterministic ecomorphological convergences. Mol. Phylogenet. Evol. 2001, 21, 436–448. [Google Scholar] [CrossRef] [PubMed]
- Hulva, P.; Horacek, I.; Strelkov, P.P.; Benda, P. Molecular architecture of Pipistrellus pipistrellus/Pipistrellus pygmaeus complex (Chiroptera: Vespertilionidae): Further cryptic species and Mediterranean origin of the divergence. Mol. Phylogenet. Evol. 2004, 32, 1023–1035. [Google Scholar] [CrossRef]
- Wacharapluesadee, S.; Lumlertdacha, B.; Boongird, K.; Wanghongsa, S.; Chanhome, L.; Rollin, P.; Hemachudha, T. Bat Nipah virus, Thailand. Emerg Infect Dis. 2005, 11, 1949. [Google Scholar] [CrossRef]
- Cappelle, J.; Hoem, T.; Hul, V.; Furey, N.; Nguon, K.; Prigent, S.; Dupon, L.; Ken, S.; Neung, C.; Dussart, P.; et al. Nipah virus circulation at human–bat interfaces, Cambodia. Bull. World Health Organ. 2020, 98, 539. [Google Scholar] [CrossRef]
- Hassell, J.M.; Begon, M.; Ward, M.J.; Fèvre, E.M. Urbanization and disease emergence: Dynamics at the wildlife–livestock–human interface. Trends Ecol. Evol. 2017, 32, 55–67. [Google Scholar] [CrossRef]
- Currey, K.; Kendal, D.; Van der Ree, R.; Lentini, P.E. Land manager perspectives on conflict mitigation strategies for urban flying-fox camps. Diversity 2018, 10, 39. [Google Scholar] [CrossRef]
- Aziz, S.A.; Clements, G.R.; McConkey, K.R.; Sritongchuay, T.; Pathil, S.; Abu Yazid, M.N.H.; Campos-Arceiz, A.; Forget, P.M.; Bumrungsri, S. Pollination by the locally endangered island flying fox (Pteropus hypomelanus) enhances fruit production of the economically important durian (Durio zibethinus). Ecol. Evol. 2017, 7, 8670–8684. [Google Scholar] [CrossRef] [PubMed]
- Chaiyes, A.; Escobar, L.E.; Willcox, E.V.; Duengkae, P.; Suksavate, W.; Watcharaanantapong, P.; Pongpattananurakh, N.; Wacharapluesadee, S.; Hemachudha, T. An assessment of the niche centroid hypothesis: Pteropus lylei (Chiroptera). Ecosphere 2020, 11, e03134. [Google Scholar] [CrossRef]
- Duengkae, P.; Srikhunmuang, P.; Chaiyes, A.; Suksavate, W.; Pongpattananurak, N.; Wacharapluesadee, S.; Hemachudha, T. Patch metrics of roosting site selection by Lyle’s flying fox (Pteropus lylei Andersen, 1908) in a human-dominated landscape in Thailand. Folia Oecologica 2019, 46, 63–72. [Google Scholar] [CrossRef]
- Adams, R.A. Onset of volancy and foraging patterns of juvenile little brown bats, Myotis lucifugus. J. Mammal. 1997, 78, 239–246. [Google Scholar] [CrossRef]
- Maruthupandian, J.; Marimuthu, G. Cunnilingus apparently increases duration of copulation in the Indian flying fox, Pteropus giganteus. PLoS ONE 2013, 8, e59743. [Google Scholar] [CrossRef]
- Tajima, F. Statistical method for testing the neutral mutation hypothesis by DNA polymorphism. Genetics 1989, 123, 585–595. [Google Scholar] [CrossRef]
- Fu, Y.X. Statistical tests of neutrality of mutations against population growth, hitchhiking and background selection. Genetics 1993, 147, 915–925. [Google Scholar] [CrossRef]
- Pichler, A.; Gast, A.; Seeler, J.S.; Dejean, A.; Melchior, F. The nucleoporin RanBP2 has SUMO1 E3 ligase activity. Cell 2002, 108, 109–120. [Google Scholar] [CrossRef]
- Fu, Y.X.; Li, W.H. Statistical tests of neutrality of mutations. Genetics 1993, 133, 693–709. [Google Scholar] [CrossRef]
- Okello, M.M. Land use changes and human–wildlife conflicts in the Amboseli Area, Kenya. Hum. Dimens. Wildl. 2005, 10, 19–28. [Google Scholar] [CrossRef]
- Ray, S.S.; Okamoto, M. Polymer/layered silicate nanocomposites: A review from preparation to processing. Prog. Polym. Sci. 2003, 28, 1539–1641. [Google Scholar] [CrossRef]
- Harpending, H.C. Signature of ancient population growth in a low-resolution mitochondrial DNA mismatch distribution. Hum. Biol. 1994, 66, 591–600. [Google Scholar]
- Rogers, A.R. Genetic evidence for a Pleistocene population expansion. Evolution 1995, 49, 608–615. [Google Scholar] [CrossRef] [PubMed]
- Avise, J.C. Phylogeography: The History and Formation of Species; Harvard University Press: Cambridge MA, USA, 2000; p. 447. [Google Scholar]
- Rosetti, N.; Remis, M.I. Spatial genetic structure and mitochondrial DNA phylogeography of Argentinean populations of the grasshopper Dichroplus elongatus. PLoS ONE 2012, 7, e40807. [Google Scholar] [CrossRef]
- Chan, L.M.; Goodman, S.M.; Nowak, M.D.; Weisrock, D.W.; Yoder, A.D. Increased population sampling confirms low genetic divergence among Pteropus (Chiroptera: Pteropodidae) fruit bats of Madagascar and other western Indian Ocean islands. PLoS Curr. 2011, 3, RRN1226. [Google Scholar] [CrossRef] [PubMed]
- Dietrich, M.; Markotter, W. Studying the microbiota of bats: Accuracy of direct and indirect samplings. Ecol. Evol. 2019, 9, 1730–1735. [Google Scholar] [CrossRef] [PubMed]
- Alcala, N.; Streit, D.; Goudet, J.; Vuilleumier, S. Peak and persistent excess of genetic diversity following an abrupt migration increase. Genetics 2013, 193, 953–971. [Google Scholar] [CrossRef]
- Excoffier, L.; Smouse, P.E.; Quattro, J.M. Analysis of molecular variance inferred from metric distances among DNA haplotypes: Application to human mitochondrial DNA restriction data. Genetics 1992, 131, 479–491. [Google Scholar] [CrossRef]
- Rogers, A.; Harpending, H. Population growth makes waves in the distribution of pairwise genetic differences. Mol. Biol. Evol. 1992, 9, 552–569. [Google Scholar] [CrossRef]
- Calisher, C.H.; Childs, J.E.; Field, H.E.; Holmes, K.V.; Schountz, T. Bats: Important reservoir hosts of emerging viruses. Clin. Microbiol. Rev. 2006, 19, 531–545. [Google Scholar] [CrossRef] [PubMed]
- Lacki, M.J.; Amelon, S.K.; Baker, M.D. Foraging Ecology of Bats in Forests. In Bats in Forests: Conservation and Management; Lacki, M.J., Hayes, J.P., Kurta, A., Eds.; Johns Hopkins University: Baltimore, MD, USA, 2007; pp. 83–127. [Google Scholar]
- Rossiter, S.J.; Benda, P.; Dietz, C.; Zhang, S.; Jones, G. Rangewide phylogeography in the greater horseshoe bat inferred from microsatellites: Implications for population history, taxonomy and conservation. Mol. Ecol. 2007, 16, 4699–4714. [Google Scholar] [CrossRef] [PubMed]
- Wright, E.; Mainzer, A.; Masiero, J.; Grav, T.; Cutri, R.; Bauer, J. Response to “An empirical examination of WISE/NEOWISE asteroid analysis and results”. arXiv 2018, arXiv:1811.01454. [Google Scholar]
Publisher’s Note: MDPI stays neutral with regard to jurisdictional claims in published maps and institutional affiliations. |
© 2022 by the authors. Licensee MDPI, Basel, Switzerland. This article is an open access article distributed under the terms and conditions of the Creative Commons Attribution (CC BY) license (https://creativecommons.org/licenses/by/4.0/).