
Rock Mass Classification Method Based on Entropy Weight–TOPSIS–Grey Correlation Analysis


Abstract
:1. Introduction
2. Materials and Methods
2.1. Rock Mass Classification Evaluation Index System
2.1.1. Selection of Evaluation Indicators
2.1.2. Evaluation System Construction
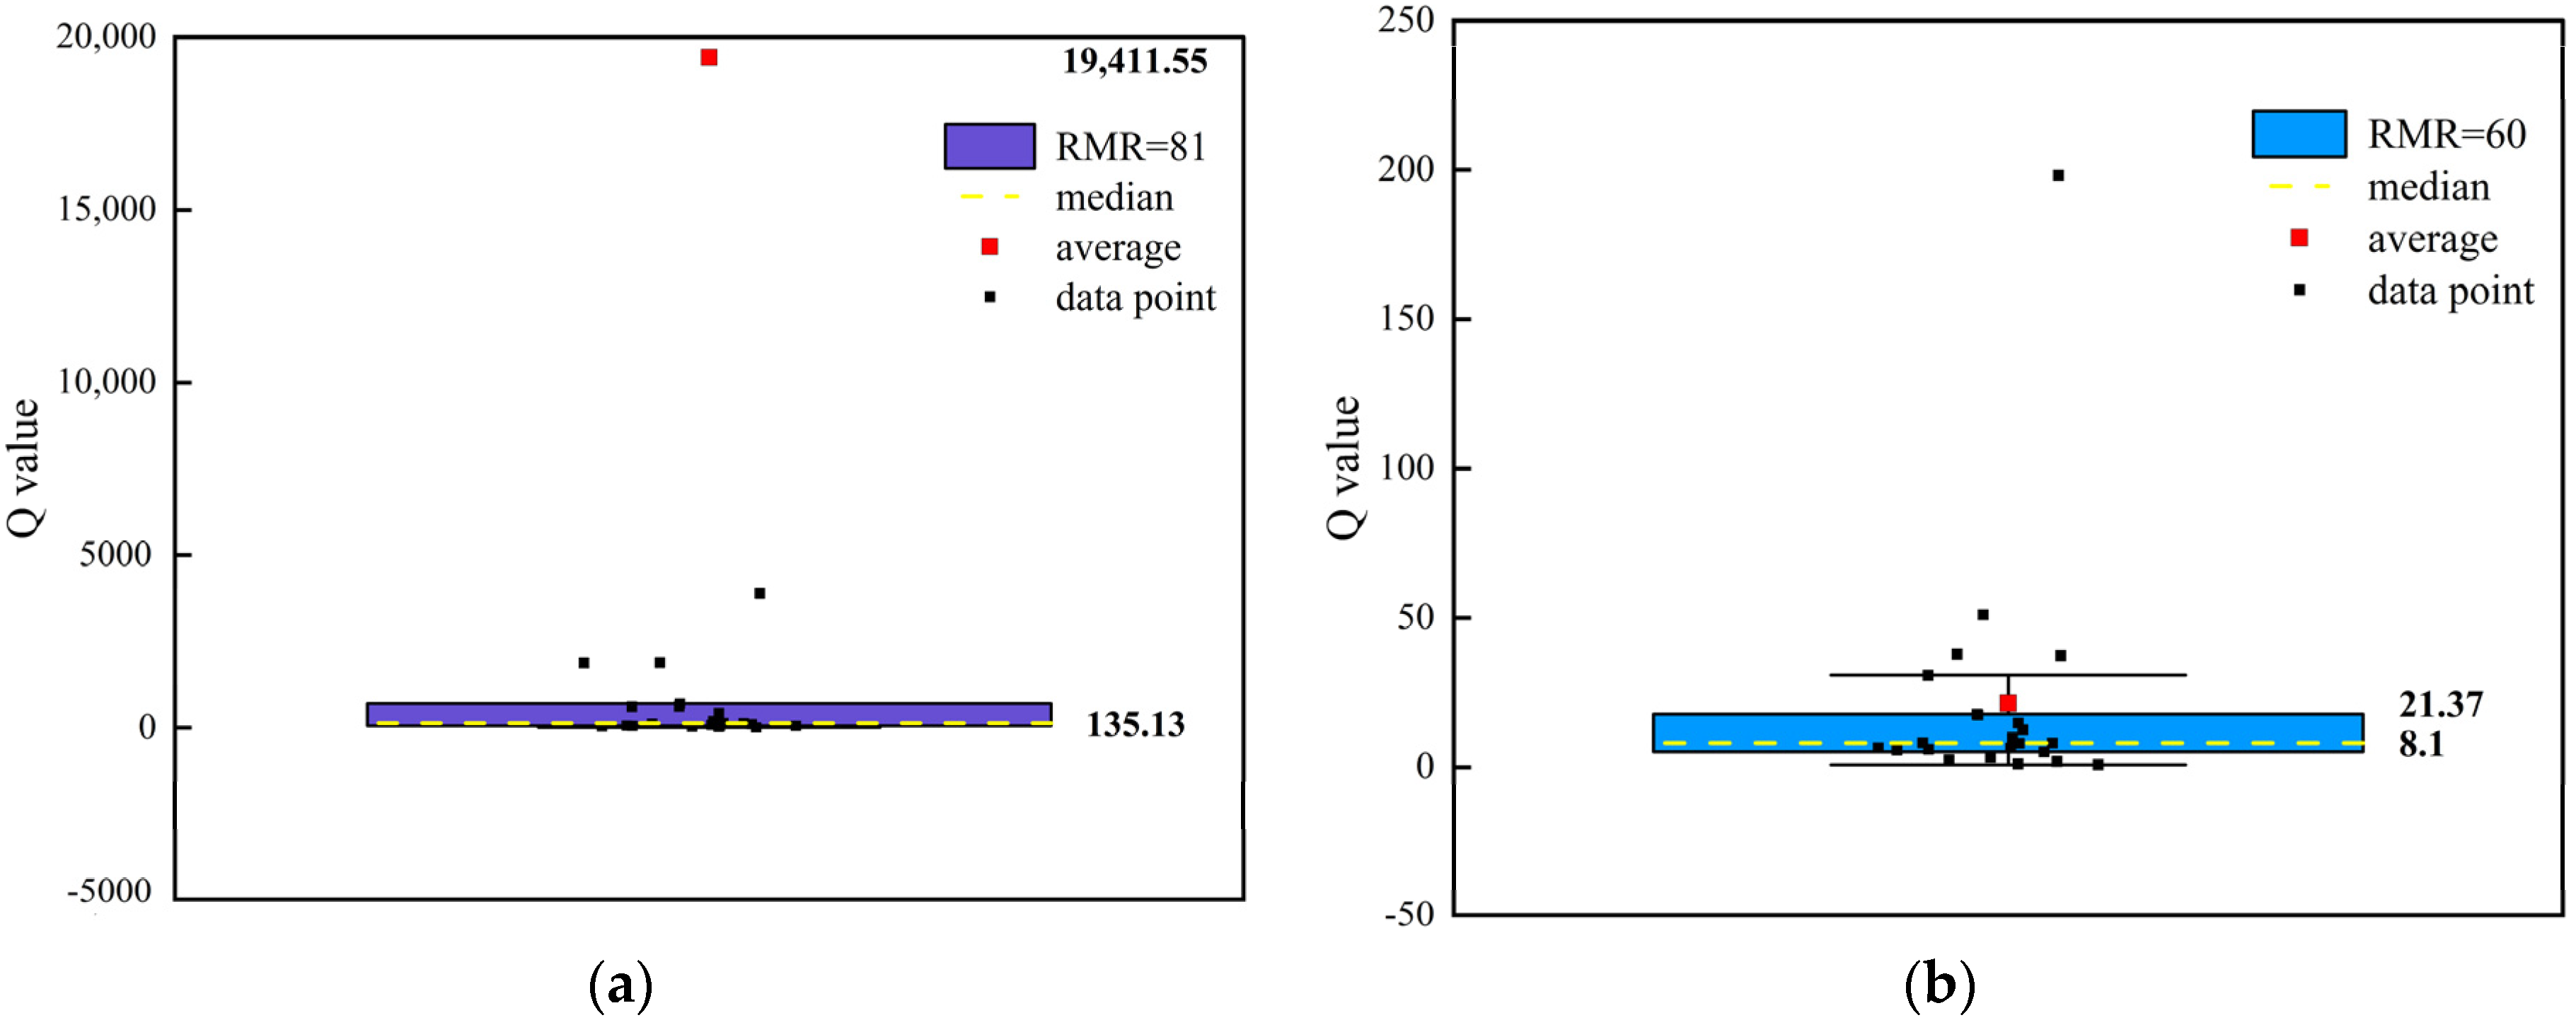
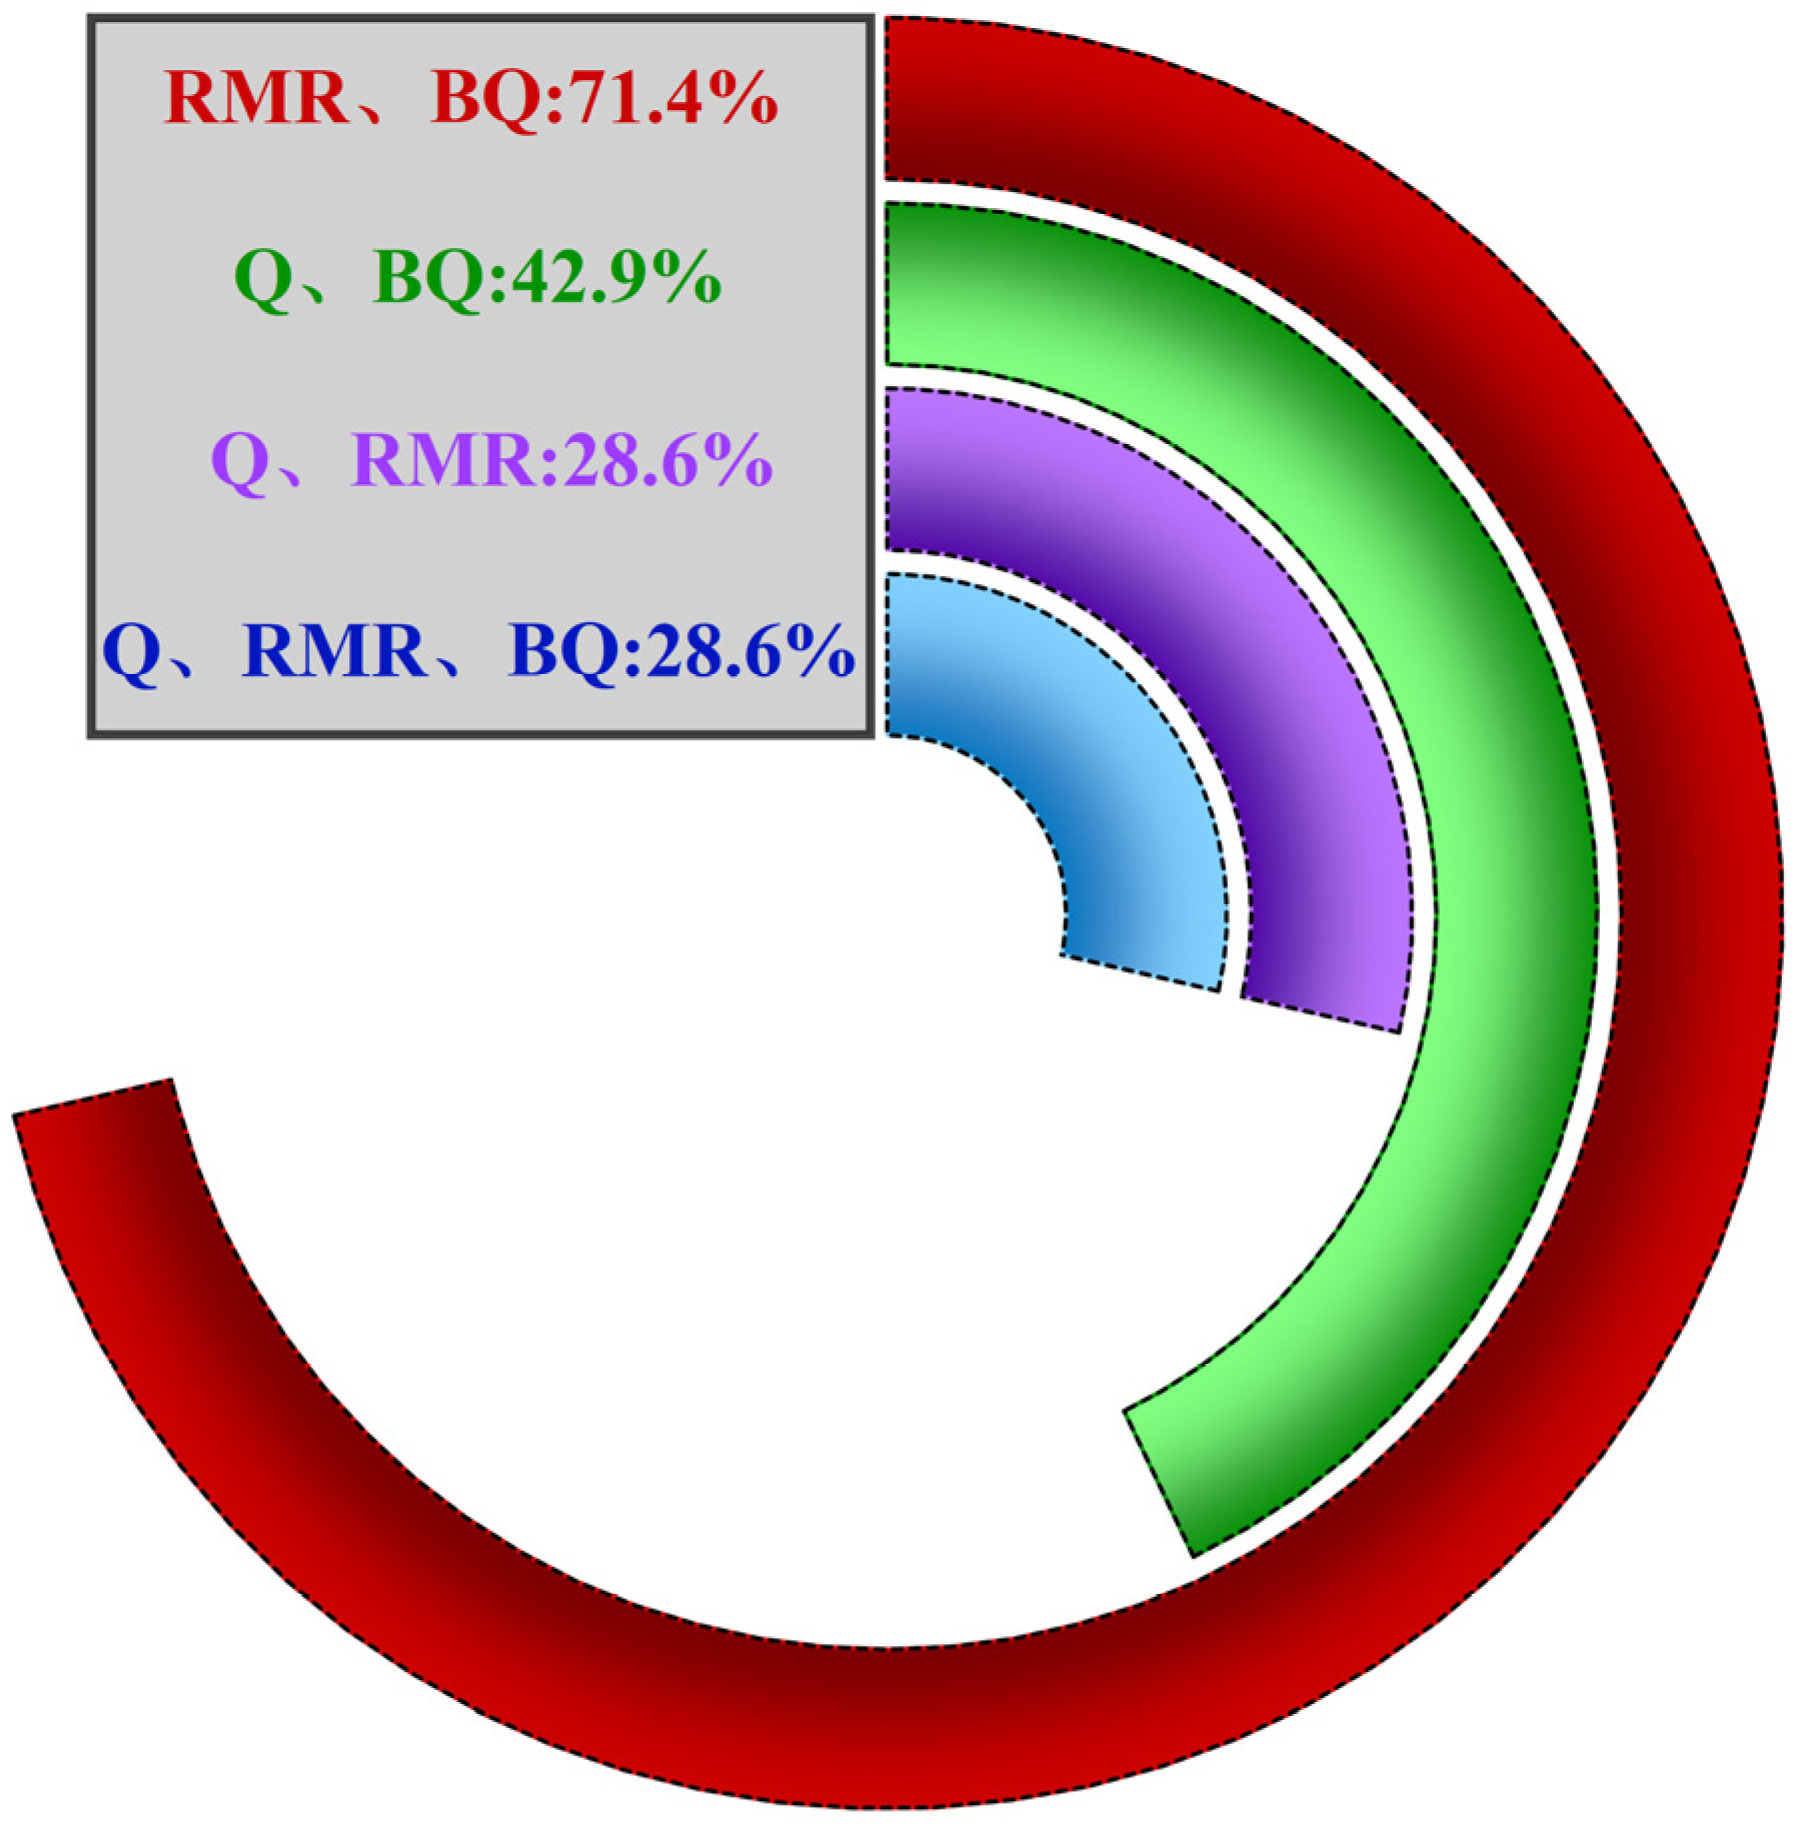
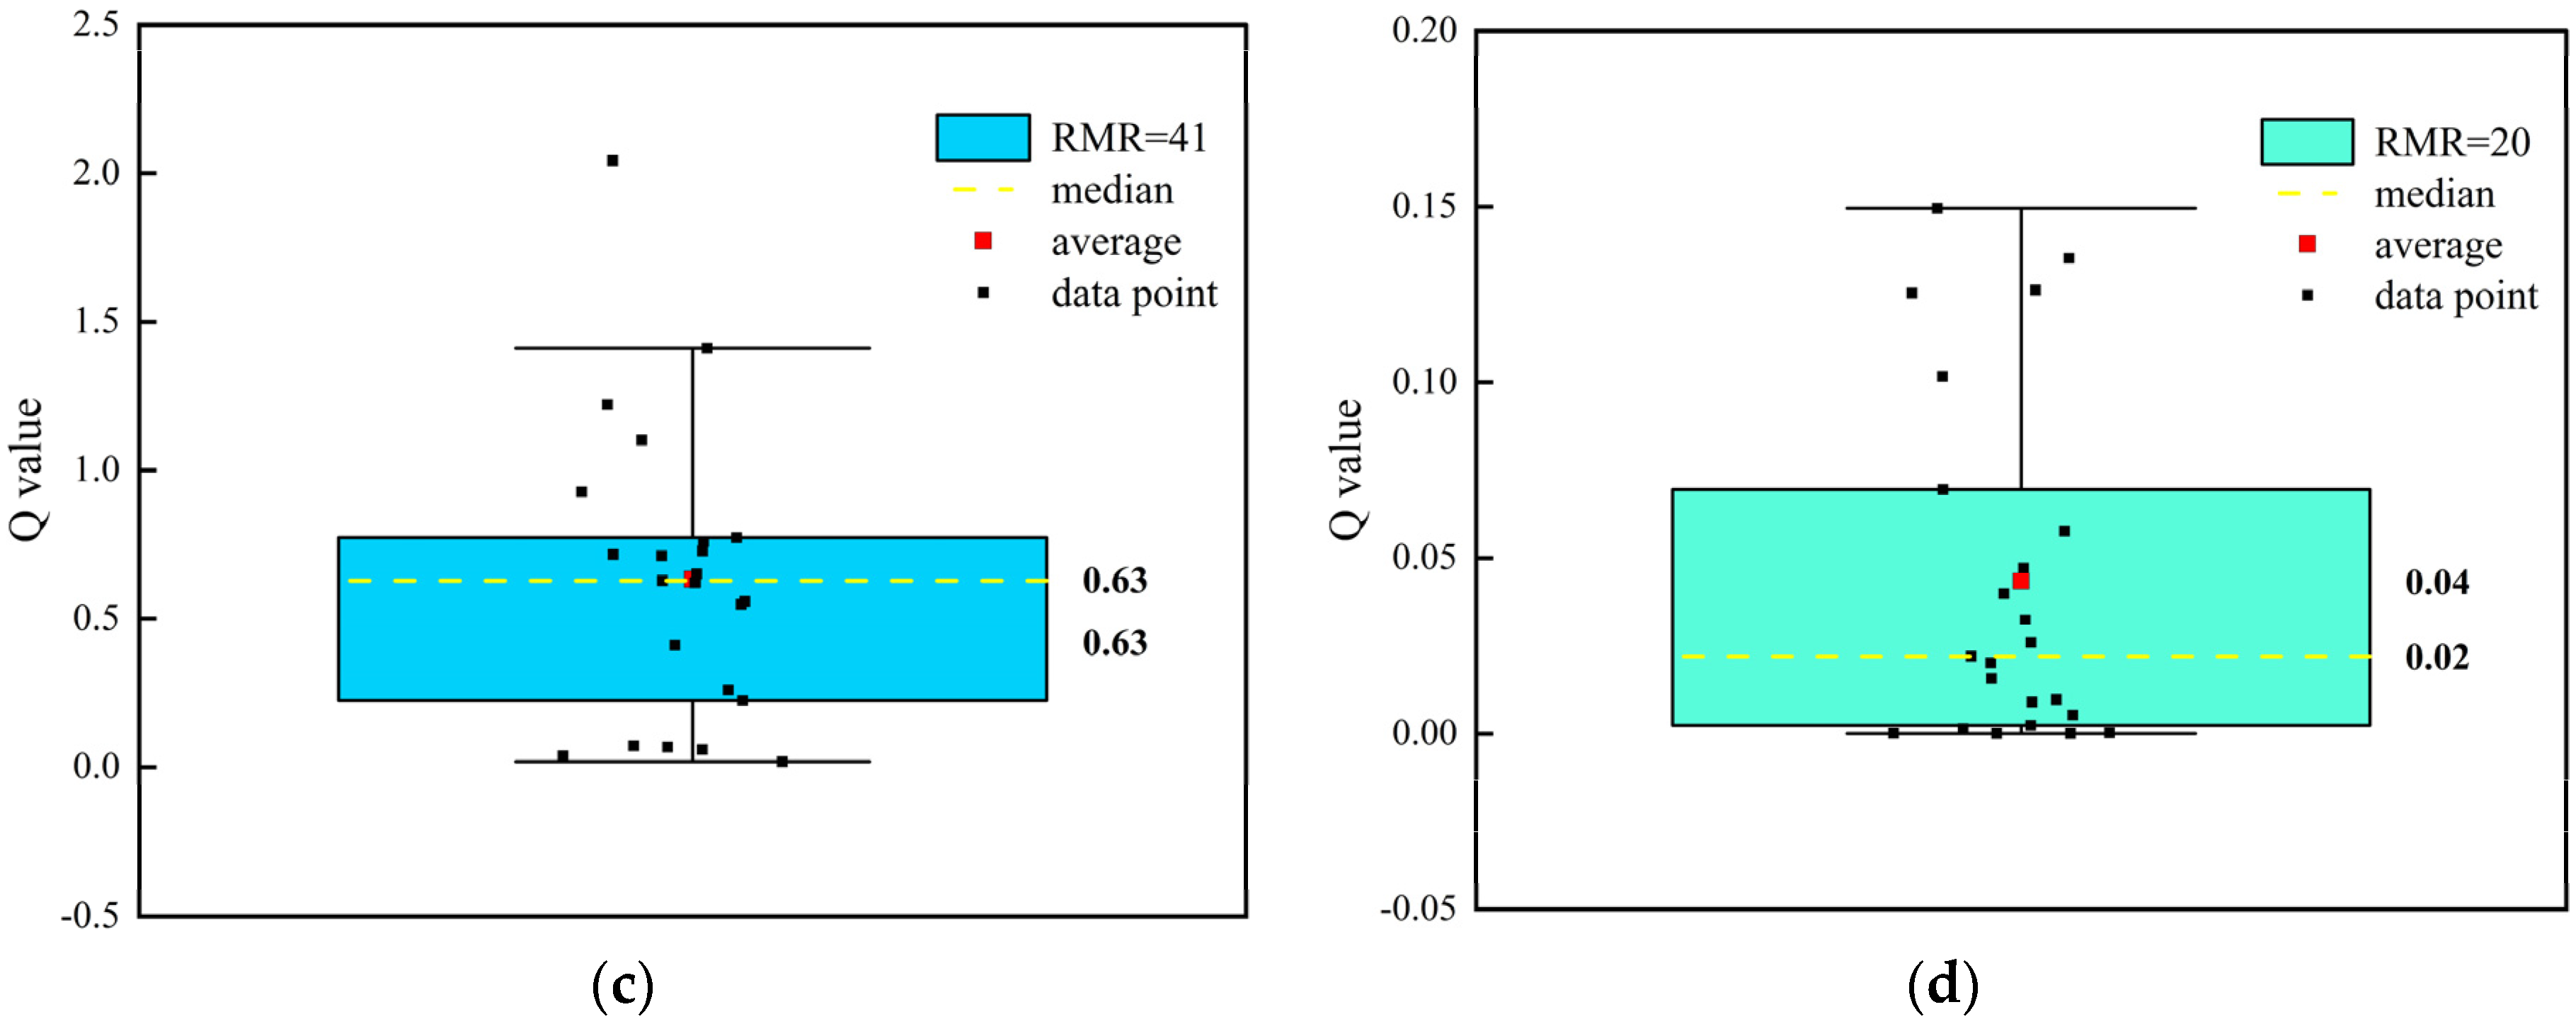
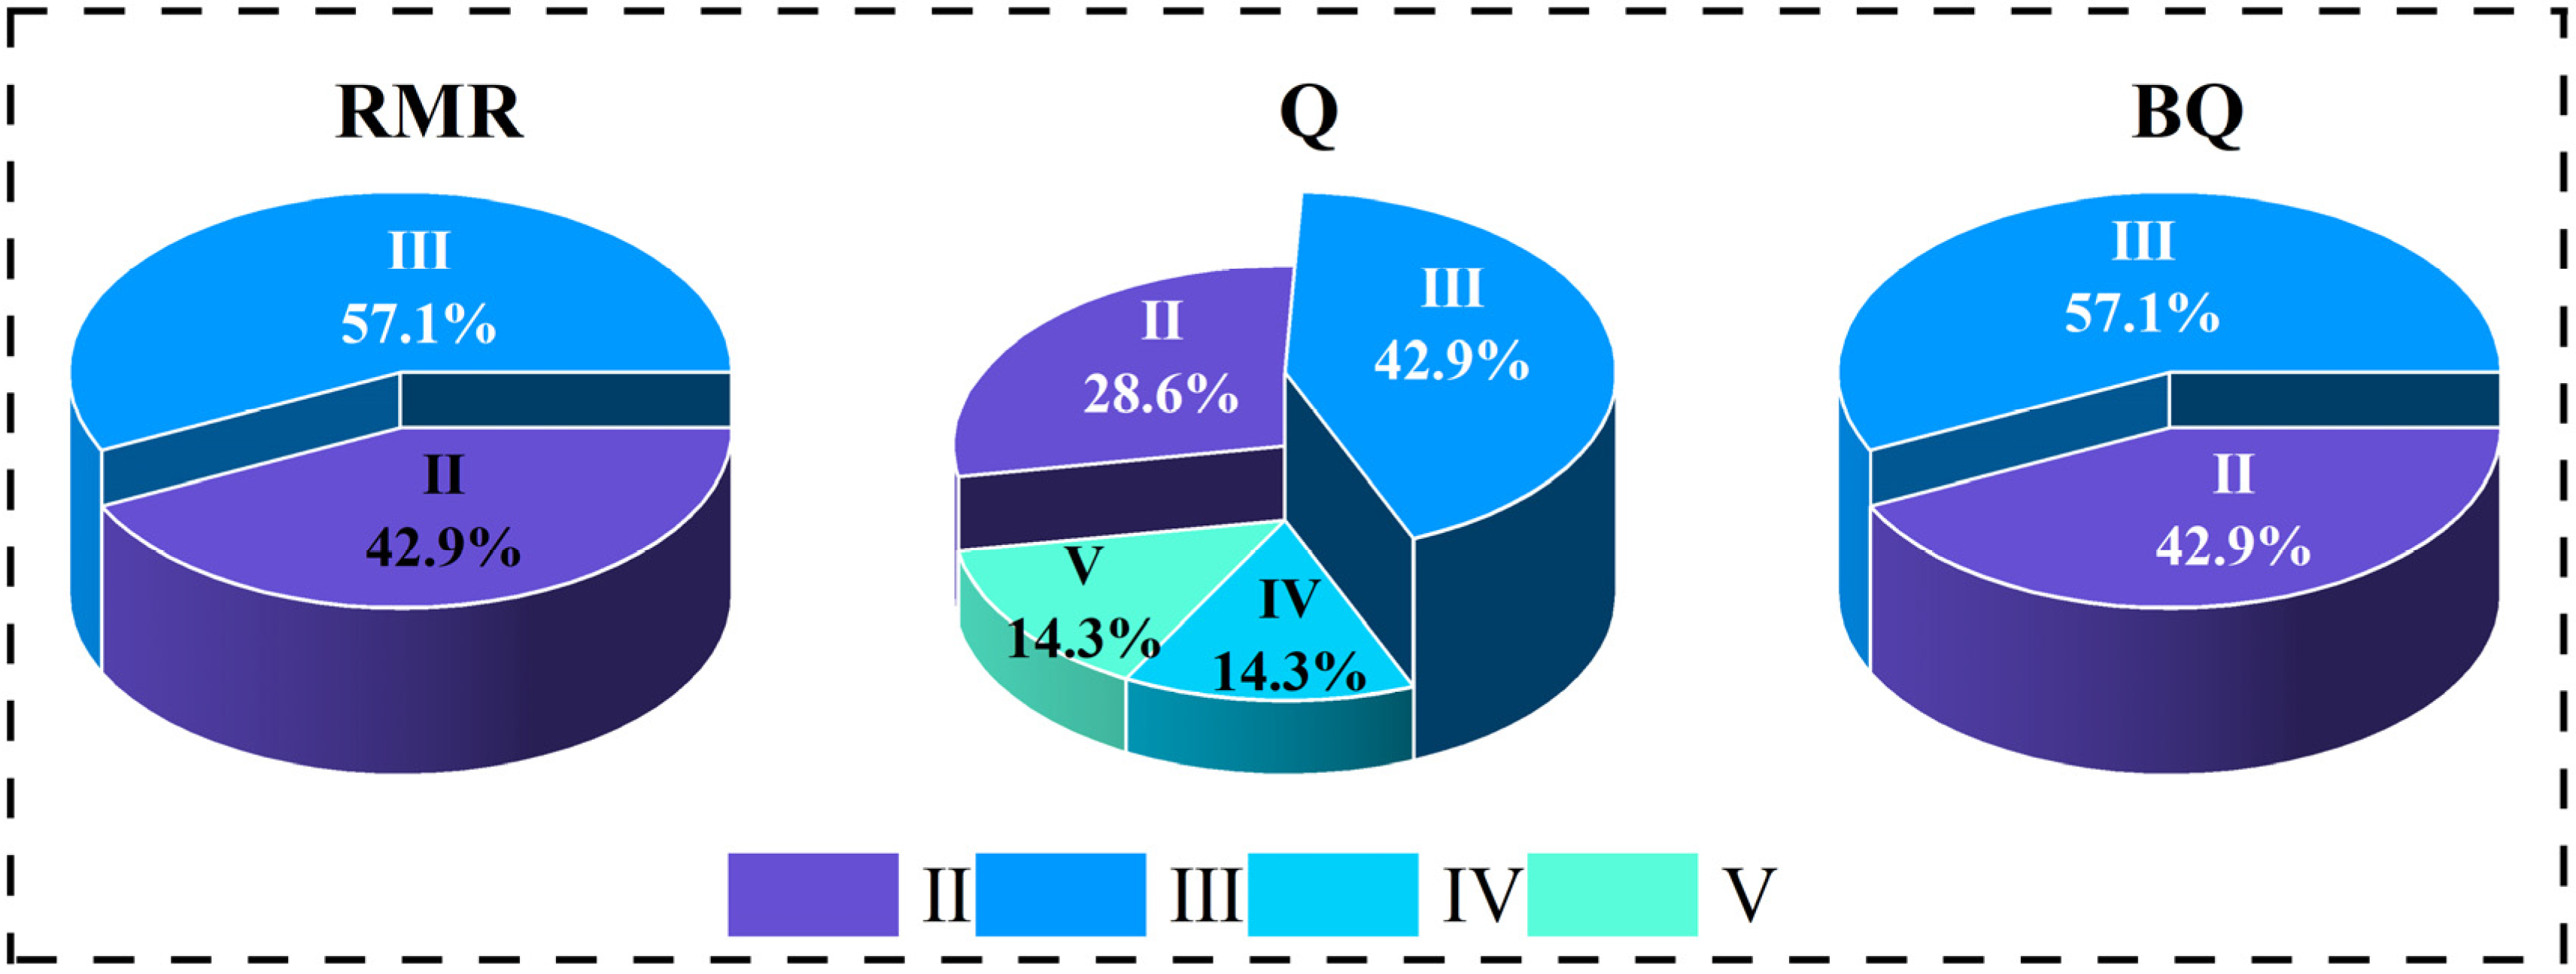
2.1.3. Comparison of Classification Results
2.2. Comprehensive Assessment of Rock Mass Classification
2.2.1. Entropy Weight Method
- 1.
- Dimensionless processing
- 2.
- Specific gravity calculation
- 3.
- Entropy calculation
- 4.
- Entropy weighting calculation
2.2.2. TOPSIS Method
- 1.
- Construction of a weighted normalization matrix
- 2.
- Determine the positive and negative ideal solution of D
- 3.
- Calculate the Euclidean distance
2.2.3. Grey Correlation Analysis
- 1.
- Calculation of grey correlation coefficient
- 2.
- Calculation of grey correlation degree
- 3.
- Calculation of relative closeness
- 4.
- Calculating the relative closeness of the scheme I.
3. Results and Discussion
3.1. Entropy Weight Analysis of Evaluation Indicators
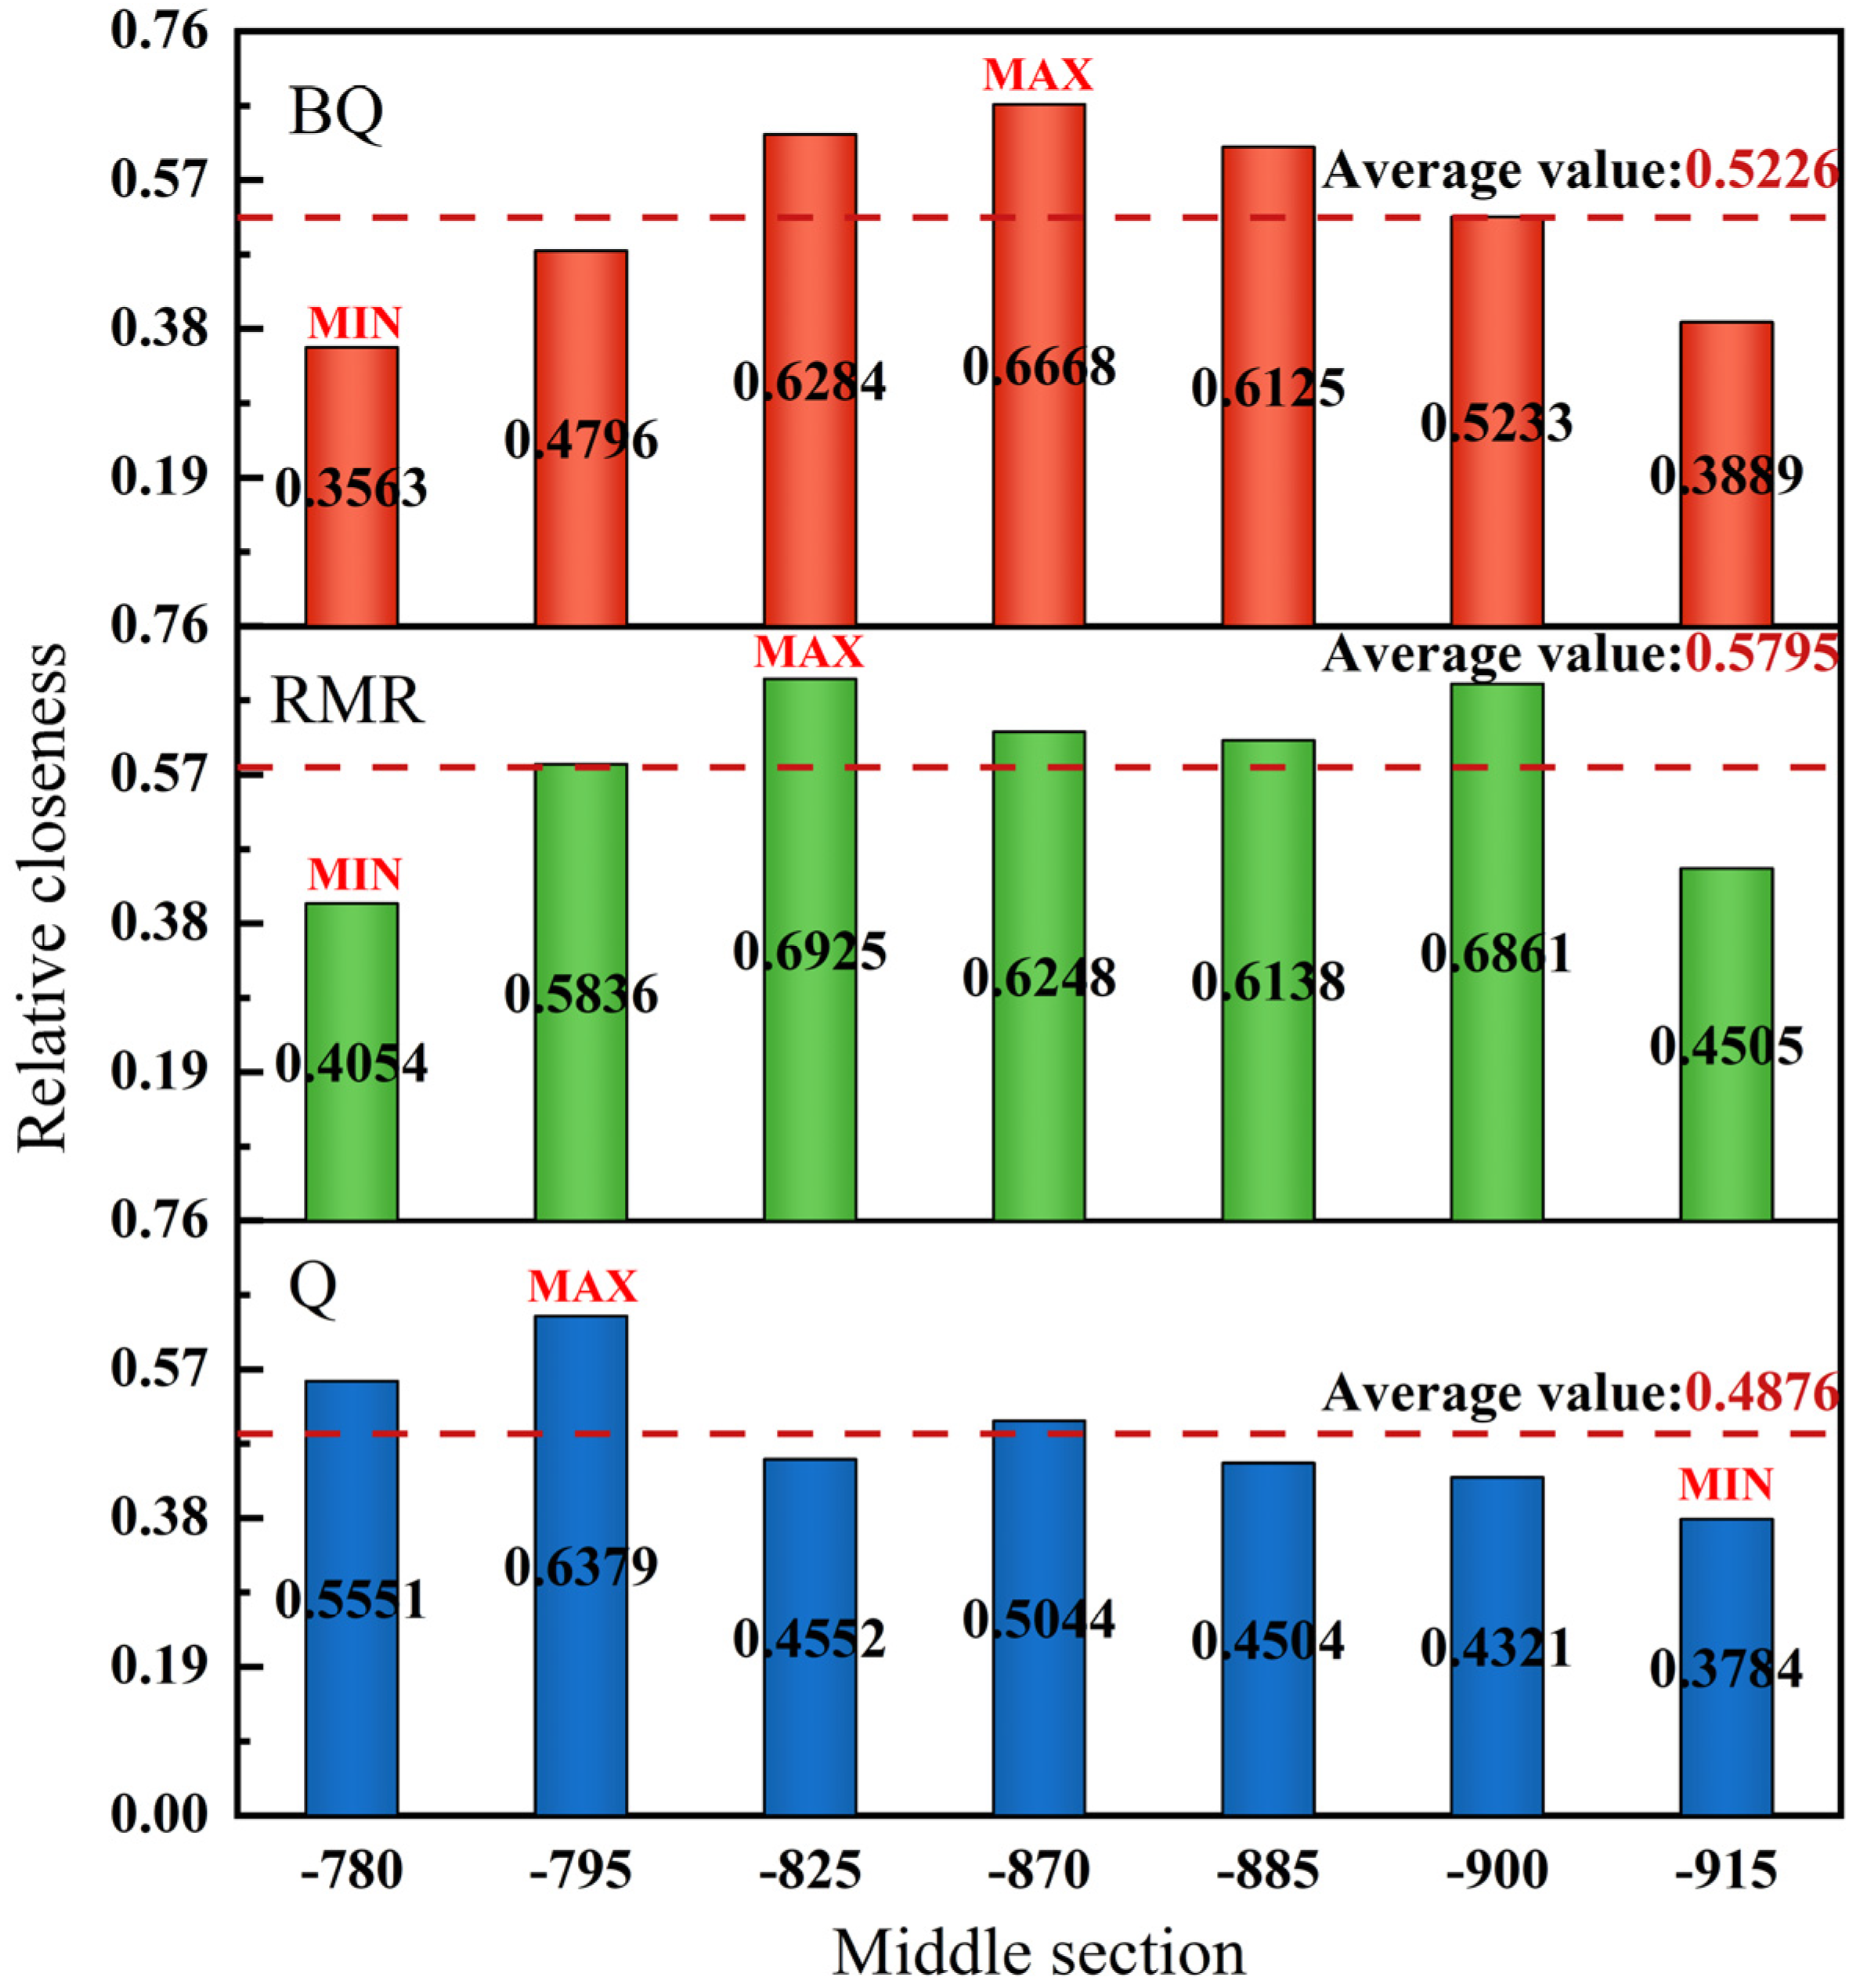
3.2. Relative Closeness Analysis of Each Section
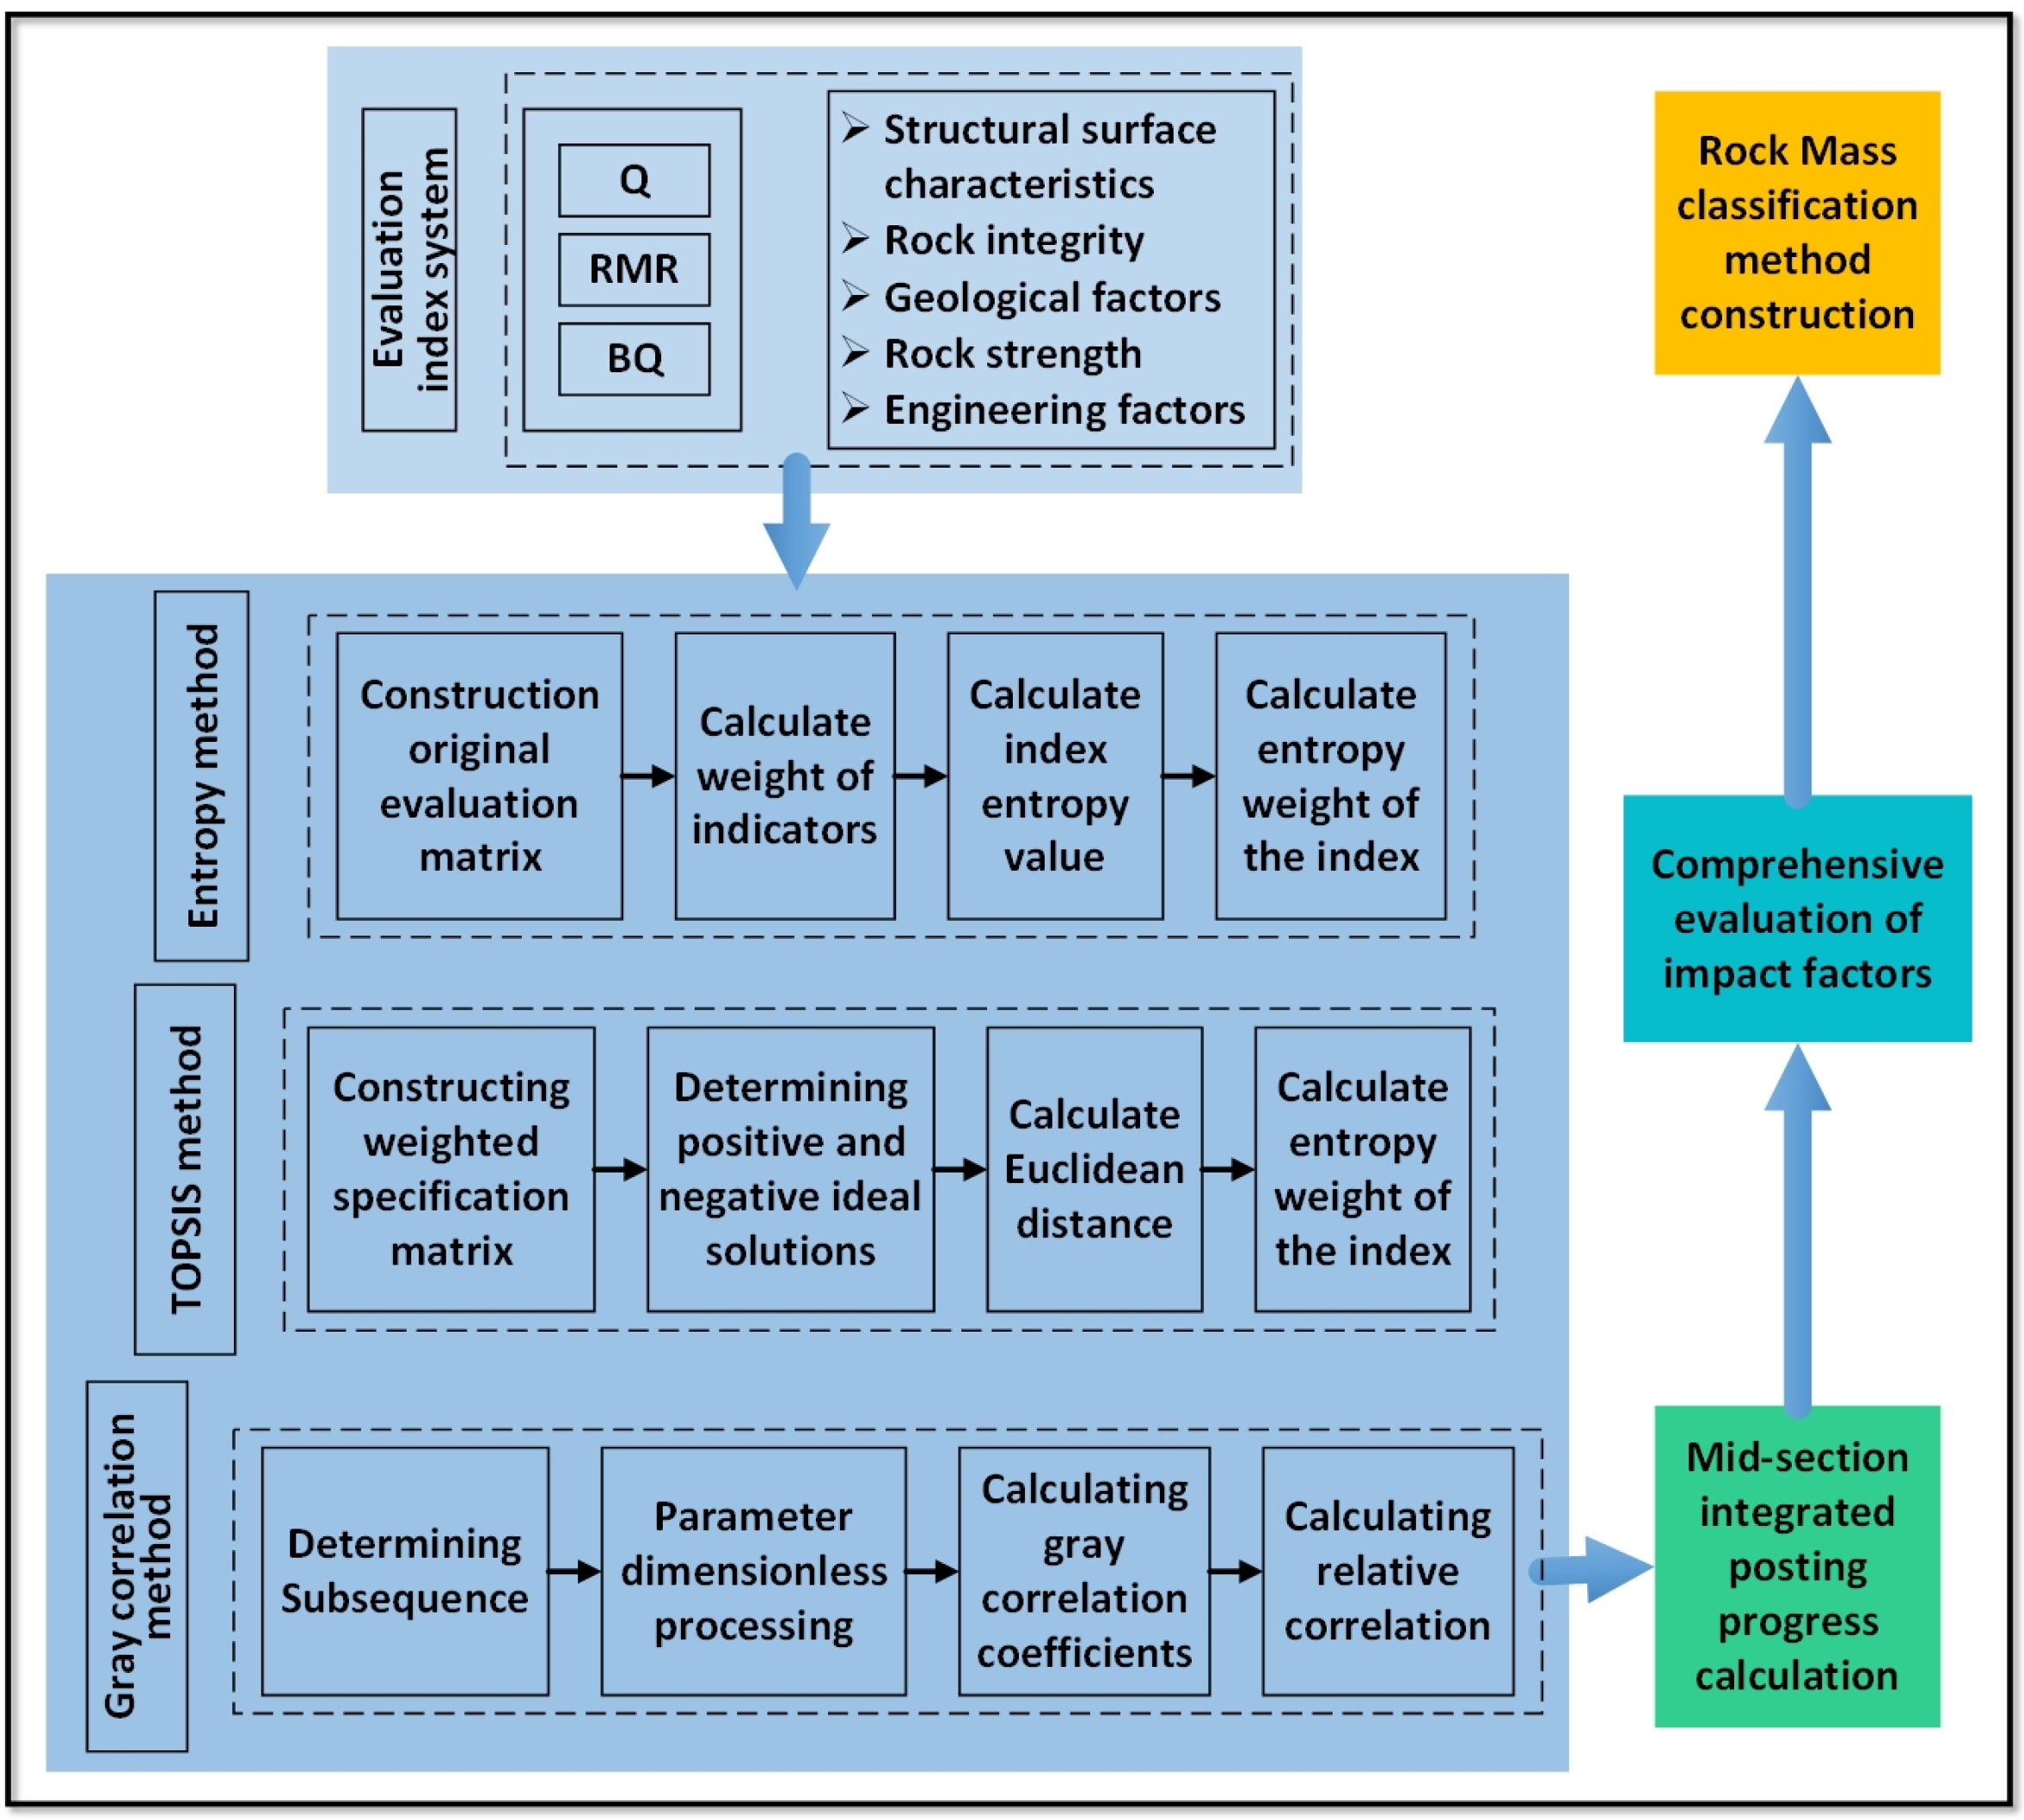
3.3. Entropy-Weighted-TOPSIS-Grey Correlation Rock Mass Classification Method
3.3.1. Entropy-TOPSIS Analysis
3.3.2. Grey Correlation Analysis
3.3.3. Rock Mass Classification Method Construction
3.3.4. Project Examples
4. Conclusions
Author Contributions
Funding
Institutional Review Board Statement
Informed Consent Statement
Data Availability Statement
Acknowledgments
Conflicts of Interest
Appendix A
- (1)
- The basic quality index of rock mass BQ is measured from the hardness of rock and the integrity of rock mass. BQ value is calculated by the following formula: , where is the uniaxial compressive strength of rock; is the integrity coefficient of rock mass, , is the p-wave velocity of rock mass, is the p-wave velocity of rock mass.
- (2)
- Revise according to the characteristics of specific projects. The correction formula is: , where is the correction coefficient of the groundwater, is the correction coefficient of the main structural plane, and is the correction coefficient of the initial stress state.
References
- Stille, H.; Palmström, A. Classification as a Tool in Rock Engineering. Tunn. Undergr. Space Technol. 2003, 18, 331–345. [Google Scholar] [CrossRef]
- Hong-mei, Y.I.N.; Yi-hu, Z.; Huo-ming, Z.; Zuo-wu, Z. Review on the Classification of Engineering Rock Mass. J. Yangtze River Sci. Res. Inst. 2011, 28, 59. [Google Scholar]
- Rehman, H.; Ali, W.; Naji, A.M.; Kim, J.; Abdullah, R.A.; Yoo, H. Review of Rock-Mass Rating and Tunneling Quality Index Systems for Tunnel Design: Development, Refinement, Application and Limitation. Appl. Sci. 2018, 8, 1250. [Google Scholar] [CrossRef] [Green Version]
- Bieniawski, Z.T. Engineering classification of jointed rock masses. Civ. Eng. S. Afr. 1973, 15, 333–343. [Google Scholar]
- Bieniawski, Z.T. Engineering Rock Mass Classifications. Petroleum 1989, 251, 357–365. [Google Scholar]
- Barton, N.; Lien, R.; Lunde, J. Engineering Classification of Rock Masses for the Design of Tunnel Support. Rock Mech. 1974, 6, 189–236. [Google Scholar] [CrossRef]
- Hoek, E.; Brown, E.T. Practical Estimates of Rock Mass Strength. Int. J. Rock Mech. Min. Sci. 1997, 34, 1165–1186. [Google Scholar] [CrossRef]
- GB/T 50218-2014; Standard for Engineering Classification of Rock Mass. China Planning Press: Beijing, China, 2015.
- Romana, M. SMR Classification. 1991. Available online: https://onepetro.org/isrmcongress/proceedings-abstract/CONGRESS91/All-CONGRESS91/ISRM-7CONGRESS-1991-189/167579 (accessed on 29 June 2022).
- Romana, M.R. 23—A Geomechanical Classification for Slopes: Slope Mass Rating. In Rock Testing and Site Characterization; Hudson, J.A., Ed.; Pergamon: Oxford, UK, 1993; pp. 575–600. ISBN 978-0-08-042066-0. [Google Scholar]
- Li, Y.; Liu, J. Assessment of Rock Slope Stability Using Fuzzy Set and CSMR. J. Cent. South Univ. Technol. 2012, 43, 1940–1946. [Google Scholar] [CrossRef]
- Chen, L.; Wang, J.; Zong, Z.H.; Liu, J.; Su, R.; Guo, Y.H.; Jin, Y.X.; Chen, W.M.; Ji, R.L.; Zhao, H.G.; et al. A New Rock Mass Classification System QHLW for High-Level Radioactive Waste Disposal. Eng. Geol. 2015, 190, 33–51. [Google Scholar] [CrossRef]
- Guo, S.; Qi, S.; Saroglou, C. A-BQ, a Classification System for Anisotropic Rock Mass Based on China National Standard. J. Cent. South Univ. 2020, 27, 3090–3102. [Google Scholar] [CrossRef]
- Zhou, T.; Hu, J.H.; Kuang, Y.; Huang, R.D. Improved Rock Engineering System (RES)-Multidimensional Cloud Evaluation Model and Its Application to the Rock Mass Blastability. IEEE Access 2019, 7, 100305–100317. [Google Scholar] [CrossRef]
- Santos, A.E.M.; Lana, M.S.; Pereira, T.M. Rock Mass Classification by Multivariate Statistical Techniques and Artificial Intelligence. Geotech. Geol. Eng. 2021, 39, 2409–2430. [Google Scholar] [CrossRef]
- Salimi, A.; Rostami, J.; Moormann, C. Application of Rock Mass Classification Systems for Performance Estimation of Rock TBMs Using Regression Tree and Artificial Intelligence Algorithms. Tunn. Undergr. Space Technol. 2019, 92, 103046. [Google Scholar] [CrossRef]
- Dai, B.; Zhao, G.; Dong, L. Unascertained Average Clustering for Classification of Rock Mass Blastability and Its Application. J. Cent. South Univ. Technol. 2015, 46, 2157–2161. [Google Scholar] [CrossRef]
- Dong, J.I.; Sanhe, L.U.; Dehong, J.; Qianggang, Y.A.N.; Wenguang, L. Evaluation of rockmass quality based on the revised rmr method in coastal mine during deep exploitation. J. Eng. Geol. 2015, 23, 642–650. [Google Scholar] [CrossRef]
- Rock Mass Classifications in Rock Engineering. Int. J. Rock Mech. Min. Sci. Geomech. Abstr. 1977, 14, 5. [CrossRef]
- Rutledge, J.C.; Preston, R.L. Experience with Engineering Classifications of Rock. In Proceedings of the International Tunnel Symposium, Tokyo, Japan, 29 May–2 June 1978; p. A3. [Google Scholar]
- Sunwoo, C.; Hwang, S.-H. Correlation of Rock Mass Classification Methods in Korean Rock Mass. 2001. Available online: https://onepetro.org/ISRMARMS/proceedings-abstract/ARMS201/All-ARMS201/ISRM-ARMS2-2001-142/170368 (accessed on 29 June 2022).
- Goel, R.K.; Jethwa, J.L.; Paithankar, A.G. Correlation between Barton’s Q and Bieniawski’s RMR—A New Approach. Int. J. Rock Mech. Min. Sci. Geomech. Abstr. 1996, 33, 179–181. [Google Scholar] [CrossRef]
- Palmstrm, A. Combining the RMR, Q, and RMi Classification Systems. Tunn. Undergr. Space Technol. 2009, 24, 491–492. [Google Scholar] [CrossRef]
- Castro-Fresno, D.; Diego-Carrera, R.; Ballester-Muñoz, F.; Álvarez-García, J. Correlation between Bieniawski’s RMR and Barton’s Q Index in Low-Quality Soils. Rev. Constr. 2014, 9, 107–119. [Google Scholar] [CrossRef] [Green Version]
- Fernández-Gutiérrez, J.D.; Perez-Acebo, H.; Mulone-Andere, D. Correlation between Bieniawski’s RMR Index and Barton’s Q Index in Fine-Grained Sedimentary Rock Formations. Inf. Constr. 2017, 69, 547. [Google Scholar]
- Campos, L.A.; Ferreira Filho, F.A.; Costa, T.A.V.; Marques, E.A.G. New GSI Correlations with Different RMR Adjustments for an Eastern Mine of the Quadrilátero Ferrífero. J. S. Am. Earth Sci. 2020, 102, 102647. [Google Scholar] [CrossRef]
- Sadeghi, S.; Teshnizi, E.S.; Ghoreishi, B. Correlations between various rock mass classification/characterization systems for the Zagros tunnel-W Iran. J. Mt. Sci. 2020, 17, 1790–1809. [Google Scholar] [CrossRef]
- Walker, M.L.; Dovoedo, Y.H.; Chakraborti, S.; Hilton, C.W. An Improved Boxplot for Univariate Data. Am. Stat. 2018, 72, 348–353. [Google Scholar] [CrossRef]
- Dai, B.; Chen, Y. A Novel Approach for Predicting the Height of the Water-Flow Fracture Zone in Undersea Safety Mining. Remote Sens. 2020, 12, 358. [Google Scholar] [CrossRef] [Green Version]
- Xie, C.; Nguyen, H.; Bui, X.; Nguyen, V.; Zhou, J. Predicting roof displacement of roadways in underground coal mines using adaptive neuro-fuzzy inference system optimized by various physics-based optimization algorithms. J. Rock Mech. Geotech. Eng. 2021, 13, 1452–1465. [Google Scholar] [CrossRef]
- Xie, C.; Nguyen, H.; Choi, Y.; Armaghani, D.J. Optimized functional linked neural network for predicting diaphragm wall deflection induced by braced excavations in clays. Geosci. Front. 2022, 13, 101313. [Google Scholar] [CrossRef]
- Li, X.; Wang, K.; Liu, L.; Xin, J.; Yang, H.; Gao, C. Application of the Entropy Weight and TOPSIS Method in Safety Evaluation of Coal Mines. Procedia Eng. 2011, 26, 2085–2091. [Google Scholar] [CrossRef] [Green Version]
- Dyke, G.P. Rock Mass Characterization: A Comparison of the MRMR and IRMR Classification Systems. J. S. Afr. Inst. Min. Metall. 2008, 108, 657–659. [Google Scholar]
- Kuo, Y.; Yang, T.; Huang, G.-W. The Use of Grey Relational Analysis in Solving Multiple Attribute Decision-Making Problems. Comput. Ind. Eng. 2008, 55, 80–93. [Google Scholar] [CrossRef]
- Chen, P. Effects of the Entropy Weight on TOPSIS. Expert Syst. Appl. 2021, 168, 114186. [Google Scholar] [CrossRef]
- Zhu, L.; Zhao, C.; Dai, J. Prediction of Compressive Strength of Recycled Aggregate Concrete Based on Gray Correlation Analysis. Constr. Build. Mater. 2021, 273, 121750. [Google Scholar] [CrossRef]
- Olson, D.L. Comparison of Weights in TOPSIS Models. Math. Comput. Model. 2004, 40, 721–727. [Google Scholar] [CrossRef]


| Classification Method | Influencing Factors | |||||
|---|---|---|---|---|---|---|
| Q | Rock quality designation (RQD) | Joint set number (Jn) | Joint roughness number (Jr) | Joint alteration number (Ja) | Joint water reduction factor (Jw) | Stress Reduction factor (SRF) |
| RMR | Rock compressive strength (R1) | Rock quality designation (R2) | Spacing of discontinuities (R3) | Condition of discontinuities (R4) | Ground water conditions (R5) | Orientation of discontinuities (R6) |
| [BQ] * | Rock compressive strength (cw) | Rock mass integrity (KV) | Correction coefficient of the groundwater (K1) | Correction coefficient of the main structural plane (K2) | Correction coefficient of the initial stress state (K3) | |
| Middle Section | Evaluation Indicators | |||||
|---|---|---|---|---|---|---|
| RQD | Jn | Jr | Ja | Jw | SRF | |
| 780-1 * | 87.4 | 7 | 2 | 4 | 0.65 | 1 |
| 795-1 | 91.7 | 7 | 1.5 | 4 | 0.6 | 1.5 |
| 825-1 | 75.9 | 9 | 2 | 4 | 0.6 | 2 |
| 870-1 | 22.5 | 7 | 2 | 4 | 0.65 | 2 |
| 885-1 | 82.1 | 8 | 2 | 4 | 0.58 | 2 |
| 900-1 | 82.6 | 10 | 2 | 4 | 0.55 | 2 |
| 915-1 | 64.6 | 9 | 2 | 4 | 0.58 | 2 |
| Middle Section | Evaluation Indicators | |||||
|---|---|---|---|---|---|---|
| R1 * | R2 * | R3 * | R4 | R5 | R6 | |
| 780-1 | 9.8 | 16.4 | 11.9 | 17 | 0 | −5 |
| 795-1 | 9.7 | 17.6 | 12.2 | 20 | 7 | −5 |
| 825-1 | 10.0 | 13.4 | 12.8 | 22 | 7 | −5 |
| 870-1 | 9.4 | 3.4 | 12.2 | 18 | 12 | −5 |
| 885-1 | 10.1 | 15.0 | 12.5 | 20 | 4 | 0 |
| 900-1 | 10.4 | 15.1 | 12.7 | 19 | 7 | −10 |
| 915-1 | 9.3 | 10.7 | 11.5 | 16 | 0 | −5 |
| Middle Section | Evaluation Indicators | ||||
|---|---|---|---|---|---|
| cw | KV | K1 | K2 | K3 | |
| 780-1 | 80.23 | 0.461 | 0.3 | 0.3 | 1.0 |
| 795-1 | 79.38 | 0.555 | 0.3 | 0.2 | 1.0 |
| 825-1 | 82.74 | 0.741 | 0.3 | 0.2 | 1.0 |
| 870-1 | 76.04 | 0.693 | 0.3 | 0.05 | 1.0 |
| 885-1 | 88.90 | 0.401 | 0.1 | 0.25 | 1.0 |
| 900-1 | 87.30 | 0.412 | 0.5 | 0.2 | 1.0 |
| 915-1 | 75.76 | 0.453 | 0.3 | 0.3 | 1.0 |
| Number * | Author(s) and Time | Equation | |
|---|---|---|---|
| 1 | Bieniawski (1976) | RMR = 9lnQ + 44 | (1) |
| 2 | Rutledge and Preston (1978) | RMR = 5.9lnQ + 43 | (2) |
| 3 | Moreno (1980) | RMR = 5.4lnQ + 55.2 | (3) |
| 4 | Cameron-Clarke and Budavari (1981) | RMR = 5lnQ + 60.8 | (4) |
| 5 | Abad et al. (1983) | RMR = 10.5lnQ + 41.8 | (5) |
| 6 | Kaiser and Gale (1985) | RMR = 8.7lnQ + 38 | (6) |
| 7 | Al-Harthi (1993) | RMR = 9lnQ + 49 | (7) |
| 8 | Choquet and Hadjigogiu (1993,2016) | RMR = 10lnQ + 39 | (8) |
| 9 | El-Naqa (1994) | RMR = 7lnQ + 44 | (9) |
| 10 | Barton (1995) | RMR = 15lnQ + 50 | (10) |
| 11 | Tugrul (1998) | RMR = 7lnQ + 36 | (11) |
| 12 | Sari and Pasamehmetoglu (2004) | RMR = 3.7lnQ + 53.1 | (12) |
| 13 | Kumar et al. (2004) | RMR = 6.4lnQ + 49.6 | (13) |
| 14 | Cosar (2004) | RMR = 2.8lnQ + 45.19 | (14) |
| 15 | Hashemi et al. (2010) | RMR = 5.37lnQ + 40.48 | (15) |
| 16-1 | Laderian and Abaspoor (2012) | RMR = 8.15lnQ + 44.88 | (16) |
| 16-2 | Laderian and Abaspoor (2012) | RMR = 42.87Q0.162 | (17) |
| 17 | Ranasooriya and Nikraz (2012) | RMR = 6.3lnQ + 43 | (18) |
| 18 | Rafiee (2013) | RMR = 8.09lnQ + 43.08 | (19) |
| 19 | Castro Caicedo and Pérez Pérez (2013) | RMR = 5.7lnQ + 43.65 | (20) |
| 20 | Ali et al. (2014) | RMR = 2.87lnQ + 48.71 | (21) |
| 21 | Senra (2016) | RMR = 6.55lnQ + 59.53 | (22) |
| 22 | Sayeed and Khanna (2015) | RMR = 4.52lnQ + 43.635 | (23) |
| Number | I | II | III | IV | V |
|---|---|---|---|---|---|
| RMR | 81~100 | 60~81 | 41~60 | 20~41 | <20 |
| Q1 | >61.01 | 5.92~61.01 | 1.40~5.92 | 0.07~1.40 | <0.07 |
| Q2 | >626.83 | 17.84~626.83 | 0.71~17.84 | 0.02~0.71 | <0.02 |
| Q3 | >118.84 | 2.43~118.84 | 0.07~2.43 | 0.0001~0.07 | <0.0001 |
| Q4 | >56.83 | 0.85~56.83 | 0.02~0.85 | 0.0003~0.02 | <0.0003 |
| Q5 | >41.82 | 5.66~41.82 | 0.93~5.66 | 0.13~0.93 | <0.13 |
| Q6 | >140.12 | 12.54~140.12 | 1.41~12.54 | 0.13~1.41 | <0.13 |
| Q7 | >35.01 | 3.39~35.01 | 0.41~3.39 | 0.04~0.41 | <0.04 |
| Q8 | >66.69 | 8.17~66.69 | 1.22~8.17 | 0.15~1.22 | <0.15 |
| Q9 | >197.50 | 9.83~197.50 | 0.65~9.83 | 0.03~0.65 | <0.03 |
| Q10 | >7.90 | 1.95~7.90 | 0.55~1.95 | 0.14~0.55 | <0.14 |
| Q11 | >619.29 | 30.83~619.29 | 2.04~30.83 | 0.10~2.04 | <0.10 |
| Q12 | >1882.85 | 6.46~1882.85 | 0.04~6.46 | 0.0001~0.04 | <0.0001 |
| Q13 | >135.13 | 5.08~135.13 | 0.26~5.08 | 0.01~0.26 | <0.01 |
| Q14 | >358,357.26 | 198.20~358,357.26 | 0.22~198.20 | 0.0001~0.22 | <0.0001 |
| Q15 | >1892.44 | 37.90~1892.44 | 1.10~37.90 | 0.02~1.10 | <0.02 |
| Q16-1 | >84.09 | 6.39~84.09 | 0.62~6.39 | 0.05~0.62 | <0.05 |
| Q16-2 | >50.79 | 7.97~50.79 | 0.76~7.97 | 0.01~0.76 | <0.01 |
| Q17 | >416.44 | 14.86~416.44 | 0.73~14.86 | 0.03~0.73 | <0.03 |
| Q18 | >108.56 | 8.10~108.56 | 0.77~8.10 | 0.06~0.77 | <0.06 |
| Q19 | >701.09 | 17.61~701.09 | 0.63~17.61 | 0.02~0.63 | <0.02 |
| Q20 | >76,946.92 | 51.10~76,946.92 | 0.07~51.10 | 0.00005~0.07 | <0.00005 |
| Q21 | >26.52 | 1.07~26.52 | 0.06~1.07 | 0.002~0.06 | <0.002 |
| Q22 | >3891.67 | 37.36~3891.67 | 0.56~37.36 | 0.01~0.56 | <0.01 |
| I | II | III | IV | V | |
|---|---|---|---|---|---|
| Q | >135.13 | 8.1~135.13 | 0.63~8.1 | 0.02~0.63 | <0.02 |
| RMR | 81~100 | 60~81 | 41~60 | 20~41 | <20 |
| [BQ] | >550 | 451~550 | 351~450 | 251~350 | <250 |
| Middle Section | Classification Results | |||||
|---|---|---|---|---|---|---|
| Q Value | Grade | RMR Value | Grade | [BQ] Value | Grade | |
| 780-1 | 2.86 | III | 50.1 | III | 419.72 | III |
| 795-1 | 28.21 | II | 61.5 | II | 466.89 | II |
| 825-1 | 5.55 | III | 60.2 | II | 523.47 | II |
| 870-1 | 0.41 | IV | 50.0 | III | 491.37 | II |
| 885-1 | 7.94 | III | 61.6 | II | 388.52 | III |
| 900-1 | 10.00 | II | 54.2 | III | 394.24 | III |
| 915-1 | 0.02 | V | 42.5 | III | 415.56 | III |
| Q | RMR | BQ | |||
|---|---|---|---|---|---|
| Indicators | Type | Indicators | Type | Indicators | Type |
| RQD | Positive | R1 | Positive | cw | Positive |
| Jn | Negative | R2 | Positive | KV | Positive |
| Jr | Positive | R3 | Positive | K1 | Negative |
| Ja | Negative | R4 | Positive | K2 | Negative |
| Jw | Positive | R5 | Positive | K3 | Negative |
| SRF | Negative | R6 | Positive | ||
| Q | RMR | BQ | ||||||
|---|---|---|---|---|---|---|---|---|
| Indicators | B | C | Indicators | B | C | Indicators | B | C |
| RQD | 0.9148 | 0.0771 | R1 | 0.8391 | 0.1985 | cw | 0.7840 | 0.2607 |
| Jn | 0.8725 | 0.1155 | R2 | 0.9105 | 0.1105 | Kv | 0.7349 | 0.3200 |
| Jr | 0.9208 | 0.0717 | R3 | 0.8867 | 0.1398 | K1 | 0.8982 | 0.1228 |
| Ja | 1.0000 | 0.0000 | R4 | 0.8580 | 0.1752 | K2 | 0.7543 | 0.2965 |
| Jw | 0.8604 | 0.1265 | R5 | 0.7969 | 0.2505 | K3 | 1.0000 | 0.0000 |
| SRF | 0.3273 | 0.6092 | R6 | 0.8982 | 0.1255 | |||
| Classification Method | Parameters | Middle Section | ||||||
|---|---|---|---|---|---|---|---|---|
| 780-1 | 795-1 | 825-1 | 870-1 | 885-1 | 900-1 | 915-1 | ||
| Q | E+ | 0.0048 | 0.3192 | 0.6175 | 0.6140 | 0.6169 | 0.6329 | 0.6211 |
| E− | 0.6409 | 0.3407 | 0.1190 | 0.1857 | 0.1301 | 0.0982 | 0.1013 | |
| G+ | 0.6985 | 0.4762 | 0.4212 | 0.5238 | 0.4475 | 0.3988 | 0.3913 | |
| G− | 0.7143 | 0.2402 | 0.3810 | 0.4038 | 0.4286 | 0.3935 | 0.5284 | |
| I | 0.5551 | 0.6379 | 0.4552 | 0.5044 | 0.4504 | 0.4321 | 0.3784 | |
| RMR | E+ | 0.3304 | 0.1959 | 0.1453 | 0.2579 | 0.1889 | 0.1866 | 0.3990 |
| E− | 0.1582 | 0.2490 | 0.3123 | 0.2759 | 0.2773 | 0.3056 | 0.0847 | |
| G+ | 0.4231 | 0.5151 | 0.6075 | 0.4481 | 0.5845 | 0.5693 | 0.3344 | |
| G− | 0.8571 | 0.5352 | 0.3977 | 0.3548 | 0.5373 | 0.3633 | 0.4320 | |
| I | 0.4054 | 0.5836 | 0.6925 | 0.6248 | 0.6138 | 0.6861 | 0.4505 | |
| BQ | E+ | 0.4367 | 0.3190 | 0.2244 | 0.2662 | 0.3983 | 0.3790 | 0.4828 |
| E− | 0.1217 | 0.2098 | 0.3734 | 0.4090 | 0.2942 | 0.2580 | 0.0785 | |
| G+ | 0.2346 | 0.2629 | 0.3529 | 0.3740 | 0.3883 | 0.2761 | 0.2197 | |
| G− | 0.5714 | 0.4049 | 0.3179 | 0.2677 | 0.3086 | 0.3401 | 0.4082 | |
| I | 0.3563 | 0.4796 | 0.6284 | 0.6668 | 0.6125 | 0.5233 | 0.3889 | |
| Middle Section | 780-1 | 795-1 | 825-1 | 870-1 | 885-1 | 900-1 | 915-1 |
|---|---|---|---|---|---|---|---|
| Mass grade | III | II | II | II | II | III | III |
| Classification method | Q | Q | RMR | BQ | RMR | RMR | RMR |
| Relative closeness | 0.5551 | 0.6379 | 0.6925 | 0.6668 | 0.6138 | 0.6861 | 0.4505 |
| Serial Number | Location of Measurement Points | Evaluation Indicators | ||||||
|---|---|---|---|---|---|---|---|---|
| R1 | R2 | R3 | R4 | R5 | R6 | R7 | ||
| 1 | 780-1 | 9.8 | 16.4 | 11.9 | 17 | 0 | −5 | −4.3 |
| 2 | 780-2 | 9.8 | 16.4 | 12 | 17 | 0 | −5 | −4.3 |
| 3 | 795-1 | 9.7 | 17.6 | 12.2 | 20 | 7 | −5 | −4.3 |
| 4 | 795-2 | 9.7 | 17.6 | 12.2 | 19 | 7 | −5 | −4.2 |
| 5 | 825-1 | 10 | 13.4 | 12.8 | 22 | 7 | −5 | −9.5 |
| 6 | 825-2 | 10 | 13.4 | 12.4 | 21 | 7 | −5 | −9.5 |
| 7 | 825-3 | 10 | 13.4 | 12.8 | 20 | 7 | −5 | −8.2 |
| 8 | 825-4 | 10 | 13.4 | 12.4 | 20 | 7 | −5 | −9 |
| 9 | 870-1 | 9.4 | 3.4 | 12.2 | 18 | 12 | −5 | −9.5 |
| 10 | 885-1 | 10.1 | 15 | 12.5 | 20 | 4 | 0 | −9.5 |
| 11 | 900-1 | 10.4 | 15.1 | 12.7 | 19 | 7 | −10 | −9.2 |
| 12 | 915-1 | 9.3 | 10.7 | 11.5 | 16 | 0 | −5 | −9.2 |
| 13 | 915-2 | 9.3 | 10.7 | 11.5 | 17 | 1 | −6 | −9.2 |
| Evaluation Indicators | R1 | R2 | R3 | R4 | R5 | R6 | R7 |
|---|---|---|---|---|---|---|---|
| B | 0.8971 | 0.9605 | 0.9124 | 0.9160 | 0.8615 | 0.9572 | 0.6800 |
| C | 0.1263 | 0.0485 | 0.1074 | 0.1030 | 0.1699 | 0.0525 | 0.3925 |
| Evaluation Indicators | R1 | R2 | R3 | R4 | R5 | R6 | R7 |
|---|---|---|---|---|---|---|---|
| RMR correlation | 0.1774 | 0.1763 | 0.1036 | 0.1071 | 0.1402 | 0.1503 | 0.1451 |
| E+ relevance | 0.1457 | 0.1467 | 0.1881 | 0.1834 | 0.1048 | 0.1031 | 0.1284 |
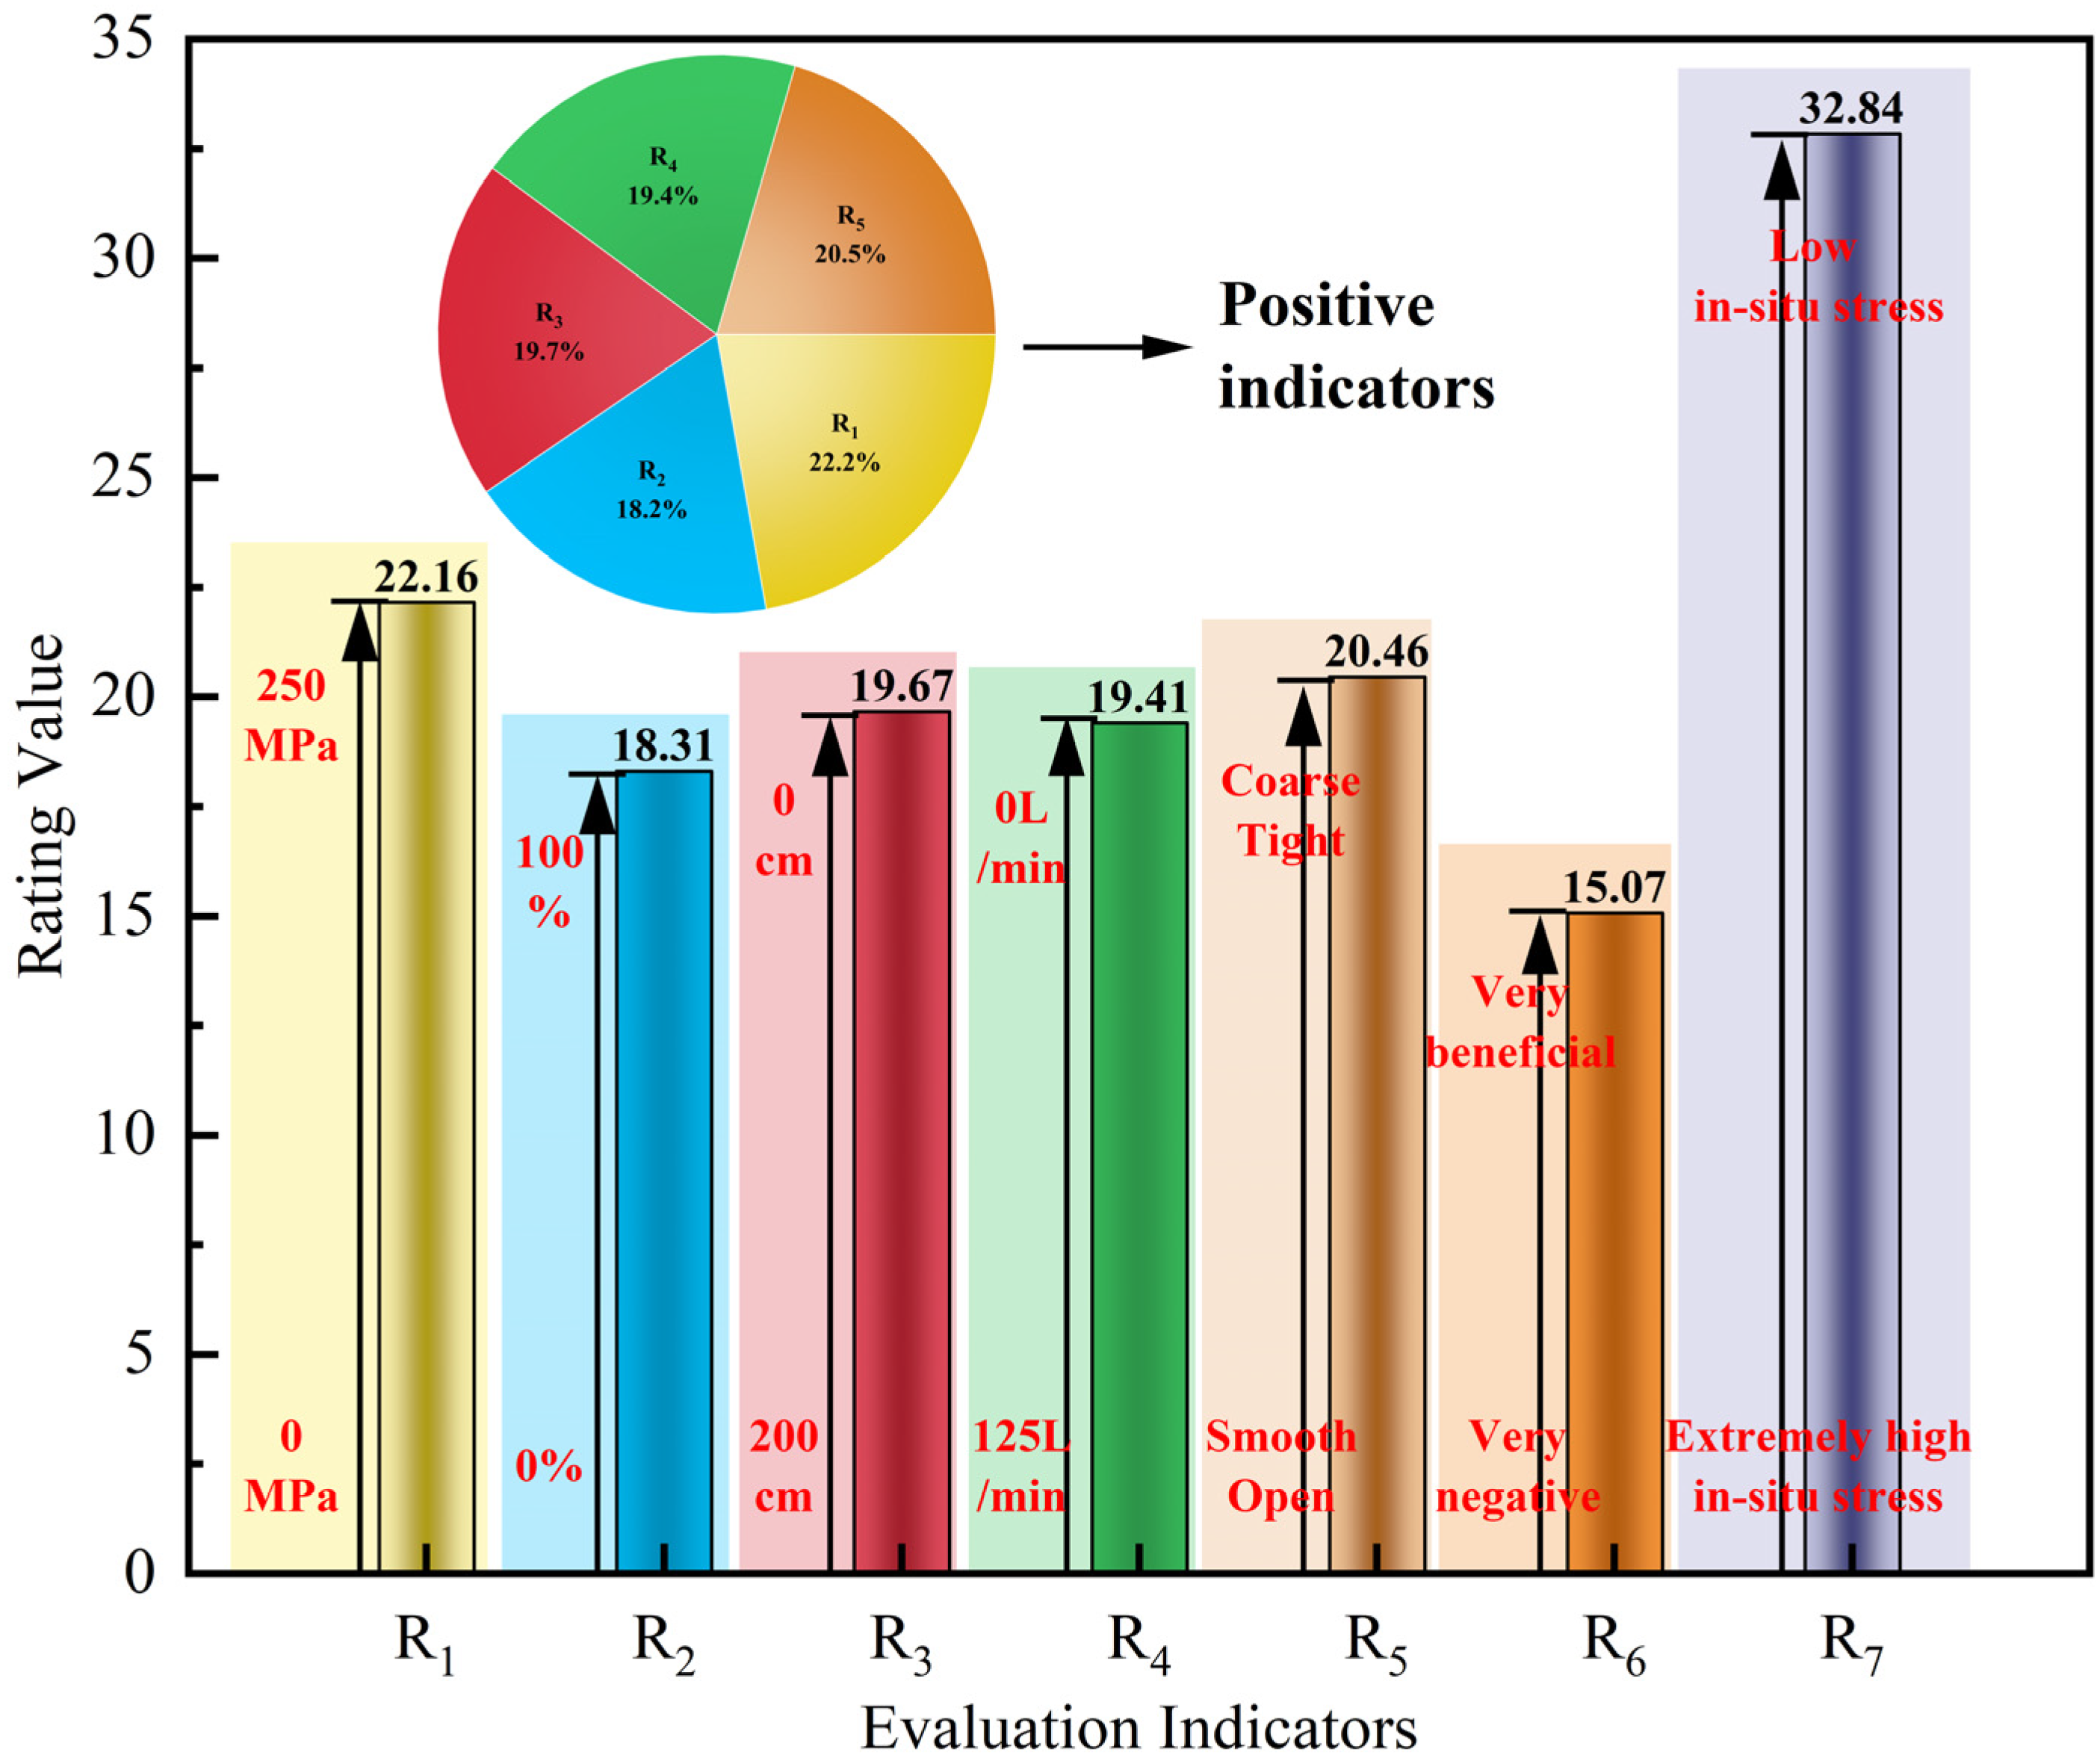
| Evaluation Indicators | R1 | R2 | R3 | R4 | R5 | R6 | R7 |
|---|---|---|---|---|---|---|---|
| J | 0.2216 | 0.1831 | 0.1967 | 0.1941 | 0.2046 | 0.1507 | 0.3284 |
| Rating value | 22.16 | 18.31 | 19.67 | 19.41 | 20.46 | 15.07 | 32.84 |
| Serial Number | 1 | 2 | 3 | 4 | 5 | 6 | 7 | 8 | 9 | 10 | 11 | 12 | 13 |
|---|---|---|---|---|---|---|---|---|---|---|---|---|---|
| IRMR value | 45.8 | 45.9 | 57.2 | 56.3 | 50.7 | 49.3 | 50 | 48.8 | 40.5 | 52.1 | 45 | 33.3 | 34.3 |
| Grade | Ⅲ | Ⅲ | Ⅲ | Ⅲ | Ⅲ | Ⅲ | Ⅲ | Ⅲ | Ⅲ | Ⅲ | Ⅲ | Ⅳ | Ⅳ |
| ETG value | 43.2 | 43.3 | 54.6 | 53.8 | 45.1 | 43.7 | 45.3 | 43.6 | 35.9 | 45.1 | 40.8 | 28.1 | 29.3 |
| Grade | Ⅲ | Ⅲ | Ⅲ | Ⅲ | Ⅲ | Ⅲ | Ⅲ | Ⅲ | Ⅳ | Ⅲ | Ⅲ | Ⅳ | Ⅳ |
Publisher’s Note: MDPI stays neutral with regard to jurisdictional claims in published maps and institutional affiliations. |
© 2022 by the authors. Licensee MDPI, Basel, Switzerland. This article is an open access article distributed under the terms and conditions of the Creative Commons Attribution (CC BY) license (https://creativecommons.org/licenses/by/4.0/).
Share and Cite
Dai, B.; Li, D.; Zhang, L.; Liu, Y.; Zhang, Z.; Chen, S. Rock Mass Classification Method Based on Entropy Weight–TOPSIS–Grey Correlation Analysis. Sustainability 2022, 14, 10500. https://doi.org/10.3390/su141710500
Dai B, Li D, Zhang L, Liu Y, Zhang Z, Chen S. Rock Mass Classification Method Based on Entropy Weight–TOPSIS–Grey Correlation Analysis. Sustainability. 2022; 14(17):10500. https://doi.org/10.3390/su141710500
Chicago/Turabian StyleDai, Bing, Danli Li, Lei Zhang, Yong Liu, Zhijun Zhang, and Shirui Chen. 2022. "Rock Mass Classification Method Based on Entropy Weight–TOPSIS–Grey Correlation Analysis" Sustainability 14, no. 17: 10500. https://doi.org/10.3390/su141710500
APA StyleDai, B., Li, D., Zhang, L., Liu, Y., Zhang, Z., & Chen, S. (2022). Rock Mass Classification Method Based on Entropy Weight–TOPSIS–Grey Correlation Analysis. Sustainability, 14(17), 10500. https://doi.org/10.3390/su141710500