Abstract
Food safety is related to people’s health and the sustainable development of the food supply chain, so it is of crucial practical significance to study food supply chain quality management. This paper employs the evolutionary game method to develop a tripartite evolutionary game model that reflects the interaction of interests among food raw material suppliers, food manufacturers, and consumers. It identifies the key factors that influence the decision-making of each game participant and attempts to use these factors to guide the behavior of the food supply chain members scientifically. The study results demonstrate that sustainable management of food supply chains can be improved by strengthening the intensity of government supervision, narrowing the production cost gap between high-quality and poor-quality food raw materials, improving the inspection ability of the food manufacturer, increasing complaint incentives of consumers, etc. Finally, this paper puts forward suggestions and countermeasures for the government to improve the supervision mechanism of food safety, thereby achieving sustainable management of the food supply chain.
1. Introduction
Food safety issues have always been a hot topic of concern by governments and people of all countries. Past cases such as mad cow disease have caused negative social impacts and panic [1]. The E. coli outbreak from contaminated spinach caused the price of spinach to not recover to its original level for a long time [2]. The United States, Japan, Germany, and some other developed countries have suffered from the food safety problem of “waste cooking oil returning to the dining table” [3]. Similarly, China has experienced several serious and vicious food safety cases such as the melamine-tainted milk powder incident, illegal cooking oil incident, etc. [4,5,6]. These food safety incidents had a large negative impact on the healthy development of the food industry. Fortunately, governments around the world have quickly formulated and implemented many effective response plans and policy measures, so these vicious incidents have been controlled in a short time with the support and cooperation of the citizens.
However, this problem hasn’t been fundamentally eradicated. Once the regulatory actions of the government are relaxed, such issues will recur frequently, so we should start from the source of the problem and seek ways to solve the problem because a long-run regulatory mechanism for food safety has not been established. The frequent occurrence of food safety issues reflects that there are many problems in the raw material procurement, production, inspecting, food quality feedback links, and the government’s supervision for the food supply chain operation. Govindan et al. [7] pointed out that monitoring and control measures should be taken at each stage of the food supply chain to ensure food safety. The main subjects involved in these links include food raw material suppliers, food manufacturers, consumers, and the government. The inducements and motivations for these subjects to make decisions should be clarified with appropriate methods.
Song and Zhuang [8] have done a similar study using evolutionary game method. They constructed a three-party evolutionary game model consisting of government, manufacturers, and farmers. The government has a regulatory function over the behavior of enterprises in the food supply chain, but it is not a member of the supply chain. This paper attempts to use the evolutionary game method to construct a tripartite evolutionary game model consisting of food raw material suppliers, food manufacturers, and consumers. The model also considers the government’s regulatory role in the food supply chain. Therefore, compared with the previous study, the model constructed in this paper considers the participating subjects more complete and more in line with reality.
The benefits of misconduct obtained by node enterprises in the food supply chain are often much higher than their opportunity cost, which makes it difficult for economic punishment to achieve the expected governance effect; therefore, they are more willing to take risky behaviors due to factors such as the existence of regulatory loopholes and the temptation of economic benefits [9,10]. Jiang [11] pointed out that enterprises in the food supply chain tend to make decisions that benefit their own interests and rarely consider the overall interests of the supply chain system, which seriously affects the overall performance of the supply chain system. Over time, the inappropriate strategies of enterprises will cause the entire food supply chain system to fail to serve society well, and even endanger the health of consumers [12,13,14,15].
Based on the background above, this article intends to use the evolutionary game method to answer the following three questions.
- What’s the law of interaction between the strategies of the food raw material supplier, the food manufacturer, and consumers;
- What are the factors that affect the decision-making of each subject in the food supply chain;
- How to employ these influencing factors to guide supply chain member to make the right decisions that can help improve the food quality.
It is of practical significance to clarify these questions, which will help the government formulate a long-term supervision mechanism and achieve sustainable management of the food supply chain.
The remainder of this paper is structured as follows. Section 2 introduces the evolutionary game method and its application. Section 3 constructs the tripartite evolutionary game model. Section 4 employs the replicator dynamics equation to analyze the strategic evolutionary law of the supply chain subjects. Section 5 analyzes the stability of each equilibrium point through the Jacobian matrix. Section 6 assigns values to the model’s parameters based on an actual case and conducts simulation analysis. The specific influence of each factor on the behavior of the game participants is explored in depth. Section 7 summarizes the conclusions in detail and puts forward recommendations for each subject.
2. Research Methods
The leading theory applied in this paper is evolutionary game theory, which is an essential tool to study the decision-making interaction law of supply chain members, and it can analyze the dynamic evolution process of the interaction of the game participants [16]. This method can be used to study the influence of various factors on the game participants’ decision-making, so as to correctly guide the behavior of each subject in practice. In recent years, it has been widely used in behavioral science in all walks of life, covering education, transportation, medical care, architecture, ecology, etc. [17,18,19,20,21]. More and more studies have applied this theory to the food industry. Some representative examples are listed in Table 1.

Table 1.
Literature on the application of evolutionary game theory in the food industry.
Research on the strategic game of food industry operation subjects has made abundant achievements. However, in the process of collecting relevant literature, we found that these studies either applied the evolutionary game method to the game participants who are not in a supply chain (e.g., the government and the enterprise, the government, and the consumer) or applied it to the game participants in a two-stage food supply chain system (e.g., the manufacturer and the supplier, the processing enterprise and the sales enterprise). There are very few studies on the tripartite game of the subjects in a food supply chain. Even if such relevant literature was found, it was often a strategic game study that either didn’t consider the regulatory role of the government or the feedback role of consumers. Wang et al. [27] established a game model in an organic food supply chain composed of one supplier and two heterogeneous manufacturers; their research contributed to improving the government’s subsidy mechanism. Wang et al. [28] constructed a tripartite game system consisting of the farmer cooperative, the processing enterprise, and the sales enterprise in an agricultural product supply chain; they explored how the farmer cooperative can better manage the information sharing issues of the node enterprises.
Moreover, the structure of the food supply chain system constructed by previous studies is too simple to consider the influencing factors fully, but in order to optimize the quality management of the food supply chain, a variety of key factors must be considered comprehensively [29]. Many studies only carried out the theoretical analysis in the papers but didn’t apply the model to practical issues, and the persuasiveness was not strong enough.
This paper can make up for some of the deficiencies in previous studies. It applies the evolutionary game method to the three-stage supply chain system composed of the food raw material supplier, the food manufacturer, and consumers, which is more complete than the two-stage supply chain. When building models, the regulatory role of government on the behavior of the subjects is also taken into account, which is more in line with the actual situation. In addition, this paper applies the game model to analyze an actual case and considers influencing factors more comprehensively. The findings will help managers implement sustainable management of the food supply chain.
3. Assumptions and Model Construction
3.1. Conditional Assumptions of the Game Model
To construct the tripartite evolutionary game model and to explore the interaction rules of behavioral decision-making of the three stakeholders, this paper proposes assumptions as follows:
- The weight of the food raw materials provided by the food raw material supplier to the food manufacturer is Q. The unit cost of high-quality raw materials is Cg, and the unit cost of poor-quality raw materials is Cb, (Cg > Cb). Regardless of whether the food raw materials are of high quality, the food raw material supplier will sell them to the food manufacturer at the same unit price P1. Therefore, the profit obtained by the food raw material supplier is (P1 − Cg)Q when it provides high-quality raw materials, and the profit is (P1 − Cb)Q when it provides poor-quality raw materials;
- After processing food raw materials into food products, the food manufacturer will sell them to consumers at a unit price of P2, (P2 > P1 > Cg > Cb). The unit cost of the food manufacturer to produce and sell food products is expressed as Cp, which includes the cost of processing food raw materials, the cost of adding other auxiliary materials during the food production process, and the expenses incurred in food sales activities. Therefore, the profit earned by the food manufacturer from selling food is (P2 − P1 − Cp)Q;
- The food manufacturer should be responsible for the safety of food raw materials, and it needs to inspect the quality of food raw materials. If the food manufacturer detects that the food raw material doesn’t meet the safety standards, it will refuse to accept the food raw materials provided by the food raw material supplier so the food raw material supplier cannot obtain income. At the same time, there is a certain probability that the government will investigate and punish the food raw material supplier for providing poor-quality food raw materials, and the amount of the fine is represented as Fa;
- The food manufacturer may choose to inspect the quality of food raw materials to prevent the food raw material supplier from replacing high-quality food raw materials with poor-quality food raw materials, or it may choose not to inspect to save inspecting costs. If the food manufacturer chooses to inspect, the inspection cost is Cr. When the food raw material supplier provides poor-quality food raw materials, the probability of the food manufacturer detecting the food raw material has quality problems is α, and the probability of detection failure is (1 − α), i.e., the value of α can reflect the detection ability of the food manufacturer; the higher the value of α, the stronger the detection ability of the food manufacturer.Even if the food manufacturer doesn’t discover the food raw materials are of poor quality, the food produced by it may still cause food safety incidents. If the food raw materials are of poor quality, and the food manufacturer chooses the “inspect” strategy at the same time, the expected income of the food raw material supplier is expressed as (1 − α)P1Q; if the food manufacturer discovers the food raw materials are of poor quality, it will choose to return the goods and purchase high-quality food raw materials from other food raw material suppliers then. After repurchasing, the food manufacturer needs to spend Cr to detect the quality of the new food raw materials. If the food manufacturer directly processes the purchased food raw materials into food and sells it without detecting its quality, the safety of the food cannot be guaranteed, which is a violation of the regulations. There is a certain probability that the government will investigate and punish the food manufacturer for such transgressions, and the amount of the fine is expressed as Fb;
- Suppose the weight of the food purchased by the consumer from the food manufacturer is ∆Q, then the consumer will spend P2∆Q on buying the food. Consumers can purchase food offline or through online ordering. Consumers will complain if they feel unwell after eating food or find other abnormalities during the food eating process. However, sometimes even if there is no problem with the food raw materials and the detecting process, consumers may feel that the food doesn’t meet their expectations and therefore have a skeptical attitude towards food quality. In this case, they may also choose to complain. The probability that the government spontaneously takes regulatory actions against the food raw material supplier and the food manufacturer without customer complaint is β; when consumers complain to the government, the probability of the government taking regulatory actions is 1. The complaint cost of consumers is Ct. Since the food manufacturer is the subject of direct transactions with consumers, consumers often require the food manufacturer to compensate for their economic losses.If the food manufacturer is indeed negligent in the detecting process, the consumer’s complaint will be successful, and the food manufacturer will compensate the consumer for an amount of B. After the food manufacturer reimburses the consumer, it will seek compensation from the food raw material supplier. If the food raw materials are indeed inferior, the food manufacturer will receive compensation γB from the food raw material supplier, where γ is the compensation factor. If neither the food raw material supplier nor the food manufacturer violates the regulations, the consumer’s complaint will be invalid.
- The probability of the food raw material supplier providing high-quality food raw materials is x, and the probability of providing poor-quality food raw materials is 1 − x; the probability of the food manufacturer inspecting food raw materials is y, and the probability of not inspecting food raw materials is 1 − y; the probability of the customers not complaining is z, and the probability of complaining is 1 − z. x, y, and z are variables, whose values change with the evolution process. Their value range is [0, 1].
3.2. Model Construction
Based on the above assumptions, the payoff matrix of the three game participants can be obtained, as shown in Table 2. The order of the three expressions in the table corresponds to the food raw material supplier, the food manufacturer, and consumers in turn.

Table 2.
The payoff matrix of the three game participants.
4. Evolutionary Game Analysis of the Food Raw Material Supplier, the Food Manufacturer, and Customers
4.1. The Replicator Dynamics Equation and Equilibrium Points of the Food Raw Material Supplier
The expected payoff when the food raw material supplier chooses the “provide high-quality food raw materials” strategy is represented by Ea1, the expected payoff when the food raw material supplier chooses the “provide poor-quality food raw materials” strategy is represented by Ea2, and the average value of the expected payoffs is represented by Ea. Their respective expressions are as follows:
The replicator dynamics equation of the food raw material supplier’s decision-making is:
When , . It means that it is in a stable state no matter what value x takes; otherwise, set , and it can be deduced that x = 0 and x = 1 are two equilibrium points. Take the derivative of :
When , it can be deduced and . In this case, x = 1 is the equilibrium point, which means that when the probability of the food manufacturer choosing the “inspect” strategy is higher than a certain level, the food raw material supplier will choose the “provide high-quality food raw materials” strategy.
When , it can be deduced and . In this case, x = 0 is the equilibrium point, which means that when the probability of the food manufacturer choosing the “inspect” strategy is lower than a certain level, the food raw material supplier will choose the “provide poor-quality food raw materials” strategy.
4.2. The Replicator Dynamics Equation and Equilibrium Points of the Food Manufacturer
The expected payoff when the food manufacturer chooses the “inspect” strategy is represented by Eb1, the expected payoff when the food manufacturer chooses the “not inspect” strategy is represented by Eb2, and the average value of the expected payoffs is represented by Eb. Their respective expressions are as follows:
The replicator dynamics equation of the food manufacturer’s decision-making is:
When , . It means that it is in a stable state no matter what value y takes; otherwise, set , and it can be deduced that y = 0 and y = 1 are two equilibrium points. Take the derivative of :
When , it can be deduced and . In this case, y = 0 is the equilibrium point, which means that when the probability of the consumers choosing the “not complain” strategy is higher than a certain level, the food manufacturer will choose the “not inspect” strategy.
When , it can be deduced and . In this case, y = 1 is the equilibrium point, which means that when the probability of the consumers choosing the “not complain” strategy is lower than a certain level, the food manufacturer will choose the “inspect” strategy.
4.3. The Replicator Dynamics Equation and Equilibrium Points of Consumers
The expected payoff when consumers choose the “not complain” strategy is represented by Ec1, the expected payoff when consumers choose the “complain” strategy is represented by Ec2, and the average value of the expected payoffs is represented by Ec. Their respective expressions are as follows:
The replicator dynamics equation of consumers’ decision-making is:
When , . It means that it is in a stable state no matter what value z takes; otherwise, set , and it can be deduced that z = 0 and z = 1 are two equilibrium points. Take the derivative of :
When , it can be deduced and . In this case, z = 1 is the equilibrium point, which means that when the probability of the food raw material supplier choosing the “provide high-quality food raw materials” strategy is higher than a certain level, consumers will choose the “not complain” strategy.
When , it can be deduced and . In this case, z = 0 is the equilibrium point, which means that when the probability of the food raw material supplier choosing the “provide high-quality food raw materials” strategy is lower than a certain level, consumers will choose the “complain” strategy.
5. Evolutionary Stability Analysis of the Equilibrium Points
Combining the three replicator dynamics equations of Formulas (2), (5) and (8), a replicator dynamics system can be obtained, which is expressed by Formula (10):
According to the conclusion drawn by Friedman [30], the evolutionary stability strategy of the replicator dynamics system can be yielded by analyzing the asymptotic stability of the Jacobian matrix of the system. Only when all the eigenvalues of the Jacobian matrix are less than 0, the corresponding equilibrium point is the evolutionary stability strategy (ESS) of the replicator dynamics system; otherwise, the equilibrium point is unstable [31,32,33,34]. According to Formula (10), the Jacobian matrix of the replicator dynamics system consisting of the food raw material supplier, the food manufacturer, and consumers can be obtained, which is represented by J. The expression of the Jacobian matrix J is shown in Formula (11):
The constituent elements of the Jacobian matrix are shown in Formula (12):
As for Formula (10), we set to get eight pure strategy equilibrium solutions, which are E1(0,0,0), E2(0,0,1), E3(0,1,0), E4(1,0,0), E5(0,1,1), E6(1,0,1), E7(1,1,0), and E8(1,1,1). Firstly, take the equilibrium point E1(0,0,0) as an example for illustration; substituting x = 0, y = 0, z = 0 into Formula (12), the result obtained is shown in Formula (13):
Obviously, the three eigenvalues of the Jacobian matrix J(0,0,0) are λ1 = −(Cg − Cb)Q + Fa + γB, λ2 = −(1 + α)Cr + αFb + α(1 − γ)B, and λ3 = Ct − B. If these three eigenvalues are all less than 0, it indicates that the equilibrium E1 is an ESS. Similarly, the eigenvalues of the Jacobian matrix corresponding to other equilibrium points can be calculated in the same way, and the calculation results are shown in Table 3.

Table 3.
Eigenvalues corresponding to each equilibrium point.
In real life, the cost of consumers’ complaints is often much higher than the amount of compensation they receive. In China, there was a case where a consumer spent 2 CNY to buy a bundle of leek and had diarrhea after eating it. The consumer wanted to complain, but he needed to provide proof materials that could prove the bundle of leek has quality problems, which need cost several thousand CNY to get [35]. The price of food is usually not high, and it is not worthwhile to spend such a high cost to complain, so consumers often choose to remain silent when encountering food safety problems. Based on the actual situation, set Ct − B > 0. Among the eight equilibrium points, there are positive values in the eigenvalues of E1(0,0,0), E3(0,1,0), E4(1,0,0), and E7(1,1,0), so these four equilibrium points cannot be the ESS. The stability analysis of each equilibrium point is shown in Table 4.

Table 4.
Stability analysis of the eight equilibrium points.
According to the above analysis, E2(0,0,1), E5(0,1,1), E6(1,0,1), and E8(1,1,1) are four possible evolutionary stable strategies. When the values of the parameters meet the constraints of these equilibrium points, the game system will reach the corresponding equilibrium state.
6. Model Application and Simulation Analysis
6.1. Case Background
The research content of this part is based on a food safety incident that occurred in Hangzhou, Zhejiang Province, China, in 2014 [36]. As a large-scale food raw material supplier, Hangzhou Guangqi Trading Company provided food raw materials to more than 300 pastry manufacturers. A CCTV reporter conducted a secret investigation of the company and found that the wheat flour provided by the company was expired and of poor quality. This company sold the processed inferior wheat flour as new wheat flour to pastry manufacturers in the market. Reportedly, the cost of these poor-quality food raw materials is even lower than half of the market price. The “315” program of CCTV exposed this matter, which had attracted wide attention from all walks of life, and the government had also launched actions to investigate the case. In the end, the company and the pastry manufacturers involved were punished as they deserved, and they compensated the consumers. The game model established in this paper can be well applied to this case.
6.2. Case Analysis and Parameter Assignment
Guangqi Company had provided poor-quality food raw materials to pastry manufacturers for two years; however, it was not investigated and punished by the government until the media exposed its misconduct. The four subjects involved in the case all made wrong decisions that are not conducive to the stable development of the food supply chain: the government has adopted a lax supervision strategy, the food raw material supplier has chosen a strategy of providing poor-quality food raw materials, the food manufacturer has chosen a strategy of lax inspection of food raw materials, and consumers have chosen not to complain. Therefore, all four subjects are responsible for the occurrence of this food safety incident. Next, through some survey data to analyze why they chose these strategies.
The primary raw material of bread and other pastry foods is wheat flour. The price of wheat flour in China has been relatively stable for many years. According to statistics, the average market price of wheat flour (P1) is around 5.6 CNY/kg, and the cost (Cg) of wheat flour suppliers to produce high-quality wheat flour is around 3.5 CNY/kg [37,38], while the cost of inferior wheat flour provided by spiteful suppliers (Cb) is only around 1.5 CNY/kg. Through telephone interviews and visits, we surveyed the five bread manufacturers that had cooperated with Guangqi Company and obtained some available data such as the unit processing cost (Cp) of their bread production, the cost of food raw material inspection (Cr) and the unit price (P2) of the same grade of bread they sell, etc. Finally, the average values of these data are taken as the initial data of the simulation study. The three data mentioned above are equal to 4.4 CNY/kg, 1000 CNY, and 20 CNY/kg, respectively. Suppose the weight (Q) of wheat flour ordered by a bread manufacturer from Guangqi Company in a transaction is 500 kg, then Quangqi Company’s sales revenue in this transaction is P1Q = 2800 CNY, and the bread manufacturer’s sales revenue is P2Q = 10,000 CNY. According to the relevant fine policy, it can be set that the government imposed a fine of 2000 CNY (Fa) on the food raw material supplier and 5000 CNY (Fb) on the food manufacturer.
If consumers suspect that the food they buy has quality issues, they can choose to complain to the government, but they must provide a test report proving the food has quality problems as evidence. Consumers’ complaint costs (Ct) include the cost of collecting evidence, litigation costs, time costs, transportation costs, etc. As such, the complaint cost is estimated to be 2000 CNY. According to the relevant laws and regulations, consumers who successfully complained can get ten times the price of the food. For example, suppose a consumer spends 20 CNY on a loaf of bread; he suspects that the bread has quality problems after eating it and decides to complain, then the compensation (B) that the consumer will receive after a successful complaint is 200 CNY. To facilitate the analysis of the problem, the medical expenses due to food poisoning are not considered. Finally, the inspection ability of the food manufacturer (α), the probability of the government agency spontaneously taking regulatory actions without consumer complaints (β), and the compensation coefficient (γ) are identified by the expert evaluation method. The values of all parameters are shown in Table 5.

Table 5.
The initial value of each parameter.
6.3. Simulation Analysis
In order to explore the influence of various factors on the game participants’ decision-making, the content of this section is to use MATLAB software to carry out numerical simulation experiments. We studied how the increase or decrease of the value of each factor will affect the behavior of the subjects and make suggestions for improving the safety of the food supply chain based on this law. To be consistent with the content mentioned above, this section replaces “Guangqi Company” with “food raw material supplier” and replaces “bread manufacturer” with “food manufacturer”. Suppose the probability set of the initial mixed strategy is (0.5,0.5,0.5). Input the initial values of various parameters into the simulation program, and the result of running the program is shown in Figure 1.
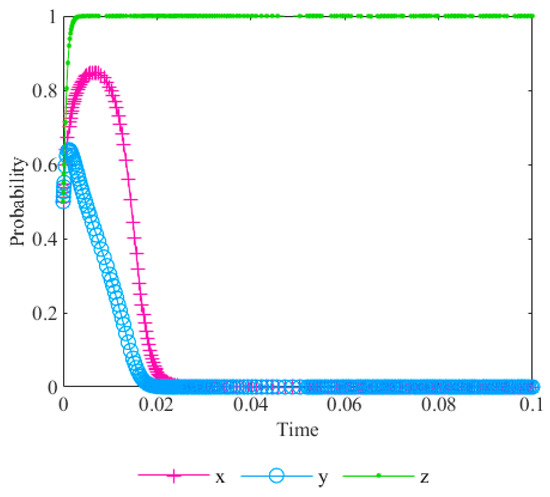
Figure 1.
Initial equilibrium state (0,0,1).
The evolutionary trend of the game system is stable at the equilibrium point (0,0,1) (Figure 1), which means that the food raw material supplier chooses the “provide poor-quality food raw materials” strategy, the food manufacturer chooses the “not inspect” strategy, and consumers choose the “not complain” strategy; the simulation result is consistent with the case. Obviously, this equilibrium state is not the ideal state we desire; the strategies of the three game participants have an adverse effect on public health and social stability. Next, we will explore the influence of different factors on the decision-making of each subject. The evolutionary trajectory of the game system can be observed intuitively through the trajectory diagram in the three-dimensional space.
6.3.1. Influence Analysis of Factors Related to the Intensity of Government Supervision
- Numerical simulation analysis of the probability β of the government spontaneously taking supervisory actions
Increasing the value of β from 0.2 to 0.3 and 0.8 respectively, and remaining the other parameter values unchanged, the simulation results are shown in Figure 2. The left image in Figure 2 is the three evolutionary trajectories of the game system when β takes three different values in the three-dimensional space, and the right image is the projection of the three-dimensional space image on the y-z plane. In Figure 2, the symbol “.” represents the initial evolutionary trajectory of the game system reaching the equilibrium point (0,0,1) when β = 0.2; “*” represents the evolutionary trajectory when the value of β is increased to 0.3; “□” represents the evolutionary trajectory when the value of β is increased to 0.8.
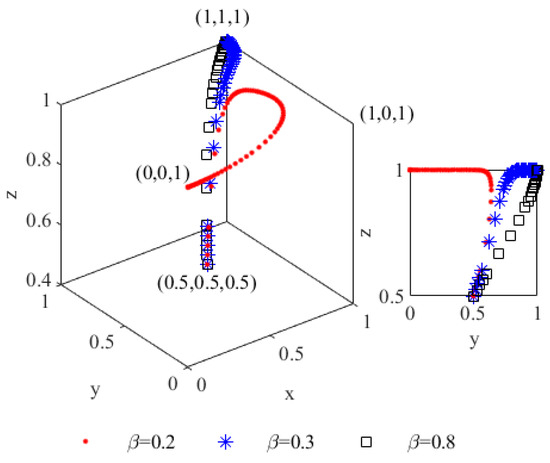
Figure 2.
The effect of different values of β on evolution.
When the value of β increases from 0.2 to 0.3, the equilibrium point changes from (0,0,1) to (1,1,1). This result indicates that the strategy of the food raw material supplier has changed from “provide poor-quality food raw materials” to “provide high-quality food raw materials”; the strategy of the food manufacturer has changed from “not inspect” to “inspect”. When β = 0.8, the evolutionary trajectory reaches the equilibrium point (1,1,1) in a shorter path, which demonstrates that increasing the government’s enthusiasm for supervision of violations can prompt the food raw material supplier to choose the “provide high-quality food raw materials” strategy, and it can also drive the food manufacturer to select the “inspect” strategy. By observing the projected image on the y-z plane in Figure 2, it can be concluded that the greater the probability of government supervision, the more likely the food manufacturer is to choose the “inspect” strategy. In addition, the greater the probability of government supervision, the higher the probability that consumers choose the “complain” strategy. In other words, when the interests of consumers are harmed, the government’s active regulatory actions can encourage consumers to protect their rights.
When the evolution reaches the new equilibrium point (1,1,1), both the food raw material supplier and the food manufacturer choose to operate in compliance, and consumers’ complaints will be invalid, so consumers would choose the “not complain” strategy. In summary, the increase in government supervision enthusiasm can effectively curb the misconduct of the food raw material supplier and the food manufacturer, and it can also effectively encourage consumers to safeguard their rights when their interests are damaged.
- 2.
- Numerical simulation analysis of the fine Fa imposed on the food raw material supplier
Increase Fa from the initial value of 2000 to 6000 and 12,000 respectively, and the simulation results are shown in Figure 3. When the value of Fa increases from 2000 to 6000, the evolutionary equilibrium point changes from (0,0,1) to (1,0,1), which indicates that increasing the value of Fa can make the food raw material supplier turn to choose the “provide high-quality food raw materials” strategy from the original strategy of “provide poor-quality food raw materials”. When Fa = 12,000, the probability value x of the food raw material supplier choosing to provide high-quality raw materials reaches 1 at a faster rate, which demonstrates that increasing the penalty amount can prompt the food raw material supplier to choose the “provide high-quality food raw materials” strategy. By observing the projected image on the x-z plane in Figure 3, it can be concluded that the greater the value of the fine Fa, the more likely the food raw material supplier will provide high-quality food raw materials.
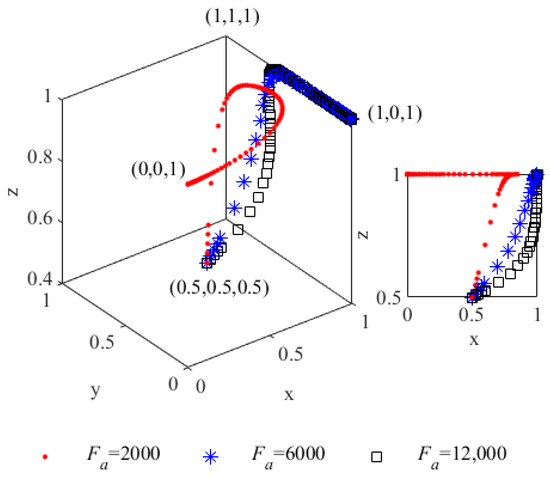
Figure 3.
The effect of different values of Fa on evolution.
- 3.
- Numerical simulation analysis of the fine Fb imposed on the food manufacturer
Increasing the value of Fb from 5000 to 9000 and 15,000 respectively, the simulation results are shown in Figure 4.
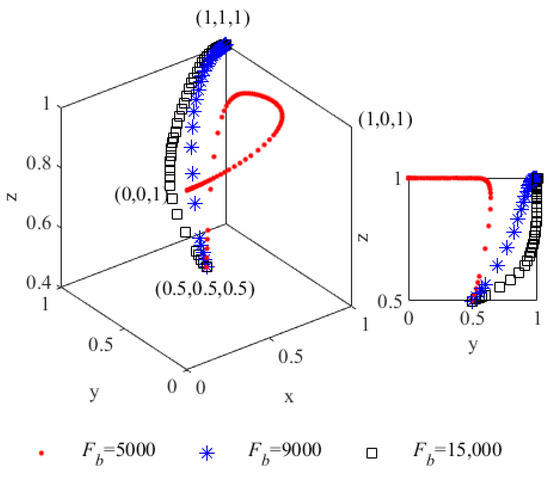
Figure 4.
The effect of different values of Fb on evolution.
When the value of Fb increases from 5000 to 9000, the equilibrium point changes from (0,0,1) to (1,1,1), which indicates that increasing the value of the fine Fb can make the food manufacturer turn to the “inspect” strategy from the original “not inspect” strategy. As the food manufacturer turns to the “inspect” strategy, the strategy of the food raw material supplier also changes from “provide poor-quality food raw materials” to “provide high-quality food raw materials”. When Fb = 15,000, the probability value y of the food manufacturer choosing the “inspect” strategy reaches 1 at a faster rate. By observing the projected image on the y-z plane in Figure 4, it can be drawn that the greater the value of the fine Fb, the more likely the food manufacturer is to choose the “inspect” strategy.
Based on the analysis content above, the intensity of government supervision plays a very important role in maintaining the healthy development of the food supply chain. The regulatory actions and increased fines on the misconduct of the enterprises can positively affect the behavior of the food supply chain members, thereby ensuring the safety of food quality.
6.3.2. Influence Analysis of Factors Related to the Interests of the Food Raw Material Supplier
- Numerical simulation analysis of the cost Cg of the food raw material supplier to provide high-quality food raw materials
Decreasing the value of Cg from 3.5 to 3 and 2.3 respectively, and remaining the other parameter values unchanged, the simulation results are shown in Figure 5. When the value of Cg decreases from 3.5 to 3, the equilibrium point is still (0,0,1), but the path of the evolutionary trajectory is significantly longer than that of the initial trajectory. Therefore, reducing the cost of providing high-quality food materials can slow down the evolutionary speed of reaching the equilibrium point (0,0,1). When Cg = 2.3, the equilibrium point changes from (0,0,1) to (1,0,1), i.e., the strategy of the food raw material supplier changes from “provide poor-quality food raw materials” to “provide high-quality food raw materials”. This result indicates that reducing the cost of providing high-quality food raw materials can make the food raw material supplier more inclined to choose the strategy of “provide high-quality food raw materials”. The above results demonstrate that narrowing the cost gap between high-quality food raw materials and poor-quality food raw materials can effectively prompt the food raw material supplier to provide high-quality food raw materials.
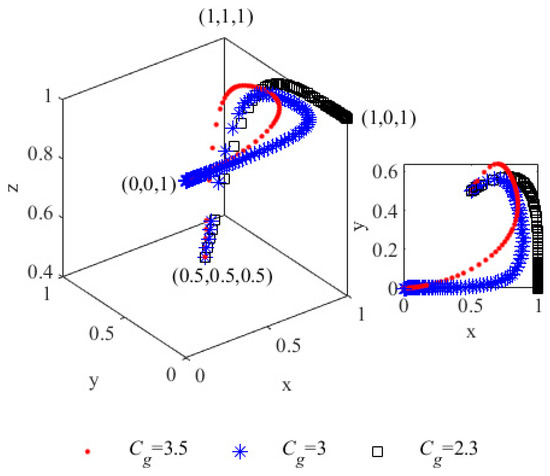
Figure 5.
The effect of different values of Cg on evolution.
6.3.3. Influence Analysis of Factors Related to the Interests of the Food Manufacturer
- Numerical simulation analysis of the inspection cost Cr of the food manufacturer
The initial value of Cr is 1000. Two cases of increasing the initial value to 2000 and decreasing it to 500 are studied respectively. The simulation results are shown in Figure 6. When the value of Cr increases from 1000 to 2000 (Figure 6), the equilibrium point is still (0,0,1), but the path of the evolutionary trajectory is significantly shorter than that of the initial trajectory, which means that the increase in the inspection cost can prompt the food manufacturer to choose the “not inspect” strategy.
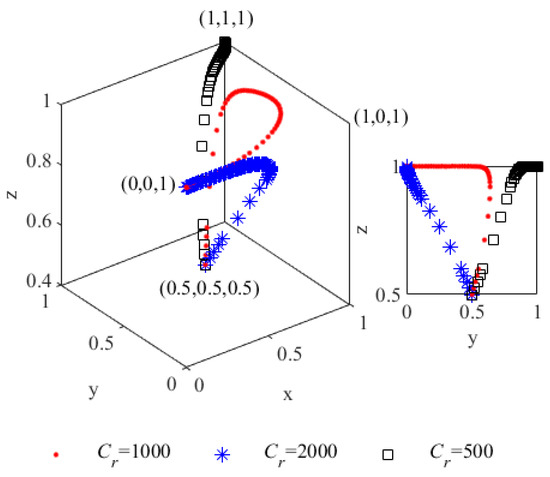
Figure 6.
The effect of different values of Cr on evolution.
When the initial value of Cr decreases from 1000 to 500, the equilibrium point changes from the original point (0,0,1) to (1,1,1), i.e., the original “provide poor-quality food raw materials” strategy of the food raw material supplier turns to the “provide high-quality food raw materials” strategy; the initial “not inspect” strategy of the food manufacturer turns to the “inspect” strategy. This result indicates that decreasing the value of Cr can make the food manufacturer more inclined to choose the “inspect” strategy. When the food manufacturer chooses the “inspect” strategy, the food raw material supplier tends to choose the “provide high-quality food raw materials” strategy. In this case, consumers will tend to choose the “not complain” strategy; thus, the game system finally stabilizes at the equilibrium point (1,1,1). By observing the projected image on the y-z plane in Figure 6, it can be concluded that the lower the inspection cost for the food manufacturer, the more it tends to choose the “inspect” strategy.
- 2.
- Numerical simulation analysis of the inspection ability α of the food manufacturer
The initial value of α is 0.5. Two cases of decreasing the initial value to 0.2 and increasing it to 1 are studied respectively. The simulation results are shown in Figure 7. When the value of α decreases from 0.5 to 0.2, the equilibrium point is still (0,0,1), but the path of the evolutionary trajectory is significantly shorter than that of the initial trajectory. By observing the projected image on the x-z plane in Figure 7, it can be drawn that the probability of the food raw material supplier choosing the strategy of “provide high-quality food raw materials” reaches 0 at a faster rate with decreasing the value of α, which indicates that the weakening of the inspection ability of the food manufacturer will prompt the food raw material supplier to choose the “provide poor-quality food raw materials” strategy.
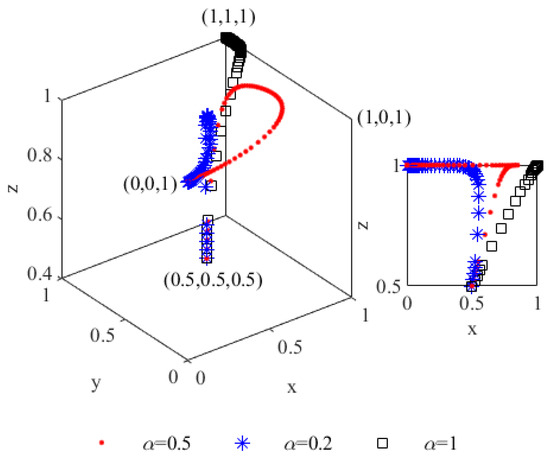
Figure 7.
The effect of different values of α on evolution.
The expression α = 1 represents that when the food raw material supplier provides poor-quality food raw materials, it will inevitable be detected by the food manufacturer. As shown in Figure 7, when α = 1, the game system reaches a new equilibrium point (1,1,1). The food raw material supplier’s strategy has changed from “provide poor-quality food raw materials” to “provide high-quality food raw materials”; the food manufacturer’s strategy has changed from “not inspect” to “inspect”. Therefore, having a solid inspection ability will make the food manufacturer more willing to choose the “inspect” strategy, thereby prompting the food raw material supplier to select the “provide high-quality food raw materials” strategy.
- 3.
- Numerical simulation analysis of the compensation coefficient γ
When consumers choose the “complain” strategy, they will directly demand compensation from the food manufacturer. If the consumer complaint is valid, the food manufacturer will compensate the consumer with the amount of B, and then the food manufacturer will seek compensation from the food raw material supplier with the amount of γB.
Since the food production process includes multiple links, and these links involve various entities, it is difficult to draw a clear line between the responsibilities of each entity when a food safety incident occurs, which is the reason why the subjects in the supply chain shirk responsibility to each other. When consumer complaints happen, the food manufacturer will hold the food raw material supplier accountable. Still, the food raw material supplier is often unwilling to admit that its raw materials have quality problems, coupled with the food manufacturer’s negotiating ability being limited, so the value of γ is usually equal to 1. In fact, food manufacturers often lose much higher than B. Consumers often directly seek compensation from the food manufacturer rather than the food raw material supplier. In addition to compensating consumers for their economic loss B, the food manufacturer also must suffer the loss of reputation, the loss of consumer resources, and spend time dealing with customer complaints, etc. The monetization amount of these losses will be much higher than B. In this section, we discussed how the increase of the compensation coefficient γ affects the behavior of each game subject.
Increasing the value of γ from 1 to 15 and 30 respectively, the simulation results are shown in Figure 8. When the value of γ increases from 1 to 15, the equilibrium point is still (0,0,1), but the path of the evolutionary trajectory is longer than that of the initial trajectory. When the value of γ increases to 30, the equilibrium point changes from the original (0,0,1) to (1,0,1), which means that the food raw material supplier’s strategy changes from “provide poor-quality food raw materials” to “provide high-quality food raw materials”. By observing the projected image on the x-z plane in Figure 8, it can be concluded that the greater the compensation coefficient, the more likely the food raw material supplier will provide high-quality raw materials.
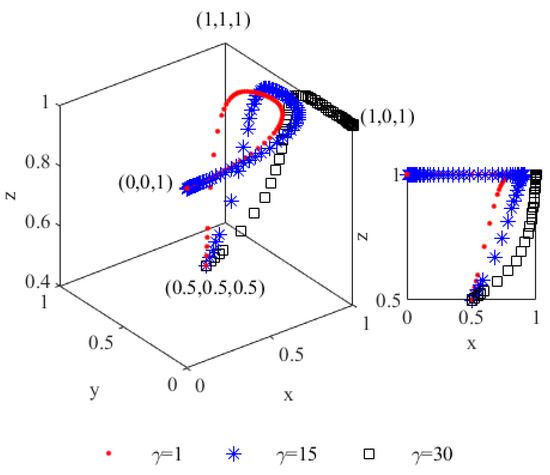
Figure 8.
The effect of different values of γ on evolution.
6.3.4. Influence Analysis of Factors Related to the Interests of Consumers
- Numerical simulation analysis of the complaint cost Ct of consumers
The initial value of Ct is 2000. Two cases of increasing the initial value to 4000 and decreasing it to 100 are studied respectively. The simulation results are shown in Figure 9. When the value of Ct increases from 2000 to 4000, the equilibrium point is still (0,0,1), but the path of the evolutionary trajectory is shorter than that of the initial trajectory. This result indicates that the increase in complaint costs will prompt consumers to choose the “not complain” strategy, making consumers lose the function of feedback on food quality, thereby prompting the food raw material supplier and the food manufacturer to continue to engage in misconduct.
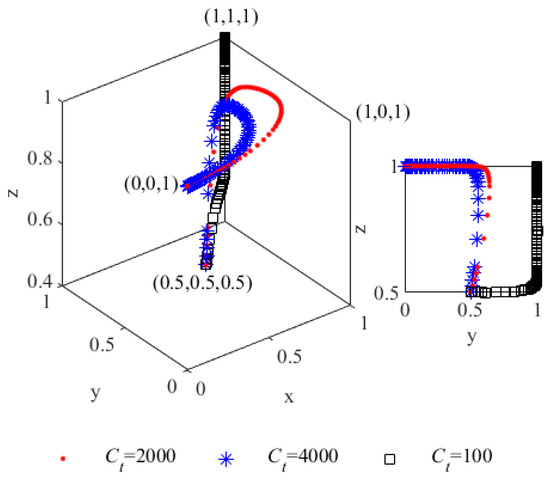
Figure 9.
The effect of different values of Ct on evolution.
When the value of Ct decreases to 100, the equilibrium point changes from the original point (0,0,1) to (1,1,1), i.e., the original “provide poor-quality food raw materials” strategy of the food raw material supplier turns to the “provide high-quality food raw materials” strategy; the initial “not inspect” strategy of the food manufacturer turns to the “inspect” strategy. By observing the projected image on the y-z plane in Figure 9, it can be drawn that the smaller the value of Ct, the smaller the value of z. A decrease in the z-value indicates that the probability of consumers choosing the “complain” strategy is increasing. The results show that reducing complaint costs can increase consumers’ enthusiasm to complain so that when they discover the food they buy is of poor quality, they will be more willing to defend their rights and interests. The increased consumer enthusiasm for complaints can restrain the misconduct of food raw material suppliers and food manufacturers. Therefore, the government should consider seeking effective ways to reduce the cost of consumer complaints so that consumers can help the government monitor corporate violations.
- 2.
- Numerical simulation analysis of the compensation B received by consumers
Increasing the value of B from 200 to 3000 and 10,000, respectively, the simulation results are shown in Figure 10. When the value of B increases from 200 to 3000, the equilibrium point changes from (0,0,1) to (1,1,1), which indicates that the strategy of the food raw material supplier changes from “provide poor-quality food raw materials” to “provide high-quality food raw materials”; the strategy of the food manufacturer changes from “not inspect” to “inspect”. By observing the projected image on the x-z plane in Figure 10, it can be concluded that the more the compensation B, the more likely the consumers will choose the “complain” strategy.
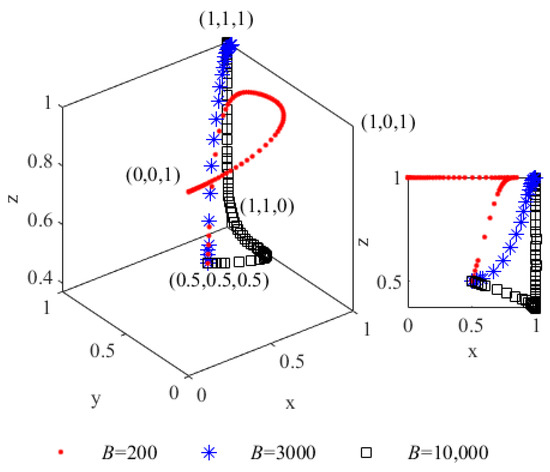
Figure 10.
The effect of different values of B on evolution.
As shown in Figure 10, when the value of B increases to 10,000, the direction of the evolutionary trajectory is to start from the initial point (0.5,0.5,0.5), then approach the equilibrium point (1,1,0), and finally stabilize at the equilibrium point (1,1,1). The result indicates that if the amount of compensation is large enough, consumers’ enthusiasm to protect their rights can be significantly increased, so consumers will tend to choose the “complain” strategy in this case. The increase in the probability of consumer complaints will restrict the misconduct of the food raw material supplier and the food manufacturer, so the evolutionary direction of the game system at the beginning is moving towards the equilibrium point (1,1,0). Since the food raw material supplier and the food manufacturer have no misconduct, it is invalid for consumers to complain in this case. Thus, consumers will choose the “not complain” strategy. Finally, the final evolutionary equilibrium point is stable at (1,1,1) instead of (1,1,0).
Based on the above analysis, increasing the amount of compensation for consumer complaints can affect the behaviors of the three game participants at the same time. Therefore, the government should consider increasing the amount of compensation and rewards for consumers when formulating relevant laws and regulations, so that consumers can actively feedback on the information of food quality.
7. Conclusions and Suggestions
7.1. Conclusions
How to effectively improve the safety level of food quality is a common concern of the government and the public. Studying the behavioral motivations of the food supply chain members and guiding them to make correct decisions can contribute to the sustainable management of the food supply chain. The main conclusions are drawn as follows.
- Increasing the supervision intensity of the government, increasing the amount of fines for illegal practices, narrowing the cost gap between high-quality food raw materials and poor-quality food raw materials, reducing the inspection cost, improving the inspection ability of food manufacturers, reducing the complaint cost of consumers and encouraging consumers to report the misconduct of enterprises, and optimizing the compensation mechanism can all contribute to the healthy and stable development of the food supply chain.
- The strategies of game participants influence and restrict each other. According to the results of the research, it can be concluded that the higher the probability that the food manufacturer chooses the “inspect” strategy, the food raw material supplier will be more inclined to choose the “provide high-quality food raw materials” strategy; the higher the willingness of consumers to complain, the stronger the restraint on the misconduct of the food raw material supplier and the food manufacturer. This indicates that the government has many ways to intervene in the operation of the food supply chain. It shouldn’t only directly intervene in food raw material suppliers by the amount of the fine and the frequency of supervision, but also indirectly intervene by guiding food manufacturers and consumers, thereby improving the safety of food quality.
- The strategy sets {1,1,1} and {1,0,1} (i.e., {provide high-quality food raw materials, inspect, not complain} and {provide high-quality food raw materials, not inspect, not complain}) are two kinds of optimal strategy combinations of three game participants, but the strategy set {1,1,1} is the better one. After optimizing the value of each influencing factor, only two results of the final evolutionary equilibrium point remained, i.e., (1,1,1) and (1,0,1). Through the results of the numerical simulation experiments, it can be concluded that the food raw material supplier will be more inclined to select the “provide high-quality food raw materials” strategy when the food manufacturer chooses the “inspect” strategy. If the food manufacturer is in a state of relaxation for a long time, it may spur the food raw material supplier to engage in misconduct again. Therefore, the strategy combination {1,1,1} of the three game participants is the ideal equilibrium we pursue.
7.2. Suggestions
In order to ensure the safety of food quality, each link of the food supply chain needs to be strictly controlled and cannot be ignored. This requires the joint efforts of the government, enterprises, and consumers. This paper puts forward four suggestions for enterprises, consumers, and the government based on the research results.
- Node enterprises in the food supply chain should cooperate in good faith and enhance their sense of social responsibility. In the complex market environment, enterprises can be more competitive in the fierce market competition only when they jointly build a stable supply chain system. This requires enterprises to treat each other sincerely instead of deceiving each other for their own sake. Food raw material suppliers should provide high-quality raw materials, and food manufacturers should strictly control the food quality, so that the supply chain system can better meet the market demand and enterprises themselves can achieve long-term and stable profits.
- Food production enterprises should seek to improve their inspection capabilities, and they should strive to carry out technological transformations to achieve the goal of reducing costs. For the food manufacturer, if their inspection ability is not excellent enough, it is easy to make the food that doesn’t meet the safety standards flow into the market. The quality of food is directly related to people’s health, and it is extremely important to carry out strict inspections at all stages of food production. When hiring inspection personnel, enterprises should strictly select professionals and carefully evaluate their inspection capabilities. At the same time, they should repair and maintain inspection equipment in time and strive to develop more efficient inspection technologies to improve their inspection ability.
- Consumers should consciously fulfill their feedback obligations, enhance their awareness of rights protection, and become the right-hand men assisting the government in supervising the illegal behavior of enterprises. With limited resources of government supervision departments, there will inevitably be omissions in the supervision work. Consumers are the recipients of the products at the end of the supply chain and critics of product quality. If all consumers can actively report to the government when they buy inferior products, they will not only safeguard their rights and interests but also help the government supervision department to investigate and punish the illegal behaviors of enterprises in time. Therefore, we recommend consumers actively provide feedback product quality information to relevant departments and bravely defend their rights when food safety incidents happen.
- Government regulatory departments should strive to improve the regulatory mechanism, strengthen legal binding, carry out educational activities on food safety topics for enterprises and consumers, and build an official online platform for consumers to report anonymously. The government should increase the frequency of unannounced inspections on enterprises and increase punishment intensity for some illegal traders. In addition, the government can carry out food safety educational activities for enterprises and consumers through the government’s official website, Weibo, WeChat, and other online media platforms, which can not only encourage food enterprises to increase their awareness of producing high-quality food but also make consumers raise their awareness of rights protection. The government can also build an official online platform for consumers to report anonymously. Consumers can directly upload photos of evidence to the platform, which can significantly save time and transportation costs for complaints.
This research constructed a tripartite evolutionary game model that can reflect the interaction of interests among the food raw material supplier, the food manufacturer, and consumers in the food supply chain. It also considered the influence of the government’s regulatory role on the behavior of the three subjects. This paper conducted a comprehensive influence analysis of various factors through numerical simulation experiments and put forward relevant management recommendations for government. However, this research doesn’t consider the case of the changes in the enterprises’ revenue. Thus, changes in the revenue of enterprises may be our future research direction.
Author Contributions
Methodology, X.P. and F.W.; software, J.W.; investigation, X.P. and C.Q.; writing—original draft preparation, X.P.; writing—review and editing, J.W. All authors have read and agreed to the published version of the manuscript.
Funding
This research was funded by National Social Science Fund of China (grant No.: 21BGL174).
Institutional Review Board Statement
Since the study is conducted through questionnaires and doesn’t involve ethical issues, the ethic approval is not necessary, approved by the Ethics Committee of College of Engineering, Northeast Agricultural University.
Informed Consent Statement
Informed consent was obtained from all participants involved in the study.
Data Availability Statement
Not applicable.
Acknowledgments
We thank the National Social Science Fund of China (Grant No.: 21BGL174) for supporting this study. We are grateful to four anonymous reviewers for critical reviews that helped to improve the manuscript.
Conflicts of Interest
The authors declare no conflict of interest.
References
- Devadoss, S.; Holland, D.W.; Stodick, L.; Ghosh, J. A general equilibrium analysis of foreign and domestic demand shocks arising from mad cow disease in the United States. J. Agric. Resour. Econ. 2006, 31, 441–453. [Google Scholar]
- Calvin, L. Outbreak linked to spinach forces reassessment of food safety practices. Amber Waves 2007, 5, 24–31. [Google Scholar]
- Yang, J.L.; Shan, H.Y. The willingness of submitting waste cooking oil (WCO) to biofuel companies in China: An evolutionary analysis in catering networks. J. Clean. Prod. 2021, 282, 125331. [Google Scholar] [CrossRef]
- Lachenmeier, D.W.; Humpfer, E.; Fang, F.; Schutz, B.; Dvortsak, P.; Sproll, C.; Spraul, M. NMR-spectroscopy for nontargeted screening and simultaneous quantification of health-relevant compounds in foods: The example of melamine. J. Agric. Food Chem. 2009, 57, 7194–7199. [Google Scholar] [CrossRef] [Green Version]
- Yang, R.J.; Huang, W.; Zhang, L.S.; Thomas, M.; Pei, X.F. Milk adulteration with melamine in China: Crisis and response. Qual. Assur. Saf. Crop. Foods 2009, 1, 111–116. [Google Scholar] [CrossRef]
- Ministry of Public Security. Uncovering the Truth of Waste Cooking Oil Returning Back to the Table. Available online: http://www.gov.cn/gzdt/2011-09/13/content_1946112.htm (accessed on 28 June 2022).
- Govindan, K.; Kadzinski, M.; Sivakumar, R. Application of a novel PROMETHEE-based method for construction of a group compromise ranking to prioritization of green suppliers in food supply chain. Omega-Int. J. Manage. Sci. 2017, 71, 129–145. [Google Scholar] [CrossRef]
- Song, C.; Zhuang, J. Modeling a government-manufacturer-farmer game for food supply chain risk management. Food Control 2017, 78, 443–455. [Google Scholar] [CrossRef] [Green Version]
- Granja, C.R.; Wollni, M. Opportunistic behaviour and trust: Experimental results from broccoli farmers in ecuador. J. Agric. Econ. 2019, 70, 62–80. [Google Scholar] [CrossRef] [Green Version]
- Yue, L.Q.; Liu, Y.M. Research into the quality of agricultural products in “Company + Farmer” mode based on signaling game model. Oper. Res. Manag. Sci. 2015, 24, 263–269. [Google Scholar]
- Jiang, Q.J. The analysis of the management of corporate social responsibility in food supply chain. J. Shanghai Ocean. Univ. 2012, 21, 1087–1092. [Google Scholar]
- Beske, P.; Land, A.; Seuring, S. Sustainable supply chain management practices and dynamic capabilities in the food industry: A critical analysis of the literature. Int. J. Prod. Econ. 2014, 152, 131–143. [Google Scholar] [CrossRef]
- de Jonge, J.; van Trijp, H.; Renes, R.J.; Frewer, L. Understanding consumer confidence in the safety of food: Its two-dimensional structure and determinants. Risk Anal. 2007, 27, 729–740. [Google Scholar] [CrossRef] [PubMed]
- Grunert, K.G. Food quality and safety: Consumer perception and demand. Eur. Rev. Agric. Econ. 2005, 32, 369–391. [Google Scholar] [CrossRef]
- Mangla, S.K.; Luthra, S.; Rich, N.; Kumar, D.; Rana, N.P.; Dwivedi, Y.K. Enablers to implement sustainable initiatives in agri-food supply chains. Int. J. Prod. Econ. 2018, 203, 379–393. [Google Scholar] [CrossRef] [Green Version]
- Xing, X.H.; Hu, Z.H.; Wang, S.W.; Luo, W.P. An evolutionary game model to study manufacturers and logistics companies’ behavior strategies for information transparency in cold chains. Math. Probl. Eng. 2020, 2020, 7989386. [Google Scholar] [CrossRef] [Green Version]
- Abd, M.A.; Al Rubeaai, S.F.; Salimpour, S.; Azab, A. Evolutionary game theoretical approach for equilibrium of cross-border traffic. Transp. B-Transp. Dyn. 2019, 7, 1611–1626. [Google Scholar] [CrossRef]
- Boctor, L. Active-learning strategies: The use of a game to reinforce learning in nursing education. A case study. Nurse Educ. Pract. 2013, 13, 96–100. [Google Scholar] [CrossRef]
- Jiang, K.; Merrill, R.; You, D.; Pan, P.; Li, Z. Optimal control for transboundary pollution under ecological compensation: A stochastic differential game approach. J. Clean Prod. 2019, 241, 118391. [Google Scholar] [CrossRef]
- Reluga, T.C.; Smith, R.A.; Hughes, D.P. Dynamic and game theory of infectious disease stigmas. J. Theor. Biol. 2019, 476, 95–107. [Google Scholar] [CrossRef]
- Shi, Q.; Zhu, J.; Li, Q. Cooperative evolutionary game and applications in construction supplier tendency. Complexity 2018, 2018, 8401813. [Google Scholar] [CrossRef]
- Li, K.Q.; Chen, Y.; Liu, J.C.; Zhang, L.; Mu, X.W. Online food delivery platforms and restaurants’ interactions in the context of the ban on using single-use plastics. IEEE Access 2021, 9, 96210–96220. [Google Scholar] [CrossRef]
- Zhu, Y.; Chu, M.; Wen, X.W.; Wang, Y.Q. Food safety risk communication between the food regulator and consumer in China: An evolutionary game perspective. Complexity 2021, 2021, 9933796. [Google Scholar] [CrossRef]
- Liu, P.; Wang, S. Evolutionary game analysis of cold chain logistics outsourcing of fresh food enterprises with operating risks. IEEE Access 2020, 8, 127094–127103. [Google Scholar] [CrossRef]
- Yang, S.; Zhuang, J.C.; Wang, A.F.; Zhang, Y.C. Evolutionary game analysis of Chinese food quality considering effort levels. Complexity 2020, 2020, 4549629. [Google Scholar] [CrossRef]
- Chen, T.Q.; Zhang, J.; Luo, J. Differential game evolution of food quality safety based on market supply and demand. Food Sci. Nutr. 2021, 9, 2414–2435. [Google Scholar] [CrossRef]
- Wang, J.; Yao, S.; Lu, X.M.; Li, Y. Organic food labeling and advertising: A tripartite game model between one supplier and two heterogeneous manufacturers. Complexity 2019, 2019, 3143416. [Google Scholar] [CrossRef]
- Wang, J.L.; Peng, X.; Du, Y.N.; Wang, F.L. A tripartite evolutionary game research on information sharing of the subjects of agricultural product supply chain with a farmer cooperative as the core enterprise. Manag. Decis. Econ. 2021, 43, 159–177. [Google Scholar] [CrossRef]
- Tang, L.N.; Yang, T.O.; Tu, Y.L.; Ma, Y.Z. Supply chain information sharing under consideration of bullwhip effect and system robustness. Flex. Serv. Manuf. J. 2021, 33, 337–380. [Google Scholar] [CrossRef]
- Friedman, D. Evolutionary game in economics. Econometrica 1991, 59, 637–666. [Google Scholar] [CrossRef] [Green Version]
- Liu, L.X.; Zhu, Y.C.; Guo, S.B. The evolutionary game analysis of multiple stakeholders in the low-carbon agricultural innovation diffusion. Complexity 2020, 2020, 6309545. [Google Scholar] [CrossRef]
- Lu, Z.; Huang, P.; Liu, Z. Predictive approach for sensorless bimanual teleoperation under random time delays with adaptive fuzzy control. IEEE Trans. Ind. Electron. 2018, 65, 2439–2448. [Google Scholar] [CrossRef]
- Zhao, D.; Hao, J.; Cao, C.; Han, H. Evolutionary game analysis of three-player for low-carbon production capacity sharing. Sustainability 2019, 11, 2996. [Google Scholar] [CrossRef] [Green Version]
- Zhao, D.; Hao, J.; Yang, J.; Han, H. Evolutionary game analysis of three parties in sharing economy considering network externality of platform. J. Control Decis. 2020, 35, 1741–1750. [Google Scholar]
- Leeks Worth 2CNY Need to Cost 5000CNY for Testing. Available online: https://www.antpedia.com/news/41/n-221641.html (accessed on 28 June 2022).
- CCTV 315 Program Exposed: Guangqi Trading Company Sells Expired Food Raw Materials in Hangzhou. Available online: https://www.tech-food.com/news/detail/n1081914.htm (accessed on 28 June 2022).
- Ministry of Commerce of the People’s Republic of China. Available online: https://cif.mofcom.gov.cn/cif/html/dataCenter/index.html?jgnfcprd (accessed on 28 June 2022).
- Analysis of Market Supply and Demand and Price Trend of China’s Flour Industry in 2020. Available online: https://www.chyxx.com/industry/202103/941279.html (accessed on 28 June 2022).
Publisher’s Note: MDPI stays neutral with regard to jurisdictional claims in published maps and institutional affiliations. |
© 2022 by the authors. Licensee MDPI, Basel, Switzerland. This article is an open access article distributed under the terms and conditions of the Creative Commons Attribution (CC BY) license (https://creativecommons.org/licenses/by/4.0/).