Abstract
Optimizing the flow field of solid oxide electrolysis cells (SOECs) has a significant effect on improving performance. In this study, the effect of metal foam in high temperature SOEC electrolysis steam is investigated by a three-dimensional model. The simulation results show that the SOEC performance is improved by using metal foam as a gas flow field. The steam conversion rate of the SOEC increases from 72.21% to 76.18% and the diffusion flux of steam increases from 2.3 × 10⁻⁴ kg/(m2∙s) to 2.5 × 10⁻⁴ kg/(m2∙s) at 10,000 A/m2. In addition, the permeability, temperature, steam mole fraction, and gas utilization are investigated to understand the effect of the improved performance of the SOEC with metal foam. The results of this study provide a baseline for the optimal design of SOECs with metal foam.
1. Introduction
The concerns regarding dramatic climate change, population growth, industrial pollution, and energy independence have stimulated the development of renewable energy resources [1,2,3]. However, renewable energy has the characteristics of intermittency and volatility [4]. Converting renewable energy electricity into hydrogen has the advantages of a large storage capacity, a high power density, a long duration, and a good development prospect [5,6,7]. Using renewable energy for electrolyzing water to produce hydrogen can achieve zero carbon dioxide emissions, which is ideal hydrogen production technology [5,8]. Ekhtiari et al. [9] and Hafsi et al. [10] utilized natural gas network pipelines for hydrogen storage and transportation solutions. Recently, there are four main technologies: alkaline electrolysis cell (AEC), proton exchange membrane electrolysis cell (PEMEC), alkaline anion exchange membranes electrolysis cell (AEMEC) and solid oxide electrolysis cell (SOEC), for hydrogen production by electrolysis of steam [11]. Although AEC technology is the most mature, it can have low efficiency, strong corrosiveness and potential safety hazards [12]. PEMEC can adapt to a fluctuating power supply while the overall hydrogen production efficiency is still low. Moreover, precious metal catalysts are required and the equipment cost is high [13,14]. In contrast, SOECs can produce hydrogen at a high temperature of 600–1000 °C with a lower power demand and higher chemical reaction rate, which can effectively reduce power consumption and improve conversion efficiency [15,16].
Due to the structural characteristics and material of SOECs, their performance SOEC is limited by gas diffusion [17,18,19]. A large number of studies have shown that metal foam materials can be used as alternative materials for flow field, because metal foam materials have the advantages of high electrical conductivity, high thermal conductivity, high porosity, low cost and low permeability [20]. Meanwhile, many experiments and simulations have verified the obvious effects of metal foam, i.e., its reducing of diffusion resistance and enhancing of gas transport [21,22,23,24,25,26,27,28]. However, there are few numerical simulation studies on SOEC with metal foam which show that they have great potential in term of improving gas diffusion and the electrochemical reaction rate.
The energy of an SOEC can be derived from renewable energy sources. For example, Chen et al. [29] proposed a novel solar hydrogen production system. The sCO2 Brayton cycle provided electrical energy for an SOEC, and the ammonia-based thermochemical energy storage system provided thermal energy (high temperature steam) for SOEC. Sigurvinsson et al. [30] established a technical and economic optimization model. This included an SOEC electrolytic cell and high temperature heat exchanger network, which helped with investigateions into the feasibility of coupling geothermal energy with SOEC electrolysis. The study found that even with geothermal temperatures as low as 230 °C, it is still economically competitive compared to alkaline electrolysis. Harvego et al. [31] proposed a reference design scheme for a commercial-scale high temperature electrolysis hydrogen production plant, in which the electrolytic cell is driven by the high-temperature helium-cooled reactor coupled with the Brayton cycle. Through economic analysis, it is found that the high temperature electrolysis hydrogen production driven by the high-temperature helium-cooled gas-cooled reactor, would be competitive in term of cost. Zhang et al. [32] investigated the cost of high temperature steam electrolysis (HTSE) from greenhouse gas emissions to hydrogen production using a life cycle assessment approach. The results showed HTSE greenhouse gas emissions from 3 to 20 kg CO2e/kg H2 and costs from $2.5 to 5/kg H2 over the life cycle. It is estimated that this figure could drop to $50/tonne CO2e with future technological advancements.
The schematic diagram of a three-dimensional SOEC model established in this study is shown in Figure 1. As shown in Figure 1a, the gas flow field is the SOEC without metal foam. Moreover, the gas flow field (the SOEC with metal foam) is shown in Figure 1b. The purpose of this study was to fully understand SOECs with metal foam in terms of the performance of electrolysis steam. The effects of permeability, temperature, steam mole fraction, and gas utilization on the performance of an SOEC were studied.
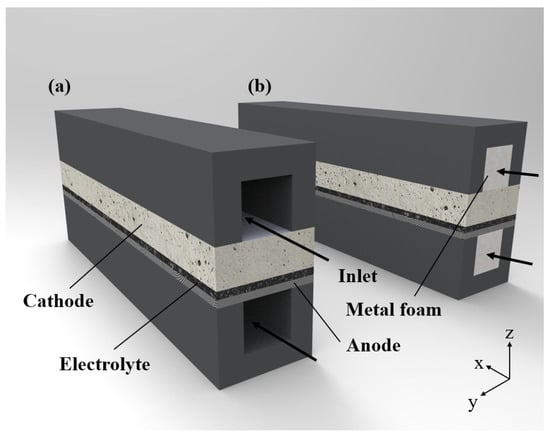
Figure 1.
Schematic of the SOEC: (a) without metal foam, (b) with metal foam.
2. Modeling Description
2.1. Physical Model and Assumptions
The schematic of an SOEC is shown in Figure 2. In the middle of the SOEC is a dense electrolyte layer that separates the gases on both sides and transports oxygen ions. There are porous cathodes and anodes on both sides of the electrolytic cell and the porous structure is conducive to the diffusion and transmission of gases. On the cathode side, steam molecules are transported from the flow channel to the cathode-electrolyte interface (the three-phase boundary (TPB) [33,34,35]). Water molecules split into hydrogen ions and oxygen ions at the cathode-electrolyte interface. Two hydrogen ions gain electrons to form a hydrogen molecule. Hydrogen molecules are transported from the porous cathode to the cathode flow channel. The oxygen ions are transported to the anode side through the electrolyte. On the anode side, oxygen ions lose electrons and become oxygen molecules. The generated oxygen molecules are transported from the anode-electrolyte interface to the anode flow channel. The generated electrons are transported from the anode side to the cathode side through the external circuit.
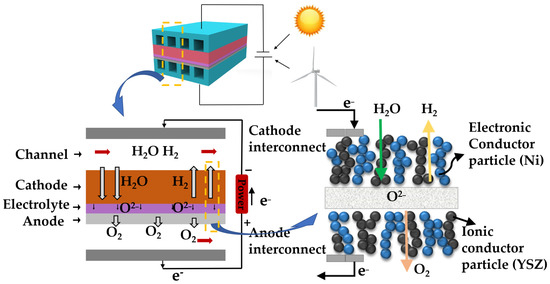
Figure 2.
Schematic diagram of hydrogen production from steam electrolysis by the SOEC.
At the cathode-electrolyte interface:
At the anode-electrolyte interface:
The overall reaction of SOEC electrolysis steam can be expressed as:
In the study, there are a few main assumptions, listed as follows:
- All the gases involved in the reaction are ideal gases.
- The SOEC is operating in a steady state.
- The SOEC is operating under isothermal condition.
- The permeability of the gas species and electrons in the electrolyte are neglected.
2.2. Governing Equations
2.2.1. Mass Conservation Equation
The equation of mass conservation is as follows:
where is the density of the gas mixture, u (m/s) is the velocity, Sm,i (kg/(m3∙s)) is the mass source term and ε is the porosity of the porous electrode.
where F (C/mol) is Faraday’s constant, M (kg/mol) is the mole mass of the components, and j (A/m2) is the current density.
2.2.2. Momentum Conservation Equation
The equation of momentum conservation is as follows:
where μ (kg/(m∙s)) is the dynamic viscosity of the mixed gas, P (Pa) is the pressure and Su (kg/(m2∙s2)) is the momentum source term.
where K (m2) is the porous electrode permeability. The Carman-Kozeny correlation determines the flow permeability as [36]:
where dp is the diameter of the electronic particles.
2.2.3. Species Conservation Equation
The equation of species conservation is as follows:
where Yi is the mass fraction of component i, Di (m2/s) is the effective diffusion coefficient and Si is the component i mass source term.
In the channel, the binary molecular diffusion coefficient is used to simulate gas diffusion [37].
where Mi (g/mol) is the relative molecular mass of component i and vi (cm−3 mol−1) is the diffusion volume of the component. The effective diffusion coefficient in the channel is expressed as:
In the porous electrode, Knudsen diffusion and binary molecular diffusion should be considered, because of the effects of porosity and tortuosity on gas diffusion. The Knudsen diffusion coefficient is expressed as [36]:
where T (K) is the temperature and τ is the tortuosity. Considering both Knudsen diffusion and binary molecular diffusion, the effective diffusion coefficient in the porous electrode is formally expressed as [37]:
2.2.4. Charge Conservation Equation
The equation of charge conservation is as follows:
where and (J/mol) are the effective ionic and electronic conductivities, respectively. Sel and Sio (A/m3) are the source terms of electronic and ionic potentials, respectively.
where ja and jc (A/m2) are the current density, respectively. STPB (m2/m3) is TPB’s active area per unit volume. The parameter STPB can be expressed as a particle coordination number and percolation theory in the binary random packing of spheres [38]:
where θ is the contact angle between the electronic and ionic conductors; re (mm) is the radius of the electronic conductors; nt is the total number of particles per unit volume; ne and ni (ni = 1 − ne) are the number fractions of electronic and ionic conductors, respectively; Ze and Zi are average coordination numbers of electronic/ionic conductors and finally Pe and Pi are the probability of the electronic/ionic particles connecting to the porous media.
The parameters of nt and ne are computed as [39]:
and
where ε is the porosity of the electrode, ri (mm) is the radius of the ionic conductors and Φ is the volumetric fraction of electronic conductors in the porous electrode.
The parameters Ze and Zi can be determined as:
and
The parameters Pe and Pi are calculated as:
and
where Ze−e and Zi−i are the average coordination numbers of electronic/ionic particles to electronic/ionic particles. The parameters Ze−e and Zi−i are defined as:
and
2.3. Electrochemical Reaction Model
During the operation, SOEC voltage can be expressed by the following expression:
where E (V) is the equilibrium voltage; ηconc,c and ηconc,a are the concentration overpotentials at the cathode and anode, respectively; ηact,,a and ηact,c are the activation overpotentials at the anode and cathode, respectively and finally ηohm is the ohmic overpotential.
The equilibrium voltage E is determined by the Nernst equation:
where R (J/(mol∙K)) is the universal gas constant, F (C/mol) is the Faraday constant, , and are the partial pressures of steam, hydrogen, and oxygen on the electrode—electrolyte surfaces, respectively, and finally E0 is the standard Nernst potential.
The concentration overpotential is expressed as:
where P0 and PI are the partial pressures at the electrode surface and electrode—electrolyte interface, respectively, and subscripts H2O, H2, and O2 represent the steam reactant, hydrogen, and oxygen products, respectively.
The relationship between the activation overpotential and the current density is expressed by the Butler—Volmer equation [40]:
where J0,a (A/m3) and J0,c are the exchange current densities at the anode and cathode, respectively, ηact is the activation overpotential and α is the charge transfer coefficient. The activation overpotential is calculated as:
The parameter J0,i is calculated as:
where γi (A/m2) is the pre-exponential factors and Eact,i (J/mol) is the activation energy.
The ohmic overpotential is calculated as [41]:
where L (mm) is the thickness of the electrolyte.
2.4. Boundary Conditions
The boundary settings of the conservation equation are shown in Table 1.

Table 1.
Boundary conditions or settings for the SOEC model.
The cathode inlet mass flow is given as [42]:
where xi(i = H20, H2) is the mole fraction, Aact (m2) is the effective reaction area of the cathode layer, δc (mm) is the thickness of the cathode layer, and uf is the gas utilization.
3. Model Validation
In this section, the governing equations of the SOEC given in the previous section were used to simulate the experimental results of Momma et al. [43]. The model was verified by the commercial software COMSOL Multiphysics. In their experiments, the accuracy of the modeling results was closely related to the characteristic parameters of the microstructure. The specific parameters of the model in this study are shown in Table 2, Table 3 and Table 4. As shown in Figure 3, the simulated results of the model were basically consistent with the reference data at different temperatures.
Table 2.
Parameters used in the SOSE electrochemistry modeling analysis.
Table 3.
Microstructural and geometrical parameters.
Table 4.
Material parameters of the SOEC [42,48].
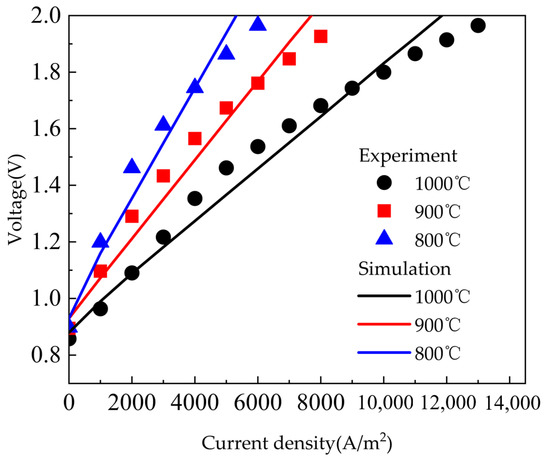
Figure 3.
Comparison between simulation results and reference data [44] at different temperatures.
4. Results and Discussion
4.1. Effect of Permeability
The permeability of metal foam can affect the performance of the SOEC. Permeability is related to the porosity, tortuosity, and pore size of metal foam. In this section, four kinds of metal foams with the a permeability of 1 × 10⁻⁷ m2, 1 × 10⁻⁸ m2, 1 × 10⁻⁹ m2, and 1 × 10⁻¹⁰ m2 were selected for analysis. The steam conversion rate, voltage, the steam diffusion flux, and pressure drop curve at different permeabilities are shown in Figure 4a–d. We can see that the metal foam improved the performance of the SOEC without metal foam. The steam conversion rate of the SOEC increased from 72.21% to 76.18%, while the diffusion flux of the steam increased from 2.3 × 10⁻⁴ kg/(m2∙s) to 2.5 × 10⁻⁴ kg/(m2∙s) at 10,000 A/m2. It can be said that with the decrease of permeability, the steam conversion rate increases, and the voltage required by the electrolytic cell increased gradually. Zhan et al. [49] also obtained similar results using metal foam as a cathode flow distributor in an SOFC. It can be said that a higher output voltage was always accompanied with a larger pressure drop. The voltage drop generated in the channel also increased with the decrease of permeability. The steam diffusion flux increased and then decreased with the decrease of permeability decreasing. At 15,000 A/m2, the voltage increased from 2.4358 V to 2.4401 V and the steam conversion rate increased from 76.95% to 79.26% as the permeability decreased from 1 × 10⁻⁷ m2 to 1 × 10⁻⁹ m2. However, the voltage drop increased significantly from 8.28 Pa to 1772.49 Pa and the diffusion flux of steam decreased from 7.96 × 10⁻⁴ kg/(m2∙s) to 7.57 × 10⁻⁴ kg/(m2∙s). Due to the decrease in permeability, the tortuosity inside the foam became larger, which increases the gas flow resistance. As a result, the pressure drop becomes larger, which led to a decrease in the steam diffusion flux. Therefore, selecting the appropriate metal foam permeability could effectively improve SOEC performance. Tseng et al. [50] studied the effects of different metal foams on PEM fuel cells. Their results indicated that the conductivity of metal foam was an important factor in fuel cell performance. As shown in Figure 4b, with the metal foam introduced into the flow channel in this paper, the voltage of the SOEC with metal foam was larger than the SOEC without metal foam. Since the metal foam could transmit gas and is also a conductive medium, the transmission area of conductive electrons was increased. Electrons can be transported vertically to the porous electrode through the shortest path, which not only shortens the electron transport path, but also makes the electron distribution more uniform, thus reducing the cell activation overpotential, increasing the conductivity, and increasing the voltage.
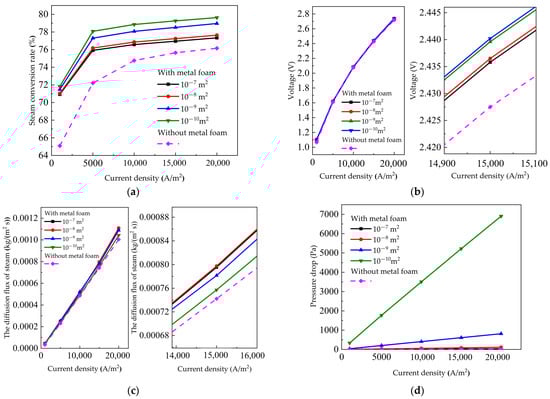
Figure 4.
Influence of metal foam permeability: (a) steam conversion rate curve; (b) voltage curve; (c) the diffusion flux of steam curve; (d) pressure drop curve.
4.2. Effect of Temperature
In this section, the operating temperature of 800/900/1000 °C was selected for analysis. Figure 5a–c show the variation trend of the steam conversion rate, cathode activation overpotential, and the diffusion flux of steam in the different gas flow channels. The steam conversion rate, the cathode activation overpotential voltage and the diffusion flux of steam decreased as the temperature increased. These three figures reveal that the performance of the SOEC with metal foam was better than without metal foam. When the temperature reached 1000 °C and the current density reached 10,000 A/m2, the steam conversion rate increased from 74.76 to 76.86%. The diffusion flux of H2O increased from 4.86 × 10⁻⁴ kg/(m2∙s) to 5.13 × 10⁻⁴ kg/(m2∙s), and the cathode activation overpotential voltage decreased from 0.088764 V to 0.088758 V. Because metal foam occupied the SOEC without metal foam flow channel, the longitudinal mass transfer performance of the SOEC was increased. Kumar and Reddy [51] found that the tortuous pathway in the metal foam porous structure significantly improved the gas flow uniformity and convection normal to the electrode surface. According to Meng et al. [46], the effects of operating temperatures on SOEC overpotential was similar to the trend shown in this paper. As the temperature increased, the overpotential, shown in Figure 5b, decreased. The decrease of temperature caused both the exchange current density and the ionic conductivity to decrease, which resulted in the activation overpotential increasing.
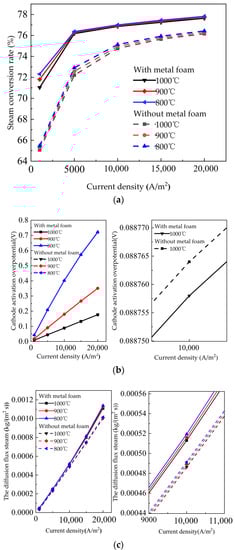
Figure 5.
Influence of temperature on the SOEC with metal foam and the SOEC without metal foam (a) steam conversion rate curve; (b) the cathode activation overpotential voltage; (c) the diffusion flux of steam.
4.3. Effect of Steam Mole Fraction
When the temperature and permeability were constant, the gas composition had an effect on the performance of the SOEC. In this section, the operating temperature was kept at 1000 °C and permeability at 10−8 m2. The steam to hydrogen molar ratios of 50%/50%, 60%/40% and 70%/30% were selected for analysis. The influence curves of SOEC with metal foam and SOEC without metal foam on steam conversion rate under different inlet steam mole fractions are shown in Figure 6a, the voltage curve is shown in Figure 6b, the cathode activation overpotential is shown in Figure 6c, and the steam diffusion flux curve is shown in Figure 6d. As shown in the four figures, the steam conversion rate of the SOEC with metal foam is significantly higher than that of the SOEC without metal foam. When the mole fraction of steam to hydrogen mole ratio is 50%/50% and the current density is 10,000 A/m2, the steam conversion rate increases from 77.52% to 79.77%. Additionally, the diffusion flux of H2O increases from 5.68 × 10⁻⁴ kg/(m2∙s) to 6.01 × 10⁻⁴ kg/(m2∙s). The cathode activation overpotential decreased from 0.088744 V to 0.088729 V, indicating that the metal foam contributed to gas diffusion. As shown in Figure 6b, the cell voltage decreases with the vapor mole fraction increasing, which can be explained by the Nernst equation (Equation (29)). Figure 6c,d show metal foam increase the diffusion rate and decrease the overpotential. Metal foam reduces the gas transport resistance and increases steam conversion. Meng et al. [44] studied the effect of steam mole fraction on SOEC J-V characteristics. The voltage also decreases with steam mole fraction increasing.
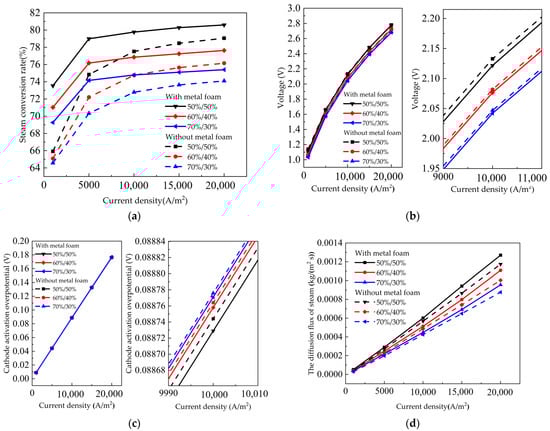
Figure 6.
Influence of steam mole fraction on the SOEC with metal foam and without metal foam (a) steam conversion rate curve; (b)voltage curve; (c) cathode activation overpotential; (d) the diffusion flux of steam.
4.4. Effect of Gas Utilization
Besides permeability, temperature, and steam mole fraction, gas utilization had a significant effect on the SOEC’s dynamic behavior. To prevent a shortage of reaction gas for the SOEC, the reaction gas provided was more than the gas needed for the SOEC. In this section, the operating temperature as kept at 1000 °C, the permeability was kept at 10−8 m2 and the steam molar fraction was kept at 0.6. The gas utilization of 0.5/0.6/0.7/0.8 was selected for analysis.
Figure 7a shows the influence of the SOEC with metal foam and without metal foam on the steam conversion rate under different gas utilization. The gas utilization had a great effect on the water conversion rate. The conversion rate of steam varied greatly with different gas utilization. Du et al. [42] studied the co-electrolysis of water and carbon dioxide in solid oxide electrolysis cells. As the gas utilization rate decreased, the voltage decreasesd and the electrolysis efficiency increased. As shown in Figure 7a, the gas utilization is increased from 0.5 to 0.8, and the steam conversion rate increased by more than 30%. This sharp change was expected because the steam conversion rate was strongly dependent on the inlet fuel flow. Nevertheless, the figure indicated that the SOEC with metal foam steam conversion rate was better than SOEC without metal foam. Figure 7b,c show the cathode activation overpotential and steam diffusion flux curve, respectively. The steam conversion rate increased from 86.39% to 88.6% when the gas utilization was 0.8 and the current density was 15,000 A/m2. The steam diffusion flux increases from 8.58 × 10⁻⁴ kg/(m2∙s) to 9.26 × 10⁻⁴ kg/(m2∙s). The cathode activation overpotential decreases from 0.13276 V to 0.13038 V. This was mainly due to the increase in the concentration of reactants at the TPB reaction interface as the gas utilization rate decreased, thus reducing the activation overpotential voltage.
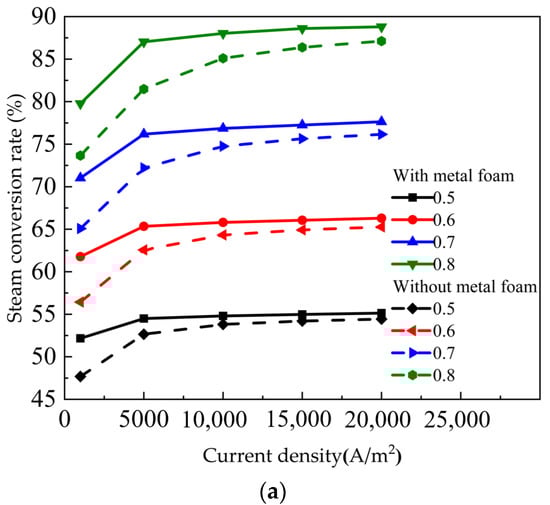
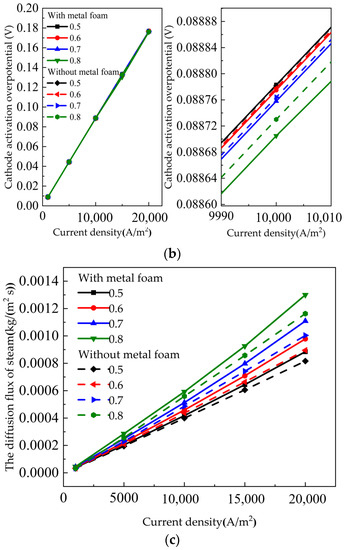
Figure 7.
Influence of gas utilization on the SOEC with metal foam and without metal foam: (a) steam conversion rate curve; (b) cathode activation overpotential; (c) the diffusion flux of steam.
5. Conclusions
In this study, the effect of metal foam used in high temperature SOECs, have been investigated in a three-dimensional model. Conservation equations for mass, momentum, matter and charge were used in this model. Through the analysis and discussion of the simulation results, it was found that metal foam could effectively improve SOEC performance. The steam conversion rate of the SOEC increased from 72.21% to 76.18% and the diffusion flux of steam increased from 2.3 × 10⁻⁴ kg/(m2∙s) to 2.5 × 10⁻⁴ kg/(m2∙s) at 10,000 A/m2. The SOEC with metal foam could have improved conductivity and promoted the gas diffusion from the channel to the porous electrode layer, which would have helped to reduce diffusion resistance and to enhance gas transport.
Furthermore, the effects of permeability, temperature, steam mole fraction and gas utilization on the SOEC performance were studied. The results show that the performance of the SOEC with metal foam was better than the SOEC without metal foam in terms of the steam conversion rate, cathode activation overpotential and diffusion flux of steam. For example, higher permeability metal foam performed better, but with a greater pressure drop. Therefore, selecting the appropriate metal foam permeability was beneficial to the improvement of SOEC performance. The results of this paper provide a baseline for the optimal design of SOECs with metal foam.
Author Contributions
Software, formal analysis, writing-original draft, J.Z.; methodology, writing- original draft, Z.L.; conceptualization, methodology, software, M.Z. All authors have read and agreed to the published version of the manuscript.
Funding
This research was funded by the National Natural Science Foundation of China, grant number No. 11602219. The authors gratefully acknowledge the support.
Institutional Review Board Statement
Not applicable.
Informed Consent Statement
Not applicable.
Data Availability Statement
All data are included in the paper or could be openly obtained.
Conflicts of Interest
The authors declare no conflict of interest.
Nomenclature
| Aact | Effective reaction area of the cathode layer, m2 |
| Di | Effective diffusion coefficient, m2/s |
| dp | Diameter of the electronic particles, mm |
| E | Equilibrium voltage, V |
| E0 | Standard Nernst potential, V |
| Eact | Activation energy, J/mol |
| F | Faraday’s constant, 96485 C/mol |
| ΔG | Gibbs free energy change, J/mol |
| J0,a | Exchange current density at anode, A/m3 |
| j | Current density, A/m2 |
| J0,c | Exchange current density at cathode, A/m3 |
| K | Porous electrode permeability, m2 |
| L | Thickness of the electrolyte, mm |
| M | Mole mass of the components, kg/mol |
| Mi | Relative molecular mass, g/mol |
| nt | Total number of particles per unit volume |
| ne | Number fractions of electronic conductors |
| ni | Number fractions of ionic conductors |
| P | Pressure, Pa |
| Pi | Probability of the ionic particles connecting to the porous media |
| Pe | Probability of the electronic particles connecting to the porous media |
| P0 | Partial pressures at the electrode surface interface, Pa |
| PI | partial pressures at the electrode-electrolyte interface, Pa |
| Partial pressures of steam on the electrode-electrolyte surfaces, Pa | |
| Partial pressures of hydrogen on the electrode-electrolyte surfaces, Pa | |
| Partial pressures of oxygen on the electrode-electrolyte surfaces, Pa | |
| R | Gas constant, 8.3145 J/(mol∙K) |
| ri | Radius of the ionic conductors, mm |
| re | Radius of the electronic conductors, mm |
| Sio | Source terms of ionic potential, A/m2 |
| Sel | Source terms of electronic potential, A/m2 |
| Si | Mass source term, kg/(m3∙s) |
| Su | Momentum source term, kg/(m2∙s2) |
| STPB | Three-phase boundary active area per unit volume, m2/m3 |
| Sm,i | Mass source term, kg/(m3∙s) |
| T | Temperature, K |
| u | Velocity, m/s |
| uf | Gas utilization |
| vi | Diffusion volume, cm−3∙mol−1 |
| xi | Mole fraction |
| Ze | Average coordination number of electronic conductors |
| Zi | Average coordination number of ionic conductors |
| Ze-e | Average coordination numbers of electronic particles to electronic particles |
| Zi-i | Average coordination numbers of ionic particles to ionic particles |
| Greek letters | |
| α | Charge transfer coefficient |
| ε | Porosity |
| ηconc,c | Concentration overpotentials at the cathode, V |
| ηconc,a | Concentration overpotentials at the anode, V |
| ηact,c | Activation overpotentials at the cathode, V |
| τ | Tortuosity |
| ρ | Density, kg/m3 |
| μ | Dynamic viscosity of the mixed gas, kg/(m∙s) |
| ϒi | Mass fraction |
| Φ | Volumetric fraction of electronic conductors in the porous electrode |
| δc | Thickness of the cathode layer, mm |
| Effective ionic conductivities, J/mol | |
| Effective electronic conductivities, J/mol | |
| θ | Contact angle between the electronic and ionic conductors, ° |
| γi | Pre-exponential factors, A/m2 |
| Subscripts | |
| a | Anode |
| act | Activation |
| c | Cathode |
| ca | Cathode |
| conc | Concentration |
| eff | Effective |
| el | Electronic |
| H2 | Hydrogen |
| H2O | Water |
| io | Ionic |
| i | Gas species |
| O2 | Oxygen |
| ohm | Ohmic |
References
- Usman, M.; Balsalobre-Lorente, D. Environmental concern in the era of industrialization: Can financial development, renewable energy and natural resources alleviate some load? Energy Policy 2022, 162, 112780. [Google Scholar] [CrossRef]
- Wu, D.; Yang, Y.; Shi, Y.; Xu, M.; Zou, W. Renewable energy resources, natural resources volatility and economic performance: Evidence from BRICS. Resour. Policy 2022, 76, 102621. [Google Scholar] [CrossRef]
- Danish; Baloch, M.A.; Mahmood, N.; Zhang, J.W. Effect of natural resources, renewable energy and economic development on CO2 emissions in BRICS countries. Sci. Total Environ. 2019, 678, 632–638. [Google Scholar] [CrossRef] [PubMed]
- Guo, S.; Liu, Q.; Sun, J.; Jin, H. A review on the utilization of hybrid renewable energy. Renew. Sustain. Energy Rev. 2018, 91, 1121–1147. [Google Scholar] [CrossRef]
- Hosseini, S.E.; Wahid, M.A. Hydrogen production from renewable and sustainable energy resources: Promising green energy carrier for clean development. Renew. Sustain. Energy Rev. 2016, 57, 850–866. [Google Scholar] [CrossRef]
- Song, H.; Liu, Y.; Bian, H.; Shen, M.; Lin, X. Energy, environment, and economic analyses on a novel hydrogen production method by electrified steam methane reforming with renewable energy accommodation. Energy Convers. Manag. 2022, 258, 115513. [Google Scholar] [CrossRef]
- Baykara, S.Z. Hydrogen: A brief overview on its sources, production and environmental impact. Int. J. Hydrogen Energy 2018, 43, 10605–10614. [Google Scholar] [CrossRef]
- Buttler, A.; Spliethoff, H. Current status of water electrolysis for energy storage, grid balancing and sector coupling via power-to-gas and power-to-liquids: A review. Renew. Sustain. Energy Rev. 2018, 82, 2440–2454. [Google Scholar] [CrossRef]
- Ekhtiari, A.; Flynn, D.; Syron, E. Investigation of the Multi-Point Injection of Green Hydrogen from Curtailed Renewable Power into a Gas Network. Energies 2020, 13, 6047. [Google Scholar] [CrossRef]
- Hafsi, Z.; Ekhtiari, A.; Ayed, L.; Elaoud, S. The linearization method for transient gas flows in pipeline systems revisited: Capabilities and limitations of the modelling approach. J. Nat. Gas Sci. Eng. 2022, 101, 104494. [Google Scholar] [CrossRef]
- Nnabuife, S.G.; Ugbeh-Johnson, J.; Okeke, N.E.; Ogbonnaya, C. Present and Projected Developments in Hydrogen Production: A Technological Review. Carbon Capture Sci. Technol. 2022, 3, 100042. [Google Scholar] [CrossRef]
- Sánchez, M.; Amores, E.; Abad, D.; Rodríguez, L.; Clemente-Jul, C. Aspen Plus model of an alkaline electrolysis system for hydrogen production. Int. J. Hydrogen Energy 2020, 45, 3916–3929. [Google Scholar] [CrossRef]
- Yang, G.; Yu, S.; Kang, Z.; Dohrmann, Y.; Bender, G.; Pivovar, B.S.; Green, J.; Retterer, S.T.; Cullen, D.A.; Zhang, F.-Y. A novel PEMEC with 3D printed non-conductive bipolar plate for low-cost hydrogen production from water electrolysis. Energy Convers. Manag. 2019, 182, 108–116. [Google Scholar] [CrossRef]
- Kumar, S.S.; Himabindu, V. Hydrogen production by PEM water electrolysis—A review. Mater. Sci. Energy Technol. 2019, 2, 442–454. [Google Scholar] [CrossRef]
- Chi, J.; Yu, H. Water electrolysis based on renewable energy for hydrogen production. Chin. J. Catal. 2018, 39, 390–394. [Google Scholar] [CrossRef]
- Laguna-Bercero, M.A. Recent advances in high temperature electrolysis using solid oxide fuel cells: A review. J. Power Sources 2012, 203, 4–16. [Google Scholar] [CrossRef] [Green Version]
- Li, W.; Shi, Y.; Luo, Y.; Cai, N. Theoretical modeling of air electrode operating in SOFC mode and SOEC mode: The effects of microstructure and thickness. Int. J. Hydrogen Energy 2014, 39, 13738–13750. [Google Scholar] [CrossRef]
- Xu, Z.; Zhang, X.; Li, G.; Xiao, G.; Wang, J.-Q. Comparative performance investigation of different gas flow configurations for a planar solid oxide electrolyzer cell. Int. J. Hydrogen Energy 2017, 42, 10785–10801. [Google Scholar] [CrossRef]
- Dong, D.; Xu, S.; Shao, X.; Hucker, L.; Marin, J.; Pham, T.; Xie, K.; Ye, Z.; Yang, P.; Yu, L.; et al. Hierarchically ordered porous Ni-based cathode-supported solid oxide electrolysis cells for stable CO2 electrolysis without safe gas. J. Mater. Chem. A 2017, 5, 24098–24102. [Google Scholar] [CrossRef]
- Yuan, W.; Tang, Y.; Yang, X.; Wan, Z. Porous metal materials for polymer electrolyte membrane fuel cells—A review. Appl. Energy 2012, 94, 309–329. [Google Scholar] [CrossRef]
- Park, J.E.; Lim, J.; Kim, S.; Choi, I.; Ahn, C.-Y.; Hwang, W.; Lim, M.S.; Cho, Y.-H.; Sung, Y.-E. Enhancement of mass transport in fuel cells using three-dimensional graphene foam as flow field. Electrochim. Acta 2018, 265, 488–496. [Google Scholar] [CrossRef]
- Tseng, C.-J.; Heush, Y.-J.; Chiang, C.-J.; Lee, Y.-H.; Lee, K.-R. Application of metal foams to high temperature PEM fuel cells. Int. J. Hydrogen Energy 2016, 41, 16196–16204. [Google Scholar] [CrossRef]
- Jo, A.; Ju, H. Numerical study on applicability of metal foam as flow distributor in polymer electrolyte fuel cells (PEFCs). Int. J. Hydrogen Energy 2018, 43, 14012–14026. [Google Scholar] [CrossRef]
- Kang, D.G.; Lee, D.K.; Choi, J.M.; Shin, D.K.; Kim, M.S. Study on the metal foam flow field with porosity gradient in the polymer electrolyte membrane fuel cell. Renew. Energy 2020, 156, 931–941. [Google Scholar] [CrossRef]
- Shin, D.K.; Yoo, J.H.; Kang, D.G.; Kim, M.S. Effect of cell size in metal foam inserted to the air channel of polymer electrolyte membrane fuel cell for high performance. Renew. Energy 2018, 115, 663–675. [Google Scholar] [CrossRef]
- Wan, Z.; Sun, Y.; Yang, C.; Kong, X.; Yan, H.; Chen, X.; Huang, T.; Wang, X. Experimental performance investigation on the arrangement of metal foam as flow distributors in proton exchange membrane fuel cell. Energy Convers. Manag. 2021, 231, 113846. [Google Scholar] [CrossRef]
- Afshari, E.; Ziaei-Rad, M.; Shariati, Z. A study on using metal foam as coolant fluid distributor in the polymer electrolyte membrane fuel cell. Int. J. Hydrogen Energy 2016, 41, 1902–1912. [Google Scholar] [CrossRef]
- Jo, A.; Ahn, S.; Oh, K.; Kim, W.; Ju, H. Effects of metal foam properties on flow and water distribution in polymer electrolyte fuel cells (PEFCs). Int. J. Hydrogen Energy 2018, 43, 14034–14046. [Google Scholar] [CrossRef]
- Chen, C.; Xia, Q.; Feng, S.; Liu, Q. A novel solar hydrogen production system integrating high temperature electrolysis with ammonia based thermochemical energy storage. Energy Convers. Manag. 2021, 237, 114143. [Google Scholar] [CrossRef]
- Sigurvinsson, J.; Mansilla, C.; Lovera, P.; Werkoff, F. Can high temperature steam electrolysis function with geothermal heat? Int. J. Hydrogen Energy 2007, 32, 1174–1182. [Google Scholar] [CrossRef]
- Harvego, E.A.; McKellar, M.G.; Sohal, M.S.; O’Brien, J.E.; Herring, J.S. Economic Analysis of a Nuclear Reactor Powered High-Temperature Electrolysis Hydrogen Production Plant. Energy Sustain. 2009, 43192, 549–558. [Google Scholar] [CrossRef] [Green Version]
- Motazedi, K.; Salkuyeh, Y.K.; Laurenzi, I.J.; MacLean, H.L.; Bergerson, J.A. Economic and environmental competitiveness of high temperature electrolysis for hydrogen production. Int. J. Hydrogen Energy 2021, 46, 21274–21288. [Google Scholar] [CrossRef]
- Chinda, P. The Performance Improvement of a Thick Electrode Solid Oxide Fuel Cell. Energy Procedia 2013, 34, 243–261. [Google Scholar] [CrossRef] [Green Version]
- Shi, Y.; Luo, Y.; Cai, N.; Qian, J.; Wang, S.; Li, W.; Wang, H. Experimental characterization and modeling of the electrochemical reduction of CO2 in solid oxide electrolysis cells. Electrochim. Acta 2013, 88, 644–653. [Google Scholar] [CrossRef]
- Luo, Y.; Shi, Y.; Li, W.; Cai, N. Comprehensive modeling of tubular solid oxide electrolysis cell for co-electrolysis of steam and carbon dioxide. Energy 2014, 70, 420–434. [Google Scholar] [CrossRef]
- Nam, J.H.; Jeon, D.H. A comprehensive micro-scale model for transport and reaction in intermediate temperature solid oxide fuel cells. Electrochim. Acta 2006, 51, 3446–3460. [Google Scholar] [CrossRef]
- Liu, S.; Kong, W.; Lin, Z. Three-dimensional modeling of planar solid oxide fuel cells and the rib design optimization. J. Power Sources 2009, 194, 854–863. [Google Scholar] [CrossRef]
- Costamagna, P.; Costa, P.; Antonucci, V. Micro-modelling of solid oxide fuel cell electrodes. Electrochim. Acta 1998, 43, 375–394. [Google Scholar] [CrossRef]
- Chan, S.H.; Xia, Z.T. Anode Micro Model of Solid Oxide Fuel Cell. J. Electrochem. Soc. 2001, 148, A388–A394. [Google Scholar] [CrossRef]
- Dickinson, E.J.; Wain, A.J. The Butler-Volmer equation in electrochemical theory: Origins, value, and practical application. J. Electroanal. Chem. 2020, 872, 114145. [Google Scholar] [CrossRef]
- Ni, M.; Leung, M.K.; Leung, D.Y. A modeling study on concentration overpotentials of a reversible solid oxide fuel cell. J. Power Sources 2006, 163, 460–466. [Google Scholar] [CrossRef]
- Du, Y.; Qin, Y.; Zhang, G.; Yin, Y.; Jiao, K.; Du, Q. Modelling of effect of pressure on co-electrolysis of water and carbon dioxide in solid oxide electrolysis cell. Int. J. Hydrogen Energy 2019, 44, 3456–3469. [Google Scholar] [CrossRef]
- Momma, A.; Kato, T.; Kaga, Y.; Nagata, S. Polarization Behavior of High Temperature Solid Oxide Electrolysis Cells (SOEC). J. Ceram. Soc. Jpn. 1997, 105, 369–373. [Google Scholar] [CrossRef] [Green Version]
- Ni, M.; Leung, M.; Leung, D.Y. Parametric study of solid oxide steam electrolyzer for hydrogen production. Int. J. Hydrogen Energy 2007, 32, 2305–2313. [Google Scholar] [CrossRef]
- Hussain, M.; Li, X.; Dincer, I. A general electrolyte–electrode-assembly model for the performance characteristics of planar anode-supported solid oxide fuel cells. J. Power Sources 2009, 189, 916–928. [Google Scholar] [CrossRef]
- Ni, M.; Leung, M.K.; Leung, D.Y. Mathematical modeling of the coupled transport and electrochemical reactions in solid oxide steam electrolyzer for hydrogen production. Electrochim. Acta 2007, 52, 6707–6718. [Google Scholar] [CrossRef]
- Gholaminezhad, I.; Paydar, M.H.; Jafarpur, K.; Paydar, S. Multi-scale mathematical modeling of methane-fueled SOFCs: Predicting limiting current density using a modified Fick’s model. Energy Convers. Manag. 2017, 148, 222–237. [Google Scholar] [CrossRef]
- Andersson, M.; Yuan, J.; Sundén, B. SOFC modeling considering hydrogen and carbon monoxide as electrochemical reactants. J. Power Sources 2013, 232, 42–54. [Google Scholar] [CrossRef] [Green Version]
- Zhan, R.; Wang, Y.; Ni, M.; Zhang, G.; Du, Q.; Jiao, K. Three-dimensional simulation of solid oxide fuel cell with metal foam as cathode flow distributor. Int. J. Hydrogen Energy 2020, 45, 6897–6911. [Google Scholar] [CrossRef]
- Tseng, C.-J.; Tsai, B.T.; Liu, Z.-S.; Cheng, T.-C.; Chang, W.-C.; Lo, S.-K. A PEM fuel cell with metal foam as flow distributor. Energy Convers. Manag. 2012, 62, 14–21. [Google Scholar] [CrossRef]
- Kumar, A.; Reddy, R. Modeling of polymer electrolyte membrane fuel cell with metal foam in the flow-field of the bipolar/end plates. J. Power Sources 2003, 114, 54–62. [Google Scholar] [CrossRef]
Publisher’s Note: MDPI stays neutral with regard to jurisdictional claims in published maps and institutional affiliations. |
© 2022 by the authors. Licensee MDPI, Basel, Switzerland. This article is an open access article distributed under the terms and conditions of the Creative Commons Attribution (CC BY) license (https://creativecommons.org/licenses/by/4.0/).